• FluTrackers.com Inc. does not provide medical advice. Information on this web site is collected from various internet resources, and the FluTrackers board of directors makes no warranty to the safety, efficacy, correctness or completeness of the information posted on this site by any author or poster. The information collated here is for instructional and/or discussion purposes only and is NOT intended to diagnose or treat any disease, illness, or other medical condition. Every individual reader or poster should seek advice from their personal physician/healthcare practitioner before considering or using any interventions that are discussed on this website. By continuing to access this website you agree to consult your personal physican before using any interventions posted on this website, and you agree to hold harmless FluTrackers.com Inc., the board of directors, the members, and all authors and posters for any effects from use of any medication, supplement, vitamin or other substance, device, intervention, etc. mentioned in posts on this website, or other internet venues referenced in posts on this website.
  • We are not asking for any donations. Do not donate to any entity who says they are raising funds for us.

Seasonal Flu 2008 - 2009

Re: Seasonal Flu 2008 - 2009

United Kingdom: Flu outbreak is worst for eight years - The Guardian
Flu outbreak is worst for eight years

* Sarah Boseley, health editor
* The Guardian, Wednesday 24 December 2008

Britain is in the grip of a flu outbreak greater than anything seen in the last eight years, with soaring numbers of people falling ill, new figures show.


The last big flu outbreak occurred in 1999/2000, when 22,000 people died, which is 10 times the average for a winter flu season.

The latest figures from the Royal College of GPs show 69 cases of flu in 100,000 population for this week. In the last two weeks, the rate has climbed steeply, from 28 in 100,000 two weeks ago, to 40 last week and now 69.

The rise is across all regions of the UK and all age groups, but it appears to be the young and middle-aged adults who are hit hardest. The rate has soared to 80 in 100,000 in the 15 to 44 age group and to 76 among 45 to 64-year-olds. These tend to be more socially active people - teenagers, young adults and workers who refuse to stay home when they feel ill.

The worsening outbreak will cause problems for the health service over the Christmas break, especially combined with the spread of the vomiting bug norovirus. These highly transmittable diseases are hitting hard at a time when GP practices will be closed and hospital staff reduced because of the holiday.

"If you have norovirus on the ward, you have to close it down and clean it," said Professor Steve Field, a Birmingham GP who is chairman of the Royal College of GPs. "And at the same time you are getting more frail and elderly people getting bronchitis and pneumonia."

Even last week, flu was having an impact on the functioning of the NHS. David Nicholson, the NHS chief executive, said across England the number of 999 calls was 7% higher than last year and admissions to hospital through A&E departments were 4% up, because of more cases of flu and breathing problems. London, the West Midlands and south-west were under the most pressure, he said.

Older people are being hit less hard by flu at the moment because of the good take-up rate of the vaccine among the over-65s. The rate is now 45 in 100,000 in that age group. However, there are concerns about many others under the age of 65 who are considered to be at risk of the complications of flu, which can be serious and in some cases life-threatening.

Campaigns from the Department of Health have been urging those at risk of complications to have a flu vaccination for several months. But while 72% of the over-65s have had the jab, only 42% of younger people considered to be at risk have come forward.

Around 4 million people under 65 risk becoming seriously ill with the complications of flu, such as bronchitis and pneumonia. They include people whose immune systems are in some way compromised, those with asthma, serious kidney and liver complaints and diabetes.

Professor Field said he was also concerned about those in the older age group who have not been vaccinated. Although the rate was 72% overall, it was patchy, he said. "This is going to be around for a while, so it is well worth getting vaccinated."

This year, the strain of flu that is doing the damage - H3N2, or Brisbane flu after the city where it was first identified - is one of the three included in the vaccination, so anybody who has a jab is well-protected.

The HPA said the figures looked worse because the last three years have been quiet. But an early rise did not necessarily mean a continuing rise in the numbers falling ill.

"It may continue on up and it may go down," said the spokeswoman. Other countries in Europe are not yet seeing a rise in cases.

She stressed that those who get ill should stay at home and not spread the infection around the workplace. "If you are sick, don't even bother. Just stay home and get better or you will just infect the rest of your team," she said.

The steady upward trend in flu cases is matched by the number of people going to see their GP for common colds, which hit 300 in 100,000 last week - up from an average of 200 a week earlier in the month.

Professor Field said the current outbreak was still well short of an epidemic. The outbreak in 1999/2000 hit a peak of 220 cases per 100,000 and was classified officially as an epidemic by the Department of Health.

The current trend is a very steep and sudden rise in cases, but it is always possible that it will peak early and start to go back down.

"You can't assume anything," he said. "Some of them do go down." He would expect a drop in cases in the next week or so anyway because fewer GPs are working and recording case numbers.
-
<CITE cite=http://www.guardian.co.uk/society/2008/dec/24/health-flu-outbreak>Flu outbreak is worst for eight years | Society | The Guardian</CITE>

<TABLE cellSpacing=0 cellPadding=0 width="100%" border=0><TBODY><TR><TD class=content vAlign=top>514.</TD><TD class=content vAlign=top width=161>United Kingdom of Great Britain and Northern Ireland</TD><TD class=content vAlign=top>A (H1)</TD><TD class=content vAlign=top align=middle>47</TD><TD class=content vAlign=top align=middle>2008</TD><TD class=content vAlign=top align=middle>2</TD><TD class=content vAlign=top align=middle>view</TD></TR><TR><TD class=content vAlign=top>515.</TD><TD class=content vAlign=top width=161>United Kingdom of Great Britain and Northern Ireland</TD><TD class=content vAlign=top>A (H1)</TD><TD class=content vAlign=top align=middle>48</TD><TD class=content vAlign=top align=middle>2008</TD><TD class=content vAlign=top align=middle>4</TD><TD class=content vAlign=top align=middle>view</TD></TR><TR><TD class=content vAlign=top>516.</TD><TD class=content vAlign=top width=161>United Kingdom of Great Britain and Northern Ireland</TD><TD class=content vAlign=top>A (H1)</TD><TD class=content vAlign=top align=middle>49</TD><TD class=content vAlign=top align=middle>2008</TD><TD class=content vAlign=top align=middle>8</TD><TD class=content vAlign=top align=middle>view</TD></TR><TR><TD class=content vAlign=top>517.</TD><TD class=content vAlign=top width=161>United Kingdom of Great Britain and Northern Ireland</TD><TD class=content vAlign=top>A (H1)</TD><TD class=content vAlign=top align=middle>50</TD><TD class=content vAlign=top align=middle>2008</TD><TD class=content vAlign=top align=middle>5</TD><TD class=content vAlign=top align=middle>view</TD></TR><TR><TD class=content vAlign=top>518.</TD><TD class=content vAlign=top width=161>United Kingdom of Great Britain and Northern Ireland</TD><TD class=content vAlign=top>A (H1)</TD><TD class=content vAlign=top align=middle>51</TD><TD class=content vAlign=top align=middle>2008</TD><TD class=content vAlign=top align=middle>3</TD><TD class=content vAlign=top align=middle>view</TD></TR><TR><TD class=content vAlign=top>519.</TD><TD class=content vAlign=top width=161>United Kingdom of Great Britain and Northern Ireland</TD><TD class=content vAlign=top>A (H3)</TD><TD class=content vAlign=top align=middle>47</TD><TD class=content vAlign=top align=middle>2008</TD><TD class=content vAlign=top align=middle>21</TD><TD class=content vAlign=top align=middle>view</TD></TR><TR><TD class=content vAlign=top>520.</TD><TD class=content vAlign=top width=161>United Kingdom of Great Britain and Northern Ireland</TD><TD class=content vAlign=top>A (H3)</TD><TD class=content vAlign=top align=middle>48</TD><TD class=content vAlign=top align=middle>2008</TD><TD class=content vAlign=top align=middle>75</TD><TD class=content vAlign=top align=middle>view</TD></TR><TR><TD class=content vAlign=top>521.</TD><TD class=content vAlign=top width=161>United Kingdom of Great Britain and Northern Ireland</TD><TD class=content vAlign=top>A (H3)</TD><TD class=content vAlign=top align=middle>49</TD><TD class=content vAlign=top align=middle>2008</TD><TD class=content vAlign=top align=middle>98</TD><TD class=content vAlign=top align=middle>view</TD></TR><TR><TD class=content vAlign=top>522.</TD><TD class=content vAlign=top width=161>United Kingdom of Great Britain and Northern Ireland</TD><TD class=content vAlign=top>A (H3)</TD><TD class=content vAlign=top align=middle>50</TD><TD class=content vAlign=top align=middle>2008</TD><TD class=content vAlign=top align=middle>104</TD><TD class=content vAlign=top align=middle>view</TD></TR><TR><TD class=content vAlign=top>523.</TD><TD class=content vAlign=top width=161>United Kingdom of Great Britain and Northern Ireland</TD><TD class=content vAlign=top>A (H3)</TD><TD class=content vAlign=top align=middle>51</TD><TD class=content vAlign=top align=middle>2008</TD><TD class=content vAlign=top align=middle>145</TD><TD class=content vAlign=top align=middle>view</TD></TR><TR><TD class=content vAlign=top>524.</TD><TD class=content vAlign=top width=161>United Kingdom of Great Britain and Northern Ireland</TD><TD class=content vAlign=top>A (not suptyped)</TD><TD class=content vAlign=top align=middle>47</TD><TD class=content vAlign=top align=middle>2008</TD><TD class=content vAlign=top align=middle>0</TD><TD class=content vAlign=top align=middle>view</TD></TR><TR><TD class=content vAlign=top>525.</TD><TD class=content vAlign=top width=161>United Kingdom of Great Britain and Northern Ireland</TD><TD class=content vAlign=top>A (not suptyped)</TD><TD class=content vAlign=top align=middle>48</TD><TD class=content vAlign=top align=middle>2008</TD><TD class=content vAlign=top align=middle>0</TD><TD class=content vAlign=top align=middle>view</TD></TR><TR><TD class=content vAlign=top>526.</TD><TD class=content vAlign=top width=161>United Kingdom of Great Britain and Northern Ireland</TD><TD class=content vAlign=top>A (not suptyped)</TD><TD class=content vAlign=top align=middle>49</TD><TD class=content vAlign=top align=middle>2008</TD><TD class=content vAlign=top align=middle>0</TD><TD class=content vAlign=top align=middle>view</TD></TR><TR><TD class=content vAlign=top>527.</TD><TD class=content vAlign=top width=161>United Kingdom of Great Britain and Northern Ireland</TD><TD class=content vAlign=top>A (not suptyped)</TD><TD class=content vAlign=top align=middle>50</TD><TD class=content vAlign=top align=middle>2008</TD><TD class=content vAlign=top align=middle>0</TD><TD class=content vAlign=top align=middle>view</TD></TR><TR><TD class=content vAlign=top>528.</TD><TD class=content vAlign=top width=161>United Kingdom of Great Britain and Northern Ireland</TD><TD class=content vAlign=top>A (not suptyped)</TD><TD class=content vAlign=top align=middle>51</TD><TD class=content vAlign=top align=middle>2008</TD><TD class=content vAlign=top align=middle>0</TD><TD class=content vAlign=top align=middle>view</TD></TR></TBODY></TABLE>
 
Re: Seasonal Flu 2008 - 2009

<TABLE border=1><CAPTION>INFLUENZA VIRUSES ISOLATED BY
WHO/NREVSS Collaborating Laboratories
2008 - 2009 Season
</CAPTION><TBODY><TR><TH id=header1 width=70>Week</TH><TH id=header2 width=90>A(H1)</TH><TH id=header3 width=70>A(H3)</TH><TH id=header4 width=70>A(Unk)</TH><TH id=header5 width=70>B </TH><TH id=header6 align=right>Total # Tested</TH><TH id=header7 align=right>% Positive</TH></TR><TR><TD align=right headers=header1>40 </TD><TD align=right headers=header2>2 </TD><TD align=right headers=header3>0 </TD><TD align=right headers=header4>9 </TD><TD align=right headers=header5>6 </TD><TD align=right headers=header6>2557 </TD><TD align=right headers=header7>0.66 </TD></TR><TR><TD align=right headers=header1>41 </TD><TD align=right headers=header2>4 </TD><TD align=right headers=header3>4 </TD><TD align=right headers=header4>6 </TD><TD align=right headers=header5>6 </TD><TD align=right headers=header6>2585 </TD><TD align=right headers=header7>0.77 </TD></TR><TR><TD align=right headers=header1>42 </TD><TD align=right headers=header2>13 </TD><TD align=right headers=header3>3 </TD><TD align=right headers=header4>15 </TD><TD align=right headers=header5>6 </TD><TD align=right headers=header6>2713 </TD><TD align=right headers=header7>1.36 </TD></TR><TR><TD align=right headers=header1>43 </TD><TD align=right headers=header2>22 </TD><TD align=right headers=header3>0 </TD><TD align=right headers=header4>24 </TD><TD align=right headers=header5>14 </TD><TD align=right headers=header6>3092 </TD><TD align=right headers=header7>1.94 </TD></TR><TR><TD align=right headers=header1>44 </TD><TD align=right headers=header2>11 </TD><TD align=right headers=header3>1 </TD><TD align=right headers=header4>21 </TD><TD align=right headers=header5>4 </TD><TD align=right headers=header6>3267 </TD><TD align=right headers=header7>1.13 </TD></TR><TR><TD align=right headers=header1>45 </TD><TD align=right headers=header2>28 </TD><TD align=right headers=header3>3 </TD><TD align=right headers=header4>23 </TD><TD align=right headers=header5>10 </TD><TD align=right headers=header6>3860 </TD><TD align=right headers=header7>1.66 </TD></TR><TR><TD align=right headers=header1>46 </TD><TD align=right headers=header2>27 </TD><TD align=right headers=header3>2 </TD><TD align=right headers=header4>18 </TD><TD align=right headers=header5>10 </TD><TD align=right headers=header6>3723 </TD><TD align=right headers=header7>1.53 </TD></TR><TR><TD align=right headers=header1>47 </TD><TD align=right headers=header2>24 </TD><TD align=right headers=header3>0 </TD><TD align=right headers=header4>36 </TD><TD align=right headers=header5>22 </TD><TD align=right headers=header6>4017 </TD><TD align=right headers=header7>2.04 </TD></TR><TR><TD align=right headers=header1>48 </TD><TD align=right headers=header2>37 </TD><TD align=right headers=header3>2 </TD><TD align=right headers=header4>45 </TD><TD align=right headers=header5>20 </TD><TD align=right headers=header6>4037 </TD><TD align=right headers=header7>2.58 </TD></TR><TR><TD align=right headers=header1>49 </TD><TD align=right headers=header2>33 </TD><TD align=right headers=header3>3 </TD><TD align=right headers=header4>58 </TD><TD align=right headers=header5>13 </TD><TD align=right headers=header6>4419 </TD><TD align=right headers=header7>2.42 </TD></TR><TR><TD align=right headers=header1>50 </TD><TD align=right headers=header2>55 </TD><TD align=right headers=header3>4 </TD><TD align=right headers=header4>67 </TD><TD align=right headers=header5>32 </TD><TD align=right headers=header6>4489 </TD><TD align=right headers=header7>3.52 </TD></TR><TR><TD align=right headers=header1>51 </TD><TD align=right headers=header2>22 </TD><TD align=right headers=header3>3 </TD><TD align=right headers=header4>55 </TD><TD align=right headers=header5>23 </TD><TD align=right headers=header6>3035 </TD><TD align=right headers=header7>3.39 </TD></TR></TBODY></TABLE>
[FONT=Verdana, Arial, Helvetica, sans-serif][SIZE=-1]Return to Current Report[/SIZE][/FONT]
<!-- #################################### --><!-- BEGIN SiteCatalyst/Omniture code here--><!-- Version: 1.2 - Date Created: 08/04/2004--><SCRIPT language=JavaScript type=text/javascript><!--var s_pageName=document.titlevar s_channel="CDC Flu"var s_prop1= s_pageName + " ^ " + s_channelvar s_code=' '//--></SCRIPT><SCRIPT language=JavaScript src="/JScript/s_code.js" type=text/javascript></SCRIPT><SCRIPT language=JavaScript type=text/javascript><!--var s_wd=window,s_tm=new Date;if(s_code!=' '){s_code=s_dc('cdcgov');if(s_code)document.write(s_code)}elsedocument.write('<im'+'g src="http://mtrics.cdc.gov/b/ss/cdcgov/1/G.5--FB/s'+s_tm.getTime()+'?[AQB]'+'&j=1.0&[AQE]" height="1" width="1" border="0" alt="" />')//--></SCRIPT>
 
Re: Seasonal Flu 2008 - 2009

2008-2009 Influenza Season Week 51 ending December 20, 2008
(All data are preliminary and may change as more reports are received.)
Synopsis:

During week 51 (December 14-20, 2008), a low level of influenza activity was reported in the United States.
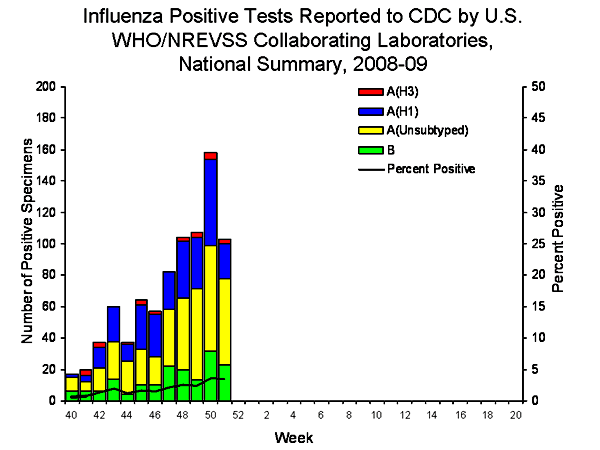
  • One hundred three (3.4%) specimens tested by U.S. World Health Organization (WHO) and National Respiratory and Enteric Virus Surveillance System (NREVSS) collaborating laboratories and reported to CDC/Influenza Division were positive for influenza.
  • The proportion of deaths attributed to pneumonia and influenza (P&I) was below the epidemic threshold.
  • The proportion of outpatient visits for influenza-like illness (ILI) was below national and region-specific baseline levels.
  • Two states reported regional activity; six states reported local influenza activity; Puerto Rico and 36 states reported sporadic influenza activity; five states reported no influenza activity; and the District of Columbia and one state did not report.
<TABLE class=table cellSpacing=0 cellPadding=3 align=center border=0><CAPTION>National and Regional Summary of Select Surveillance Components

</CAPTION><TBODY><TR vAlign=top><TH vAlign=bottom width=85 rowSpan=2>
Region​
</TH><TH noWrap align=middle width=300 colSpan=3>Data for current week</STRONG></TH><TH noWrap align=middle width=276 colSpan=5>Data cumulative for the season</TH></TR><TR vAlign=top><TH align=middle width=72>Out-patient ILI*</TH><TH align=middle width=72>% positive for flu?</TH><TH align=middle width=96>Number of jurisdictions reporting regional or widespread activity?</TH><TH noWrap align=middle width=48>A (H1)</TH><TH noWrap align=middle width=48>A (H3)</TH><TH align=middle width=60>A Unsub-typed</TH><TH noWrap align=middle width=48>B</TH><TH align=middle width=72>Pediatric Deaths</TH></TR><TR><TD align=left width=85>Nation</TD><TD noWrap align=middle width=72>Normal</TD><TD noWrap align=middle width=72>3.4 % </TD><TD noWrap align=middle width=96>2 of 51 </TD><TD noWrap align=middle width=48>278</TD><TD noWrap align=middle width=48>25</TD><TD noWrap align=middle width=60>377</TD><TD noWrap align=middle width=48>166</TD><TD noWrap align=middle width=72>0</TD></TR><TR><TD align=left width=85>New England</TD><TD noWrap align=middle width=72>Normal</TD><TD noWrap align=middle width=72>0.3 % </TD><TD noWrap align=middle width=96>1 of 6</TD><TD noWrap align=middle width=48>0</TD><TD noWrap align=middle width=48>1</TD><TD noWrap align=middle width=60>9</TD><TD noWrap align=middle width=48>1</TD><TD noWrap align=middle width=72>0</TD></TR><TR><TD align=left width=85>Mid-Atlantic</TD><TD noWrap align=middle width=72>Normal</TD><TD noWrap align=middle width=72>1.7 % </TD><TD noWrap align=middle width=96>1 of 3</TD><TD noWrap align=middle width=48>15</TD><TD noWrap align=middle width=48>3</TD><TD noWrap align=middle width=60>11</TD><TD noWrap align=middle width=48>5</TD><TD noWrap align=middle width=72>0</TD></TR><TR><TD align=left width=85>East North Central</TD><TD noWrap align=middle width=72>Normal</TD><TD noWrap align=middle width=72>5.7 % </TD><TD noWrap align=middle width=96>0 of 5</TD><TD noWrap align=middle width=48>12</TD><TD noWrap align=middle width=48>2</TD><TD noWrap align=middle width=60>5</TD><TD noWrap align=middle width=48>6</TD><TD noWrap align=middle width=72>0</TD></TR><TR><TD align=left width=85>West North Central</TD><TD noWrap align=middle width=72>Normal</TD><TD noWrap align=middle width=72>0.6 % </TD><TD noWrap align=middle width=96>0 of 7</TD><TD noWrap align=middle width=48>6</TD><TD noWrap align=middle width=48>0</TD><TD noWrap align=middle width=60>13</TD><TD noWrap align=middle width=48>7</TD><TD noWrap align=middle width=72>0</TD></TR><TR><TD align=left width=85>South Atlantic</TD><TD noWrap align=middle width=72>Normal</TD><TD noWrap align=middle width=72>3.0 % </TD><TD noWrap align=middle width=96>0 of 9</TD><TD noWrap align=middle width=48>16</TD><TD noWrap align=middle width=48>0</TD><TD noWrap align=middle width=60>91</TD><TD noWrap align=middle width=48>62</TD><TD noWrap align=middle width=72>0</TD></TR><TR><TD align=left width=85>East South Central</TD><TD noWrap align=middle width=72>Normal</TD><TD noWrap align=middle width=72>1.0 % </TD><TD noWrap align=middle width=96>0 of 4</TD><TD noWrap align=middle width=48>1</TD><TD noWrap align=middle width=48>0</TD><TD noWrap align=middle width=60>0</TD><TD noWrap align=middle width=48>2</TD><TD noWrap align=middle width=72>0</TD></TR><TR><TD align=left width=85>West South Central</TD><TD noWrap align=middle width=72>Normal</TD><TD noWrap align=middle width=72>5.8 % </TD><TD noWrap align=middle width=96>0 of 4</TD><TD noWrap align=middle width=48>49</TD><TD noWrap align=middle width=48>0</TD><TD noWrap align=middle width=60>145</TD><TD noWrap align=middle width=48>61</TD><TD noWrap align=middle width=72>0</TD></TR><TR><TD align=left width=85>Mountain</TD><TD noWrap align=middle width=72>Normal</TD><TD noWrap align=middle width=72>3.0 % </TD><TD noWrap align=middle width=96>0 of 8</TD><TD noWrap align=middle width=48>8</TD><TD noWrap align=middle width=48>13</TD><TD noWrap align=middle width=60>27</TD><TD noWrap align=middle width=48>6</TD><TD noWrap align=middle width=72>0</TD></TR><TR><TD align=left width=85>Pacific</TD><TD noWrap align=middle width=72>Normal</TD><TD noWrap align=middle width=72>4.6 % </TD><TD noWrap align=middle width=96>0 of 5</TD><TD noWrap align=middle width=48>171</TD><TD noWrap align=middle width=48>6</TD><TD noWrap align=middle width=60>76</TD><TD noWrap align=middle width=48>16</TD><TD noWrap align=middle width=72>0</TD></TR></TBODY></TABLE>
* Elevated means the % of visits for ILI is at or above the national or region-specific baseline
? National data is for current week; regional data is for the most recent three weeks.
? Includes all 50 states and the District of Columbia
U.S. Virologic Surveillance:

WHO and NREVSS collaborating laboratories located in all 50 states and Washington D.C. report to CDC the number of respiratory specimens tested for influenza each week. Results of these tests performed during the current week and cumulative totals for the season are summarized in the table below.
<TABLE class=table cellSpacing=0 cellPadding=3 align=center border=0><TBODY><TR><TH align=left width=200></TH><TH noWrap align=middle width=140>Week 51</TH><TH noWrap align=middle width=140>Cumulative for the Season</TH></TR><TR><TD align=left width=200>No. of specimens tested</TD><TD noWrap align=middle width=140>3035</TD><TD noWrap align=middle width=140>41794</TD></TR><TR><TD align=left width=200>No. of positive specimens (%)</TD><TD noWrap align=middle width=140>103 (3.4%)</TD><TD noWrap align=middle width=140>846 (2.0%)</TD></TR><TR><TD align=left colSpan=3>Positive specimens by type/subtype</TD></TR><TR><TD align=left width=170> Influenza A</TD><TD noWrap align=middle width=140>80 (77.7%)</TD><TD noWrap align=middle width=140>680 (80.4%)</TD></TR><TR><TD align=left width=170> A (H1)</TD><TD noWrap align=middle width=140>22 (27.5%)</TD><TD noWrap align=middle width=140>278 (40.9%)</TD></TR><TR><TD align=left width=170> A (H3)</TD><TD noWrap align=middle width=140>3 (3.8%)</TD><TD noWrap align=middle width=140>25 (3.7%)</TD></TR><TR><TD align=left width=170> A (unsubtyped)</TD><TD noWrap align=middle width=140>55 (68.8%)</TD><TD noWrap align=middle width=140>377 (55.4%)</TD></TR><TR><TD align=left width=170> Influenza B</TD><TD noWrap align=middle width=140>23 (22.3%)</TD><TD noWrap align=middle width=140>166 (19.6%)</TD></TR></TBODY></TABLE>
Thirty-nine states from all nine surveillance regions have reported laboratory-confirmed influenza this season with three states accounting for 635 (75.1%) of the 846 reported influenza viruses.
<CENTER>
image511.gif

View WHO-NREVSS Regional Bar Charts| View Chart Data | View Full Screen </CENTER>Antigenic Characterization:

CDC has antigenically characterized 85 influenza viruses [49 influenza A (H1), seven influenza A (H3) and 29 influenza B viruses] collected by U.S. laboratories since October 1, 2008.
All 49 influenza A (H1) viruses are related to the influenza A (H1N1) component of the 2008-09 influenza vaccine (A/Brisbane/59/2007). All seven influenza A (H3) viruses are related to the influenza A (H3N2) vaccine component (A/Brisbane/10/2007).
Influenza B viruses currently circulating can be divided into two distinct lineages represented by the B/Yamagata/16/88 and B/Victoria/02/87 viruses. Nine influenza B viruses tested belong to the B/Yamagata lineage and are related to the vaccine strain (B/Florida/04/2006). The remaining 20 viruses belong to the B/Victoria lineage and are not related to the vaccine strain. Seventeen of the 20 viruses belonging to the B/Victoria lineage were from two states.
Data on antigenic characterization should be interpreted with caution given that:
  1. Few U.S. isolates are available for testing because of limited influenza activity thus far.
  2. The majority of viruses antigenically characterized to date come from only two states and may not be nationally representative.
  3. Antigenic characterization data is based on hemagglutination inhibition (HI) testing using a panel of reference ferret antisera and results may not correlate with clinical protection against circulating viruses provided by influenza vaccination.
Annual influenza vaccination is expected to provide the best protection against those virus strains that are related to the vaccine strains, but limited to no protection may be expected when the vaccine and circulating virus strains are so different as to be from different lineages, as is seen with the two lineages of influenza B viruses.
Antiviral Resistance:

Since October 1, 2008, 65 influenza A (H1N1), 10 influenza A (H3N2), and 29 influenza B viruses from 18 states have been tested for resistance to the neuraminidase inhibitors (oseltamivir and zanamivir); however, 62% of the viruses tested were from only two states. Fifty influenza A (H1N1) and eight influenza A (H3N2) viruses from 14 states have been tested for resistance to the adamantanes (amantadine and rimantadine); however, 60% of the viruses tested were from only two states. The results of antiviral resistance testing performed on these viruses are summarized in the table below.
<TABLE class=table cellSpacing=0 cellPadding=3 align=center border=0><TBODY><TR><TH align=left width=160></TH><TH noWrap align=middle width=100>Isolates tested (n)</TH><TH noWrap align=middle width=200 colSpan=2>Resistant Viruses,
Number (%)
</TH><TH noWrap align=middle width=100>Isolates tested (n)</TH><TH noWrap align=middle width=120>Resistant Viruses, Number (%)</TH></TR><TR><TH align=left width=160></TH><TH noWrap align=middle width=100></TH><TH noWrap align=middle width=100>Oseltamivir</TH><TH noWrap align=middle width=100>Zanamivir</TH><TH noWrap align=middle width=100></TH><TH noWrap align=middle width=120>Adamantanes</TH></TR><TR><TD noWrap align=left width=160>Influenza A (H1N1)</TD><TD noWrap align=middle width=100>65</TD><TD noWrap align=middle width=100>64 (99%)</TD><TD noWrap align=middle width=100>0 (0)</TD><TD noWrap align=middle width=100>50</TD><TD noWrap align=middle width=120>0 (0%)</TD></TR><TR><TD noWrap align=left width=160>Influenza A (H3N2)</TD><TD noWrap align=middle width=100>10</TD><TD noWrap align=middle width=100>0 (0)</TD><TD noWrap align=middle width=100>0 (0)</TD><TD noWrap align=middle width=100>8</TD><TD noWrap align=middle width=120>8 (100%)</TD></TR><TR><TD noWrap align=left width=160>Influenza B</TD><TD noWrap align=middle width=100>29</TD><TD noWrap align=middle width=100>0 (0)</TD><TD noWrap align=middle width=100>0 (0)</TD><TD noWrap align=middle width=100>N/A*</TD><TD noWrap align=middle width=120>N/A*</TD></TR></TBODY></TABLE><SUP>*The adamantanes (amantadine and rimantadine) are not effective against influenza B viruses.</SUP>


With low levels of influenza activity thus far in the 2008-09 season in the United States, overall numbers of virus specimens and the number of states that have submitted specimens for testing is limited. The limited number and geographic diversity of specimens tested for antiviral resistance, as well as the uncertainty regarding which influenza virus types or subtypes will predominate during the season, make it too early to make an accurate determination of the prevalence of influenza viruses resistant to oseltamivir nationally or regionally at this time. CDC has solicited a representative sample of viruses from WHO collaborating laboratories in the United States, and more specimens are expected as influenza activity increases.
Pneumonia and Influenza (P&I) Mortality Surveillance

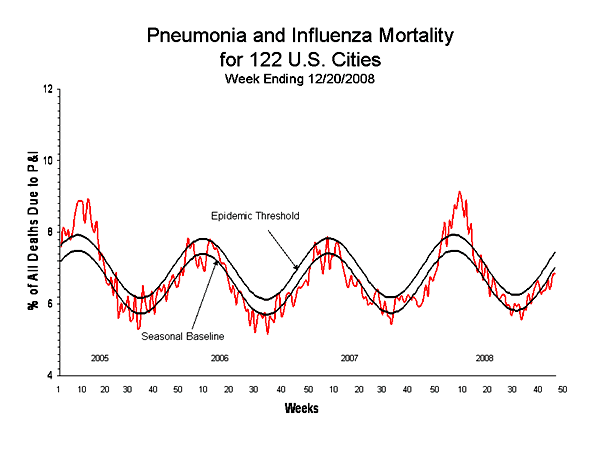
During week 51, 6.9% of all deaths reported through the 122-Cities Mortality Reporting System were due to P&I. This percentage is below the epidemic threshold of 7.4% for week 51.
<CENTER>
picurve51.gif

View Full Screen</CENTER>Influenza-Associated Pediatric Mortality

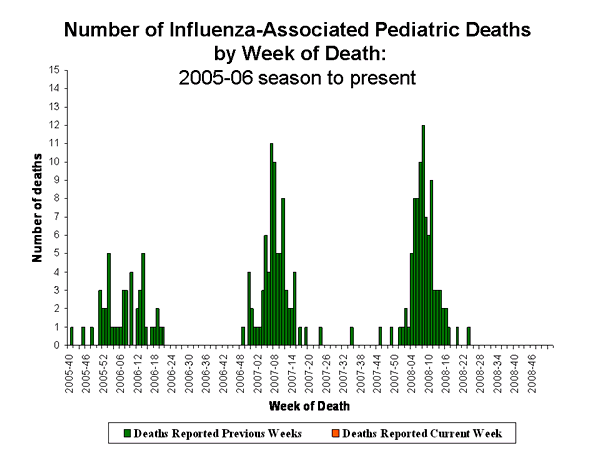
No influenza-associated pediatric deaths were reported during week 51. The pediatric death that was reported during week 50 was later reclassified by the state to not be due to influenza. No influenza-associated pediatric deaths have been reported during the 2008-09 season.
<CENTER>
IPD51_small.gif

View Full Screen</CENTER>Influenza-Associated Hospitalizations

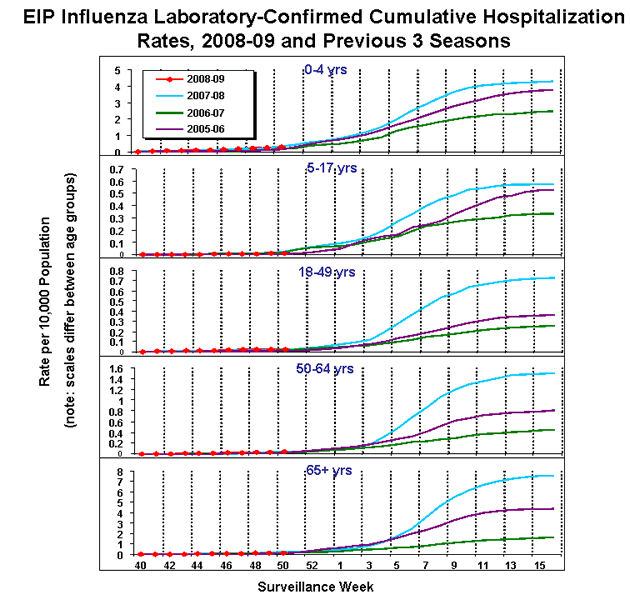
Laboratory-confirmed influenza-associated hospitalizations are monitored in two population-based surveillance networks: the Emerging Infections Program (EIP) and the New Vaccine Surveillance Network (NVSN).
No influenza-associated hospitalizations have been reported from the New Vaccine Surveillance Network this season.
During October 1 ? December 20, 2008, preliminary laboratory-confirmed influenza-associated hospitalization rates reported by the EIP for children aged 0-4 years and 5-17 years were 0.3 per 10,000 and 0.01 per 10,000, respectively. For adults aged 18-49 years, 50-64 years, and = 65 years, the rates were 0.03 per 10,000, 0.04 per 10,000, and 0.1 per 10,000, respectively.
<CENTER>
EIP51_small.gif

View Full Screen</CENTER>Outpatient Illness Surveillance:

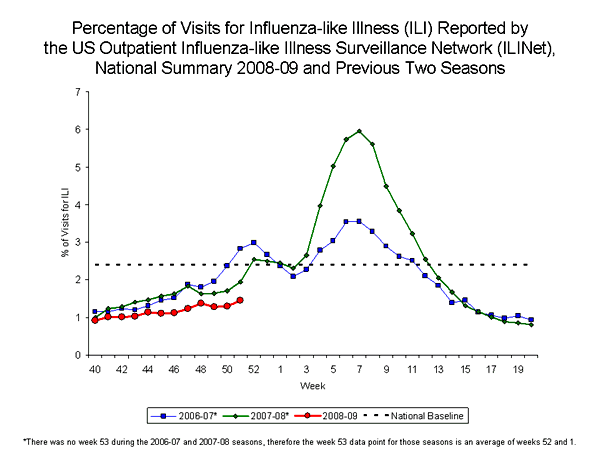
During week 51, 1.5% of patient visits reported through the U.S. Outpatient Influenza-like Illness Surveillance Network (ILINet) were due to influenza-like illness (ILI). This percentage is less than the national baseline of 2.4%. On a regional level, the percentage of visits for ILI ranged from 0.6% to 2.5%. All nine surveillance regions reported percentages of visits for ILI below their respective region-specific baselines.
<CENTER>
image512.gif

View Sentinel Providers Regional Charts | View Chart Data |View Full Screen
</CENTER>Geographic Spread of Influenza as Assessed by State and Territorial Epidemiologists:


During week 51 the following influenza activity was reported:
  • Regional influenza activity was reported by two states (New Jersey and Massachusetts).
  • Local influenza activity was reported by six states (Arizona, Florida, Hawaii, Illinois, Texas, and Virginia).
  • Sporadic activity was reported in the Puerto Rico and 36 states (Alaska, Arkansas, California, Colorado, Connecticut, Georgia, Idaho, Indiana, Iowa, Kansas, Louisiana, Maine, Maryland, Michigan, Minnesota, Mississippi, Missouri, Montana, Nebraska, Nevada, New Hampshire, New York, North Carolina, North Dakota, Oklahoma, Oregon, Pennsylvania, Rhode Island, South Carolina, South Dakota, Tennessee, Vermont, Washington, West Virginia, Wisconsin, and Wyoming).
  • No influenza activity was reported in five states (Alabama, Delaware, Kentucky, Ohio, and Utah)
  • The District of Columbia and one state (New Mexico) did not report.
<OBJECT id=Banner height=420 width="100%" classid=clsid:D27CDB6E-AE6D-11cf-96B8-444553540000>


</OBJECT>
<SCRIPT type=text/javascript> var stamp = new Date() var movieurl = "/flu/weekly/smallmap/SmallFluActivity_v2.swf?c=FluMap&n=" + stamp.getTime(); var so = new SWFObject(movieurl, "Banner", "100%", "420", "7"); so.write("flashALTcontent"); so.addParam("scale", "noorder"); so.addParam("allowScriptAccess","sameDomain"); so.addParam("wmode", "transparent"); so.addParam("quality", "best"); so.addParam("salign", "r"); so.addParam("type", "application/x-shockwave-flash"); </SCRIPT>
--------------------------------------------------------------------------------
A description of surveillance methods is available at: http://www.cdc.gov/flu/weekly/fluactivity.htm
<SCRIPT type=text/javascript> <!-- function popupnr(mylink, windowname, refocus) { var mywin, href; if (typeof(mylink) == 'string') href=mylink; else href=mylink.href; mywin = window.open('', windowname, 'width=450,height=550,scrollbars=yes'); // if opened the window if ( mywin.closed || (! mywin.document.URL) || (mywin.document.URL.indexOf("about") == 0) ) mywin.location=href; else if (refocus) mywin.focus(); return false; } //--> </SCRIPT>
 
Re: Seasonal Flu 2008 - 2009

<TABLE class=table cellSpacing=0 cellPadding=3 align=center border=0><TBODY><TR><TH noWrap align=middle width=100>Isolates tested (n)
</TH><TH noWrap align=middle width=200 colSpan=2>Resistant Viruses,
Number (%)
</TH><TH noWrap align=middle width=100>Isolates tested (n)</TH><TH noWrap align=middle width=120>Resistant Viruses, Number (%)</TH></TR><TR><TH align=left width=160></TH><TH noWrap align=middle width=100></TH><TH noWrap align=middle width=100>Oseltamivir</TH><TH noWrap align=middle width=100>Zanamivir</TH><TH noWrap align=middle width=100></TH><TH noWrap align=middle width=120>Adamantane</TH></TR></TBODY></TABLE>

<TABLE class=table cellSpacing=0 cellPadding=3 align=center border=0><TBODY><TR><TD noWrap align=left width=160>Influenza A (H1N1)</TD><TD noWrap align=middle width=100>65</TD><TD noWrap align=middle width=100>64 (99%)</TD><TD noWrap align=middle width=100>0 (0)</TD><TD noWrap align=middle width=100>50</TD><TD noWrap align=middle width=120>0 (0%)</TD></TR></TBODY></TABLE>
 
Re: Seasonal Flu 2008 - 2009

PA Influenza Weekly Report
[FONT=Verdana, Arial, Helvetica, sans-serif]Week ending December 20, 2008 (Week 51) [/FONT]​
[FONT=Verdana, Arial, Helvetica, sans-serif][/FONT]
<HR id=main style="WIDTH: 526px" SIZE=2>[FONT=Verdana, Arial, Helvetica, sans-serif]
[/FONT]<TABLE cellSpacing=5 cellPadding=5 width=560 align=center bgColor=#ffff80 border=0><TBODY><TR><TD>[FONT=Verdana, Arial, Helvetica, sans-serif]Pennsylvania Influenza Activity Level Reported To CDC For Week 51:[/FONT]</TD><TD>
[FONT=Verdana, Arial, Helvetica, sans-serif]Sporadic[/FONT]​
</TD></TR></TBODY></TABLE>
[FONT=Verdana, Arial, Helvetica, sans-serif]Levels of activity are
1) no activity;
2) sporadic: isolated laboratory-confirmed influenza cases or laboratory-confirmed outbreak in one institution, with no increase in activity;
3) local: increased influenza-like illness (ILI) in one region, or at least two institutional outbreaks (ILI or laboratory-confirmed influenza) in one region; virus activity no greater than sporadic in other regions;
4) regional: increased ILI activity or outbreaks (ILI or laboratory-confirmed influenza) in at least two but fewer than half of the regions in the state; and
5) widespread: increased ILI activity or outbreaks (ILI or laboratory-confirmed influenza) in at least half the regions in the state.[/FONT]
[FONT=Verdana, Arial, Helvetica, sans-serif]

[/FONT][FONT=Verdana, Arial, Helvetica, sans-serif]To see a map of US influenza activity levels for the preceding week (week 50), go to http://www.cdc.gov/flu/weekly/usmap.htm or http://www.google.org/flutrends/[/FONT]

<HR id=main>

Comparison of PA influenza case counts* for current season with case counts for the previous 5 seasons

SASGraph.12.20.jpg


*Patients with positive antigen, nucleic acid, and culture test results reported to Pennsylvania's electronic disease reporting system, PA-NEDSS[FONT=Verdana, Arial, Helvetica, sans-serif][/FONT]

<HR id=main style="WIDTH: 562px" SIZE=2>

[FONT=Verdana, Arial, Helvetica, sans-serif]Number of people per county in PA with positive laboratory tests for influenza,* current season through Week 51
[/FONT][FONT=Verdana, Arial, Helvetica, sans-serif]
[/FONT]

<TABLE class=Table cellSpacing=1 cellPadding=7 rules=none summary="Procedure Freq: One-Way Frequencies" frame=box><THEAD><TR><TH class=" b Header" scope=colgroup colSpan=3>COUNTY</TH></TR><TR><TH class="l b Header" scope=col>RESPJURIS</TH><TH class="r b Header" scope=col>Frequency</TH><TH class="r b Header" scope=col>Percent</TH></TR></THEAD><TBODY><TR><TH class="l RowHeader" scope=row>ALLEGHENY</TH><TD class="r Data">7</TD><TD class="r Data">8.54</TD></TR><TR><TH class="l RowHeader" scope=row>ARMSTRONG</TH><TD class="r Data">1</TD><TD class="r Data">1.22</TD></TR><TR><TH class="l RowHeader" scope=row>BERKS</TH><TD class="r Data">5</TD><TD class="r Data">6.10</TD></TR><TR><TH class="l RowHeader" scope=row>BLAIR</TH><TD class="r Data">3</TD><TD class="r Data">3.66</TD></TR><TR><TH class="l RowHeader" scope=row>BUCKS</TH><TD class="r Data">12</TD><TD class="r Data">14.63</TD></TR><TR><TH class="l RowHeader" scope=row>CAMBRIA</TH><TD class="r Data">1</TD><TD class="r Data">1.22</TD></TR><TR><TH class="l RowHeader" scope=row>CENTRE</TH><TD class="r Data">9</TD><TD class="r Data">10.98</TD></TR><TR><TH class="l RowHeader" scope=row>CHESTER</TH><TD class="r Data">2</TD><TD class="r Data">2.44</TD></TR><TR><TH class="l RowHeader" scope=row>CUMBERLAND</TH><TD class="r Data">1</TD><TD class="r Data">1.22</TD></TR><TR><TH class="l RowHeader" scope=row>DELAWARE</TH><TD class="r Data">1</TD><TD class="r Data">1.22</TD></TR><TR><TH class="l RowHeader" scope=row>ELK</TH><TD class="r Data">1</TD><TD class="r Data">1.22</TD></TR><TR><TH class="l RowHeader" scope=row>ERIE</TH><TD class="r Data">1</TD><TD class="r Data">1.22</TD></TR><TR><TH class="l RowHeader" scope=row>FAYETTE</TH><TD class="r Data">1</TD><TD class="r Data">1.22</TD></TR><TR><TH class="l RowHeader" scope=row>FRANKLIN</TH><TD class="r Data">1</TD><TD class="r Data">1.22</TD></TR><TR><TH class="l RowHeader" scope=row>INDIANA</TH><TD class="r Data">1</TD><TD class="r Data">1.22</TD></TR><TR><TH class="l RowHeader" scope=row>LACKAWANNA</TH><TD class="r Data">1</TD><TD class="r Data">1.22</TD></TR><TR><TH class="l RowHeader" scope=row>LANCASTER</TH><TD class="r Data">2</TD><TD class="r Data">2.44</TD></TR><TR><TH class="l RowHeader" scope=row>LEHIGH</TH><TD class="r Data">3</TD><TD class="r Data">3.66</TD></TR><TR><TH class="l RowHeader" scope=row>LYCOMING</TH><TD class="r Data">1</TD><TD class="r Data">1.22</TD></TR><TR><TH class="l RowHeader" scope=row>MCKEAN</TH><TD class="r Data">1</TD><TD class="r Data">1.22</TD></TR><TR><TH class="l RowHeader" scope=row>MERCER</TH><TD class="r Data">2</TD><TD class="r Data">2.44</TD></TR><TR><TH class="l RowHeader" scope=row>MONROE</TH><TD class="r Data">1</TD><TD class="r Data">1.22</TD></TR><TR><TH class="l RowHeader" scope=row>MONTGOMERY</TH><TD class="r Data">11</TD><TD class="r Data">13.41</TD></TR><TR><TH class="l RowHeader" scope=row>NORTHAMPTON</TH><TD class="r Data">2</TD><TD class="r Data">2.44</TD></TR><TR><TH class="l RowHeader" scope=row>PHILADELPHIA</TH><TD class="r Data">3</TD><TD class="r Data">3.66</TD></TR><TR><TH class="l RowHeader" scope=row>SNYDER</TH><TD class="r Data">1</TD><TD class="r Data">1.22</TD></TR><TR><TH class="l RowHeader" scope=row>VENANGO</TH><TD class="r Data">1</TD><TD class="r Data">1.22</TD></TR><TR><TH class="l RowHeader" scope=row>WARREN</TH><TD class="r Data">1</TD><TD class="r Data">1.22</TD></TR><TR><TH class="l RowHeader" scope=row>WASHINGTON</TH><TD class="r Data">3</TD><TD class="r Data">3.66</TD></TR><TR><TH class="l RowHeader" scope=row>WESTMORELAND</TH><TD class="r Data">2</TD><TD class="r Data">2.44</TD></TR></TBODY></TABLE>
[FONT=Verdana, Arial, Helvetica, sans-serif]*Positive antigen, nucleic acid, and culture test results reported to Pennsylvania's electronic disease reporting system, PA-NEDSS[/FONT][FONT=Verdana, Arial, Helvetica, sans-serif] [/FONT]
[FONT=Verdana, Arial, Helvetica, sans-serif]
<?xml:namespace prefix = st1 ns = "urn:schemas-microsoft-com:office:smarttags" /><st1:State w:st="on"><st1:place w:st="on">Pennsylvania</st1:place></st1:State> Influenza Cases confirmed by the Bureau of Laboratories
(as of 12/22/2008)
<CENTER>
</CENTER><TABLE style="BORDER-RIGHT: medium none; BORDER-TOP: medium none; MARGIN: auto 6.75pt; BORDER-LEFT: medium none; WIDTH: 471.2pt; BORDER-BOTTOM: medium none; BORDER-COLLAPSE: collapse" cellSpacing=0 cellPadding=0 width=628 align=left border=1><TBODY><TR><TD style="BORDER-RIGHT: windowtext 1pt solid; PADDING-RIGHT: 5.4pt; BORDER-TOP: windowtext 1pt solid; PADDING-LEFT: 5.4pt; PADDING-BOTTOM: 0in; BORDER-LEFT: windowtext 1pt solid; WIDTH: 88.55pt; PADDING-TOP: 0in; BORDER-BOTTOM: windowtext 1pt solid; BACKGROUND-COLOR: transparent" vAlign=top width=118>District
</TD><TD style="BORDER-RIGHT: windowtext 1pt solid; PADDING-RIGHT: 5.4pt; BORDER-TOP: windowtext 1pt solid; PADDING-LEFT: 5.4pt; PADDING-BOTTOM: 0in; BORDER-LEFT: #ece9d8; WIDTH: 88.55pt; PADDING-TOP: 0in; BORDER-BOTTOM: windowtext 1pt solid; BACKGROUND-COLOR: transparent" vAlign=top width=118>County
</TD><TD style="BORDER-RIGHT: windowtext 1pt solid; PADDING-RIGHT: 5.4pt; BORDER-TOP: windowtext 1pt solid; PADDING-LEFT: 5.4pt; PADDING-BOTTOM: 0in; BORDER-LEFT: #ece9d8; WIDTH: 88.55pt; PADDING-TOP: 0in; BORDER-BOTTOM: windowtext 1pt solid; BACKGROUND-COLOR: transparent" vAlign=top width=118>Subtype
</TD><TD style="BORDER-RIGHT: windowtext 1pt solid; PADDING-RIGHT: 5.4pt; BORDER-TOP: windowtext 1pt solid; PADDING-LEFT: 5.4pt; PADDING-BOTTOM: 0in; BORDER-LEFT: #ece9d8; WIDTH: 205.55pt; PADDING-TOP: 0in; BORDER-BOTTOM: windowtext 1pt solid; BACKGROUND-COLOR: transparent" vAlign=top width=274>Oseltamivir Resistance (Yes or No)
</TD></TR><TR><TD style="BORDER-RIGHT: windowtext 1pt solid; PADDING-RIGHT: 5.4pt; BORDER-TOP: #ece9d8; PADDING-LEFT: 5.4pt; PADDING-BOTTOM: 0in; BORDER-LEFT: windowtext 1pt solid; WIDTH: 88.55pt; PADDING-TOP: 0in; BORDER-BOTTOM: windowtext 1pt solid; BACKGROUND-COLOR: transparent" vAlign=top width=118 rowSpan=3>NW (3)
</TD><TD style="BORDER-RIGHT: windowtext 1pt solid; PADDING-RIGHT: 5.4pt; BORDER-TOP: #ece9d8; PADDING-LEFT: 5.4pt; PADDING-BOTTOM: 0in; BORDER-LEFT: #ece9d8; WIDTH: 88.55pt; PADDING-TOP: 0in; BORDER-BOTTOM: windowtext 1pt solid; BACKGROUND-COLOR: transparent" vAlign=top width=118><st1:City w:st="on"><st1:place w:st="on">Erie</st1:place></st1:City>
</TD><TD style="BORDER-RIGHT: windowtext 1pt solid; PADDING-RIGHT: 5.4pt; BORDER-TOP: #ece9d8; PADDING-LEFT: 5.4pt; PADDING-BOTTOM: 0in; BORDER-LEFT: #ece9d8; WIDTH: 88.55pt; PADDING-TOP: 0in; BORDER-BOTTOM: windowtext 1pt solid; BACKGROUND-COLOR: transparent" vAlign=top width=118>A(H1N1)
</TD><TD style="BORDER-RIGHT: windowtext 1pt solid; PADDING-RIGHT: 5.4pt; BORDER-TOP: #ece9d8; PADDING-LEFT: 5.4pt; PADDING-BOTTOM: 0in; BORDER-LEFT: #ece9d8; WIDTH: 205.55pt; PADDING-TOP: 0in; BORDER-BOTTOM: windowtext 1pt solid; BACKGROUND-COLOR: transparent" vAlign=top width=274>Yes
</TD></TR><TR><TD style="BORDER-RIGHT: windowtext 1pt solid; PADDING-RIGHT: 5.4pt; BORDER-TOP: #ece9d8; PADDING-LEFT: 5.4pt; PADDING-BOTTOM: 0in; BORDER-LEFT: #ece9d8; WIDTH: 88.55pt; PADDING-TOP: 0in; BORDER-BOTTOM: windowtext 1pt solid; BACKGROUND-COLOR: transparent" vAlign=top width=118><st1:City w:st="on"><st1:place w:st="on">Warren</st1:place></st1:City>
</TD><TD style="BORDER-RIGHT: windowtext 1pt solid; PADDING-RIGHT: 5.4pt; BORDER-TOP: #ece9d8; PADDING-LEFT: 5.4pt; PADDING-BOTTOM: 0in; BORDER-LEFT: #ece9d8; WIDTH: 88.55pt; PADDING-TOP: 0in; BORDER-BOTTOM: windowtext 1pt solid; BACKGROUND-COLOR: transparent" vAlign=top width=118>A(H3N2)
</TD><TD style="BORDER-RIGHT: windowtext 1pt solid; PADDING-RIGHT: 5.4pt; BORDER-TOP: #ece9d8; PADDING-LEFT: 5.4pt; PADDING-BOTTOM: 0in; BORDER-LEFT: #ece9d8; WIDTH: 205.55pt; PADDING-TOP: 0in; BORDER-BOTTOM: windowtext 1pt solid; BACKGROUND-COLOR: transparent" vAlign=top width=274>Results pending
</TD></TR><TR><TD style="BORDER-RIGHT: windowtext 1pt solid; PADDING-RIGHT: 5.4pt; BORDER-TOP: #ece9d8; PADDING-LEFT: 5.4pt; PADDING-BOTTOM: 0in; BORDER-LEFT: #ece9d8; WIDTH: 88.55pt; PADDING-TOP: 0in; BORDER-BOTTOM: windowtext 1pt solid; BACKGROUND-COLOR: transparent" vAlign=top width=118><st1:City w:st="on"><st1:place w:st="on">Warren</st1:place></st1:City>
</TD><TD style="BORDER-RIGHT: windowtext 1pt solid; PADDING-RIGHT: 5.4pt; BORDER-TOP: #ece9d8; PADDING-LEFT: 5.4pt; PADDING-BOTTOM: 0in; BORDER-LEFT: #ece9d8; WIDTH: 88.55pt; PADDING-TOP: 0in; BORDER-BOTTOM: windowtext 1pt solid; BACKGROUND-COLOR: transparent" vAlign=top width=118>A(H3N2)
</TD><TD style="BORDER-RIGHT: windowtext 1pt solid; PADDING-RIGHT: 5.4pt; BORDER-TOP: #ece9d8; PADDING-LEFT: 5.4pt; PADDING-BOTTOM: 0in; BORDER-LEFT: #ece9d8; WIDTH: 205.55pt; PADDING-TOP: 0in; BORDER-BOTTOM: windowtext 1pt solid; BACKGROUND-COLOR: transparent" vAlign=top width=274>Results pending
</TD></TR><TR><TD style="BORDER-RIGHT: windowtext 1pt solid; PADDING-RIGHT: 5.4pt; BORDER-TOP: #ece9d8; PADDING-LEFT: 5.4pt; PADDING-BOTTOM: 0in; BORDER-LEFT: windowtext 1pt solid; WIDTH: 88.55pt; PADDING-TOP: 0in; BORDER-BOTTOM: windowtext 1pt solid; BACKGROUND-COLOR: transparent" vAlign=top width=118>NE (1)
</TD><TD style="BORDER-RIGHT: windowtext 1pt solid; PADDING-RIGHT: 5.4pt; BORDER-TOP: #ece9d8; PADDING-LEFT: 5.4pt; PADDING-BOTTOM: 0in; BORDER-LEFT: #ece9d8; WIDTH: 88.55pt; PADDING-TOP: 0in; BORDER-BOTTOM: windowtext 1pt solid; BACKGROUND-COLOR: transparent" vAlign=top width=118>Lehigh
</TD><TD style="BORDER-RIGHT: windowtext 1pt solid; PADDING-RIGHT: 5.4pt; BORDER-TOP: #ece9d8; PADDING-LEFT: 5.4pt; PADDING-BOTTOM: 0in; BORDER-LEFT: #ece9d8; WIDTH: 88.55pt; PADDING-TOP: 0in; BORDER-BOTTOM: windowtext 1pt solid; BACKGROUND-COLOR: transparent" vAlign=top width=118>A (H3N2)
</TD><TD style="BORDER-RIGHT: windowtext 1pt solid; PADDING-RIGHT: 5.4pt; BORDER-TOP: #ece9d8; PADDING-LEFT: 5.4pt; PADDING-BOTTOM: 0in; BORDER-LEFT: #ece9d8; WIDTH: 205.55pt; PADDING-TOP: 0in; BORDER-BOTTOM: windowtext 1pt solid; BACKGROUND-COLOR: transparent" vAlign=top width=274>Results pending
</TD></TR><TR><TD style="BORDER-RIGHT: windowtext 1pt solid; PADDING-RIGHT: 5.4pt; BORDER-TOP: #ece9d8; PADDING-LEFT: 5.4pt; PADDING-BOTTOM: 0in; BORDER-LEFT: windowtext 1pt solid; WIDTH: 88.55pt; PADDING-TOP: 0in; BORDER-BOTTOM: windowtext 1pt solid; BACKGROUND-COLOR: transparent" vAlign=top width=118 rowSpan=4>NC (4)
</TD><TD style="BORDER-RIGHT: windowtext 1pt solid; PADDING-RIGHT: 5.4pt; BORDER-TOP: #ece9d8; PADDING-LEFT: 5.4pt; PADDING-BOTTOM: 0in; BORDER-LEFT: #ece9d8; WIDTH: 88.55pt; PADDING-TOP: 0in; BORDER-BOTTOM: windowtext 1pt solid; BACKGROUND-COLOR: transparent" vAlign=top width=118>Centre
</TD><TD style="BORDER-RIGHT: windowtext 1pt solid; PADDING-RIGHT: 5.4pt; BORDER-TOP: #ece9d8; PADDING-LEFT: 5.4pt; PADDING-BOTTOM: 0in; BORDER-LEFT: #ece9d8; WIDTH: 88.55pt; PADDING-TOP: 0in; BORDER-BOTTOM: windowtext 1pt solid; BACKGROUND-COLOR: transparent" vAlign=top width=118>A(H1N1)
</TD><TD style="BORDER-RIGHT: windowtext 1pt solid; PADDING-RIGHT: 5.4pt; BORDER-TOP: #ece9d8; PADDING-LEFT: 5.4pt; PADDING-BOTTOM: 0in; BORDER-LEFT: #ece9d8; WIDTH: 205.55pt; PADDING-TOP: 0in; BORDER-BOTTOM: windowtext 1pt solid; BACKGROUND-COLOR: transparent" vAlign=top width=274>Results pending
</TD></TR><TR><TD style="BORDER-RIGHT: windowtext 1pt solid; PADDING-RIGHT: 5.4pt; BORDER-TOP: #ece9d8; PADDING-LEFT: 5.4pt; PADDING-BOTTOM: 0in; BORDER-LEFT: #ece9d8; WIDTH: 88.55pt; PADDING-TOP: 0in; BORDER-BOTTOM: windowtext 1pt solid; BACKGROUND-COLOR: transparent" vAlign=top width=118>Centre
</TD><TD style="BORDER-RIGHT: windowtext 1pt solid; PADDING-RIGHT: 5.4pt; BORDER-TOP: #ece9d8; PADDING-LEFT: 5.4pt; PADDING-BOTTOM: 0in; BORDER-LEFT: #ece9d8; WIDTH: 88.55pt; PADDING-TOP: 0in; BORDER-BOTTOM: windowtext 1pt solid; BACKGROUND-COLOR: transparent" vAlign=top width=118>A(H1N1)
</TD><TD style="BORDER-RIGHT: windowtext 1pt solid; PADDING-RIGHT: 5.4pt; BORDER-TOP: #ece9d8; PADDING-LEFT: 5.4pt; PADDING-BOTTOM: 0in; BORDER-LEFT: #ece9d8; WIDTH: 205.55pt; PADDING-TOP: 0in; BORDER-BOTTOM: windowtext 1pt solid; BACKGROUND-COLOR: transparent" vAlign=top width=274>Results pending
</TD></TR><TR><TD style="BORDER-RIGHT: windowtext 1pt solid; PADDING-RIGHT: 5.4pt; BORDER-TOP: #ece9d8; PADDING-LEFT: 5.4pt; PADDING-BOTTOM: 0in; BORDER-LEFT: #ece9d8; WIDTH: 88.55pt; PADDING-TOP: 0in; BORDER-BOTTOM: windowtext 1pt solid; BACKGROUND-COLOR: transparent" vAlign=top width=118>Centre
</TD><TD style="BORDER-RIGHT: windowtext 1pt solid; PADDING-RIGHT: 5.4pt; BORDER-TOP: #ece9d8; PADDING-LEFT: 5.4pt; PADDING-BOTTOM: 0in; BORDER-LEFT: #ece9d8; WIDTH: 88.55pt; PADDING-TOP: 0in; BORDER-BOTTOM: windowtext 1pt solid; BACKGROUND-COLOR: transparent" vAlign=top width=118>Influenza B
</TD><TD style="BORDER-RIGHT: windowtext 1pt solid; PADDING-RIGHT: 5.4pt; BORDER-TOP: #ece9d8; PADDING-LEFT: 5.4pt; PADDING-BOTTOM: 0in; BORDER-LEFT: #ece9d8; WIDTH: 205.55pt; PADDING-TOP: 0in; BORDER-BOTTOM: windowtext 1pt solid; BACKGROUND-COLOR: transparent" vAlign=top width=274>Results pending
</TD></TR><TR><TD style="BORDER-RIGHT: windowtext 1pt solid; PADDING-RIGHT: 5.4pt; BORDER-TOP: #ece9d8; PADDING-LEFT: 5.4pt; PADDING-BOTTOM: 0in; BORDER-LEFT: #ece9d8; WIDTH: 88.55pt; PADDING-TOP: 0in; BORDER-BOTTOM: windowtext 1pt solid; BACKGROUND-COLOR: transparent" vAlign=top width=118>Centre
</TD><TD style="BORDER-RIGHT: windowtext 1pt solid; PADDING-RIGHT: 5.4pt; BORDER-TOP: #ece9d8; PADDING-LEFT: 5.4pt; PADDING-BOTTOM: 0in; BORDER-LEFT: #ece9d8; WIDTH: 88.55pt; PADDING-TOP: 0in; BORDER-BOTTOM: windowtext 1pt solid; BACKGROUND-COLOR: transparent" vAlign=top width=118>Influenza B
</TD><TD style="BORDER-RIGHT: windowtext 1pt solid; PADDING-RIGHT: 5.4pt; BORDER-TOP: #ece9d8; PADDING-LEFT: 5.4pt; PADDING-BOTTOM: 0in; BORDER-LEFT: #ece9d8; WIDTH: 205.55pt; PADDING-TOP: 0in; BORDER-BOTTOM: windowtext 1pt solid; BACKGROUND-COLOR: transparent" vAlign=top width=274>Results pending
</TD></TR><TR><TD style="BORDER-RIGHT: windowtext 1pt solid; PADDING-RIGHT: 5.4pt; BORDER-TOP: #ece9d8; PADDING-LEFT: 5.4pt; PADDING-BOTTOM: 0in; BORDER-LEFT: windowtext 1pt solid; WIDTH: 88.55pt; PADDING-TOP: 0in; BORDER-BOTTOM: windowtext 1pt solid; BACKGROUND-COLOR: transparent" vAlign=top width=118 rowSpan=4>SE (4)
</TD><TD style="BORDER-RIGHT: windowtext 1pt solid; PADDING-RIGHT: 5.4pt; BORDER-TOP: #ece9d8; PADDING-LEFT: 5.4pt; PADDING-BOTTOM: 0in; BORDER-LEFT: #ece9d8; WIDTH: 88.55pt; PADDING-TOP: 0in; BORDER-BOTTOM: windowtext 1pt solid; BACKGROUND-COLOR: transparent" vAlign=top width=118><st1:City w:st="on"><st1:place w:st="on">Chester</st1:place></st1:City>
</TD><TD style="BORDER-RIGHT: windowtext 1pt solid; PADDING-RIGHT: 5.4pt; BORDER-TOP: #ece9d8; PADDING-LEFT: 5.4pt; PADDING-BOTTOM: 0in; BORDER-LEFT: #ece9d8; WIDTH: 88.55pt; PADDING-TOP: 0in; BORDER-BOTTOM: windowtext 1pt solid; BACKGROUND-COLOR: transparent" vAlign=top width=118>A (H3N2)
</TD><TD style="BORDER-RIGHT: windowtext 1pt solid; PADDING-RIGHT: 5.4pt; BORDER-TOP: #ece9d8; PADDING-LEFT: 5.4pt; PADDING-BOTTOM: 0in; BORDER-LEFT: #ece9d8; WIDTH: 205.55pt; PADDING-TOP: 0in; BORDER-BOTTOM: windowtext 1pt solid; BACKGROUND-COLOR: transparent" vAlign=top width=274>Results pending
</TD></TR><TR><TD style="BORDER-RIGHT: windowtext 1pt solid; PADDING-RIGHT: 5.4pt; BORDER-TOP: #ece9d8; PADDING-LEFT: 5.4pt; PADDING-BOTTOM: 0in; BORDER-LEFT: #ece9d8; WIDTH: 88.55pt; PADDING-TOP: 0in; BORDER-BOTTOM: windowtext 1pt solid; BACKGROUND-COLOR: transparent" vAlign=top width=118>Berks
</TD><TD style="BORDER-RIGHT: windowtext 1pt solid; PADDING-RIGHT: 5.4pt; BORDER-TOP: #ece9d8; PADDING-LEFT: 5.4pt; PADDING-BOTTOM: 0in; BORDER-LEFT: #ece9d8; WIDTH: 88.55pt; PADDING-TOP: 0in; BORDER-BOTTOM: windowtext 1pt solid; BACKGROUND-COLOR: transparent" vAlign=top width=118>A(H1N1)
</TD><TD style="BORDER-RIGHT: windowtext 1pt solid; PADDING-RIGHT: 5.4pt; BORDER-TOP: #ece9d8; PADDING-LEFT: 5.4pt; PADDING-BOTTOM: 0in; BORDER-LEFT: #ece9d8; WIDTH: 205.55pt; PADDING-TOP: 0in; BORDER-BOTTOM: windowtext 1pt solid; BACKGROUND-COLOR: transparent" vAlign=top width=274>Results pending
</TD></TR><TR><TD style="BORDER-RIGHT: windowtext 1pt solid; PADDING-RIGHT: 5.4pt; BORDER-TOP: #ece9d8; PADDING-LEFT: 5.4pt; PADDING-BOTTOM: 0in; BORDER-LEFT: #ece9d8; WIDTH: 88.55pt; PADDING-TOP: 0in; BORDER-BOTTOM: windowtext 1pt solid; BACKGROUND-COLOR: transparent" vAlign=top width=118>Berks
</TD><TD style="BORDER-RIGHT: windowtext 1pt solid; PADDING-RIGHT: 5.4pt; BORDER-TOP: #ece9d8; PADDING-LEFT: 5.4pt; PADDING-BOTTOM: 0in; BORDER-LEFT: #ece9d8; WIDTH: 88.55pt; PADDING-TOP: 0in; BORDER-BOTTOM: windowtext 1pt solid; BACKGROUND-COLOR: transparent" vAlign=top width=118>A(H1N1)
</TD><TD style="BORDER-RIGHT: windowtext 1pt solid; PADDING-RIGHT: 5.4pt; BORDER-TOP: #ece9d8; PADDING-LEFT: 5.4pt; PADDING-BOTTOM: 0in; BORDER-LEFT: #ece9d8; WIDTH: 205.55pt; PADDING-TOP: 0in; BORDER-BOTTOM: windowtext 1pt solid; BACKGROUND-COLOR: transparent" vAlign=top width=274>Results pending
</TD></TR><TR><TD style="BORDER-RIGHT: windowtext 1pt solid; PADDING-RIGHT: 5.4pt; BORDER-TOP: #ece9d8; PADDING-LEFT: 5.4pt; PADDING-BOTTOM: 0in; BORDER-LEFT: #ece9d8; WIDTH: 88.55pt; PADDING-TOP: 0in; BORDER-BOTTOM: windowtext 1pt solid; BACKGROUND-COLOR: transparent" vAlign=top width=118>Bucks
</TD><TD style="BORDER-RIGHT: windowtext 1pt solid; PADDING-RIGHT: 5.4pt; BORDER-TOP: #ece9d8; PADDING-LEFT: 5.4pt; PADDING-BOTTOM: 0in; BORDER-LEFT: #ece9d8; WIDTH: 88.55pt; PADDING-TOP: 0in; BORDER-BOTTOM: windowtext 1pt solid; BACKGROUND-COLOR: transparent" vAlign=top width=118>A(H1N1)
</TD><TD style="BORDER-RIGHT: windowtext 1pt solid; PADDING-RIGHT: 5.4pt; BORDER-TOP: #ece9d8; PADDING-LEFT: 5.4pt; PADDING-BOTTOM: 0in; BORDER-LEFT: #ece9d8; WIDTH: 205.55pt; PADDING-TOP: 0in; BORDER-BOTTOM: windowtext 1pt solid; BACKGROUND-COLOR: transparent" vAlign=top width=274>Yes
</TD></TR><TR><TD style="BORDER-RIGHT: windowtext 1pt solid; PADDING-RIGHT: 5.4pt; BORDER-TOP: #ece9d8; PADDING-LEFT: 5.4pt; PADDING-BOTTOM: 0in; BORDER-LEFT: windowtext 1pt solid; WIDTH: 88.55pt; PADDING-TOP: 0in; BORDER-BOTTOM: windowtext 1pt solid; BACKGROUND-COLOR: transparent" vAlign=top width=118>SC (1)
</TD><TD style="BORDER-RIGHT: windowtext 1pt solid; PADDING-RIGHT: 5.4pt; BORDER-TOP: #ece9d8; PADDING-LEFT: 5.4pt; PADDING-BOTTOM: 0in; BORDER-LEFT: #ece9d8; WIDTH: 88.55pt; PADDING-TOP: 0in; BORDER-BOTTOM: windowtext 1pt solid; BACKGROUND-COLOR: transparent" vAlign=top width=118>Blair
</TD><TD style="BORDER-RIGHT: windowtext 1pt solid; PADDING-RIGHT: 5.4pt; BORDER-TOP: #ece9d8; PADDING-LEFT: 5.4pt; PADDING-BOTTOM: 0in; BORDER-LEFT: #ece9d8; WIDTH: 88.55pt; PADDING-TOP: 0in; BORDER-BOTTOM: windowtext 1pt solid; BACKGROUND-COLOR: transparent" vAlign=top width=118>A(H1N1)
</TD><TD style="BORDER-RIGHT: windowtext 1pt solid; PADDING-RIGHT: 5.4pt; BORDER-TOP: #ece9d8; PADDING-LEFT: 5.4pt; PADDING-BOTTOM: 0in; BORDER-LEFT: #ece9d8; WIDTH: 205.55pt; PADDING-TOP: 0in; BORDER-BOTTOM: windowtext 1pt solid; BACKGROUND-COLOR: transparent" vAlign=top width=274>Results pending
</TD></TR></TBODY></TABLE>


<HR id=main style="WIDTH: 510px; HEIGHT: 2px" SIZE=2>
[FONT=Verdana, Arial, Helvetica, sans-serif]Useful Links[/FONT]​
[FONT=Verdana, Arial, Helvetica, sans-serif]US Centers for Disease Control and Prevention Weekly Influenza Surveillance Report:
http://www.cdc.gov/flu/weekly
/
[/FONT]
[FONT=Verdana, Arial, Helvetica, sans-serif]US Influenza Sentinel Provider Surveillance submission login page:
http://www2.ncid.cdc.gov/flu/
[/FONT]
[FONT=Verdana, Arial, Helvetica, sans-serif]PA Department of Health, Focus on Flu:
http://www.health.state.pa.us/flu
[/FONT]
[FONT=Verdana, Arial, Helvetica, sans-serif]Pennsylvania Pandemic Influenza Preparedness:
http://www.pandemicflu.state.pa.us
[/FONT]

http://www.dsf.health.state.pa.us/health/cwp/view.asp?a=171&q=246529
[/FONT]
</DSFCONTENTBODY>
 
Re: Seasonal Flu 2008 - 2009

[Seasonal Human Influenza] Situation in Hong Kong (As of 29 Dec 2008)

[Seasonal Human Influenza] Situation in Hong Kong (As of 29 Dec 2008)

[Original full PDF Report at LINK. EDITED.]

The influenza activity in Hong Kong remained at low level.

For the week ending 20 Dec 2008 (week 51), the average consultation rates for ILI among sentinel private doctors ... and general outpatient clinics ... were 36.7 and 2.5 (per 1,000 consultations) respectively.

In the same week, 0.70% of children in the sentinel child care centres ... and 0.15% of residents in the sentinel residential care homes for the elderly ... had fever.

The consultation rate for ILI among chinese medicine practitioners ... was 6.11 per 1,000 consultations.

Influenza detection was 16 in week 51.

Laboratory surveillance detected 11 influenza A (H1N1) viruses, 3 influenza A (H3N2) viruses, 1 influenza B virus and 1 influenza C virus.

In week 51 and 52, there were no confirmed influenza outbreaks.

In week 51, hospital admission rate due to influenza for the elderly 65 years old or above was 0 (per 10,000 people in the age group) ... and that for children aged 0 to 4 years was 0.09 (per 10,000 people in the age group) ... .

For the week ending 20 Dec 2008, no children aged 12 years or below were reported to have severe complications related to influenza.

(...)
-
-----
 
Re: Seasonal Flu 2008 - 2009

Of the 558 specimens tested since the beginning of the 2008-09 flu season, 129 (23.0%) influenza isolates
have been detected by SLD. Of these, 1 (1%) was influenza A (subtype unknown), 119 (92%) were
influenza A(H1) and 5 (4%) were influenza A(H3). There have been 4 (3%) influenza B cases. Select​
isolates were sent to CDC for strain characterization.

http://hawaii.gov/health/about/fami...ports/Influenza Surveillance Week 50 2008.pdf
 
Re: Seasonal Flu 2008 - 2009

CDC has reported antigenic characterization results from 13 influenza isolates [5 influenza A/H1, 0 influenza A/H3, and 8 influenza B viruses] received from the DSHS Laboratory since the beginning of the 2008?09 flu season.


Influenza A/H1 [5]
  • Five (100%) of the five viruses were characterized as A/Brisbane/59/2007, the influenza A/H1 component of the 2008?09 influenza vaccine for the Northern Hemisphere.
Influenza A/H3 [0]
  • The DSHS Lab has not isolated influenza A/H3 from any specimens yet this season.
Influenza B (B/Victoria/02/87 and B/Yamagata/16/88 lineages) [8]
  • Victoria lineage [8]
  • Two (25%) of the eight viruses were characterized as B/Ohio/01/2005-like viruses.
  • Six (75%) of the eight viruses showed somewhat reduced titers with antisera produced against B/Malaysia/2506/2004 and B/Ohio/01/2005.
    Yamagata lineage [0]
  • The influenza B component for the 2008-09 influenza vaccine is a B/Florida/4/2006-like virus, belonging to the B/Yamagata lineage.
http://www.dshs.state.tx.us/idcu/disease/influenza/surveillance/2009/
 
Re: Seasonal Flu 2008 - 2009

As of week 49, six samples were found to be positive by viral culture for influenza AH1 and
influenza B. Rapid and culture results by county are displayed below.​
Week 40 to Week 49 Week 47, 47, 49
County​
A RapBid * A/ Culture* Rapid* Culture*

B
A
H1
A
H3
A
UNK
B A B A/B A H1 A
H3
A
UNK
B​
Atlantic County​
0 0 0 0 0 0 0 0 0 0 0 0 0 0

Bergen County​
0 0 0 0 0 0 0 0 0 0 0 0 0 0

Burlington County​
3 0 0 0 0 0 0 2 0 0 0 0 0 0

Camden County​
0 0 0 0 0 0 0 0 0 0 0 0 0 0

Cape May County​
0 0 0 0 0 0 0 0 0 0 0 0 0 0

Cumberland County​
0 0 0 0 0 0 0 0 0 0 0 0 0 0

Essex County​
9 4 3 0 0 0 0 4 3 2 0 0 0 0

Gloucester County​
0 0 0 0 0 0 0 0 0 0 0 0 0 0

Hudson County​
1 1 0 0 0 0 0 1 1 0 0 0 0 0

Hunterdon County​
0 0 3 1 0 0 0 0 0 2 1 0 0 0

Mercer County​
1 0 0 0 0 0 0 0 0 0 0 0 0 0

Middlesex County​
1 0 0 3 0 0 0 1 0 0 3 0 0 0

Monmouth County​
8 0 3 0 0 0 0 4 0 2 0 0 0 0

Morris County​
0 0 0 0 0 0 0 0 0 0 0 0 0 0

Ocean County​
0 0 0 0 0 0 0 0 0 0 0 0 0 0

Passaic County​
3 0 0 0 0 0 0 3 0 0 0 0 0 0

Salem County​
0 0 0 0 0 0 0 0 0 0 0 0 0 0

Somerset County​
0 0 0 0 0 0 0 0 0 0 0 0 0 0

Sussex County​
3 0 0 0 0 0 0 2 0 0 0 0 0 0

Union County​
0 1 0 1 0 0 1 0 1 0 1 0 0 1

Warren County​
0 0 0 0 0 0 0 0 0 0 0 0 0 0

Unknown​
0 0 0 0 0 0 0 0 0 0 0 0 0 0

State Total​
29 6 9 5 0 0 1 17 5 6 5 0 0 1
*Rapid data is acquired from facilities reporting rapid influenza tests via NREVSS or CDRSS ILI module. Culture
results are obtained from the LIMS system at PHEL, hospital viral culture laboratories via NREVSS or commercial
laboratories reporting in CDRSS.

3
http://www.state.nj.us/health/flu/documents/stats08/flummwr_50.pdf
 
Re: Seasonal Flu 2008 - 2009

Italy. 2008/2009 Influenza Season. Influenza-like Illness Weekly Surveillance Report (data provided by CIRI, updated at Dec. 31 2008)

Global Trend for Influenza-like Illness and Acute Respiratory Illness Incidence among population.

Tables and Graphs are provided by CIRI (Centro Interuniversitario per lo Studio dell'Influenza). Please follow this LINK for further details about current week surveillance results.

Data reports ILI and ARI incidence for 1,000 inhabitants, as per class ages, season and surveillance week.

<table style="width: auto;"><tbody><tr><td></td></tr><tr><td style="font-family: arial,sans-serif; font-size: 11px; text-align: right;">From TABLES</td></tr></tbody></table>

<table style="width: auto;"><tbody><tr><td></td></tr><tr><td style="font-family: arial,sans-serif; font-size: 11px; text-align: right;">From TABLES</td></tr></tbody></table>
[Updated at 31-12-2008 9:24:45am GMT+1]

[SURVEILLANCE WEEK / Sentinel GPs / Outpatients / CASES: 0-4 / 5-14 / 15-65 / +65 / TOTAL INCIDENCE]

2008-42 / 391 / 510721 / 141 / 0,67 / 0,23 / 0,29 / 0,16 / 0,28
2008-43 / 386 / 509332 / 133 / 0,76 / 0,34 / 0,25 / 0,14 / 0,26
2008-44 / 405 / 535482 / 147 / 0,81 / 0,16 / 0,29 / 0,16 / 0,27
2008-45 / 408 / 536770 / 177 / 1,16 / 0,36 / 0,3 / 0,18 / 0,33
2008-46 / 394 / 516856 / 177 / 0,66 / 0,45 / 0,36 / 0,15 / 0,34
2008-47 / 411 / 541846 / 272 / 1,76 / 0,56 / 0,47 / 0,26 / 0,5
2008-48 / 420 / 554658 / 337 / 1,93 / 0,57 / 0,6 / 0,31 / 0,61
2008-49 / 414 / 547040 / 413 / 2,74 / 1,08 / 0,68 / 0,33 / 0,75
2008-50 / 416 / 547743 / 487 / 3,22 / 1,29 / 0,82 / 0,3 / 0,89
2008-51 / 393 / 520822 / 644 / 4,41 / 2,04 / 1,06 / 0,63 / 1,24
2008-52 / 316 / 420983 / 581 / 5,5 / 1,94 / 1,21 / 0,61 / 1,38

For the 52th week, there is an increasing incidence of ILI among 0-4 class-age population, that reaches 5,5 cases per 1,000 inhab. (or 550 x 100,000).

RED figures indicates an increased incidence, whereas BLUE figures a decreased incidence.
-
-----
 
Re: Seasonal Flu 2008 - 2009

so, in Italy, we are slighly below the #cases from last season

last graphic is #cases per 1000 citizens from ILI(influenza-like-illness) by age-groups
in Italy 2008 ?
 
Re: Seasonal Flu 2008 - 2009

so, in Italy, we are slighly below the #cases from last season

last graphic is #cases per 1000 citizens from ILI(influenza-like-illness) by age-groups
in Italy 2008 ?

Yes. It represents 2008/2009 class-aged tabulated ILI incidence per 1,000 inhab.
 
Re: Seasonal Flu 2008 - 2009

dominant in Europe is H3N2 (Brisbane) so far,
in USA : H1N1 (Brisbane)
 
Re: Seasonal Flu 2008 - 2009

Last week

HPA Weekly National Influenza Report​
Summary of UK* surveillance of influenza and other seasonal respiratory illness​
24 December 2008 (Week 52​
)

Summary
Clinical indices of acute respiratory illness​
(England, Wales, Scotland and Northern Ireland)

The overall influenza-like illness incidence rate**
increased from 39.5 per 100,000 in week 50/08 to 68.5
per 100,000 in week 51/08, this is well above the
baseline threshold of 30 per 100,000. The rate in the
northern region was lowest at 43.8 per 100,000, an
increase from 16.4 per 100,000 in week 50/08. The​
*​
Incorporating data from the Royal College of General Practitioners (RCGP) (England and Wales), The National Public Health
Service for Wales (NPHS), Health Protection Scotland (HPS), Communicable Disease Surveillance Centre Northern Ireland
(CDSC Northern Ireland), the Office for National Statistics (ONS) (England and Wales), Medical Officers of Schools Association
(MOSA) (England), NHS Direct (England and Wales) and Q Surveillance (England, Northern Ireland, Scotland and Wales).

Figure 1​
: RCGP consultation rate for influenza ? like illness, 2008/09 and recent years, England and Wales

Influenza activity is widespread across the UK and has continued to increase from week 50 to week 51/08. GP
consultation rates have increased and are exceeding threshold levels in England and Scotland, they have also
increased but remain within baseline in Wales. In Northern Ireland the consultation rate has greatly increased but
thresholds have not yet been set. Proportions of calls to NHS Direct in England and Wales relating to colds/flu and
fever have increased and remain above baseline levels. Calls to NHS 24 in Scotland are also increasing. Of the
samples referred to the Centre for Infections? Respiratory Virus Unit (RVU) during week 51/08, 148 were positive for
influenza A; three A (H1) and 145 A (H3), and eight for influenza B. Other NHS and HPA laboratories in England and
Wales reported 131 influenza A and two influenza B positive specimens in week 51/08. Thirty-one Scottish and 20
Northern Irish influenza positive specimens were reported in week 51. Eleven outbreaks of respiratory illness were
reported recently from various areas of England in care homes, schools and a hospital. The proportion of people over
65 years who have received this season?s influenza vaccine was 72% in week 50/08, and 44.2% in those aged under
65 in risk groups. Characterisation of 200 influenza viruses since week 40/08 by RVU have shown that the majority of
circulating strains are well-matched by the current influenza vaccine. Influenza activity was increasing throughout the
rest of Europe with four countries reporting ?medium? levels and 11 reporting increasing activity in week 50/08.​
England and Wales​
Royal College of General Practitioners​
(​
http://www.rcgp.org.uk/bru/index.asp)

Covered in this report:​
Data, except that from ONS, MOSA and non-UK sources: 15/12/08 - 21/12/08 (Week 51, 2008 )
Data from ONS, MOSA and non-UK sources: 08/12/08 - 14/12/08 (Week 50, 2008)​
** RCGP incidence rates in this report only refer to first or new episodes of infection diagnosed by a GP.
Neuraminidase inhibitor susceptibility testing on 73 A (H3) isolates since week 40/08 showed that all are sensitive to
oseltamivir and zanamivir but resistant to amantadine. Both of the two influenza B isolates tested since week 40/08
are sensitive to oseltamivir and zanamivir​
. Twenty-nine of 30 A (H1) specimens tested in the same time frame are
resistant to oseltamivir but sensitive to zanamivir and amantadine. The majority of these oseltamivir-resistant viruses
come from the south west of England. Two influenza A (H1) isolates have been found to be resistant to oseltamivir in
Scotland this season, one of which has been confirmed by CfI.

Antiviral drug susceptibility testing​
highest rate in week 51/08 was in the central region at
81.7 per 100,000 and in the south the rate was 67.8 per
100,000. The rates were highest in the 15-44 year age
group at 79.7 per 100,000 and in the 45-64 year age
group at 75.6 per 100,000 in week 51/08 (Figure 2).
The rate for acute bronchitis has been increasing steadily
over the season, it increased to 218.7 per 100,000 in
week 51/08. The highest rate is now in the over 75 year
group at 582.2 per 100,000 in week 51/08.​
2​
0
2 5
5 0
7 5
1 0 0
1 2 5
1 5 0
1 7 5
2 0 0
2 2 5
4 0 4 2 4 4 4 6 4 8 5 0 5 2 2 4 6 8 1 0 1 2 1 4 1 6 1 8 2 0​
W e e k​
Rate per 100 000 population​
E n g l a n d ( R C G P )
S c o t l a n d ( H P S )
W a l e s ( N P H S )
N o r t h e r n I r e l a n d ( C D S C N I )​
Figure 3​
: GP Consultation rates for influenza/influenza-like illness in the U.K

QSurveillance​
HPA and Nottingham University Division of Primary
Care.​
(​
http://www.qresearch.org)

Northern Ireland​
CDSC Northern Ireland​
(​
http://www.cdscni.org.uk/)

The combined rate for influenza and influenza-like illness
increased from 124.3 (updated rate) per 100,000 in week
50/08 to 196.5 per 100,000 in week 51/08 (Figure 3).
The highest rate was 289.8 per 100,000 in the 45-64 year
age group. No threshold has been set for Northern Ireland.
This primary care surveillance system uses
QSurveillance, a database of general practice derived
data. During week 51/08, over 3200 practices reported
from England, Wales, Scotland and Northern Ireland
covering a population of over 22 million. The rate of
influenza-like illness increased from 28 per 100,000 in
week 50/08 to 42.7 per 100,000 in week 51/08. The
highest rates have consistently been in the 15-44 year
age group (50.6 per 100,000 in week 51/08). The rates
were highest in Northern Ireland and London.​
NHS Direct total call activity​
England and Wales​
(​
http://www.nhsdirect.nhs.uk/)

The proportions of cold/flu and fever calls are over the
baseline and are still increasing. The proportion of cold/
flu calls increased from 1.6% in week 50/08 to 2.1% in
week 51/08 (1.2% is the theshold). Fever calls in the 5-14
age group made up 12.3% of the total calls in week 51/
08, an increase from 11.5% in week 50/08 which exceeds
the threshold of 9%.​
Wales​
National Public Health Service​
(​
http://www.wales.nhs.uk/sites/home.cfm?OrgID=368)

GP consultation rates for influenza increased from 9.3
per 100,000 in week 50/08 to 15.6 per 100,000 in week
51/08. Both figures are well below the baseline threshold
of 25 consultations per 100,000 (Figure 3).​
Figure 2​
: RCGP Episode incidence rates for influenza-like illness (ILI) by age group, England and Wales.

0
1 0
2 0
3 0
4 0
5 0
6 0
7 0
8 0
9 0
1 0 0
4 0 4 2 4 4 4 6 4 8 5 0 5 2 2 4 6 8 1 0 1 2 1 4 1 6 1 8 2 0​
W e e k
Rate per 100 000 population
0 - 1
1 - 4
5 - 1 4
1 5 - 4 4
4 5 - 6 4
6 5 - 7 4
> 7 5​
Medical Officers of Schools Association
(MOSA)​
There is no data for weeks 49 and 50/08 as the school
students are on holiday​
Scotland​
Health Protection Scotland​
(​
http://www.hps.scot.nhs.uk/)

GP consultation rates for influenza increased from 33.0
per 100,000 in week 50/08 to 65.0 per 100,000 in week
51/08(Figure 3). This exceeds the Scottish baseline
threshold of 50 consultations per 100,000, suggesting
that influenza viruses are circulating in the community.
In accordance with NICE guidelines, physicians in
Scotland have been advised to prescribe anti-viral drugs
for treatment or prophylaxis of influenza in appropriate
cases.​
3​
Respiratory Virus Unit (RVU) Influenza Reference
Laboratory, CfI​
One hundred and fifty-six specimens tested positive for
influenza in week 51/08 (Table 1). Since week 40/08 200
viruses have been characterised: 22 A (H1) Brisbane/59/
2007 (H1N1)-like, 174A (H3) A/Brisbane/10/2007 (H3N2)-
like, one B/Florida/4/2006-like which are all vaccine strains,
three A/Solomon Islands/3/2006 (H1)-like which is similar
to the vaccine strain,and eight B/Malaysia/2506/2004-like.​
54.1% of specimens from the RCGP surveillance
scheme were positive for influenza in week 51/08, this
is above the threshold of 30% (figure 4).
Neuraminidase inhibitor susceptibility testing on 73 A
(H3) isolates since week 40/08 showed that all of them
are sensitive​
to oseltamivir and zanamivir but resistant to
amantadine. Of the 30 A (H1) specimens received and
tested, 29 are resistant to oseltamivir but sensitive to
zanamivir and amantadine. These specimens are from

* RSV detection is by PCR only​
Other NHS and HPA laboratories (England and
Wales)​
The number of specimens positive for influenza A has
increased from 109 in week 50/08 to 131 in week 51/
08 and the number of RSV positives decreased (from
380 to 327) in the same time period. To date, a higher
number of influenza A positive specimens have come
from central and southen England. (Table 2).
Please note that these data are provisional.​
Laboratory indices of acute respiratory illness​
*​
Detections of RSV by isolation are not included.

Table 1 ?Detections? (PCR and isolation) of influenza and
RSV made by RVU (CfI) Reference Laboratory.
Samples from community and hospital sources,
by week of report.​
6 96 7 2
5 150 2 5
24 293 9 22
1 2 0 0
1 3 0 0
0 5 0 0​
37 549 18 29
Influenza Detections by
PCR and Isolation
A (H1) A (H3) B RSV*
Cumulative to date
Northern England
Central England
Southern England
Wales
Scotland
Northern Ireland
Cumulative Total
Influenza type ( subtype)
Week 50/08
Week 51/08
(week 40/08 ? 51/08)
356 336 3922​
Table 2 ??Detections? (isolation, PCR, direct
immunofluorescence and paired sera tests) of
influenza and RSV reported to CfI by NHS and
HPA microbiology laboratories. Data for England
and Wales by RCGP region, by week of report​
Week 50/08
Week 51/08
Cumulative to Date
(week 40/08 - 51/08)
Northern England
Central England
Southern England
Wales
Cumulative Total​
Detection (isolates, DIF and PCR)​
Influenza A Influenza B RSV*​
109 2 380
131 2 327​
95 4 1072
156 4 449
148 3 1326
13 0 182​
414 11 3029​
4 97 4 2
3 145 8 1​
Figure 4 : Proportion of RCGP specimens positive for influenza detected (PCR and Isolation) by RVU,CfI, by week of
specimen​
0
1 0
2 0
3 0
4 0
5 0
6 0
7 0
4 0 4 2 4 4 4 6 4 8 5 0 5 2 2 4 6 8 1 0 1 2 1 4 1 6 1 8 2 0
W e e k​
Percentage positive​
% I n f l u e n z a B
% I n f l u e n z a A ( H 1 )
% I n f l u e n z a A ( H 3 )​
England, Scotland and Wales (table 1). Seven further
influenza A(H1) isolates are undergoing resistance
testing at the moment. Two influenza B isolates have
been tested and are both sensitive to oseltamivir and
zanamivir.
Please note that these data are provisional.​
4​
Avian Influenza​
The WHO continues to monitor and report on new cases
of human infection with A(H5N1) avian influenza when
they occur. Since 16 December there have been no further
cases of avian influenza confirmed by WHO.
According to WHO, the total number of confirmed human
infections worldwide with H5N1, since December 2003,
is 391 of which 247 (63%) have died.​
Useful links:​
Situation updates from WHO (human):​
Situation summary from the HPA (avian and human):​
Virological data from Northern Ireland​
(​
http://www.cdscni.org.uk/)

Fourteen sentinel samples were tested in week 51/08
of which 13 (92.9%) were positive for influenza (12 A
and one B). Of the 80 non-sentinel samples tested,
seven (8.8%) were positive for influenza (six A and one
B) and 33 for RSV.​
Flu Vaccination Campaign 2008/09 (England)​
Data on influenza vaccination uptake is taken weekly from
a sample of GPs in England.
Steady increasing trends have been seen since since
the start of the campaign in September 2008. In week
50/08 the proportion vaccinated in the over 65 year age
group was 72% and in the under 65 years at risk group,
the proportion vaccinated was 44.2%.
No vaccine uptake data is available for week 51/08.
It should be noted that all data is provisional.
In week 51/08 this parallel GP sentinel scheme
reported 15 out of 29 (51.7%) influenza positive
specimens; 14 influenza A and one influenza B. One
specimen was positive for another virus in the same
time period. Since week 40/08 479 specimens have
been submitted and135 (28.2%) have been positive
for influenza; 125 influenza A and ten influenza B.​
HPA CfI Virological Surveillance of Influenza
(England)
Outbreak Reports:​
Eleven respiratory outbreaks have been reported recently;
six in schools or universities (south east and south west
England, Yorkshire and the Humber and London), four in
care homes (north west and south west England and
Yorkshire and the Humber) and one in a hospital in the
South East. Four of these have been confirmed as
influenza A and some are still be investigated.
CfI welcomes reports of respiratory illness outbreaks.
Please email any reports to​
respdcsc@hpa.org.uk).

Mortality Data
Office for National Statistics​
(​
http://www.statistics.gov.uk)

The number of deaths registered in England and Wales
increased from 10,258 in week 49/08 to 11,360 in week
50/08. The number of deaths due to all respiratory
diseases (as underlying cause) increased from1447
(14.1%) in week 49/08 to 1712 (15.1%). The weekly all
cause registered deaths are shown in Figure 5. In week
50/08 it is estimated that there were approximately 500
excess deaths reported compared to previous years.​
Other Reports (UK)​
During week 51/08, seven (20%) out of 35 sentinel
samples were positive for influenza A, two for RSV and
seven for other respiratory viruses. Fifty-two routine
samples reported from hospital and community
sources were also tested; 24 (46.2%) were positive for
influenza A (one A (H1) and 22 A (H3)) and 22 were
positive for RSV. Two influenza A (H1) isolates from
Scotland this season have been found to be resistant
to oseltamivir.​
Virological data from Wales​
)

To date this season one of 30 sentinel samples (week
45/08) and 16 non-sentinel samples have been
positive for influenza A. In week 50/08 two sentinel
samples were tested; neither were positive for
influenza.​
Figure 5 : Weekly all cause registered deaths in England and Wales​
0
2 0 0 0
4 0 0 0
6 0 0 0
8 0 0 0
1 0 0 0 0
1 2 0 0 0
1 4 0 0 0
1 6 0 0 0​
4 0 4 2 4 4 4 6 4 8 5 0 5 2 2 4 6 8 1 0 1 2 1 4 1 6 1 8 2 0
W e e k N u m b e r
Number of Deaths​
O b s e r v e d
E x p e c t e d
9 5 % U p p e r L i m i t​
Data Source: The National Influenza Vaccine Uptake
Monitoring Programme (HPA/DH)​
Virological data from Scotland​
(​
http://www.show.scot.nhs.uk/scieh/)

5​
Data for this report were collated by the Influenza/
Respiratory Virus Team:
Estelle McLean, Joy Field and John Watson
Respiratory and Systemic Infections Department
HPA Centre for Infections, 61 Colindale Avenue
London NW9 5EQ, United Kingdom
Tel: (0)20 8327 7768; Fax: (0)20 8200 7868
E-mail:​
respcdsc@hpa.org.uk

Maria Zambon, Joanna Ellis, Angie Lackenby, Alison
Bermingham and Praveen Sebastianpillai
Respiratory Virus Unit, Virus Reference Department
HPA Centre for Infections, 61 Colindale Avenue
London NW9 5HT, United Kingdom
Tel: (0)20 8327 6239; Fax: (0)20 8205 8195
E-mail:​
ernvl@hpa.org.uk

If you wish to be included on our email notification list
please send your address to:​
respcdsc@hpa.org.uk

Acknowledgements​
Canada​
Public Health Agency of Canada​
(​
http://www.phac-aspc.gc.ca/fluwatch/index.html)

During week 50/08, influenza activity remained low with
the majority of the influenza surveillance regions reporting
no activity and 15 regions reporting sporadic influenza
activity and one region reporting localised activity. Overall
there was a slight increase in the consultation rates. Thirty
of 1671 (1.8%) specimens tested positive for influenza in
week 50/08. One outbreak was reported in a school.
Since 1 September 2008, 16 influenza viruses have been
characterised: one influenza A/Brisbane/59/2007(H1N1)-
like, two A/Brisbane/10/2007 (H3N2)-like, three influenza
B/Florida/4/2006-like and 10 B/Malaysia/2506/2004-like,
the latter was a component of the 2007/08 vaccine. The
influenza A (H1N1) isolate has been found to be resistant
to oseltamivir.​
Ireland​
Health Protection Surveillance Centre (HPSC)​
(​
http://www.hpsc.ie/)

In week 51/08 the Irish ILI consultation rate was
61.6 per 100,000 which was a 50% increase from
the updated rate of 38.1 per 100,000 in week 50/08.
Both rates are well over the Irish baseline threshold
of 17.8 per 100,000.
In week 51/08 six of seven (85.7%) sentinel specimens
tested positive for influenza (five influenza A
and one influenza B) and five of 69 non-sentinel
specimens tested were positive for influenza A and
15 for RSV.
This season so far two viruses have been characterised
as A/Brisbane/10/2007 (H3N2)-like.​
Other country reports can be obtained from the World
Health Organisation:​
Europe​
European Influenza Surveillance System (EISS)​
(​
www.eiss.org)

In week 50/08, four countries reported medium activity, a
further 11 reported increasing, but below baseline activity,
widespread activity was reported from England and
Portugal, regional activity in Northern Ireland, local activity
in Spain and France, sporadic activity in 11 countries and
12 reported no activity.
Out of the total 757 respiratory specimens collected by
sentinel physicians during week 50/08, 196 (25.9%)
specimens tested positive for influenza, 45 type A (not
subtyped), 135 A (H3), six A (H1) and ten type B. In addition,
159 non-sentinel specimens tested positive including
139 influenza A (not subtyped), 15 A (H3), one A (H1), and
four type B. These positive specimens were reported
from 15 countries.
Since week 40/08, 129 viruses have been characterised;
127 of these seem to be a good match to the strains
recommended for the 2008-09 vaccine, the remaining
two were B/Malaysia/2506/2004-like.​
Influenza activity outside the UK​
In week 50/08 WHO and NREVSS laboratories reported
2949 specimens tested for influenza viruses, 103 (3.5%)
of which were positive: 28 influenza A (H1), three A (H3),
48 A (not subtyped) and 24 influenza B.
Since week 40/08 69 influenza viruses have been
characterised; 49 A/Brisbane/59/2007 (H1N1)-like, 5 A/
Brisbane/10/2007 (H3N2)-like, four B/Florida/04/2006-
like, which are the components recommended for the
2008-09 vaccine, and nine from the B/Victoria lineage. Of
the 50 influenza A (H1) viruses tested this season, 49
have been found to be resistant to oseltamivir, but all are​
sensitive to zanam

http://www.hpa.org.uk/web/HPAwebFile/HPAweb_C/1230105661596
 
Re: Seasonal Flu 2008 - 2009

Neuraminidase inhibitor susceptibility testing on 73 A (H3) isolates since week 40/08 showed that all are sensitive to
oseltamivir and zanamivir but resistant to amantadine. Both of the two influenza B isolates tested since week 40/08
are sensitive to oseltamivir and zanamivir​
. Twenty-nine of 30 A (H1) specimens tested in the same time frame are
resistant to oseltamivir but sensitive to zanamivir and amantadine. The majority of these oseltamivir-resistant viruses
come from the south west of England. Two influenza A (H1) isolates have been found to be resistant to oseltamivir in

Scotland this season, one of which has been confirmed by CfI.
 
Re: Seasonal Flu 2008 - 2009

HPA Weekly National Influenza Report​
Summary of UK* surveillance of influenza and other seasonal respiratory illness​
31 December 2008 (Week 01​
)

Summary
Clinical indices of acute respiratory illness​
(England, Wales, Scotland and Northern Ireland)

The overall influenza-like illness incidence rate**
decreased from 68.5 per 100,000 in week 51/08 to 41.3
per 100,000 in week 52/08. Although this week?s data
are incomplete due to the Christmas holiday, this rate is
still above the baseline threshold of 30 per 100,000.
The rates for all three regions decreased
correspondingly. The rate in the northern region was​
*​
Incorporating data from the Royal College of General Practitioners (RCGP) (England and Wales), The National Public Health
Service for Wales (NPHS), Health Protection Scotland (HPS), Communicable Disease Surveillance Centre Northern Ireland
(CDSC Northern Ireland), the Office for National Statistics (ONS) (England and Wales), Medical Officers of Schools Association
(MOSA) (England), NHS Direct (England and Wales) and Q Surveillance (England, Northern Ireland, Scotland and Wales).

Figure 1​
: RCGP consultation rate for influenza ? like illness, 2008/09 and recent years, England and Wales

Influenza activity continues to be widespread across the UK. GP consultation rates remained above the threshold
levels in England and Scotland in week 52/08. Rates decreased in England, which may be due to the incomplete data
during the Christmas holiday period, but increased in Scotland and Wales. In Northern Ireland the consultation rate
has decreased in week 52/08 compared to last week (week 51/08) but thresholds have not yet been set. Of the
samples referred to the Centre for Infections? Respiratory Virus Unit (RVU) during week 51/08, 102 were positive for
influenza A; four A (H1) and 98 A (H3), and five for influenza B. Other NHS and HPA laboratories in England and Wales
reported 145 influenza A and ten influenza B positive specimens in week 52/08. Twenty-four Scottish and 14 Northern
Irish influenza positive specimens were reported in week 52. One outbreak of respiratory illness was reported
recently in a care home in England. The proportion of people over 65 years who have received this season?s influenza
vaccine was 72% in week 50/08, and 44.2% in those aged under 65 years in risk groups. Characterisation of 218
influenza viruses since week 40/08 by RVU have shown that the majority of circulating strains are well-matched by the
current influenza vaccine. Influenza activity is reported to be increasing throughout the rest of Europe with one country
reporting ? high? level and four countries reporting ?medium? levels of influenza activity in week 51/08.​
England and Wales​
Royal College of General Practitioners​
(​
http://www.rcgp.org.uk/bru/index.asp)

Covered in this report:​
Data, except that from ONS, MOSA and non-UK sources: 22/12/08 - 28/12/08 (Week 52, 2008 )
Data from ONS, MOSA and non-UK sources: 15/12/08 - 21/12/08 (Week 51, 2008)​
** RCGP incidence rates in this report only refer to first or new episodes of infection diagnosed by a GP.
Neuraminidase inhibitor susceptibility testing was not carried out during this Christmas - New Year holiday period.​
Antiviral drug susceptibility testing​
lowest at 21.4 per 100,000. The highest rate in week 52/
08 was in the south region at 46.7 per 100,000 and in
the central the rate was 43.7 per 100,000. The rates
were highest in the 15-44 year age group at 46.4 per
100,000 and in the 45-64 year age group at 43.3 per
100,000 in week 52/08 (Figure 2).
The rate for acute bronchitis decreased for this week
(52/08) as well to 133.7 compared to 218.7 per 100,000
in week 51/08. The highest rate is now in the under one
year group at 487.6 per 100,000 in week 52/08.​
2​
0
2 5
5 0
7 5
1 0 0
1 2 5
1 5 0
1 7 5
2 0 0
2 2 5
4 0 4 2 4 4 4 6 4 8 5 0 5 2 2 4 6 8 1 0 1 2 1 4 1 6 1 8 2 0​
W e e k​
Rate per 100 000 population​
E n g l a n d ( R C G P )
S c o t l a n d ( H P S )
W a l e s ( N P H S )
N o r t h e r n I r e l a n d ( C D S C N I )​
Figure 3​
: GP Consultation rates for influenza/influenza-like illness in the U.K

QSurveillance​
HPA and Nottingham University Division of Primary
Care.​
(​
http://www.qresearch.org)

Northern Ireland​
CDSC Northern Ireland​
(​
http://www.cdscni.org.uk/)

The combined rate for influenza and influenza-like illness
decreased from 196.5 (updated rate) per 100,000 in week
51/08 to 136.3 per 100,000 in week 52/08 (Figure 3). No
threshold has been set for Northern Ireland.
This primary care surveillance system uses
QSurveillance, a database of general practice derived
data. During week 52/08, over 3200 practices reported
from England, Wales, Scotland and Northern Ireland
covering a population of over 21 million. The rate of
influenza-like illness decreased from 42.6 per 100,000
in week 51/08 to 25.0 per 100,000 in week 52/08. The
highest rates are in the 25-44 and 45-64 year age groups.
The rates were highest in Northern Ireland, London, S E
Coast and South West.​
NHS Direct total call activity​
England and Wales​
(​
http://www.nhsdirect.nhs.uk/)

The proportions of cold/flu and fever calls were over the
baseline and were still increasing in week 51/08. No data
available for week 52/08 due to technical problems.​
Wales​
National Public Health Service​
(​
http://www.wales.nhs.uk/sites/home.cfm?OrgID=368)

GP consultation rates for influenza increased from 15.6
per 100,000 in week 51/08 to 21.5 per 100,000 in week
52/08. Both figures are below the baseline threshold of
25 consultations per 100,000 (Figure 3).​
Figure 2​
: RCGP Episode incidence rates for influenza-like illness (ILI) by age group, England and Wales.

0
1 0
2 0
3 0
4 0
5 0
6 0
7 0
8 0
9 0
1 0 0
4 0 4 2 4 4 4 6 4 8 5 0 5 2 2 4 6 8 1 0 1 2 1 4 1 6 1 8 2 0​
W e e k
Rate per 100 000 population
0 - 1
1 - 4
5 - 1 4
1 5 - 4 4
4 5 - 6 4
6 5 - 7 4
> 7 5​
Medical Officers of Schools Association
(MOSA)​
There is no data for weeks 49, 50, 51 and 52/08 as the
school students are on holiday​
Scotland​
Health Protection Scotland​
(​
http://www.hps.scot.nhs.uk/)

GP consultation rates for influenza increased from 65.0
per 100,000 in week 51/08 to 73.0 per 100,000 in week
52/08(Figure 3). This exceeds the Scottish baseline
threshold of 50 consultations per 100,000.​
3​
Respiratory Virus Unit (RVU) Influenza Reference
Laboratory, CfI​
One hundred and nine specimens tested positive for
influenza in week 52/08 (Table 1). Since week 40/08 218
viruses have been characterised: 26 A (H1) Brisbane/59/
2007 (H1N1)-like, 183 A (H3) A/Brisbane/10/2007 (H3N2)-
like, one B/Florida/4/2006-like which are all vaccine strains,
and eight B/Malaysia/2506/2004-like.​
70.7% of
specimens from the RCGP surveillance scheme were
positive for influenza in week 52/08, this is above the
threshold of 30% (figure 4).

Neuraminidase inhibitor susceptibility testing was not
carried out during this Christmas - New Year holiday period
and this work will resume next week. Results between
week 40/08 - 51/08 were summarized in our last week?s
report.​
* RSV detection is by PCR only​
Other NHS and HPA laboratories (England and
Wales)​
The number of specimens positive for influenza A has
increased from 131 in week 51/08 to 145 in week 52/
08 and the number of influenza B positives increased
from 2 in week 51/08 to 10 in week 52/08, and the
number of RSV positives slightly increased (from 327
to 333) in the same time period. To date, a higher
number of influenza A positive specimens have come
from central and southen England. (Table 2).
Please note that these data are provisional.​
Laboratory indices of acute respiratory illness​
*​
Detections of RSV by isolation are not included.

Table 1 ?Detections? (PCR and isolation) of influenza and
RSV made by RVU (CfI) Reference Laboratory.
Samples from community and hospital sources,
by week of report.​
7 109 8 2
7 182 2 7
28 357 13 23
2 3 0 0
1 2 0 0
0 5 0 0​
45 658 23 32
Influenza Detections by
PCR and Isolation
A (H1) A (H3) B RSV*
Cumulative to date
Northern England
Central England
Southern England
Wales
Scotland
Northern Ireland
Cumulative Total
Influenza type ( subtype)
Week 51/08
Week 52/08
(week 40/08 ? 52/08) 356 336 3922​
Table 2 ??Detections? (isolation, PCR, direct
immunofluorescence and paired sera tests) of
influenza and RSV reported to CfI by NHS and
HPA microbiology laboratories. Data for England
and Wales by RCGP region, by week of report​
Week 51/08
Week 52/08
Cumulative to Date
(week 40/08 - 52/08)
Northern England
Central England
Southern England
Wales
Cumulative Total​
Detection (isolates, DIF and PCR)​
Influenza A Influenza B RSV*​
131 2 327
145 10 333​
167 13 1183
179 4 469
184 4 1473
28 0 235​
558 21 3360​
3 145 8 1
4 98 5 2​
Figure 4 : Proportion of RCGP specimens positive for influenza detected (PCR and Isolation) by RVU,CfI, by week of
specimen​
0
1 0
2 0
3 0
4 0
5 0
6 0
7 0
4 0 4 2 4 4 4 6 4 8 5 0 5 2 2 4 6 8 1 0 1 2 1 4 1 6 1 8 2 0
W e e k​
Percentage positive​
% I n f l u e n z a B
% I n f l u e n z a A ( H 1 )
% I n f l u e n z a A ( H 3 )​
4​
Avian Influenza​
The WHO continues to monitor and report on new cases
of human infection with A(H5N1) avian influenza when
they occur. Since 16 December there have been no further
cases of avian influenza confirmed by WHO.
According to WHO, the total number of confirmed human
infections worldwide with H5N1, since December 2003,
is 391 of which 247 (63%) have died.​
Useful links:​
Situation updates from WHO (human):​
Situation summary from the HPA (avian and human):​
Virological data from Northern Ireland​
(​
http://www.cdscni.org.uk/)

Twenty-five sentinel samples were tested in week 52/
08 of which 14 (56%) were positive for influenza (13 A
and one B). Of the 44 non-sentinel samples tested,
six (18.2%) were positive for influenza (five A and one
B) and 21 for RSV.​
Flu Vaccination Campaign 2008/09 (England)​
Data on influenza vaccination uptake is taken weekly from
a sample of GPs in England.
Steady increasing trends have been seen since since
the start of the campaign in September 2008. In week
50/08 the proportion vaccinated in the over 65 year age
group was 72% and in the under 65 years at risk group,
the proportion vaccinated was 44.2%.
No vaccine uptake data is available for weeks 51 and 52/
08. It should be noted that all data is provisional.
No data available for week 52/08 from this parallel GP
sentinel scheme. Week 51/08 data were reported in
our last week?s report. Between week 40/08 and 51/
08, 479 specimens have been submitted and135
(28.2%) have been positive for influenza; 125 influenza
A and ten influenza B.​
HPA CfI Virological Surveillance of Influenza
(England)
Outbreak Reports:​
One respiratory outbreak has been reported recently
which occurred in a care home in West Yorkshire,
England and laboratory testing results for this outbreak
are still awaited.
CfI welcomes reports of respiratory illness outbreaks.
Please email any reports to​
respdcsc@hpa.org.uk).

Mortality Data
Office for National Statistics​
(​
http://www.statistics.gov.uk)

The data for the number of deaths registered in England
and Wales for week 51 are not available during the
Christmas - New Year period. Previous data up to week
50/08 were summarised in our last week?s report. The
weekly all cause registered deaths up to week 50/08
are shown in Figure 5.​
Other Reports (UK)​
During week 52/08, twenty three (47%) out of 49
sentinel samples were positive for influenza A including
17 A(H3) and three of the influenza A (H3) cases were
also positive for other respiratory viruses. One influenza
B positive case was also infected with corona virus;
two further samples were positive for RSV; three
samples were positive for rhinovirus. Seventy-seven
routine samples reported from hospital and community
sources were also tested; 31 (40.3%) were positive for
influenza A (four A (H1) and 27 A (H3)), one influenza B
and 55 were positive for RSV.​
Virological data from Wales​
)

To date this season seven of 44 sentinel samples and
28 non-sentinel samples have been positive for
influenza A. In week 51/08 12 sentinel samples were
tested and five of these were positive for influenza.​
Figure 5 : Weekly all cause registered deaths in England and Wales​
0
2 0 0 0
4 0 0 0
6 0 0 0
8 0 0 0
1 0 0 0 0
1 2 0 0 0
1 4 0 0 0
1 6 0 0 0​
4 0 4 2 4 4 4 6 4 8 5 0 5 2 2 4 6 8 1 0 1 2 1 4 1 6 1 8 2 0
W e e k N u m b e r
Number of Deaths​
O b s e r v e d
E x p e c t e d
9 5 % U p p e r L i m i t​
Data Source: The National Influenza Vaccine Uptake
Monitoring Programme (HPA/DH)​
Virological data from Scotland​
(​
http://www.show.scot.nhs.uk/scieh/)

5​
Data for this report were collated by the Influenza/
Respiratory Virus Team:
Hongxin Zhao, Joy Field and John Watson
Respiratory and Systemic Infections Department
HPA Centre for Infections, 61 Colindale Avenue
London NW9 5EQ, United Kingdom
Tel: (0)20 8327 7768; Fax: (0)20 8200 7868
E-mail:​
respcdsc@hpa.org.uk

Maria Zambon, Joanna Ellis, Angie Lackenby, Alison
Bermingham and Praveen Sebastianpillai
Respiratory Virus Unit, Virus Reference Department
HPA Centre for Infections, 61 Colindale Avenue
London NW9 5HT, United Kingdom
Tel: (0)20 8327 6239; Fax: (0)20 8205 8195
E-mail:​
ernvl@hpa.org.uk

If you wish to be included on our email notification list
please send your address to:​
respcdsc@hpa.org.uk

Acknowledgements​
Canada​
Public Health Agency of Canada​
(​
http://www.phac-aspc.gc.ca/fluwatch/index.html)

During week 51/08, influenza activity remained low with
the majority of the influenza surveillance regions reporting
no activity and 11 regions reporting sporadic influenza
activity. Overall there was a slight increase in the
consultation rates. Thirty two of 2383 (1.3%) specimens
tested positive for influenza in week 51/08. No outbreak
was reported in week 51/08.
Since 1 September 2008, 20 influenza viruses have been
characterised: three influenza A/Brisbane/59/
2007(H1N1)-like, two A/Brisbane/10/2007 (H3N2)-like,
three influenza B/Florida/4/2006-like and 12 B/Malaysia/
2506/2004-like, the latter was a component of the 2007/
08 vaccine. Six influenza A (H1N1) isolates have been
tested and found to be resistant to oseltamivir.​
Ireland​
Health Protection Surveillance Centre (HPSC)​
(​
http://www.hpsc.ie/)

In week 52/08 the Irish ILI consultation rate increased
to 72.8 from the updated rate of 61 per
00,000 population in week 51/08. Both rates are
well above the Irish baseline threshold of 17.8 per
100,000 population.
No virological data for week 52/08 are available as
yet.​
Other country reports can be obtained from the World
Health Organisation:​
Europe​
European Influenza Surveillance System (EISS)​
(​
www.eiss.org)

In week 51/08,​
influenza activity reached high intensity
in Portugal and medium intensity in Bulgaria, Ireland,
Spain and the UK (England and Northern Ireland).
Geographical spread was reported as local in France
and Switzerland, regional in Spain and Wales, and
widespread in England, Northern Ireland and Portugal.
Given the current epidemiological and virological
situation it is anticipated that in the coming weeks
seasonal influenza activity will increase in a number
of European countries.

Out of the total 1062 respiratory specimens collected by
sentinel physicians during week 51/08, 346 (32.6%)
specimens tested positive for influenza, 105 type A (not
subtyped), 223 A (H3), six A (H1) and 12 type B. In addition,
354 non-sentinel specimens tested positive including
310 influenza A (not subtyped), 27 A (H3), four A (H1), and
13 type B. These positive specimens were reported from
21countries.
Since week 40/08, 234 viruses have been characterised;
226 of these seem to be a good match to the strains
recommended for the 2008-09 vaccine, the remaining
eight were B/Malaysia/2506/2004-like.​
Influenza activity outside the UK​
In week 51/08 WHO and NREVSS laboratories reported
3035 specimens tested for influenza viruses, 103 (3.4%)
of which were positive: 22 influenza A (H1), three A (H3),
55 A (not subtyped) and 23 influenza B.
Since week 40/08 85 influenza viruses have been
characterised; 49 A/Brisbane/59/2007 (H1N1)-like, seven
A/Brisbane/10/2007 (H3N2)-like, nine B/Florida/04/2006-
like, which are the components recommended for the
2008-09 vaccine, and 20 from the B/Victoria lineage. Of
the 65 influenza A (H1) viruses tested this season, 64
have been found to be resistant to oseltamivir, but all are​
sensitive to zanamivir


http://www.hpa.org.uk/web/HPAwebFile/HPAweb_C/1230713150603
 
Back
Top