Re: Seasonal Flu 2008 - 2009
<TABLE cellSpacing=0 cellPadding=0 width="100%" border=0><TBODY><TR><TD>
November 2, 2008 to November 8, 2008 (Weeks 45)
</TD></TR></TBODY></TABLE><!-- ################################################# --><!-- START Menu container | DEBUT de conteneur du menu --><!-- FlUWATCH 2008-2009 RIGHT NAV SSI START --><!-- SIDE MENU TITLE BEGINS | DEBUT DU TITRE DU MENU LATERAL --><!-- ############################################################################ --><!-- START right Navigation container FlUWATCH | DEBUT du conteneur de la navigation droit Surveillance de l'influenza-->
<!-- START expandable header | DEBUT de l'en-tête extensible --><!-- END expandable header | FIN de l'en-tête extensible --><!-- START expandable content | DEBUT du contenu extensible -->
Fluwatch
<!-- Start Submenu -->
- <A class=nav href="http://www.phac-aspc.gc.ca/fluwatch/08-09/w45_08/index-eng.php#map"><ACRONYM title="Influenza-like illness">ILI</ACRONYM> activity by province
Other information
<!-- END expandable content | FIN du contenu extensible --><!-- START footer | DEBUT le bas de la boîte --><!-- -->
<!-- END footer | FIN le bas de la boîte -->
<!-- END right Navigation container FlUWATCH| FIN du conteneur de la navigation droit Surveillance de l'influenza --><!-- ######################################################################## --><!-- FlUWATCH RIGHT SSI END --><!-- END Menu container | FIN de conteneur du menu --><!-- ############################################# --><!-- CONTENT TITLE BEGINS | DEBUT DU TITRE DU CONTENU -->
PDF Version
Low levels of influenza activity continue to be reported in Canada; slight increases in lab detections and ILI consultation rates reported this week
During week 45, influenza activity in Canada remained low with the majority of the influenza surveillance regions reporting no activity and only six regions (in BC, AB, ON & QC ) reported sporadic influenza activity (
see map). Seven specimens tested positive for influenza in Canada this week (percentage positive = 0.5%; 7/1,512) (
see table). In week 45, the ILI consultation rate increased to 11 ILI consultations per 1,000 patient visits (
see ILI graph), and is below the expected range for this week. The sentinel response rate remained low at 42%; however, sentinel participation is expected to increase as the influenza season progresses. Fluctuations in ILI consultation rates are expected during periods of low influenza activity and low sentinel participation. No new influenza outbreaks were reported in week 45.
Antigenic Characterization & Antiviral Resistance:
Since 1 September 2008, National Microbiology Laboratory (NML) has antigenically characterized five influenza viruses: one influenza A/Brisbane/10/2007(H3N2)-like (from BC), one influenza A/Brisbane/59/2007(H1N1)-like (from NS), two influenza B/Florida/4/2006-like (from ON and AB) and one B/Malaysia/2506/2004-like (from AB). A/Brisbane/10/2007(H3N2), A/Brisbane/59/2007(H1N1) and B/Florida/4/2006 are the influenza A and influenza B components recommended for the 2008-09 influenza vaccine. B/Malaysia/2506/2004 was the influenza B component for the 2007-2008 season vaccine (
see pie chart).
Antiviral Resistance:
Since the start of the season, the NML has tested 2 influenza A isolates (1 H1N1 and 1 H3N2) for amantadine resistance and found that the H3N2 isolate was resistant to amantadine and the H1N1 isolate was susceptible; resulting in 50% (1/2) resistance among all influenza A isolates tested.
The NML has also tested 5 influenza isolates (1 A/H1N1, 1 A/H3N2 & 3 B) for oseltamivir (Tamiflu) resistance and found that the H1N1 isolate tested was resistant to oseltamivir due to the H274Y mutation whereas the H3N2 and B isolates were susceptible; resulting in 20% (1/5) resistance among all influenza isolates tested.
Influenza-associated Paediatric Hospitalizations:
No laboratory-confirmed influenza-associated paediatric hospitalizations have been reported through the Immunization Monitoring Program Active (IMPACT) network for the 2008-09 season.
International:
<!--
WHO: Influenza activity in the southern hemisphere continued to decline in weeks 43-44. Activity was low elsewhere, with some countries reporting sporadic activity.
- <a href="http://www.who.int/csr/disease/influenza/update/en/" rel="x"><acronym title="World Health Organization">WHO</acronym>
-->
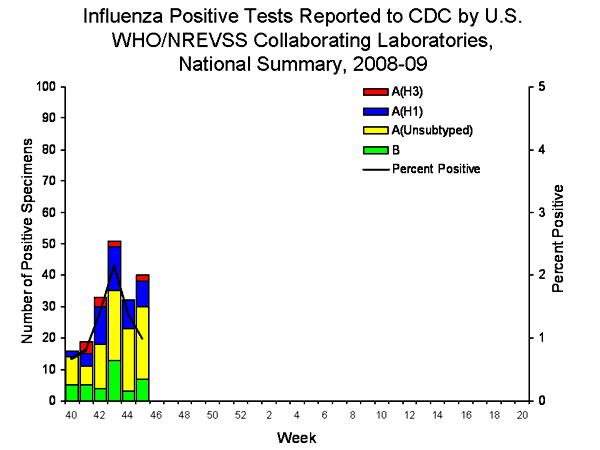
CDC: During week 44, a low level of influenza activity was reported in the United States with the majority of the states reporting no activity and several more states reporting sporadic activity compared to the previous week. Of the 1,780 specimens tested this week for influenza viruses, 11 (0.6%) were positive. Since 1 October 2008, the CDC has antigenically characterized one influenza virus: B/Florida/04/2006-like.
- <A href="http://www.cdc.gov/flu/weekly/" target=_blank rel=x><ACRONYM title="Centers for Disease Control and Prevention ">CDC</ACRONYM>
EISS: Levels of influenza activity were low in all European countries, however an increasing number of countries reported sporadic influenza virus detections compared to previous weeks. The majority (89%) of virus detections have been influenza A and 72% of those subtyped were shown to be A/H3. Limited data are available on antiviral resistance: 83% (5/6) of the influenza A(H1N1) viruses analysed to date are resistant to oseltamivir. Note that reports of RSV detections are increasing in several countries in Europe; however the increase in those countries is normal at this time of the year.
- <A href="http://www.eiss.org/cgi-files/bulletin_v2.cgi" target=_blank rel=x><ACRONYM title=" European Influenza Surveillance Scheme">EISS</ACRONYM>
Human Avian Influenza: No new cases of human H5N1 avian influenza infection have been reported by the WHO since 10 September 2008.
- <A href="http://www.who.int/csr/disease/avian_influenza/en/index.html" target=_blank rel=x><ACRONYM title="World Health Organization">WHO</ACRONYM>
<HR>
Total number of influenza tests performed and number of positive tests by province/territory of testing laboratory, Canada, 2008-2009
<TABLE id=fluwatchtable cellSpacing=0 cellPadding=2 width="100%" border=1><TBODY><TR class=bg-colour-blue vAlign=top><TD class=alignCenter rowSpan=3>
Province of
reporting
laboratories </TD><TD class=alignCenter vAlign=bottom colSpan=4>
Report Period:
November 2, 2008 to November 8, 2008</TD><TD class=alignCenter vAlign=bottom colSpan=4>
Season to Date:
August 24, 2008 to November 8, 2008</TD></TR><TR class=bg-colour-blue><TD class=alignCenter rowSpan=2>
Total #
Influenza
Tests </TD><TD class=alignCenter colSpan=3>
# of Positive Tests </TD><TD class=alignCenter rowSpan=2>
Total #
Influenza
Tests</TD><TD class=alignCenter colSpan=3>
# of Positive Tests </TD></TR><TR class=bg-colour-blue vAlign=top><TD class=alignCenter vAlign=center>
Influenza A</TD><TD class=alignCenter vAlign=center>
Influenza B</TD><TD class=alignCenter vAlign=center>
Total </TD><TD class=alignCenter vAlign=center>
Influenza A</TD><TD class=alignCenter vAlign=center>
Influenza B</TD><TD class=alignCenter vAlign=center>
Total </TD></TR><TR><TD class=bg-colour-blue>
NL
</TD><TD class=alignCenter>7</TD><TD class=alignCenter>0</TD><TD class=alignCenter>0</TD><TD class=alignCenter>0</TD><TD class=alignCenter>57</TD><TD class=alignCenter>0</TD><TD class=alignCenter>0</TD><TD class=alignCenter>0</TD></TR><TR><TD class=bg-colour-blue>
PE
</TD><TD class=alignCenter>5</TD><TD class=alignCenter>0</TD><TD class=alignCenter>0</TD><TD class=alignCenter>0</TD><TD class=alignCenter>22</TD><TD class=alignCenter>0</TD><TD class=alignCenter>0</TD><TD class=alignCenter>0</TD></TR><TR><TD class=bg-colour-blue>
NS
</TD><TD class=alignCenter>13</TD><TD class=alignCenter>0</TD><TD class=alignCenter>0</TD><TD class=alignCenter>0</TD><TD class=alignCenter>113</TD><TD class=alignCenter>1</TD><TD class=alignCenter>0</TD><TD class=alignCenter>1</TD></TR><TR><TD class=bg-colour-blue>
NB
</TD><TD class=alignCenter>4</TD><TD class=alignCenter>0</TD><TD class=alignCenter>0</TD><TD class=alignCenter>0</TD><TD class=alignCenter>50</TD><TD class=alignCenter>0</TD><TD class=alignCenter>0</TD><TD class=alignCenter>0</TD></TR><TR><TD class=bg-colour-blue>
QC
</TD><TD class=alignCenter>419</TD><TD class=alignCenter>4</TD><TD class=alignCenter>0</TD><TD class=alignCenter>4</TD><TD class=alignCenter>2652</TD><TD class=alignCenter>11</TD><TD class=alignCenter>1</TD><TD class=alignCenter>12</TD></TR><TR><TD class=bg-colour-blue>
ON
</TD><TD class=alignCenter>441</TD><TD class=alignCenter>0</TD><TD class=alignCenter>0</TD><TD class=alignCenter>0</TD><TD class=alignCenter>3488</TD><TD class=alignCenter>0</TD><TD class=alignCenter>2</TD><TD class=alignCenter>2</TD></TR><TR><TD class=bg-colour-blue>
MB
</TD><TD class=alignCenter>45</TD><TD class=alignCenter>0</TD><TD class=alignCenter>0</TD><TD class=alignCenter>0</TD><TD class=alignCenter>434</TD><TD class=alignCenter>0</TD><TD class=alignCenter>0</TD><TD class=alignCenter>0</TD></TR><TR><TD class=bg-colour-blue>
SK
</TD><TD class=alignCenter>73</TD><TD class=alignCenter>0</TD><TD class=alignCenter>0</TD><TD class=alignCenter>0</TD><TD class=alignCenter>685</TD><TD class=alignCenter>0</TD><TD class=alignCenter>0</TD><TD class=alignCenter>0</TD></TR><TR><TD class=bg-colour-blue>
AB
</TD><TD class=alignCenter>469</TD><TD class=alignCenter>0</TD><TD class=alignCenter>2</TD><TD class=alignCenter>2</TD><TD class=alignCenter>3685</TD><TD class=alignCenter>1</TD><TD class=alignCenter>6</TD><TD class=alignCenter>7</TD></TR><TR><TD class=bg-colour-blue>
BC
</TD><TD class=alignCenter>36</TD><TD class=alignCenter>1</TD><TD class=alignCenter>0</TD><TD class=alignCenter>1</TD><TD class=alignCenter>279</TD><TD class=alignCenter>1</TD><TD class=alignCenter>0</TD><TD class=alignCenter>1</TD></TR><TR><TD class=bg-colour-blue>
Canada
</TD><TD class=alignCenter>1512</TD><TD class=alignCenter>5</TD><TD class=alignCenter>2</TD><TD class=alignCenter>7</TD><TD class=alignCenter>11465</TD><TD class=alignCenter>14</TD><TD class=alignCenter>9</TD><TD class=alignCenter>23</TD></TR></TBODY></TABLE>
Specimens from NT, YT, and NU are sent to reference laboratories in other provinces.
Note: Cumulative data includes updates to previous weeks; due to reporting delays, the sum of weekly report totals do not add up to cumulative totals.
Abbreviations: Newfoundland/Labrador (NL), Prince Edward Island (PE), New Brunswick (NB), Nova Scotia (NS), Quebec (QC), Ontario (ON), Manitoba (MB), Saskatchewan (SK), Alberta (AB), British Columbia (BC), Yukon (YT), Northwest Territories (NT), Nunavut (NU)
Respiratory virus laboratory detections in Canada, by geographic regions, are available weekly on the following website:
<http://www.phac-aspc.gc.ca/bid-bmi/dsd-dsm/rvdi-divr/index-eng.php>
 Number of influenza surveillance regions? reporting widespread or localized influenza activity, Canada, by report week, 2008-2009 (N=54)
? sub-regions within the province or territory as defined by the provincial/territorial epidemiologist. Graph may change as late returns come in.
<TABLE width="100%"><TBODY><TR vAlign=top align=middle><TD colSpan=2>
Influenza Activity Level by Provincial and Territorial
Influenza Surveillance Regions, Canada,
November 2, 2008 to November 8, 2008 (Week 45)
</TD></TR><TR vAlign=top align=middle><TD class=alignCenter>

</TD><TD><TABLE cellSpacing=0 cellPadding=1 border=0><TBODY><TR><TD align=middle><TABLE class=border-lite cellSpacing=1 cellPadding=1><TBODY><TR align=middle><TD>
No Data </TD><TD>
</TD></TR><TR align=middle><TD>
No Activity</TD><TD>
</TD></TR><TR align=middle><TD>
Sporadic Activity</TD><TD>
</TD></TR><TR align=middle><TD>
Localized Activity</TD><TD>
</TD></TR><TR align=middle><TD>
Widespread
Activity</TD><TD>
</TD></TR></TBODY></TABLE></TD></TR></TBODY></TABLE></TD></TR></TBODY></TABLE>
Note: Influenza activity levels, as represented on this map, are assigned and reported by Provincial and Territorial Ministries of Health,
based on laboratory confirmations, sentinel ILI rates (see graphs and tables) and outbreaks. Please refer to detailed
definitions. For areas where no data is reported, late reports from these provinces and territories will appear on the
FluWatch website. Select single maps by report week to get this updated information.
<
http://dsol-smed.phac-aspc.gc.ca/dsol-smed/fluwatch/fluwatch.phtml?lang=e>
Click on the map to view provinces/territories and maps for other weeks.
Influenza tests reported and percentage of tests positive, Canada, by report week, 2008-2009
Percent positive influenza tests, compared to other respiratory viruses, Canada, by reporting week, 2008-2009
Influenza strain characterization, Canada, cumulative, 2008-2009 influenza season by the Respiratory Viruses Section at the National Microbiology Laboratory
[N=5]
{Strain characterization, number identified, per cent of total number}
NACI recommends that the trivalent vaccine for the 2008-2009 season in Canada contain A/Brisbane/59/2007 (H1N1)-like virus; an A/Brisbane/10/2007 (H3N2)-like virus; and a B/Florida/4/2006-like virus.
Influenza-like illness (ILI) consultation rates, Canada, by report week,
2008-2009 compared to 1996/97 through to 2006/07 seasons
Note: No data available for mean rate in previous years for weeks 19 to 39 (1996-1997 through 2002-2003 seasons).
Number of New Outbreaks in Long Term Care Facilities, Canada, by Report Week, 2008-2009
Please note that the above graphs may change as late returns come in.
Single Maps |
Dual Maps |
Animated Maps |
FluWatch Reports
Definitions for the 2008-2009 season
<!-- InstanceEndEditable --><!-- CONTENT ENDS | FIN DU CONTENU --><!-- ONE COLUMN LAYOUT ENDS | FIN DE LA MISE EN PAGE D'UNE COLONNE --><!-- FOOTER BEGINS | DEBUT DU PIED DE LA PAGE -->



 27CDB6E-AE6D-11cf-96B8-444553540000>


