• FluTrackers.com Inc. does not provide medical advice. Information on this web site is collected from various internet resources, and the FluTrackers board of directors makes no warranty to the safety, efficacy, correctness or completeness of the information posted on this site by any author or poster. The information collated here is for instructional and/or discussion purposes only and is NOT intended to diagnose or treat any disease, illness, or other medical condition. Every individual reader or poster should seek advice from their personal physician/healthcare practitioner before considering or using any interventions that are discussed on this website. By continuing to access this website you agree to consult your personal physican before using any interventions posted on this website, and you agree to hold harmless FluTrackers.com Inc., the board of directors, the members, and all authors and posters for any effects from use of any medication, supplement, vitamin or other substance, device, intervention, etc. mentioned in posts on this website, or other internet venues referenced in posts on this website.
  • We are not asking for any donations. Do not donate to any entity who says they are raising funds for us.

Region V Water Issues Wisconsin, In., Ill., Min., Mich., Ohio

kiwibird

Editor, Senior Moderator
Wisconsin
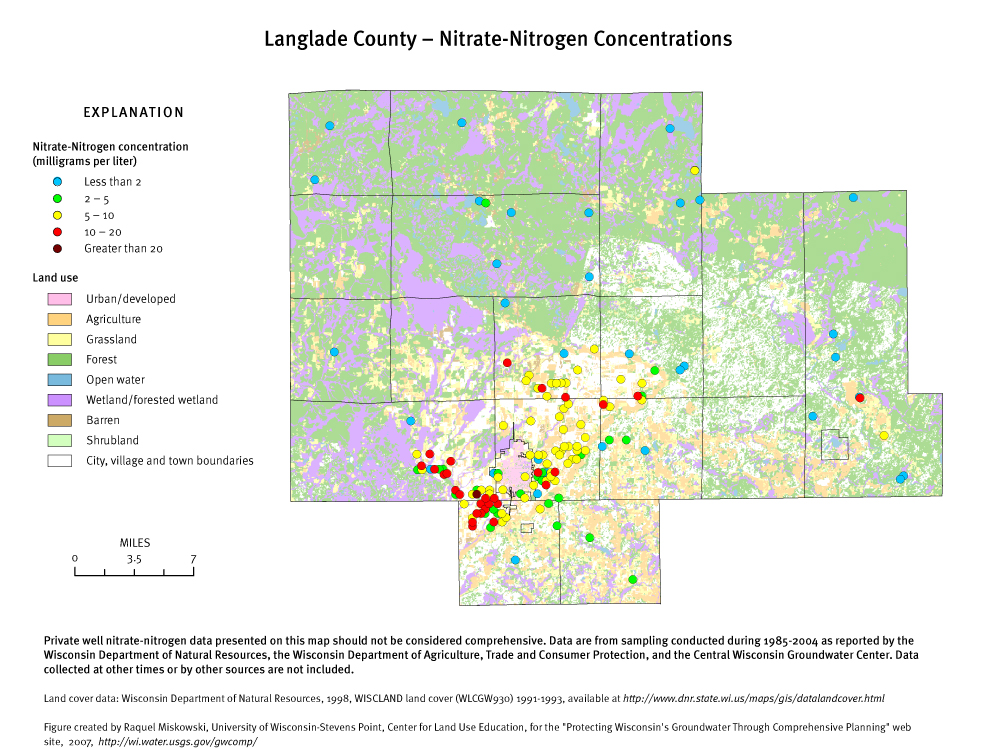
langlade_nitrate.jpg

8 cases of methemoglobinemis in Wisconsin between 1990 and 1999:
http://www.wisconsinmedicalsociety.o...-Knobeloch.pdf

Dunn County, Wisconsin
%7B02BA47C3-89D6-464B-873B-F2894674D449%7D.JPG
http://dunncountywi.govoffice2.com/vertical/Sites/%7B8D65D186-760D-414B-890C-7C4376A23107%7D/uploads/%7B02BA47C3-89D6-464B-873B-F2894674D449%7D.JPG

Portage, Wisconsin
no3map6.jpg

http://www.co.portage.wi.us/Groundwater/undrstnd/Images/no3map6.jpg
 
Re: Region V Water Issues Wisconsin Milwaukee..

Re: Region V Water Issues Wisconsin Milwaukee..

Milwaukee
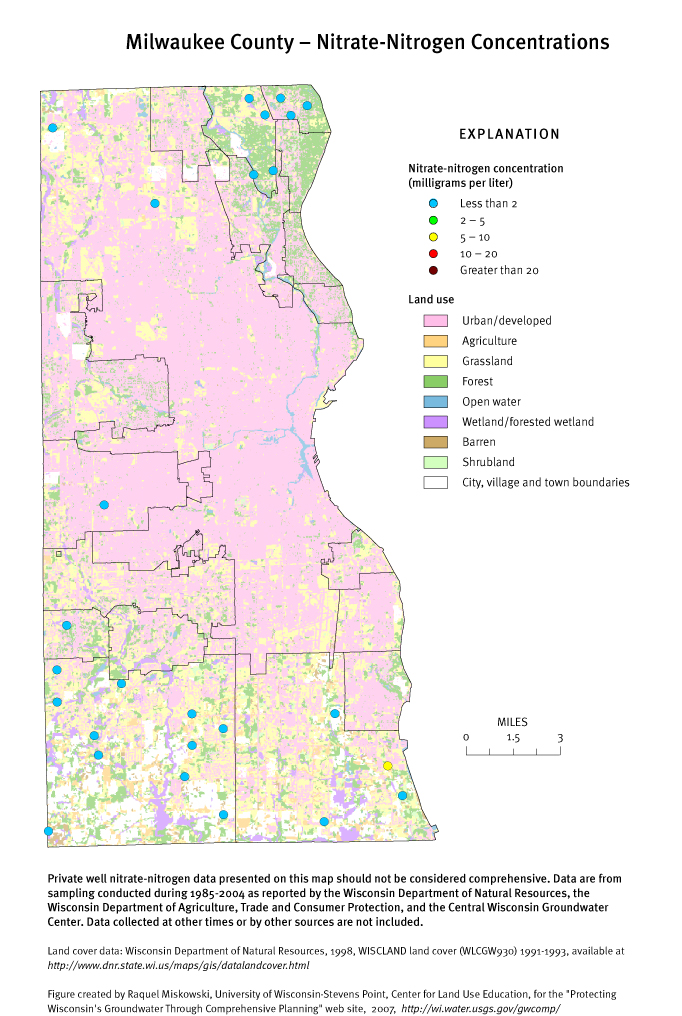
Re: Nitrate levels - by region <hr style="color: rgb(204, 204, 204); background-color: rgb(204, 204, 204);" size="1"> <!-- / icon and title --> <!-- message --> <table border="0" cellpadding="5" cellspacing="0"> <tbody><tr> <td colspan="2"> <hr align="center" color="#d6ca9a" width="100%"></td> </tr> <tr> <td width="414">Milwaukee County</td> <td width="330"></td> </tr> <tr> <td colspan="2"><hr align="center" color="#d6ca9a" width="100%"></td> </tr> <tr><td colspan="2" class="taborange"> NITRATE-NITROGEN CONCENTRATIONS</td></tr> <tr><td colspan="2">Nitrate-nitrogen maps were revised in March 2008. The revision corrected an error in data presentation; no changes were made to the underlying data.
</td></tr> <tr> <td colspan="2"><center>
milwaukee_nitrate.jpg
</center> </td> </tr> <tr> <td colspan="2"><hr align="center" color="#d6ca9a" width="99%"></td> </tr> </tbody></table>
Milwaukee_Map.jpg

Milwaukee #5 in the cyanosis thread!
 
Re: Region V Water Issues Wisconsin Milwaukee..

Re: Region V Water Issues Wisconsin Milwaukee..

Minnesota;

Counties with Nitrate Probability Maps Available
Benton County

Map (1 page/47 KB)
Report (22 pages/399 KB)
Brown County

Map (1 page/56 KB)
Report (22 pages/283 KB)
Cass County

Map (1 page/44 KB)
Report (23 pages/320 KB)
Cottonwood County Map (1 page/47 KB)
Report (22 pages/337 KB)
Crow Wing County Map (1 page/57)
Report (22 pages/422 KB)
Hubbard County Map (1 page/45 KB)
Report (21 pages/350 KB)
Morrison County Map (1 page/67 KB)
Report (21 pages/531 KB)
Nicollet County Map (1 page/54 KB)
Report (22 pages/302 KB)
Otter Tail County Map (1 page/88 KB)
Report (22 pages/583 KB)
Sherburne County Map (1 page/70 KB)
Report (21 pages/502 KB)
Stearns County Map (1 page/89 KB)
Report (22 pages/664 KB)
Todd County Map (1 page/44 KB)
Report (21 pages/359 KB)
Wadena County Map (1 page/45 KB)
Report (21 pages/335 KB)
Washington County Map (1 page/559 KB)
Report (29 pages/2684 KB)

Winona County
Map (1 page/82 KB)
Report (26 pages/633 KB)
Wright County Map (1 page/54 KB)
Report (21 pages/502 KB)
http://images.google.co.nz/imgres?i...&sa=N&start=20&um=1&ei=5Y2xSrWlFYri-Qakl5jRDQ
Apologies, have not been able to copy individual county maps. Please follow link. Nicollete County: http://images.google.co.nz/imgres?i...&sa=N&start=20&um=1&ei=5Y2xSrWlFYri-Qakl5jRDQ
 
Re: Region V Water Issues Wisconsin Milwaukee..

Re: Region V Water Issues Wisconsin Milwaukee..

Hi Kiwibird,
You mentioned that Milwaukee is #5 in the "cyanosis thread"...I'm a flubie newbie :) Could you explain just a tiny bit further, please? I've been wondering for awhile why Milwaukee had such a high rate of h1n1, but could never find an answer. I assumed it had something to do with arsenic levels...any further direction would be much appreciated!
Thanks!
 
Re: Region V Water Issues Wisconsin Milwaukee..

Re: Region V Water Issues Wisconsin Milwaukee..

Hello mfstockbridge. Welcome to the discussion. You are certainly correct about the arsenic being a problem. We have a full thread devoted to it here;http://www.flutrackers.com/forum/showthread.php?t=113596&highlight=arsenic

I am sorry I didn't put a link in to the cyanosis thread. http://www.flutrackers.com/forum/showthread.php?t=110354&highlight=cyanosis+post
I am just trying to see if there are any other factors (eg. nitrate) that could make symptoms more severe. There are hotspots of severe infection around the globe and a few did not have arsenic problems.

Feel free to add any information you might come across.
Welcome again, Kiwibird
 
Re: Region V Water Issues Wisconsin Milwaukee..

Re: Region V Water Issues Wisconsin Milwaukee..

Nitrate in Lake Superior

split-rock-lighthouse-8521.jpg
Split Rock Lighthouse on the north shore of Lake Superior as viewed from the deck of the research vessel Blue Heron. Scientists are taking water samples for nitrate and other substances in the lake.
Credit: Robert Sterner

Nitrate levels in Lake Superior, which have been rising steadily over the past century, are about 2.7 percent of the way toward making the lake's water unsafe to drink, as per a research studyby University of Minnesota (UMN) researchers.

The study, funded by the National Science Foundation (NSF), is published online this week in the journal Geophysical Research Letters.

The complexity of the causes underlying the increase makes it difficult to predict when the water could become unhealthy. The trend is a concern because Lake Superior contains 10 percent of the Earth's supply of surface fresh water.

Eventhough everyone is exposed to small, harmless amounts of nitrate from eating fruits and vegetables, nitrate contamination of drinking water can expose people to harmful levels.

Too much nitrate can reduce blood levels of oxygen, which poses a risk to infants and children or adults with lung or cardiovascular disease. Consuming excess nitrate over long periods of time is also suspected of causing cancer.

A compound made from nitrogen and oxygen, nitrate is a component of agricultural fertilizers and is generated by fossil fuel combustion. Nitrate in Lake Superior has increased about five-fold since the earliest measurements in 1906.........
http://www.networlddirectory.com/blogs/archives/Science-blog/July-20-2007.html
 
Re: Region V Water Issues Wisconsin, In., Ill., Min., Mich., Ohio

Ohio

Elevated nitrate concentrations have been reported from municipal drinking water wells in the Twin Creek watershed in southwest Ohio, where residents depend on ground water as the sole drinking-water source. While the nitrate problem has been persistent in this rural agricultural area, the sources and spatial extent of nitrate contamination were unknown. The extent and spatial and temporal distribution of contamination were investigated and compared with well characteristics, site characteristics (including distance from potential sources) and hydrogeology. Samples were collected throughout the watershed from domestic wells (25 and 36 samples in April and July 2008, respectively) and streams (8 and 16 samples in April and July). Samples were analyzed for temperature, pH, conductivity, dissolved oxygen, total coliform and E. coli bacteria and major cations and anions. Isotopic analyses of δ 18O and δ15N in nitrate were used to determine nitrate sources, suspected to be septic systems or agricultural applications. δ18O and δD in water were also measured at select sites to investigate ground-water and surface-water interactions that could influence nitrate concentrations in ground water. In April nitrate concentrations ranged from 0 - 8.09 mg/L with a mean of 0.89 mg/L). In July, concentrations ranged from 0 - 6.52 mg/L with a mean of 1.34 mg/L. Nitrate concentrations were higher in July than in April in surface water, after fertilizer application. The highest ground-water concentrations were clustered near the municipality. In July, nitrate concentrations were inversely correlated to the total well depth and to the depth to the water table. These relations did not apply in April. Nitrate sources inferred from isotope data will be compared to the spatial distribution of contamination to provide insights in the best approaches for reducing nitrate contamination in the future.
http://ngwa.confex.com/ngwa/2009gws/webprogram/Paper6089.html

Drinking Water Contamination of Surface Water Sources

Ohio public water systems are required to monitor (PDF 15kb ) for a number of potential contaminants in treated drinking water. Monitoring results are compared to federally derived health limits for treated drinking water, known as Maximum Contaminant Levels (MCLs). MCLs are based on the Safe Drinking Water Act (SWDA), and are enforceable standards.

Seventeen public drinking water systems, using surface water as the source, have had nitrate values exceed 10 mg/l in their finished water. During the past five years, 13 of these public water systems have had nitrate maximum contaminant level (MCL) violations and issued health advisories.

Priority Surface Water Areas: Lake Erie, Ohio River basin, watersheds with nutrient TMDLs underway or completed, particularly in the Ohio River basin; Scioto River CREP area; watersheds with public drinking water supply intakes that have nitrate MCL violations (Sandusky and Maumee); watersheds with public drinking water supply intakes with seasonally elevated nitrate (above MCL) levels that have not yet caused, but at are risk of causing, future MCL violations.

Why is this a Ground Water Quality Problem? Ohio EPA Ground Water Quality Reports for 2000 (PDF 1114kb) and 2002 (PDF 2860kb), that document nitrate impacts to ground water quality are generally associated with the following aquifer settings:

* mean concentrations of nitrate collected from public water system wells are highest in sand and gravel aquifer settings and shallow bedrock locations (less than 25 feet of unconsolidated material) where concentrations often exceed 50 percent of the MCL (10.0 ug/l); and
* there is a high correlation between high nitrate concentrations and shallower well depths (i.e. < 100 feet).

Contamination of Public Drinking Water Supplies using Ground Water Sources

Compliance monitoring data submitted during the past 5 years documents 85 nitrate MCL violations at 34 public water systems across all aquifer settings. There is a predominance of MCL violations in the sand and gravel aquifers and shallow fractured bedrock settings. The primary pathway for nitrate contamination is infiltration through soils or naturally occurring sinkholes in the karst regions of Ohio. The principle nonpoint sources of nitrate infiltration are fertilizers, wastewater treatment systems, and land application of biosolids/manures. Other pathways for sources of nitrogen to impact ground water resources include man-made drainage wells.

Priority Ground Water Areas: include shallow sand and gravel aquifers and near-surface fractured bedrock aquifers, Target implementation areas within these aquifers include drinking water source protection areas for public water systems with elevated nitrates.

http://web.epa.ohio.gov/dsw/nps/NPSMP/ET/nitrogenwq.html

SusceptibleCommPWSs_GW.jpg

http://images.google.co.nz/imgres?i...ter&hl=en&sa=N&um=1&ei=ir_BSsDcDaLYtAOPsuD5Ag
 
Re: Region V Water Issues Wisconsin, In., Ill., Min., Mich., Ohio

Minnesota: Landfill sites
0303-clp-statemap.jpg
 
Re: Region V Water Issues Wisconsin, In., Ill., Min., Mich., Ohio

Of the 8,545 water quality samples collected from the states and provinces bordering the Great Lakes, 19.8% contained nitrate concentrations that exceeded 3 mg/L and 3.1% of the samples exceeded 10 mg/L.
<center> </center>

Figure 2. Average nitrate concentrations in surface water from the U.S. states and the Canadian province that border the Great Lakes. LC<sub>50</sub>, median lethal concentration. Canadian information from the Ontario Ministry of Environment and Energy (53). U.S. information from the U.S. Environmental Protection Agency (54).
frog study
However, they also found that persistence of the toxic effect of granular ammonium nitrate decreased quickly once the granules dissolved, which under normal field conditions usually takes 1 hr. A similar field study in Germany found that nitrate fertilizers seriously harmed and killed amphibians as they migrated over recently fertilized fields (48). Few other studies examining the sublethal impacts of nitrate on amphibians exist. However, one study revealed that nitrate stress may depress immune response and blood hemoglobin in amphibian tadpoles. Dappen (49) found decreased levels of circulating white cells and decreased hemoglobin values in bullfrogs and leopard frogs exposed to 9-26 mg/L of nitrate for 3 weeks.

http://images.google.co.nz/imgres?i...water&hl=en&sa=N&um=1&ei=3WbGSs3_JZ_WNKyrifMH
 
Re: Region V Water Issues Wisconsin, In., Ill., Min., Mich., Ohio

Ohio:
NitrateGWmap2.jpg
http://web.epa.ohio.gov/dsw/nps/NPSMP/photos/NitrateGWmap2.jpg
 
Back
Top Bottom