
• FluTrackers.com Inc. does not provide medical advice. Information on this web site is collected from various internet resources, and the FluTrackers board of directors makes no warranty to the safety, efficacy, correctness or completeness of the information posted on this site by any author or poster. The information collated here is for instructional and/or discussion purposes only and is NOT intended to diagnose or treat any disease, illness, or other medical condition. Every individual reader or poster should seek advice from their personal physician/healthcare practitioner before considering or using any interventions that are discussed on this website. By continuing to access this website you agree to consult your personal physican before using any interventions posted on this website, and you agree to hold harmless FluTrackers.com Inc., the board of directors, the members, and all authors and posters for any effects from use of any medication, supplement, vitamin or other substance, device, intervention, etc. mentioned in posts on this website, or other internet venues referenced in posts on this website.
  • We are not asking for any donations. Do not donate to any entity who says they are raising funds for us.

Real-time epidemic forecasting for pandemic influenza

Mingus

Well-known member
Real-time epidemic forecasting for pandemic influenza <hr style="color: rgb(209, 209, 225);" size="1"> <!-- / icon and title --> <!-- message --> http://journals.cambridge.org/action...ne&aid=466538#


[SIZE=+1]Real-time epidemic forecasting for pandemic influenza <sup>1</sup> [/SIZE]

<hr><table align="top" border="0" width="95%"><tbody><tr valign="top"><td>I. M. HALL <sup>a1</sup><sup>c1</sup>, R. GANI <sup>a1</sup>, H. E. HUGHES <sup>a2</sup> and S. LEACH <sup>a1</sup>
<sup>a1</sup> Microbial Risk Assessment, Health Protection Agency, Centre for Emergency Preparedness and Response, Porton Down, Wiltshire, UK
<sup>a2</sup> Communicable Disease Surveillance Centre (Northern Ireland), Belfast, UK

</td><td align="right" bgcolor="#ddddff" valign="top"><table><tbody><tr><td align="right">Article author query</td></tr> <tr><td align="right" nowrap="nowrap">hall im [PubMed] [Google Scholar] </td></tr> <tr><td align="right" nowrap="nowrap">gani r [PubMed] [Google Scholar] </td></tr> <tr><td align="right" nowrap="nowrap">hughes he [PubMed] [Google Scholar] </td></tr> <tr><td align="right" nowrap="nowrap">leach s [PubMed] [Google Scholar] </td></tr></tbody></table></td></tr></tbody></table>Abstract

The ongoing worldwide spread of the H5N1 influenza virus in birds has increased concerns of a new human influenza pandemic and a number of surveillance initiatives are planned, or are in place, to monitor the impact of a pandemic in near real-time. Using epidemiological data collected during the early stages of an outbreak, we show how the timing of the maximum prevalence of the pandemic wave, along with its amplitude and duration, might be predicted by fitting a mass-action epidemic model to the surveillance data by standard regression analysis. This method is validated by applying the model to routine data collected in the United Kingdom during the different waves of the previous three pandemics. The success of the method in forecasting historical prevalence suggests that such outbreaks conform reasonably well to the theoretical model, a factor which may be exploited in a future pandemic to update ongoing planning and response.
(Accepted June 23 2006)


Correspondence:
<sup>c1</sup> Microbial Risk Assessment, Centre for Emergency Preparedness and Response, Health Protection Agency, Porton Down, Wilts SP4 0JG, UK. (Email: Ian.Hall@hpa.org.uk)

<hr>Footnotes

<sup>1</sup> The views and opinions expressed in this paper are those of the authors and do not necessarily reflect those of the UK Department of Health, DG SANCO or the Health Protection Agency.
 
Re: Real-time epidemic forecasting for pandemic influenza

new-2.jpg

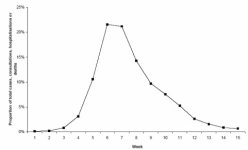
The above graph (taken from the UK pandemic plan) shows an amplitude & duration composite from the three 2000th century pandemics.
 
Re: Real-time epidemic forecasting for pandemic influenza

So from the 1st case reported in UK to the last... 4 month are expected ?
and 1 month to the medical autority to realise the situation is out of control ?

This is for one single wave ? many question
 
Re: Real-time epidemic forecasting for pandemic influenza

Yes an average wave profile derived from three pandemics
 
Re: Real-time epidemic forecasting for pandemic influenza

That's pretty cool information....

It's good to know what you're in for.
 
Re: Real-time epidemic forecasting for pandemic influenza

3 months of isolation would cut most of the risk.
But I wonder, when then isolating people (say 10% of the population)come out after 3 months, wouldn't that give another wave ,
since they are not yet immune ?
Won't you have to stay locked until you get the vaccine ?

I also remember these graphics :

zpq0130617800002.jpeg


Figure 1


Fig. 1. Epidemic curves as predicted by the model of Stilianakis et al. (34) for parameters characterizing interventions with oseltamivir. [For model equations and parameter values, see the SOM (35).] (A) Number of infected individuals using treatment only (red) or using prophylaxis in addition to treatment (blue) over the first 30 days of the epidemic. The gray line shows the course of the epidemic without any intervention. The solid lines depict the total number of infected individuals, whereas the dashed lines depict the number of individuals infected with resistant virus. The total number of illnesses during the 30-day period is 247, 227, or 26 in the epidemic with no intervention, with treatment, or with prophylaxis, respectively. (We assume that there is no pre-existing immunity in the population.) All symptomatic individuals receive treatment on average 1.4 days after the onset of symptoms. Prophylaxis starts at day 7. (B) Fraction of individuals infected with resistant virus under treatment (red) and prophylaxis (blue). <NOBR>[View Larger Version of this Image (118K JPEG file)]</NOBR>
 
Last edited by a moderator:
Re: Real-time epidemic forecasting for pandemic influenza

I thought people might find it interesting that curve that Chikungunya followed in La Reunion was basically the same.

http://www.flutrackers.com/forum/showpost.php?p=6904&postcount=2

The really interesting thing about this outbreak is that it was spread through mosquitos and not direct human-to-human contact.

It appears that once certain conditions are met the curve remains the same.
 
Re: Real-time epidemic forecasting for pandemic influenza

Jeremy said:
I thought people might find it interesting that curve that Chikungunya followed in La Reunion was basically the same.

http://www.flutrackers.com/forum/showpost.php?p=6904&postcount=2

The really interesting thing about this outbreak is that it was spread through mosquitos and not direct human-to-human contact.

It appears that once certain conditions are met the curve remains the same.

Very strange... It may require a moskitoe excess so it is no more limitative?
 
Re: Real-time epidemic forecasting for pandemic influenza

Jeremy said:
I thought people might find it interesting that curve that Chikungunya followed in La Reunion was basically the same.

http://www.flutrackers.com/forum/showpost.php?p=6904&postcount=2

The really interesting thing about this outbreak is that it was spread through mosquitos and not direct human-to-human contact.

It appears that once certain conditions are met the curve remains the same.

This thought, Jeremy, is most profound...the curve, when left untenuated, repeats, and repeats. This fact blows away the point mutation argument. It's not random, or else it would not repeat.
 
Re: Real-time epidemic forecasting for pandemic influenza

JJackson said:
View attachment 673

The above graph (taken from the UK pandemic plan) shows an amplitude & duration composite from the three 2000th century pandemics.

As I'm sure JJ knows but others newer here don't know, this UK Pandemic Plan chart has been in existence for at least TWO YEARS.

This chart says the pandemic will take 16 weeks. There's a 2 week starting window in which the risk of infection is low enough to get what needs to be done done. After that, the slope of the rising rate of infection is steep.

Lisa the General Practioner (an MD and an engineer) looked at this chart, and (here's where my memory fails me) with an expected 35% infection of the population, at the time window at top of this chart, for 2 weeks, there will be 21% of the population who are sickened. Yes, this is not a joke. It was stunning to see this statistic arise. In addition, those who are caretakers would be overwhelmed and taxed so that they too would leave the workforce.

As food for thought, what is not anticipated yet is that it will not be a 20% or even 40% absentee rate, but with 21% of the populace infected, there will be 40 to 60% absenteeism, simply to caretake the ill, and the rest of the folks may very well have reasons to avoid human interaction as well.


Please dwell on this chart and conjure your own expectation of its consequences.
 
Re: Real-time epidemic forecasting for pandemic influenza

I would like more discussion about these epidemic curves and graphs. The graph posted by JJackson is the average wave profile of all of the waves of three 20th century pandemics.

1. So, is this the best predictor model of the duration of a potential H5N1 pandemic (at least the first wave)?

2. Can the amplitude of the graph be considered the attack rate at any given point along the time line?

From the graphs posted by gsgs, the higher the R0 (the reproduction number) the shorter the duration of the wave without any intervention. However, with intervention, the curve flattens and the duration is extended.

3. Would this mean that at any given point in time, with interventions, fewer individuals would be sick, although the overall attack rate for the pandemic would not change?

4. Rephrasing gsgs's question, Is a prepper who can self-isolate for 4 months more likely to survive a wave with a shorter duration (i.e. high R0) and no suitable interventions for any of the population? Or, once preppers comes out of hibernation, will they become infected and be the last few cases at the tail end of the curve?

5. None of these data address how many waves there might be in a future pandemic or the intensity of any individual wave, its this correct?
 
Re: Real-time epidemic forecasting for pandemic influenza

How will we be able to clearly identify this window?

[QUOTE name=GaudiaRay]This chart says the pandemic will take 16 weeks. There's a 2 week starting window in which the risk of infection is low enough to get what needs to be done done. After that, the slope of the rising rate of infection is steep.[/QUOTE]
 
Re: Real-time epidemic forecasting for pandemic influenza

Mingus said:
So from the 1st case reported in UK to the last... 4 month are expected ?
and 1 month to the medical autority to realise the situation is out of control ?

This is for one single wave ? many question

single wave
 
Re: Real-time epidemic forecasting for pandemic influenza

Comments in blue:

Laidback Al said:
I would like more discussion about these epidemic curves and graphs. The graph posted by JJackson is the average wave profile of all of the waves of three 20th century pandemics.

1. So, is this the best predictor model of the duration of a potential H5N1 pandemic (at least the first wave)? average duration of wave and percentage of total (for the wave) of sick people doctor visits, hospitalizations and deaths from pandemic illness for each week of wave

2. Can the amplitude of the graph be considered the attack rate at any given point along the time line? sort of. If you take the total of all the sick people, doctor visits, hospitalizations and deaths for the entire wave, and if you know the total for each week, you can determine the percent of the total. That is what the curve represents. Percentage of the total by week.

From the graphs posted by gsgs, the higher the R0 (the reproduction number) the shorter the duration of the wave without any intervention. However, with intervention, the curve flattens and the duration is extended.

3. Would this mean that at any given point in time, with interventions, fewer individuals would be sick, although the overall attack rate for the pandemic would not change? Yes, that's correct

4. Rephrasing gsgs's question, Is a prepper who can self-isolate for 4 months more likely to survive a wave with a shorter duration (i.e. high R0) and no suitable interventions for any of the population? More likely to avoid infection. Survival would depend not only on avoidance of infection, but also consequences of the magnitude (extent - based on case attack rate - and duration- based on case fatality rate) of social disruption and infrastructure collapse. Cummulatively, both during and after the pandemic. Or, once preppers comes out of hibernation, will they become infected and be the last few cases at the tail end of the curve? If a prepper comes out of SIP at the end of a wave, there is a much lower risk of infection, however there is still a risk, until the virus runs out of enough hosts, either through enough of the hosts becoming vaccinated, or enough of the hosts becoming immune.

5. None of these data address how many waves there might be in a future pandemic or the intensity of any individual wave, its this correct? True. That would really depend on the case attack rate and the case fatality rate of the virus.

#4 edited for clarification
#4 edited again for further clarification
 
Re: Real-time epidemic forecasting for pandemic influenza

With this being said, will the virus move through the population more or less uniformly, or is it possilbe that there will be "safer-zones" where the virus either has already gone through or has yet to penetrate population centers?


under the radar said:
5. None of these data address how many waves there might be in a future pandemic or the intensity of any individual wave, its this correct? True. That would really depend on the case attack rate and the case fatality rate of the virus.
 
Re: Real-time epidemic forecasting for pandemic influenza

hawkeye said:
With this being said, will the virus move through the population more or less uniformly, or is it possilbe that there will be "safer-zones" where the virus either has already gone through or has yet to penetrate population centers?
This simulation from Los Alamos most clearly demonstrates how a wave moves across the country and probably answers many questions. As you can see, for example, the simulation has the wave starting in the Los Angeles area. It quickly moves to several hot spots across the country almost simultaneously as a result of transcontinental travel. They are the first areas to turn red (hight point of case attack rate). When they blue (lowest point of case attack rate) the majority of the rest of the country is red. You can stop the simulation at approximately day 70, for example, to see the hot spots are red, while the rest of the country is just ramping up. You can stop the simulation at any point by clicking on the button at the left of the bar at the bottom, and restart it by clicking again on the button. Although there are areas of lesser or denser population, no area is left unscathed. :

http://www.lanl.gov/news/images/avianflu.shtml

edited for further clarification
 
Re: Real-time epidemic forecasting for pandemic influenza

Very Interesting. Knowin when to isolate oneself and family is going to be key.
Thanks.
-Hawkeye


under the radar said:
This simulation from Los Alamos most clearly demonstrates how a wave moves across the country and probably answers many questions. As you can see, for example, the simulation has the wave starting in the Los Angeles area. It quickly moves to several hot spots across the country almost simultaneously as a result of transcontinental travel. They are the first areas to turn red (hight point of case attack rate). When they blue (lowest point of case attack rate) the majority of the rest of the country is red. You can stop the simulation at approximately day 70, for example, to see the hot spots are red, while the rest of the country is just ramping up. You can stop the simulation at any point by clicking on the button at the left of the bar at the bottom, and restart it by clicking again on the button. Although there are areas of lesser or denser population, no area is left unscathed. :

http://www.lanl.gov/news/images/avianflu.shtml

edited for further clarification
 
Re: Real-time epidemic forecasting for pandemic influenza

hawkeye said:
Very Interesting. Knowin when to isolate oneself and family is going to be key.
Thanks.
-Hawkeye

Yes. For example, if you have a finite supply of food/water, etc. you might not want to SIP too soon, and risk having to go out too soon to replenish your supply, thereby increasing the risk of infection. If one were able to SIP for the period of the entire pandemic and only emerge sometime after the pandemic was over, the risk would be quite dramatically reduced. However, survival would not depend solely on avoidance of infection. One would also have to consider one's circumstances for continued survival post-pandemic relative to the degree and duration of resulting infrastructure collapse, which would depend on case attack rate and case fatality rate. If case attack rate is low enough, social disrution will occur to some degree. If case fatality rate is high, infrastructure collapse is likely. Likelyhood of survival would depend upon how well one could withstand infrastructure collapse, and for what duration of that collapse.
 
Re: Real-time epidemic forecasting for pandemic influenza

Agreed. IMO, we can only do so much to avoid the virus, the big issue is the collapse of society.
 
Back
Top