JimO
Well-known member
Source: http://www.nyc.gov/html/doh/flu/html/data/data.shtml
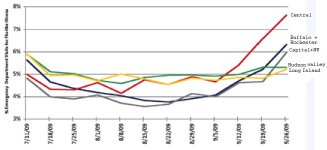
NYC's website shows some charts that have been updated through 9/30; however, others are still only current through 9/23. Also, it appears to me that the X-axis on the charts is so high compared to the X magnitude of the data that nearly all the charts look flat, so it's hard to see the trends.
NYC's website shows some charts that have been updated through 9/30; however, others are still only current through 9/23. Also, it appears to me that the X-axis on the charts is so high compared to the X magnitude of the data that nearly all the charts look flat, so it's hard to see the trends.