

wotan
Well-known member
Posting without comment, draw your own conclusions...
http://www.cdc.gov/h1n1flu/updates/us/
U.S. Influenza and Pneumonia-Associated Hospitalizations
and Deaths from October 4 – October 10, 2009
Posted October 16, 2009, 11:00 AM ET
Data reported to CDC by October 13, 2009, 12:00 AM ET
Cases Defined by
Hospitalizations
Deaths
Influenza and Pneumonia Syndrome* 15,696 2,029
Influenza Laboratory-Tests** 4,958 292
*Reports can be based on syndromic, admission or discharge data, or a combination of data elements that could include laboratory-confirmed and influenza-like illness hospitalizations.
**Laboratory confirmation includes any positive influenza test (rapid influenza tests, RT-PCR, DFA, IFA, or culture), whether or not typing was done.
This table is based on data reported to CDC by U.S. states and territories from a new influenza and pneumonia hospitalizations and deaths web-based reporting system. This system will be used to monitor trends in activity for the 2009-10 influenza season. This is a cumulative count beginning August 30, 2009. The table shows aggregate reports of all influenza and pneumonia-associated hospitalizations and deaths (including 2009 H1N1 and seasonal flu) since August 30, 2009 received by CDC from U.S. states and territories. This table will be updated weekly each Friday at 11 a.m. For the 2009-2010 influenza season, states are reporting based on new case definitions for hospitalizations and deaths effective August 30, 2009.
CDC will continue to use its traditional surveillance systems to track the progress of the 2009-2010 influenza season. For more information about influenza surveillance, including reporting of influenza-associated hospitalizations and deaths, see Questions and Answers: Monitoring Influenza Activity, Including 2009 H1N1.
The number of 2009 H1N1 hospitalizations and deaths reported to CDC from April – August 2009 is available on the Past Situation Updates page.
For state level information, refer to state health departments.
International Human Cases of 2009 H1N1 Flu Infection
See: World Health OrganizationExternal Web Site Icon.
http://www.cdc.gov/h1n1flu/updates/us/
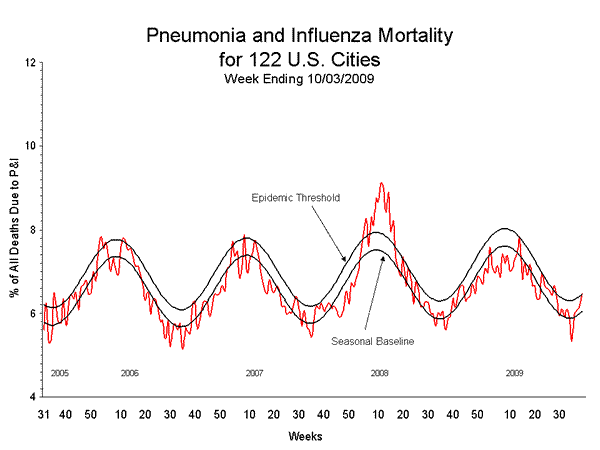
 But it is taken from the MMWR so far as I know, and is only as good as the data collected. Many of the cities who voluntarily report for the MMWR frequently do not send any data. Furthermore, I have issues with what constitutes a P&I death. It seems either of those (pneumonia or influenza) has to be listed on the death certificate as the cause of death. I have this feeling a lot of people are having their deaths mislabeled. The surveillance report may draw its data from a different source, since the case definition is now death with accompanying ILI, as I understand it.

