• FluTrackers.com Inc. does not provide medical advice. Information on this web site is collected from various internet resources, and the FluTrackers board of directors makes no warranty to the safety, efficacy, correctness or completeness of the information posted on this site by any author or poster. The information collated here is for instructional and/or discussion purposes only and is NOT intended to diagnose or treat any disease, illness, or other medical condition. Every individual reader or poster should seek advice from their personal physician/healthcare practitioner before considering or using any interventions that are discussed on this website. By continuing to access this website you agree to consult your personal physican before using any interventions posted on this website, and you agree to hold harmless FluTrackers.com Inc., the board of directors, the members, and all authors and posters for any effects from use of any medication, supplement, vitamin or other substance, device, intervention, etc. mentioned in posts on this website, or other internet venues referenced in posts on this website.
  • We are not asking for any donations. Do not donate to any entity who says they are raising funds for us.

mortality statistics

Re: mortality statistics

I spent many hours to find and collect these partial data

put all the data in one database, uniform, computer readable
allow download of the whole database and processing
with offline tools

I'm pretty sure, that's the best and most reasonable
and probably the way how it will be in 100 years.

but we still have copyrights, research funding and competion,
political interests in statistical region-partitioning,
secrecy,spying,economical interests in noninformation

use not only death-certificates but also anonymized
hospital records


the genealogy companies probably have the best/biggest deaths-databases
but they are not interested in heath-research.

what costs one death certificate ? a doctor must examine it,
fill the forms, then ,in USA, the city/county/state/national
statistical departments, then usually as some individually
designed time-series sold in some statistical yearbooks.

Some countries also submit to WHO,UNO,PAHO,Eurostat,...
who run their own databases with different groupings
and provide access by different softwares and don't want you
to download the whole database but rather selected tables.

They want to be quoted in papers, presumably that gives them
better chances of funding. They have complicated and lengthy
access-limitations and even legal threats (wonder) to protect
privacy of records.

The whole system is ineffective and restricts the final
processing where all the troublesome collected data is gathered
and processed and uniformized, adapted, stored, provided.


attachment.php


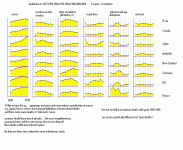
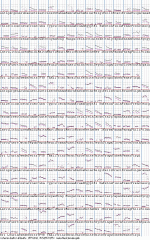
USA 1900-1960 see also rat1918h.gif : increase of US-cardiovascular deathrates in people >45y
from 1920 to 1940 then almost staying at that level until 1960
and decline of US-respiratory deathrates 1930-1950

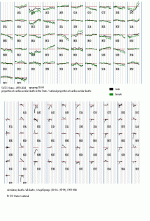
jpnc0.gif for Japan, 1900-2000, 12 causes


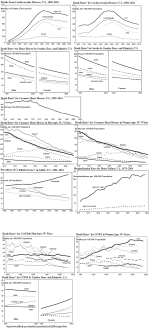
CVD and COPD charts :
http://www.nhlbi.nih.gov/about/documents/factbook/2006/

searchable.openedhost.com
www.biostat.wustl.edu
http://decisionsoftheheart.com/references/
circres.ahajournals.org
http://www.nhlbi.nih.gov/about/documents/factbook/2012/chapter4.htm
 

Attachments

  • INT51E.GIF
    INT51E.GIF
    18.5 KB · Views: 2
  • HI5.GIF
    HI5.GIF
    15.4 KB · Views: 2
  • cvd_cdc3.png
    cvd_cdc3.png
    308.5 KB · Views: 2
Re: mortality statistics

http://eurpub.oxfordjournals.org/content/early/2011/05/19/eurpub.ckr062.full.pdf
(2011)
The rates are generally lowest in France in all groups, as previously observed.15
high rates, e.g. Indian and Pakistani born, and Eastern European born,4
low rates, e.g. the Chinese

the rates vary in some country of birth groups across countries,
indicating that either
(i) information systems differ, creating artefacts or
(ii) country-specific context may be important to disease outcome or
(iii) that differences existed between the same country of birth groups
in differing countries in social circumstances prior to migration.

Notably, while people born outside France, except the Chinese immigrants,
have higher circulatory disease mortality than the France born, their rates
were lower than in their counterparts in other countries.

do variations relate to socio-economic position, cardiovascular risk factors etc.
European data sets are not yet ready to answer such questions,

French (North–South/Mediterranean) Paradox

suggests that disease outcomes may be influenced by the local context, whether
this is health care, diagnostic methods and coding, availability of data in
surveillance systems, social and economic standing, stress, lifestyle,
migration history, social circumstances and health prior to
migration or other environmental factors. These variations are
extremely unlikely to be genetic.

This has led to the phrase ‘the French paradox’.29
the French paradox seemingly applies to people born outside France but
living there.

NI-HON-SAN Study of Japanese in Japan, Honolulu and San
Francisco.8It demonstrated convergence of cardiovascular risks
and risk factors among migrants, and showed the protection
against such diseases by maintenance of traditional behaviours
rather than rapid acculturation

8 Marmot MG, Syme SL, Kagan A, et al. Epidemiologic studies of coronary heart
disease and stroke in Japanese men living in Japan, Hawaii and California:
prevalence of coronary and hypertensive heart disease and associated risk factors.
Am J Epidemiol 1975;102:514–25.

15 Mu¨ller-Nordhorn J, Binting S, Roll S, Willich SN. An update on regional variation
in cardiovascular mortality within Europe. Eur Heart J 2008;29:1316–26.

[ no mentioning of Quebec ]
--------------------------------------------------------------------------

The French paradox concept was formulated by French epidemiologists3 in the 1980s

2. Artaud-Wild SM, Connor SL, Sexton G, et al. Differences in coronary mortality can be
explained by differences in cholesterol and saturated fat intakes in 40 countries but not
in France and Finland. A paradox. Circulation 1993;88:2771–9.
France and Finland have similar intakes of cholesterol and saturated fat, but consumption
of vegetables and vegetable oil containing monounsaturated and polyunsaturated fatty acids
is greater in France than in Finland. [PubMed]
------------------------------------------------------------------
http://en.wikipedia.org/wiki/French_paradox
http://www.ncbi.nlm.nih.gov/pmc/articles/PMC3898438/
cheese ? http://www.ncbi.nlm.nih.gov/pubmed/22981595

-------------------------------------------------------------------

1940,que,all,32799,7365,568,447,692,842,926,850,898,1031,1187,1495,1849,2135,2512,2871,2788,2347,1994
1940,que,can, 3831, 16, 9, 5, 26, 20, 52, 71, 93, 179, 231, 330, 413, 501, 546, 510, 453, 236, 140
1940,que,dia, 538, 6, 1, 4, 7, 7, 8, 12, 6, 15, 16, 34, 62, 80, 93, 85, 56, 38, 8
1940,que,cer, 448, 0, 1, 2, 1, 4, 3, 1, 4, 6, 12, 24, 23, 37, 51, 77, 74, 72, 56
1940,que,cir, 7139, 19, 19, 23, 37, 48, 65, 82,117, 188, 298, 407, 553, 637, 833,1023,1048, 948, 794
1940,ont,all,38503,3567,326,317,490,540,587,667,895,1047,1398,2095,2657,3244,3924,4582,4871,3982,3299
1940,ont,can, 5127, 15, 6, 11, 24, 20, 26, 69,121, 206, 309, 475, 582, 612, 697, 721, 623, 402, 206
1940,ont,dia, 691, 0, 0, 4, 5, 5, 8, 4, 3, 8, 25, 39, 60, 93, 129, 111, 118, 60, 19
1940,ont,cer, 901, 0, 0, 1, 4, 4, 3, 6, 9, 15, 28, 44, 67, 90, 110, 141, 159, 118, 102
1940,ont,cir,14497, 8, 13, 12, 31, 39, 57, 81,139, 237, 404, 704, 992,1418,1759,2207,2521,2095,1775

year,province,condition, deaths by age >=0,0-4,5-9,...,80-84,>84


1921,cdn,1840,----,1332,1495,1292,----,2001,1398,1086,1057,2013
1926,cdn,1808,----,1915,1860,1647,1186,2577,1631,1294,1508,2092
1930,cdn,2103,----,2248,2159,1773,1454,2849,2025,1699,1747,2355
1940,cdn,3140,----,2915,2903,2710,2313,3999,3174,2839,2813,3337
1950,cdn,3842,1695,4374,3861,3377,2870,4704,3929,3745,3641,4235
1960,cdn,4965,3854,5411,5156,4989,4404,5407,5022,4851,4503,5280
1970,cdn,4961,4754,5517,5103,5219,4723,5218,4944,5031,4479,4885


year,cdn,cdn_,nfld,pei_,ns__,nb__,que_,ont_,mani,sask,alta,bc__


% of deaths from cardiovascular causes ,
cdn,nfd,pei,ns_,nb_,que,ont,man,sas,alb,bc_

=========================================================
more sources for CVD-deaths subsumed to the keyword Quebec here
association between poor living standards and ischemic heart disease
by a detailed geographical comparison of infant mortality in 1920-1939
and death in adults from ischemic; heart disease and other leading causes
in 1990-1994. Ischemic heart disease [r = 0.325] and malignant tumors
of digestive apparatus [r = 0.562] are strongly correlated with infant mortality.
A significant difference was observed in both infant and overall mortality rates
between the western and eastern counties. Our results suggest that the
geographical distribution of ischemic heart disease in Hungary reflects later
dietary influences.

or antibodies
or organic changes
-------------------------------------------------------------------------
[in Sweden] at age 50, we found a significant inverse association of education
with cholesterol level, LDL/HDL ratio and ApoB/ApoA1 ratio. Cholesterol was
also associated with occupational class, statistically significant after adjustment
for all covariates. At age 70, no significant associations were found between either
measurement of SEP and any of the biomarkers studied. Highest educated men
had decreased risk for CVD mortality during follow-up.
---------------------------------------------------------------------------
Long-term wine consumption is related to cardiovascular mortality and life
expectancy independently of moderate alcohol intake: the Zutphen Study.
---------------------------------------------------------------------------
35846 people born 1920-1959 with mortality follow-up 1961-2005.
630 died from CHD , inverse association of head circumference with deaths
from CHD (Ptrend = 0.010). The association was modified by maternal height
(Pinteraction = 0.01) and by adult body mass (Pinteraction = 0.05).
People in the lowest third of head circumference, who had a tall mother or a
high body mass index in adulthood, were at the highest risk of death from CHD.
Head circumference at birth was inversely associated with deaths from CHD,
and the combination of small head and tall mother, or small head and high
adult body mass, was associated with the highest risk. These findings suggest
that combined effects of genetic factors (growth potential and intrauterine growth)
and non-genetic factors acting throughout the life course (intrauterine growth
restriction and later weight gain) could mediate the effects of birth size on adult heart disease.
=----------------------------------------------------------------------------------
Dietary fiber intake in relation to coronary heart disease and all-cause mortality
over 40 y: the Zutphen Study.
---------------------------------------------------------------------------------
Long-term fish consumption and n-3 fatty acid intake in relation to (sudden)
coronary heart disease death: the Zutphen study.
----------------------------------------------------------------------------------------
15.[Sex mortality differences in Denmark 1840-2005. Women live longer than men,
but great changes during the last 50 years].
---------------------------------------------------------------------------------
Cohort patterns in mortality trends among the elderly in seven European countries, 1950-99.
METHODS: A standard age-period-cohort analysis was applied to all-cause and
cause-specific mortality data by 5-year age groups and sex, for Denmark, England
and Wales, Finland, France, The Netherlands, Norway, and Sweden, in the period 1950-99.
RESULTS: Cohort patterns were identified in all countries, for both the sexes and virtually
all causes of death. They strongly influenced the trends in all-cause mortality among
Danish, Dutch, and Norwegian men, and the trends in mortality from infectious diseases,
lung cancer (men only), prostate cancer, breast cancer, and chronic obstructive pulmonary
disease (COPD). All-cause mortality decline stagnated among Danish, Dutch, and
Norwegian male birth cohorts born between 1890 and 1915, among French men born
after 1920, and among women from all countries born after 1920. Where all-cause mortality
decline stagnated, cohort patterns in mortality from lung cancer, COPD, and to a lesser
extent ischaemic heart diseases, were unfavourable as well. For infectious diseases,
stomach cancer, and cerebrovascular diseases, mortality increased among cohorts
born before 1890, and decreased strongly thereafter.
CONCLUSIONS: Cohort effects related to factors such as living conditions in childhood
and smoking in adulthood were important in determining the recent trends in mortality
among the elderly in seven European countries.
-----------------------------------------------------------------------------------------
substantial genetic influence on individual frailty associated with mortality caused by CHD.
------------------------------------------------------------------------------------------
Height is not associated with long-term survival after acute myocardial infarction.
---------------------------------------------------------------------------------------------
Both a previous aptitude for endurance athletic events and continuity of vigorous physical
activity seem to be associated with protection against coronary heart disease, but an
aptitude for power speed events does not give protection against coronary heart disease.
------------------------------------------------------------------------------------------
[in Sweden] Birth weight showed a specific, inverse association with mortality from circulatory
diseases: the rate ratio was 0.67 (95% confidence interval 0.50 to 0.89) per 1000 g increase
in birth weigh
----------------------------------------------------------------------------------------
former aerobic sports athletes (endurance and mixed sports) in particular have high total
and active life expectancy and low risk for ischemic heart disease and diabetes in later years.
----------------------------------------------------------------------------------------------
Low weight at 1 year is associated with concentric enlargement of the left ventricle in adult life.
Left ventricular mass was not related to birth weight
higher mortality from cardiovascular disease in men of low weight at 1 year
---------------------------------------------------------------------------
[in England] Men who had been bottle fed also had a high standardised mortality ratio for
ischaemic heart disease (95; 68 to 130) and high mean serum concentrations of total
cholesterol (7.0 mmol/l), low density lipoprotein cholesterol (5.1 mmol/l), and apolipoprotein
B (1.14 g/l). In all feeding groups serum apolipoprotein B concentrations were lower in men
with higher birth weight and weight at 1 year.
--------------------------------------------------------------------------------------
ncreased risk of death from ischaemic heart disease in
men who had been breast fed and not weaned at one
year (standardised mortality ratio 97) compared with
those who were weaned at one year (SMR 79) and
those who had been breast and bottle fed (SMR 73).5
-------------------------------------------------------
y, was caused by a change in food processing that occurred after 1920,
when the new oil seed industry introduced into our food three greatly harmful lipid substances.
The unnatural trans-trans isomer of linoleic acid, which had never been in human food prior
to 1920 and which entered our food in margarines and refined oils, blocked the conversion
of natural cis-cis linoleic acid to prostaglandin E1, which tends to prevent MI, both by acting
as a vasodilator and by minimizing platelet aggregation. Harmful lactones were also introduced
into our food, increasing the risk of MI by decreasing the fibrinolytic activity of our blood.
The oil seed industry also introduced into our diet free radical lipid peroxides that

 

Attachments

  • euisc.PNG
    euisc.PNG
    164.8 KB · Views: 2
  • frisc.PNG
    frisc.PNG
    63.9 KB · Views: 3
Re: mortality statistics

we need a standard vital statistics data table format

so data-series from several databases - or just several data-series from the same database -
can be merged and compared and read into the computer
so to be analized , to make charts from it, to do statistical calculations
and comparisons.

This formatting is a typical procedure in programming and proved useful,
e,g, image-formats, editing formats, compression formats etc. .
Typically a file-ending is assigned to such a format, (.txt,.gif,.zip,...)

It's clear to me, that this is the way to go and what will probably
finally be done.
Currently the countries,universities,organisations,databases,
research groups have their own, incompatible formats.

currently I'm doing French data and came up with this system:

7,4,1950,1999,fra,cir,m,year,#,dr,aa
1950,84642,420.99,533.59
...
1999,76722,269.49,230.11


7:total number of header-specifications minus 4
4:number of entries per line, specified by the last 4 strings in the header
1950 name of the first line (typically year)
1999 name of the last line (typically year, but any number works, as long
as the difference is the number of lines in the dataset)
fra:France (geographical region)
cir: deaths from circulatory causes
m:male
year:year
#:total number of deaths
dr:deathrate (deaths/population*100000)
aa:age-adjusted deathrate (several methods, to be specified later by
additional letters. Age-weighted deathrate by assuming a fixed population
age-structure)

or:

Code:
 26,23,1950,1999,fra,cir,m,year,0-999,0-0,1-4,5-9,10-14,...,90-94,95-999
1950,420.99,74.36,6.34,7.20,9.20,13.31,15.51,18.89,26.80,...,.71,12722.70
...

something like this. It is read by (in old GWBASIC) (6 such tables in file fra12)
3 M=6:DIM A(M,49,23),N(M,4),N$(M,28)
10 OPEN "i",2,"fra12":FOR F=1 TO M:FOR I=1 TO 4:INPUT#2,N(F,I):PRINT N(F,I);:NEXT:PRINT:
12 FOR I=1 TO N(F,1):INPUT#2,N$(F,I):NEXT:FOR Y=0 TO N(F,4)-N(F,3):FOR I=1 TO N(F,2):
14 INPUT#2,A(F,Y,I):NEXT I,Y,F:CLOSE


also for population data, births etc. , even non-vital-statistics tables

something like this is urgently needed (IMO)
WHO or UNO should do it ...
like they did the ICD-disease classifications, but unfortunately
they have no conversion programs to convert the several ICDs
(a new ICD comes ~ all 10 years) into others


once we have this, it would be easy to write a program that makes
the charts from such a file, with the specified parameters,size,color
- easy for everyone, even nonprogrammers

-------------------------------------
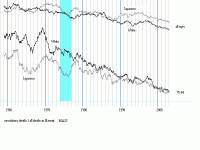
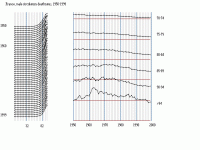
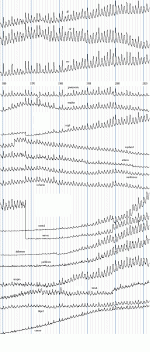
fra12a.gif: the French decline -maybe corresponding to the
1974-1976 US-death-decline-mystery - happened in 1976-1977,
best seeable in the French male 75-89 year deathrate from
circulatory causes

goto: http://www.ined.fr/1999/get_tbl.html
mark: Maladies de l'appareil circulatoire
click: valider
mark: the wanted parameters
click: soumettre la requete
convert: into computer-readable form

----------------------------------------------------
http://www.insee.fr/fr/insee-statis...eque/tableaux_sgf/tableaux.asp?domaine=mvtpop

http://www.insee.fr/fr/themes/theme.asp?theme=2

http://www.osfi-bsif.gc.ca/Fra/Docs/DEIP_Gallop.pdf

http://www.persee.fr/web/revues/home/prescript/article/pop_0032-4663_1959_num_14_1_6216

----------------------------------------

hmm, it's called "spreadsheet" in English.
http://en.wikipedia.org/wiki/Spreadsheet
I should probably have known that ;-)

well, it's not really a computer application but rather an agreement
on one simple standard and new file-extension acronym (.vit , .dem ?) -
suitable to be easily created,maintained,extended,merged
with any text-editor and then easily loaded and processed by whatever programs.
 

Attachments

  • fra12a.GIF
    fra12a.GIF
    11.9 KB · Views: 2
Re: mortality statistics

Minnesota had been amazingly successful (or lucky ?) to reduce cardiovascular deaths,
especially since ~1990.


http://www.minnesotamedicine.com/Pa...Minnesota-Heart-Disease-and-Stroke-Prevention

A recent analysis attributed roughly 50% of the decline in mortality from heart disease
that took place between 1980 and 2000 to improved medical treatment and approximately
50% to improvements in risk factors.3

3. Ford ES, Ajani UA, Croft JB, et al. Explaining the decrease in U.S. deaths from
coronary disease, 1980-2000. N Engl J Med. 2007;356(23):2388-98

http://www.nejm.org/doi/full/10.1056/NEJMsa053935


also

Maine since 1990
Nebraska since 1998
Oregon since 1985
Colorado since 1980

Vermont since 1987
Massachusetts since 1988
Idaho since 1985
Kansas since 1990
New Hampshire since 2003
Montana since 1985
Connecticut since 2000
South Dakota since 1990
North Carolina since 1995
Utah since 1980

-----------

otoh:
New York did especially bad since 1975
https://www.health.ny.gov/diseases/cardiovascular/heart_disease/docs/burden_of_cvd_in_nys.pdf

Mississippi
Oklahoma
DC
Mariland
Nevada
Hawaii

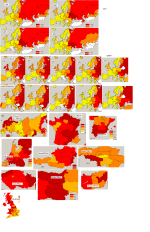
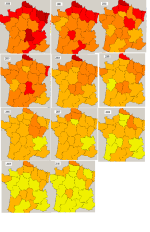
[picture heamf2.gif]


regional clusters suggest, that it's not just political,
better health care, nutrition programs,

------------------------------------------
MN, New England are exactly those states with big
"October-dealay" of deaths, making me speculate about an infection
related cause. But New York also had the October-delay
and they are on the other end of US-cardio-deaths.
----------------------------------------------

Mexicans, as well as people in France,Spain,Quebec traditionally
had fewer cardiovascular deaths than people of English,Irish,
German origin. This was well seen in ~1950 when cardio deaths
peaked and countermeasures started to increase a lot.
This may explain low rates in NM,UT,CO,AZ,NV in the 60s,
but (relatively) increasing since then.

-----------------------------------------------------

In England and Massachusetts cardio deaths were low in 1850,
at ~3% of all deaths and then continually increased until
1950 with a little pause 1890-1920.
Increasing age contributed, but cannot explain this alone.
(compare with cancer deaths)

----------------------------------------------------------

genetical factors were suggested in some recent papers:
(but denied in others)
[links]

-------------------------------------------------------------------------------------------------------

Olmsted , smoking--cv-deaths ?
http://www.ncbi.nlm.nih.gov/pmc/articles/PMC3615114/

not convincing, small reduction in smoking incidence 2006-2007

compare with whole MN,USA,Ontario
-------------------------------------------------
~ 24600 overall deaths in New York State each year can be attributed to tobacco use.
[out of ~146000 = 16.8% ]
---------------------------------------------------

=============================================

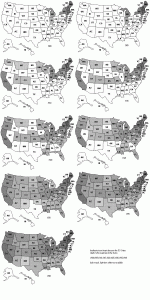
usisc00 : map of USA with States in grey depending on the amount
of heart-deaths
program usamap2.c , data from 1900-40.pdf


-------------------------edit--------------------------------------------
I was surprised about the charts that I saw here:
http://www.ncbi.nlm.nih.gov/pmc/articles/PMC1872652/?page=5

they show no increase in the English cardiovascular deathrate 1876-1890
 

Attachments

  • heamf2.gif
    heamf2.gif
    28.4 KB · Views: 2
  • usisc00.gif
    usisc00.gif
    81 KB · Views: 2
Re: mortality statistics

http://www.compassionatesouls.com/chapter3.html
Diarrhea and other common infections are usually minor in a fully breastfed infant
.
PRIOR TO ABOUT 1880 MOST BABIES WERE NURSED either by their mothers or wet nurses.
All of these factors increase the incidence of what has become known as "bottle-baby disease"--
a combination of diarrhea, dehydration, and malnutrition resulting from unsafe bottle-feeding.
According to the United Nations Children's Fund (UNICEF) one and a half million babies die
each year because they are not breastfed.

http://www.ncbi.nlm.nih.gov/pmc/articles/PMC1448139/
The medical community has orchestrated breastfeeding campaigns in response to low breastfeeding
rates twice in US history. The first campaigns occurred in the early 20th century after reformers linked
diarrhea, which caused the majority of infant deaths, to the use of cows? milk as an infant food.
By the late 1920s, with laws in most municipalities mandating the pasteurization and hygienic
handling of cows? milk, the urban breastfeeding campaign disappeared.

http://aof.revues.org/310
The two foremost causes of milk-related deaths amongst infants were tuberculosis and diarrhoea.
Milk was the medium of transmission from diseased cattle to unwitting consumers that led to
approximately 500,000 deaths amongst infants in the period 1850-1950, and up to 30 per cent
of all deaths from tuberculosis before 1930 (Atkins 2000a).
The hazard was only brought under control gradually as milk was increasingly pasteurized
in the 1930s and 1940s (Atkins 2000b)
From about 1900 there was a reaction to this trend.

It seems that breast-feeding rates in Britain were higher than in many continental countries
throughout the period 1880-1940.

-------------------------------

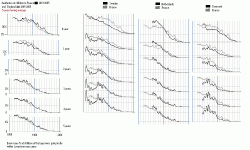
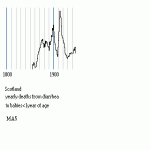
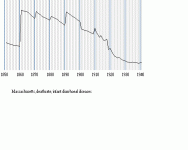
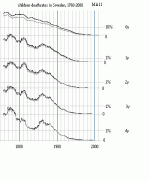
[charts : infant deaths from diarrhae in Scotland 1855-1950
England and Wales, 1838-1899
Massachusetts 1841-1920
USA 1900-2010


http://en.wikipedia.org/wiki/Diarrhea
About 1.7 to 5 billion cases of diarrhea occur per year.[2][3]
rotavirus is the most common cause in children under five years old.[15]
http://www.nature.com/pr/journal/v74/n4/carousel/pr2013130f1.gif

Massachusetts, yearly deaths <2y from Diarrhea
1910-1941
3303,2916,2786,2597,2508, 2532,2391,2502,2646,1493,1667
1332,1086,867,772,684,757,582,520,394,410
275,229,161,194,219,153,124,122,90,127,167
Code:
diarrhae         1851: 84 , 1861:190 , 1871:189 , 1881:333 , 1891:408 , 1901:2705
dysentery        1851:123 , 1861:348 , 1871:227 , 1881:159 , 1891: 76 , 1901:-
cholera infantum 1851:383 , 1861:1266, 1871:1718, 1881:1861, 1891:2771, 1901:-
 

Attachments

  • 3c50j.GIF
    3c50j.GIF
    26.8 KB · Views: 2
  • scdrh2.gif
    scdrh2.gif
    3.4 KB · Views: 1
  • MASS8CI.GIF
    MASS8CI.GIF
    5.5 KB · Views: 2
  • SWEY1.GIF
    SWEY1.GIF
    8.5 KB · Views: 3
Re: mortality statistics

2011 available (at last) , more later

http://www.nber.org/data/multicause.html

pdf-file with tables: http://www.cdc.gov/nchs/data/dvs/2011_Final_Mortality_Data_Release.pdf


2519842 deaths in USA in 2011, (including 4384 foreigners)

1261876 female, 1257966 male

234052,25354,75248
212112,23970,67516
225595,25263,70798
208652,21737,65308
208686,20997,64856
197685,18885,60840
202464,18365,62173
200907,17588,61368
195752,17037,59523
208310,18967,63970
206483,19508,64201
219144,21287,69135
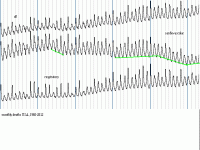
total,respiratory,circulatory deaths in the 12 months


seems that the downtrend in circulatory deaths since ~2003 has stopped
well, it's not seen yet in 2011/2012 in other countries
 

Attachments

  • 2011A.GIF
    2011A.GIF
    62.3 KB · Views: 2
  • WHOCIR21.GIF
    WHOCIR21.GIF
    11.5 KB · Views: 3
Re: mortality statistics

"Hispanics paradox"
http://www.ncbi.nlm.nih.gov/pubmed/24095273
Hispanics, the largest minority in the U.S., have a higher prevalence of several cardiovascular
(CV) risk factors than non-Hispanic whites (NHW). However, some studies have shown a
paradoxical lower rate of CV events among Hispanics than NHW.
22,340,554 Hispanics and 88,824,618 NHW, collected from 1950 to 2009.
There was a statistically significant association between Hispanic ethnicity and lower CV mortality
(OR 0.67), and lower all-cause mortality (0.72).
 
Re: mortality statistics

WHO: http://www.who.int/healthinfo/morttables/en/index.html
[link dead]

http://apps.who.int/healthinfo/stati...ality/whodpms/
(tables by cause,7 agegroups,selected countries, since 1979)
WHO Mortality Database Updated as of March 2012 ----edit-----Updated as of July 2014--------

WHO-Europe causes of death with subnational regions, since 1980 :
http://data.euro.who.int/hfamdb/


the WHO online mortality database had been updated in July 2014.
It now has cause-of-deaths numbers for 2011 and 2012 from
Armenia,Bulgaria,Croatia,Czechia,Estonia,Germany,Hungary,
Kazakhstan,Latvia,Norway,Moldova,Serbia,Seychelles, and Ukraine

the down-trend in deaths from cardiovascular
causes continues through 2012 in Germany.

[ There were some signs lately that it might have
stopped in USA and could be going up again ...]


the OECD database has 2012 data for
Austria,Czech,Denmark,Estonia,Finland,Germany,Hungary,Korea,Luxemburg,
Mexico,Netherlands,Norway,Poland,Portugal,Spain,Sweden

the average age standardized death rate for circulatory causes in these 16 countries
for 2009-2012 went: 327.8,318.9,302.4,298.8 (slowing down in 2012)


-------------------------------------------------------------------

Germany , SDR = standardized death rate (assuming age-distribution as of
Years
SDR(45-59), All causes, per 100000
SDR(60-74), All causes, per 100000
SDR(75+), All causes, per 100000
SDR(45-59), Diseases of the circulatory system, per 100000
SDR(60-74), Diseases of the circulatory system, per 100000
SDR(75+), Diseases of the circulatory system, per 100000

1990 594.48 2118.17 10214.6 169.46 919.52 6180.51
1991 583.04 2081.24 9971.72 164.95 891.45 6035.26
1992 564.55 2017.83 9547.74 154.66 850.88 5717.26
1993 558.31 2039.56 9570.97 149.77 850.70 5694.84
1994 544.62 2006.75 9224.18 145.63 826.79 5432.48
1995 530.73 1973.53 9076.30 139.95 810.97 5305.16
1996 521.70 1933.27 8982.11 134.58 776.92 5225.85
1997 504.72 1855.74 8687.21 130.08 745.19 5063.75
1998 487.41 1804.61 8622.19 125.73 716.36 5002.07
1999 476.70 1752.89 8463.85 119.69 681.16 4900.63
2000 472.73 1706.48 8220.10 114.68 636.28 4698.90
2001 465.62 1643.02 8056.97 114.74 605.53 4632.79
2002 464.05 1625.79 8235.69 112.91 588.90 4686.93
2003 457.94 1608.55 8442.67 109.54 573.41 4778.15
2004 438.52 1520.44 7956.24 103.02 518.66 4380.05
2005 433.67 1482.03 7936.56 102.01 488.18 4266.78
2006 422.97 1426.82 7602.93 098.23 456.67 4011.52
2007 414.81 1400.37 7456.68 097.05 437.82 3885.86
2008 409.48 1389.81 7478.62 090.37 413.00 3792.63
2009 406.24 1369.88 7401.14 089.43 399.83 3688.34
2010 397.85 1352.92 7247.44 086.31 381.82 3551.32
2011 389.06 1326.34 6989.33 080.17 358.98 3354.65
2012 376.88 1318.54 7018.00 078.50 356.42 3339.16


====================================================

http://stats.oecd.org/index.aspx?DataSetCode=HEALTH_STAT#

OECD, 35 countries , 23 of them since 1960
deathrates by causes , polulations

...............................................
temporary links, delete later
http://data.oecd.org/

statistics

by topic

health

http://www.oecd.org/statistics/compare-your-country.htm
health - causes of death


http://www.oecd-ilibrary.org/social...alth-data-health-care-resources_data-00541-en

http://www.oecd-ilibrary.org/social...th/data/oecd-health-statistics_health-data-en

http://stats.oecd.org/FileView2.aspx?IDFile=edf0104a-c335-4f22-aae8-a454850fd76b

http://stats.oecd.org/index.aspx?DataSetCode=HEALTH_STAT#

..................................................................

190 "variables" death-conditions etc, 27 "units" (sexes,),41 countries, 54 years (1960-2013) = 11357820 entries
you may download files of 1000000 entries

OECD populations, deaths from all causes available since 1950 at :
 

Attachments

  • ger2012a.GIF
    ger2012a.GIF
    23.1 KB · Views: 2
  • oecd4s0.gif
    oecd4s0.gif
    13 KB · Views: 2
  • W3H2G01.GIF
    W3H2G01.GIF
    48.6 KB · Views: 2
Re: mortality statistics

2012 is available from NCHS

http://www.cdc.gov/nchs/data_access/Vitalstatsonline.htm

96.2 MB for the .zip with the whole data for 2012
... downloading ... decompressing .... converting ....
[error - I continue tomorrow] ... corrected ... conversion done ... updating charts ...

here is a pdf with just the important numbers:
http://www.cdc.gov/nchs/data/nvsr/nvsr63/nvsr63_09.pdf

2547865 records up from 2519843


the trendchange in cardiovascular deaths has stabilized. The decline has stopped in 2010


------------------------------------------------------

the downtrend in deaths from circulatory causes has also stopped or slowed in 2012
in Armenia,Estonia,Germany,Norway

[UNO also has already Mexico,Argentina,Korea,Denmark,Spain,Sweden,Poland,Romania,Netherlands,Finland
for 2012]
 

Attachments

  • 2012b.GIF
    2012b.GIF
    18.3 KB · Views: 2
  • 2012C1.GIF
    2012C1.GIF
    10.8 KB · Views: 2
WHO also provides the raw data from their database !:
" difficult to find from the navigation."

http://www.who.int/healthinfo/statistics/mortality_rawdata/en/
227 countries, 29 agegroups, 2 sexes, 1950-2012,

many holes ,
4.2M lines country+year+table+cause+sex ,
each line upto 29 agegroups, depending on the list
(also non-uniform)

ICD 7, 1950-1967 , 150 causes "07A"
ICD 8 , 1968-1979 , 150 causes "08A"
ICD 9 , 1980-1998 , 150 cause "09A,09B"
ICD 10 , 1999- , 2600 cause "103" cause (3-digit) but most countries also have 4-digit "104"

bad data - different countries use different lists for disease encoding
and the lists change over time, entries are double counted ... 3digit and 4digit

needs to be processed, converted, missing values estimated
I found noone in those papers below who seemed to have done that

-------------------------------------------------------------

studies using that link:

http://www.ncbi.nlm.nih.gov/pmc/articles/PMC4045191/
http://rgm22.nig.ac.jp/mediawiki-ogareport/index.php/WHO
www.ncbi.nlm.nih.gov/pmc/articles/PMC3792976/
www.ncbi.nlm.nih.gov/pmc/articles/PMC4007591/
http://eurheartj.oxfordjournals.org/content/35/42/2950
https://ardoris.wordpress.com/
 
US-deaths decreasing ?

US-deaths decreasing ?


quarterly provisional mortality data USA :

http://www.cdc.gov/nchs/products/vsrr/mortality-dashboard.htm

----------2016/08/18 --------2016-Q1 , 2016-Q2*-------
12month,all: 823.6,835.4,839.9,844.1,838.2,834.9
12month,all: 823.7,838.0,843.0,847.4,844.0,837.0,836.1*
age-adjusted:724.6,731.2,733.8,735.7,728.0,721.5
Age-adjusted:724.6,733.5,736.4,738.6,733.1,723.6,720.2 *

heart:192.7,195.6,196.6,197.7,195.8,194.0
heart:192.7,196.1,197.2,198.4,197.2,194.8,194.4*

heart:167.0.168.6.169.1.169.6.167.2.164.7
heart:167.0,169.0,169.6,170.2,168.5,165.5,164.4*


P_I - ratio is also decreasing :

http://www.cdc.gov/flu/weekly/weeklyarchives2016-2017/data/NCHSData46.csv


is it real or due to reporting habits/definitions ?


quarterly provisional mortality data USA :

http://www.cdc.gov/nchs/products/vsrr/mortality-dashboard.htm

----------2016/08/18 --------2016-Q1 , 2016-Q2*-------
12month,all: 823.6,835.4,839.9,844.1,838.2,834.9
12month,all: 823.7,838.0,843.0,847.4,844.0,837.0,836.1*
age-adjusted:724.6,731.2,733.8,735.7,728.0,721.5
Age-adjusted:724.6,733.5,736.4,738.6,733.1,723.6,720.2 *

heart:192.7,195.6,196.6,197.7,195.8,194.0
heart:192.7,196.1,197.2,198.4,197.2,194.8,194.4*

heart:167.0.168.6.169.1.169.6.167.2.164.7
heart:167.0,169.0,169.6,170.2,168.5,165.5,164.4*


P_I - ratio is also decreasing :

http://www.cdc.gov/flu/weekly/weeklyarchives2016-2017/data/NCHSData46.csv


is it real or due to reporting habits/definitions ?
 
Well, I have noticed in the last few years that some US statistics are not 100% correct. For instance today the unemployment rate is published as 4.6 % link - which is full employment. That means anyone who wants a job in the US can certainly get one. But, in reality, can they?

The unemployment rate does not account for the decrease in the ratio of the number of people participating in the labor force. In fact, the number of people who are in the labor force dropped by .1% last month to 62.7. link This roughly equates to 226,000 less people working in November than in October 2016. link

In my opinion, the US stats, generally, are in the "interesting" category. We publish them here as a baseline and not for 100% factual representation.
 
When information is disseminated for effect rather than for education.
The term was popularised in United States by Mark Twain (among others), who attributed it to the British Prime Minister Benjamin Disraeli: "There are three kinds of lies: lies, damned lies, and statistics."
 
Exactly. This also why I am really irritated by the issue of "fake" news. Isn't the unemployment rate calculated and published by the US Department of Labor really "fake news" since it does not give an accurate calculation of the employment situation in the US? Why are all of main stream media pushing this rate? This rate should be explained by media AS PART of the picture of the employment situation in the US. Yet, mostly it is not explained in this fashion. Why? Because the government publishes this number as an accurate measure and therefore, it is "real"?

FluTrackers has always promoted the idea that people should use at least 2 sources for their news. Be critical. Always question.

Look behind the curtain.
 
FluTrackers has been very conscientious, diligent in seeking published information, from all public sources while avoiding Editorial added content for all the years that I have been reading here.

Medical practitioners, Scientists, and people on the ground, in place to give their perspective of what is going on around them, all gathered here for any one who cares to make the effort to read.

I read here nearly every day.

Thank you!
 
>1974-1976 USA-deaths-decline (posts #13ff)

ahh, it's mainly PM2.5 air pollution (particles smaller than 2.5 micrometers) which causes coronary heart disease.
AHA had an official statement in 2003, confirmed in 2014. Then a joint statement with WHO in 2021.
Is it well-known ? I only found it recently. Not cholesterol, inactivity, hypertension,TMAO,...
It took quite a while until they figured it out. At that time it was already almost over in USA.
USA's "EPA" was founded in late 1970 and active in the early 1970s.
The biggeest decline in 1974-1976 however was in stroke-deaths and this was
achieved by hypertension control (says ASA) with just coincidentally
also increased a lot lust before 1974.
Another causes was probably bypass surgery and computer tomography
which started at that time.
Also speed=limitation on highways (1974) and "oil-price-shock" (late 1973)
 
the delayed 2022 data is available now at NCHS
https://www.cdc.gov/nchs/data_access/vitalstatsonline.htm#Mortality_Multiple

trends by cause : http://magictour.free.fr/usa22.GIF

covid has its new own code : U0 and is usually not included
under other causes (e.g. respiratory) unless the cause of death
is clearly not covid

USA-deaths
2019:all:2861523,U0:000037
2020:all:3390278,U0:351620
2021:all:3472120,U0:417934
2022:all:3289569,U0:187029

increase in non-covid deaths : liver-disease and diabetes
 
Back
Top