• FluTrackers.com Inc. does not provide medical advice. Information on this web site is collected from various internet resources, and the FluTrackers board of directors makes no warranty to the safety, efficacy, correctness or completeness of the information posted on this site by any author or poster. The information collated here is for instructional and/or discussion purposes only and is NOT intended to diagnose or treat any disease, illness, or other medical condition. Every individual reader or poster should seek advice from their personal physician/healthcare practitioner before considering or using any interventions that are discussed on this website. By continuing to access this website you agree to consult your personal physican before using any interventions posted on this website, and you agree to hold harmless FluTrackers.com Inc., the board of directors, the members, and all authors and posters for any effects from use of any medication, supplement, vitamin or other substance, device, intervention, etc. mentioned in posts on this website, or other internet venues referenced in posts on this website.
  • We are not asking for any donations. Do not donate to any entity who says they are raising funds for us.

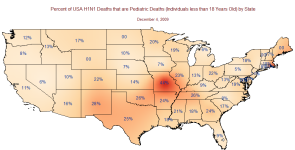
Map - USA, Percent of Pediatric Deaths by State December 4, 2009

Laidback Al

Well-known member
Missouri has the highest percentage of H1N1 pediatrics deaths in the USA, at 44%, followed by Rhode Island at 36%. These may be outliers because each of these states has only recorded 9 and 11 H1N1 deaths respectively. For California and Florida, the two states with the highest number of H1N1 deaths, the percent of pediatric deaths is about 11% and 9% respectively.

Data sources:

Total USA H1N1 deaths by states: http://www.flutrackers.com/forum/showpost.php?p=324042&postcount=23


Total USA pediatric deaths by states:http://www.flutrackers.com/forum/showpost.php?p=325843&postcount=66

Percent of USA Pedriatic Deaths by State 20091204.png

credits to JimO for collecting and tabulating the data.
<o:p> </o:p>
 
Re: Map - USA, Percent of Pediatric Deaths by State December 4, 2009

Thanks JIMo for the map

Laidback

What has happenned in Missouri

Any more datas?
 
Re: Map - USA, Percent of Pediatric Deaths by State December 4, 2009

When comparing P&I deaths recorded in MO (adult and pediatric) with MMWR listings for St. Louis and Kansas City recorded for the season...

MO lists a total of 558, while on MMWR (for cities St. Louis & KC) it totals 80. So one might extrapolate that MMWR is approximately one-seventh of what it actually is. Therefore, one might also assume pediatric deaths are one-seventh of what they are showing for MO. I haven't compared other states on MMWR with actual numbers to see how they compare.

Assuming the above, MMWR listing 3, multiplied by 7 would be 21 pediatric P&I deaths.
 
Re: Map - USA, Percent of Pediatric Deaths by State December 4, 2009

<meta http-equiv="Content-Type" content="text/html; charset=utf-8"><meta name="ProgId" content="Word.Document"><meta name="Generator" content="Microsoft Word 10"><meta name="Originator" content="Microsoft Word 10"><link rel="File-List" href="file:///D:%5CDOCUME%7E1%5CADMINI%7E1%5CLOCALS%7E1%5CTemp%5Cmsohtml1%5C01%5Cclip_filelist.xml"><o:smarttagtype namespaceuri="urn:schemas-microsoft-com:office:smarttags" name="country-region"></o:smarttagtype><o:smarttagtype namespaceuri="urn:schemas-microsoft-com:office:smarttags" name="place"></o:smarttagtype><!--[if gte mso 9]><xml> <o:OfficeDocumentSettings> <o:RelyOnVML/> <o:AllowPNG/> </o:OfficeDocumentSettings> </xml><![endif]--><!--[if gte mso 9]><xml> <w:WordDocument> <w:View>Normal</w:View> <w:Zoom>0</w:Zoom> <w:Compatibility> <w:BreakWrappedTables/> <w:SnapToGridInCell/> <w:WrapTextWithPunct/> <w:UseAsianBreakRules/> </w:Compatibility> </w:WordDocument> </xml><![endif]--><!--[if !mso]><object classid="clsid:38481807-CA0E-42D2-BF39-B33AF135CC4D" id=ieooui></object> <style> st1\:*{behavior:url(#ieooui) } </style> <![endif]--><style> <!-- /* Style Definitions */ p.MsoNormal, li.MsoNormal, div.MsoNormal {mso-style-parent:""; margin:0cm; margin-bottom:.0001pt; mso-pagination:widow-orphan; font-size:12.0pt; font-family:"Times New Roman"; mso-fareast-font-family:"Times New Roman"; mso-ansi-language:EN-GB;} @page Section1 {size:612.0pt 792.0pt; margin:72.0pt 90.0pt 72.0pt 90.0pt; mso-header-margin:35.4pt; mso-footer-margin:35.4pt; mso-paper-source:0;} div.Section1 {page:Section1;} --> </style><!--[if gte mso 10]> <style> /* Style Definitions */ table.MsoNormalTable {mso-style-name:"Table Normal"; mso-tstyle-rowband-size:0; mso-tstyle-colband-size:0; mso-style-noshow:yes; mso-style-parent:""; mso-padding-alt:0cm 5.4pt 0cm 5.4pt; mso-para-margin:0cm; mso-para-margin-bottom:.0001pt; mso-pagination:widow-orphan; font-size:10.0pt; font-family:"Times New Roman";} </style> <![endif]--> We need to be very careful playing the numbers game. States are obliged to provide information on children that die - including if it was H1N1 - in a way that dies not apply to adults. Therefore the only really reliable information we have relates to dead children (this applies to the <st1:country-region><st1:place>US</st1:place></st1:country-region> only). IF we could accurately work out what percentage of H1N1 were in children we could use the child mortality data to get a better guide to adult deaths. The numbers that are going to be comparable to the way we gather seasonal flu deaths are only going to be available afterwards by comparing total excess mortality figures against seasonal averages.
These maps may be telling us more about data collection and centralised reporting than the H1N1 deaths by age group.
<o:p> </o:p>
 
Re: Map - USA, Percent of Pediatric Deaths by State December 4, 2009

And realistically, pediatric fatality data is not as accurate as we once thought it to be. In week 41, the fluview counted 101 confirmed fatalities between weeks 20 and 41. The week 47 fluview has added another 48 fatalities to that period giving a new tally of 149. But the CDC has estimates of between 300 and 800 pediatric fatalities for that period. There's both a lag and a wide margin of error.
Using the CDC's estimates http://cdc.gov/h1n1flu/estimates_2009_h1n1.htm ,
pediatric deaths could be anything from 5% to 32% of the total national fatalities as of October 17, with the mid-level range coming out at around 14%.
 
Re: Map - USA, Percent of Pediatric Deaths by State December 4, 2009

<meta http-equiv="Content-Type" content="text/html; charset=utf-8"><meta name="ProgId" content="Word.Document"><meta name="Generator" content="Microsoft Word 10"><meta name="Originator" content="Microsoft Word 10"><link rel="File-List" href="file:///D:%5CDOCUME%7E1%5CADMINI%7E1%5CLOCALS%7E1%5CTemp%5Cmsohtml1%5C01%5Cclip_filelist.xml"><o:smarttagtype namespaceuri="urn:schemas-microsoft-com:office:smarttags" name="country-region"></o:smarttagtype><o:smarttagtype namespaceuri="urn:schemas-microsoft-com:office:smarttags" name="place"></o:smarttagtype><!--[if gte mso 9]><xml> <o:OfficeDocumentSettings> <o:RelyOnVML/> <o:AllowPNG/> </o:OfficeDocumentSettings> </xml><![endif]--><!--[if gte mso 9]><xml> <w:WordDocument> <w:View>Normal</w:View> <w:Zoom>0</w:Zoom> <w:Compatibility> <w:BreakWrappedTables/> <w:SnapToGridInCell/> <w:WrapTextWithPunct/> <w:UseAsianBreakRules/> </w:Compatibility> </w:WordDocument> </xml><![endif]--><!--[if !mso]><object classid="clsid:38481807-CA0E-42D2-BF39-B33AF135CC4D" id=ieooui></object> <style> st1\:*{behavior:url(#ieooui) } </style> <![endif]--><style> <!-- /* Style Definitions */ p.MsoNormal, li.MsoNormal, div.MsoNormal {mso-style-parent:""; margin:0cm; margin-bottom:.0001pt; mso-pagination:widow-orphan; font-size:12.0pt; font-family:"Times New Roman"; mso-fareast-font-family:"Times New Roman"; mso-ansi-language:EN-GB;} @page Section1 {size:612.0pt 792.0pt; margin:72.0pt 90.0pt 72.0pt 90.0pt; mso-header-margin:35.4pt; mso-footer-margin:35.4pt; mso-paper-source:0;} div.Section1 {page:Section1;} --> </style><!--[if gte mso 10]> <style> /* Style Definitions */ table.MsoNormalTable {mso-style-name:"Table Normal"; mso-tstyle-rowband-size:0; mso-tstyle-colband-size:0; mso-style-noshow:yes; mso-style-parent:""; mso-padding-alt:0cm 5.4pt 0cm 5.4pt; mso-para-margin:0cm; mso-para-margin-bottom:.0001pt; mso-pagination:widow-orphan; font-size:10.0pt; font-family:"Times New Roman";} </style> <![endif]--> We need to be very careful playing the numbers game. States are obliged to provide information on children that die - including if it was H1N1 - in a way that dies not apply to adults. Therefore the only really reliable information we have relates to dead children (this applies to the <st1:country-region><st1:place>US</st1:place></st1:country-region> only). IF we could accurately work out what percentage of H1N1 were in children we could use the child mortality data to get a better guide to adult deaths. The numbers that are going to be comparable to the way we gather seasonal flu deaths are only going to be available afterwards by comparing total excess mortality figures against seasonal averages.
These maps may be telling us more about data collection and centralised reporting than the H1N1 deaths by age group.
<o:p> </o:p>

I agree.
 
Re: Map - USA, Percent of Pediatric Deaths by State December 4, 2009

And realistically, pediatric fatality data is not as accurate as we once thought it to be. In week 41, the fluview counted 101 confirmed fatalities between weeks 20 and 41. The week 47 fluview has added another 48 fatalities to that period giving a new tally of 149. But the CDC has estimates of between 300 and 800 pediatric fatalities for that period. There's both a lag and a wide margin of error.
Using the CDC's estimates http://cdc.gov/h1n1flu/estimates_2009_h1n1.htm ,
pediatric deaths could be anything from 5% to 32% of the total national fatalities as of October 17, with the mid-level range coming out at around 14%.

Based on the numbers in JimO's data, the average percent of H1N1 deaths that are pediatric deaths in the US is about 15%.
 
Re: Map - USA, Percent of Pediatric Deaths by State December 4, 2009

We need to be very careful playing the numbers game. States are obliged to provide information on children that die - including if it was H1N1 - in a way that dies not apply to adults. Therefore the only really reliable information we have relates to dead children (this applies to the <st1:country-region><st1:place>US</st1:place></st1:country-region> only). IF we could accurately work out what percentage of H1N1 were in children we could use the child mortality data to get a better guide to adult deaths. The numbers that are going to be comparable to the way we gather seasonal flu deaths are only going to be available afterwards by comparing total excess mortality figures against seasonal averages.
These maps may be telling us more about data collection and centralised reporting than the H1N1 deaths by age group.
<o:p> </o:p>

I agree also. It is clearly an indictment of the CDC?s ability and responsibility to provide accurate and timely information on the current epidemiological parameters of this pandemic.

We work with the data we have. Any suggestions on more current and accurate counts of H1N1 infections, hospitalizations, and deaths in the US?
<o:p> </o:p>
<o:p> </o:p>
<o:p> </o:p>
 
Re: Map - USA, Percent of Pediatric Deaths by State December 4, 2009

Based on the numbers in JimO's data, the average percent of H1N1 deaths that are pediatric deaths in the US is about 15%.
Some states have made all influenza deaths reportable. I know North Carolina and Tennessee did with the start of the 2009-10 season. I can't be sure, but I believe there are others. The percentage of deaths that are pediatric in NC and TN are 7% and 24%, respectively, which is a pretty broad range that could be influenced by many factors, including population age distribution, timeliness of school closings, efficiency of vaccination programs, etc.

I used to think that pediatric influenza death numbers were pretty accurate given the reporting requirement; however, since the CDC issued estimated numbers of deaths in October, with pretty big ranges, I see that the CDC isn't that confident that most pediatric influenza deaths are being diagnosed or reported.

I find it interesting that the CDC hasn't issued another estimate of deaths even though they indicated that they would be doing so approximately every two weeks. Maybe they underestimated the importance the media would place on the estimates. :whistle:
 
Back
Top