Follow along with the video below to see how to install our site as a web app on your home screen.
Note: This feature may not be available in some browsers.
FluTrackers.com Inc. does not provide medical advice. Information on this web site is collected from various internet resources, and the FluTrackers board of directors makes no warranty to the safety, efficacy, correctness or completeness of the information posted on this site by any author or poster.
The information collated here is for instructional and/or discussion purposes only and is NOT intended to diagnose or treat any disease, illness, or other medical condition. Every individual reader or poster should seek advice from their personal physician/healthcare practitioner before considering or using any interventions that are discussed on this website.
By continuing to access this website you agree to consult your personal physican before using any interventions posted on this website, and you agree to hold harmless FluTrackers.com Inc., the board of directors, the members, and all authors and posters for any effects from use of any medication, supplement, vitamin or other substance, device, intervention, etc. mentioned in posts on this website, or other internet venues referenced in posts on this website.
We are not asking for any donations. Do not donate to any entity who says they are raising funds for us.
Week 44:
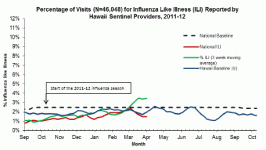
ILI: 1.6%
P&I deaths: 12.9%
No pediatric influenza-associated deaths since beginning of flu season.
Since the beginning of the 2011?12 influenza season (MMWR week 40, 2011), a total of 1,127 specimens have been tested statewide for influenza viruses. Of these, 648 (57.5%) were screened only by rapid antigen tests whereas the remaining 479 (42.5%) underwent some type of confirmatory testing (either RT-PCR or viral culture). Altogether a total of 33 (2.9%) cases of influenza A and 10 (0.9%) cases of influenza B were detected using any method. Of the influenza A cases detected, 2 (6.1%) were 2009 H1N1, 17 (51.5%) were influenza A (H3), 1 (3.0%) were seasonal influenza A (H1), and the remaining (n = 13, 39.4%) were influenza A of unknown subtype.
Week 47:
ILI: 0.9%
P&I deaths: 12.9%
No pediatric influenza-associated deaths since beginning of flu season.
Week 46 positives for influenza included A(H3), 2009 A(H1N1) and B
Week 47 positive for A(H3); of the 3.8% specimens that did test positive for influenza, more were likely to be aged 5–24 years than any other age group. http://hawaii.gov/health/flu-hawaii-gov/surveillance.html
Week 48:
ILI: 1.9%
P&I deaths: 8.5%
Since the season began, a total of 43 (2.2%) cases of influenza A and 14 (0.7%) cases of influenza B were detected using any method. Of the influenza A cases detected, 3 (7.0%) were 2009 H1N1, 20 (46.5%) were influenza A (H3), 1 (2.3%) were seasonal influenza A (H1), and the remaining (n = 19, 44.2%) were influenza A of unknown subtype.
NOTE: WHO "strongly recommends that all un-subtypable influenza A specimens should be immediately sent for diagnosis and further characterization..." http://www.who.int/influenza/human_animal_interface/avian_influenza/h5n1-2011_12_19/en/index.html
Week 2: Sporadic
ILI: 1.1% P&I deaths: 21.7%
Influenza A, A(H3) and B detected
Of the 3.3% specimens that did test positive for influenza, more were likely to be aged 5–24 years than any other age group. http://hawaii.gov/health/flu-hawaii-gov/surveillance.html
Week 4: Sporadic
ILI: 2.5%
P&I deaths: 2.4%
Influenza A detected
Cumulatively, of the 2.8% specimens that did test positive for influenza, more were likely to be aged 5–24 years than any other age group. http://hawaii.gov/health/flu-hawaii-gov/surveillance.html
Week 7: Sporadic
ILI: 2%
P&I: 18.1% (Honolulu P&I mortality for week 7 was higher than both the epidemic threshold (7.9%) and national P&I mortality (7.3%).
Positive for influenza A.
Specimens tested during the 2011?12 influenza season: Of the 4.7% specimens that did test positive for influenza, more were likely to be aged 5?24 years than any other age group. http://hawaii.gov/health/flu-hawaii-gov/surveillance.html
Week 9: Sporadic
ILI: 2%
P&I deaths: 11.1%
Of the 6.3% specimens that did test positive for influenza since season began, more were likely to be aged 5–24 years than any other age group. http://hawaii.gov/health/flu-hawaii-gov/surveillance.html
Week 14: Sporadic
ILI: 4.8% (Outpatient ILI reported during week 14 of 2012 was higher than the historical baseline in Hawaii)
P&I deaths: 13.3%
Of the 11.6% specimens that did test positive for influenza since the season began, more were likely to be aged 5–24 years than any other age group. http://hawaii.gov/health/flu-hawaii-gov/surveillance.html
Week 15: Sporadic
ILI: 3% (Outpatient ILI reported during week 14 of 2012 was higher than the historical baseline in Hawaii)
P&I deaths: 14.3%
Of the 16.9% specimens that did test positive for influenza since the season began, more were likely to be aged 5?24 years than any other age group.
~28% positive for influenza http://hawaii.gov/health/flu-hawaii-gov/surveillance.html