• FluTrackers.com Inc. does not provide medical advice. Information on this web site is collected from various internet resources, and the FluTrackers board of directors makes no warranty to the safety, efficacy, correctness or completeness of the information posted on this site by any author or poster. The information collated here is for instructional and/or discussion purposes only and is NOT intended to diagnose or treat any disease, illness, or other medical condition. Every individual reader or poster should seek advice from their personal physician/healthcare practitioner before considering or using any interventions that are discussed on this website. By continuing to access this website you agree to consult your personal physican before using any interventions posted on this website, and you agree to hold harmless FluTrackers.com Inc., the board of directors, the members, and all authors and posters for any effects from use of any medication, supplement, vitamin or other substance, device, intervention, etc. mentioned in posts on this website, or other internet venues referenced in posts on this website.
  • We are not asking for any donations. Do not donate to any entity who says they are raising funds for us.

Graph - Cumulative Count of CDC confirmed S-OI A/H1N1 Cases in the USA, May 6, 2009

Laidback Al

Well-known member
Graph - Cumulative Count of CDC onfirmed S-OI A/H1N1 Cases in the USA, May 5, 2009

The following graph is based on the update of confirmed cased provided by the CDC on May 5, 2009 at: http://www.cdc.gov/h1n1flu/ and from past updates provided by the CDC at that same url.

It is important to note that this graph is still showing an exponential increase in the number of confirmed cases in the USA. It does not indicate that we have yet reached the peak and that the counts are decelerating.
USA Case Counts  20090505.jpg
 
Re: Graph - Cumulative Count of CDC confirmed S-OI A/H1N1 Cases in the USA, May 5, 2009

Re: Graph - Cumulative Count of CDC confirmed S-OI A/H1N1 Cases in the USA, May 5, 2009

the black curve is well above the red bars
 
Re: Graph - Cumulative Count of CDC confirmed S-OI A/H1N1 Cases in the USA, May 5, 2009

Re: Graph - Cumulative Count of CDC confirmed S-OI A/H1N1 Cases in the USA, May 5, 2009

the black curve is well above the red bars

The trend is still exponential rather than linear or declining. Tommorrow's numbers from the CDC may show that the infection rate has decelerated. If there is a deceleration it will show up in the graph but will be lagging.
 
Re: Graph - Cumulative Count of CDC confirmed S-OI A/H1N1 Cases in the USA, May 5, 2009

Re: Graph - Cumulative Count of CDC confirmed S-OI A/H1N1 Cases in the USA, May 5, 2009

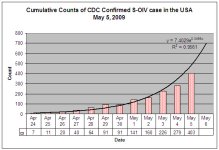
Graph - Cumulative Count of CDC confirmed S-OI A/H1N1 Cases in the USA, May 5, 2009

The following graph is based on the update of confirmed cased provided by the CDC on May 5, 2009 at: http://www.cdc.gov/h1n1flu/ and from past updates provided by the CDC at that same url.

It is important to note that this graph is still showing an exponential increase in the number of confirmed cases in the USA. It does not indicate that we have yet reached the peak and that the counts are decelerating.

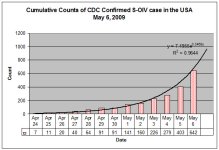
The graph based on today's official report is still showing an upward trend.

USA Case Counts  20090506.jpg
 
Re: Graph - Cumulative Count of CDC confirmed S-OI A/H1N1 Cases in the USA, May 6, 2009 (see last post)

Re: Graph - Cumulative Count of CDC confirmed S-OI A/H1N1 Cases in the USA, May 6, 2009 (see last post)

Sorry, but are these data by:

- the date the test confirmed H1N1
- the date the sample was taken
- the date the person became sick?

Due the backlog of test samples, we would expect a daily increase if the graph is drawn based on the date the case is confirmed. But we really don't know if things are getting better or worse unless the sample is tracked back in time and the graph is restated.

[ Sorry, I know this should be a discussion, rather than news, but I find it very hard to make that happen.]

J.
 
Re: Graph - Cumulative Count of CDC confirmed S-OI A/H1N1 Cases in the USA, May 6, 2009 (see last post)

Re: Graph - Cumulative Count of CDC confirmed S-OI A/H1N1 Cases in the USA, May 6, 2009 (see last post)

Sorry, but are these data by:

- the date the test confirmed H1N1
- the date the sample was taken
- the date the person became sick?

Due the backlog of test samples, we would expect a daily increase if the graph is drawn based on the date the case is confirmed. But we really don't know if things are getting better or worse unless the sample is tracked back in time and the graph is restated.

[ Sorry, I know this should be a discussion, rather than news, but I find it very hard to make that happen.]

J.

Cartski, those are good questions. The data is based strictly on the numbers reported by the CDC on a daily basis. I believe that the numbers are tabulated based on the number of cases that the CDC confirms in the preceding 24 hour period. I am not aware of any publicly accessible database that has individual demographic or epidemiological data on individuals cases such as date of onset, age, sex, etc. We have to rely on the daily CDC briefings to interpret these numbers for us.

You can see there is a steady geometric progression in the numbers. At the beginning of the outbreak, it is understandable that there may have been a backlog of samples for testing. But we are now more than two weeks into this outbreak. If this is as serious as it seems to be, I would think that the CDC would have thrown all available resources into this and ramped up its personnel and testing activities to clear up any back logs. So, if they are still having a back log of samples to be tested, I can only conclude that the numbers of suspected cases are still rising across the USA.

If we have reached an infection peak or plateau, the numbers, no matter how they are measured, should no longer be rising.
 
Re: Graph - Cumulative Count of CDC confirmed S-OI A/H1N1 Cases in the USA, May 6, 2009

If these graphs existed outside this website, there would be no need to post them here.

I agree that WHO and CDC data should be regarded as a lower bound on the growth curve, as delayed/back reporting would only tend to raise the least-squares fit.

Predictions about when the curve will more closely approaches a logistic curve are welcome.

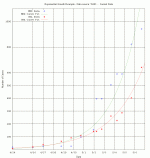
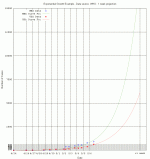
I projected forward 7 days from now and created this graph below. Discussion is welcome about the implications of whether WHO or CDC data fall above or below the present predicted curve.

imag2.gif
image1.gif
 
Last edited by a moderator:
Re: Graph - Cumulative Count of CDC confirmed S-OI A/H1N1 Cases in the USA, May 6, 2009

Pert - Welcome to FluTrackers and thanks for posting the graphs.

The graphs you posted represent a hypothesis that the infection rate is still growing in both Mexico and the USA. Within a week we will see how closely the actual number of infections coincide with your projections.
 
Last edited:
Re: Graph - Cumulative Count of CDC confirmed S-OI A/H1N1 Cases in the USA, May 6, 2009

it's also worth to look at Spain separately, that's presumably where WHO
decides to go to 6.

And world-North-America

(at least weekly)
 
Re: Graph - Cumulative Count of CDC confirmed S-OI A/H1N1 Cases in the USA, May 6, 2009 (see last post)

Re: Graph - Cumulative Count of CDC confirmed S-OI A/H1N1 Cases in the USA, May 6, 2009 (see last post)

If this is as serious as it seems to be, I would think that the CDC would have thrown all available resources into this and ramped up its personnel and testing activities to clear up any back logs. So, if they are still having a back log of samples to be tested, I can only conclude that the numbers of suspected cases are still rising across the USA.

If we have reached an infection peak or plateau, the numbers, no matter how they are measured, should no longer be rising.

Thanks. But I don't follow this. The 35,000 testing backlog was posted when, late last week? And there was a capacity post of 100 test per day - not sure if that was CDC, Winnipeg, or local labs. Even at 300 tests per day, and lots of overtime, that's a lot of days before they're up to date. So in reality we may be at an infection peak, but by measurement, it may seem that the cases are still rising. There must be a significant lag.

Not that I believe that we are at an infection peak. I think Dr. N. has a better estimate, that there are 200k infections in Canada that are not reported, etc. Friends back from the Boston Marathon are sick; overheard conversations at coffee shops are about being bed-ridden with sickness; a minimum of 70:1 contact ratio, etc. And here in Winnipeg, the West Nile capital of North America, we are quite familiar with the fact that we all have antibodies, but are not clinically sick. The titer of the virus may be low, but it is pervasive.

J.
 
Re: Graph - Cumulative Count of CDC confirmed S-OI A/H1N1 Cases in the USA, May 6, 2009 (see last post)

Re: Graph - Cumulative Count of CDC confirmed S-OI A/H1N1 Cases in the USA, May 6, 2009 (see last post)

Thanks. But I don't follow this. The 35,000 testing backlog was posted when, late last week? And there was a capacity post of 100 test per day - not sure if that was CDC, Winnipeg, or local labs. Even at 300 tests per day, and lots of overtime, that's a lot of days before they're up to date. So in reality we may be at an infection peak, but by measurement, it may seem that the cases are still rising. There must be a significant lag.

Not that I believe that we are at an infection peak. I think Dr. N. has a better estimate, that there are 200k infections in Canada that are not reported, etc. Friends back from the Boston Marathon are sick; overheard conversations at coffee shops are about being bed-ridden with sickness; a minimum of 70:1 contact ratio, etc. And here in Winnipeg, the West Nile capital of North America, we are quite familiar with the fact that we all have antibodies, but are not clinically sick. The titer of the virus may be low, but it is pervasive.

J.

We have to turn to somewhere to get an "official" count. Anecdotal accounts of friends and relatives doesn't get the job done. Niman's estimates are most likely realistic, but don't count as "official" information.

I am more dismayed with the progress that is being made. I would hope that 2 weeks into a pandemic the CDC would be better staffed and prepared to eliminate the backlog in short order.

Isn't this the event that the CDC has been preparing for since 1976? When are we going to get some realistic numbers, weeks or months after it is over?
 
Re: Graph - Cumulative Count of CDC confirmed S-OI A/H1N1 Cases in the USA, May 6, 2009

But the figures in the latest MMWR report are "date of illness onset":

(sorry, don't know how to post the actual pic)


http://www.cdc.gov/mmwr/preview/mmwrhtml/mm5817a1.htm?s_cid=mm5817a1_e

FIGURE 1. Number of confirmed (N = 822) and suspected (N = 11,356) cases of novel influenza A (H1N1) virus infection, by date of illness onset --- Mexico, March 11--May 3, 2009


Cartski -

If you believe their results, the graphs are reassuring because they show that there is fall off in cases based on the dates of onset. So maybe the worst is over.

This, however, can not be true if your claim that there are still thousands of backlogged samples that haven't been processed. In that case, the only thing those graphs are showing (without the backlogged samples being processed) is that they haven't finished processing samples with more recent onset dates.
 
Re: Graph - Cumulative Count of CDC confirmed S-OI A/H1N1 Cases in the USA, May 6, 2009

Cartski -

This, however, can not be true if your claim that there are still thousands of backlogged samples that haven't been processed. In that case, the only thing those graphs are showing (without the backlogged samples being processed) is that they haven't finished processing samples with more recent onset dates.

Unless there is something I've missed (likely) about the number of backlogged samples, I agree that the graphs show that they haven't finished processing. But it's not necessarily the case that the samples are from more recent onset dates - the samples could be older too. CDC may sort the samples by onset date, but the sending lab/country may not submit them in date order, and it's possible for the HCW to take a sample much later than the illness onset date, I assume, even post-mortem. Has CDC restated the number of earlier onset cases in subsequent versions of the graph?

I noticed also that CDC is calling this a "worldwide outbreak", rather than a pandemic, which I thought was the correct term upon reaching level 5.

J.
 
Re: Graph - Cumulative Count of CDC confirmed S-OI A/H1N1 Cases in the USA, May 6, 2009

m817a1f2.gif


Text says. The figure above shows the 394 confirmed and 414 probable cases of novel influenza A (H1N1) virus infection in the United States with known dates of onset from March 28 through May 4, 2009. Both confirmed and probable cases rose sharply from April 21 to April 27, then decreased sharply.

We know that many areas are NOW not testing unless cases hospitalised, or severe, or individuals are in at risk groups. This was not always the case. We also know that there is a large backlog of tests.

Therefore this re-assuring trend indicated in this graph must be questioned until it enough time has passed to see new trends under the new rules.
 
Re: Graph - Cumulative Count of CDC confirmed S-OI A/H1N1 Cases in the USA, May 6, 2009

In the same vein, regarding how calculations are done, you may want to see the Mexican Government study. I don't know how to account for the graphics shapes, what biais they may have owing to the "holiday" decreed by their government. They might update this paper, I suppose, in a few days' time, and we'll perhaps then see what trends may show. I don't know how to extract a graph from a pdf file to show here. So perhaps, if this link is useful in the comparison of figures between US & Mexico, you may know how to post such graphs.
 
Re: Graph - Cumulative Count of CDC confirmed S-OI A/H1N1 Cases in the USA, May 6, 2009

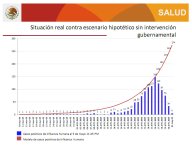
Wow - doesn't slide #12 look familiar? Situaci?n real contra escenario hipot?tico sin intervenci?n gubernamental

And I wish I could understand #8 Canal end?mico de infecciones respiratorias agudas, 2009

J.
 
Re: Graph - Cumulative Count of CDC confirmed S-OI A/H1N1 Cases in the USA, May 6, 2009

Here is an image of slide #12.

Mexico Cumulaive Cases.jpg

I guess we have worried ourselves over nothing. It was on the 24th of April that the CDC first noted the link between the California/Texas cases in the USA with cases in Mexico. But, according to this image, the infections in Mexico peaked only two days later after the CDC announcement and have been declining ever since.
 
Re: Graph - Cumulative Count of CDC confirmed S-OI A/H1N1 Cases in the USA, May 6, 2009

Mind you, Mexico's just had a "sickness holiday". So perhaps, once people get back to work, might they start to be tired and more susceptible to catching flu?
 
Re: Graph - Cumulative Count of CDC confirmed S-OI A/H1N1 Cases in the USA, May 6, 2009

Al - A large number of figures have been downgraded then upgraded e.g. deaths etc in mexico. I am a little wary of taking these data entirely at face value at the moment, given the changeable nature of positive and negative tests on the same patients.

I think we need to wait and see what the numbers are in the days ahead, to make sure this is a proper reflection of the reality rather than reporting delays, changes in reporting / testing rules or even a response to containement measures that could again be reversed.

I am sure we will all breathe a sigh of releif if they prove to be accurate.
 
Back
Top