• FluTrackers.com Inc. does not provide medical advice. Information on this web site is collected from various internet resources, and the FluTrackers board of directors makes no warranty to the safety, efficacy, correctness or completeness of the information posted on this site by any author or poster. The information collated here is for instructional and/or discussion purposes only and is NOT intended to diagnose or treat any disease, illness, or other medical condition. Every individual reader or poster should seek advice from their personal physician/healthcare practitioner before considering or using any interventions that are discussed on this website. By continuing to access this website you agree to consult your personal physican before using any interventions posted on this website, and you agree to hold harmless FluTrackers.com Inc., the board of directors, the members, and all authors and posters for any effects from use of any medication, supplement, vitamin or other substance, device, intervention, etc. mentioned in posts on this website, or other internet venues referenced in posts on this website.
  • We are not asking for any donations. Do not donate to any entity who says they are raising funds for us.

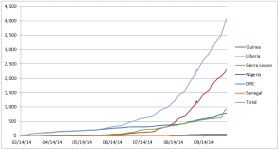
Ebola: Graph - cumulative cases & deaths using WHO updates - November 6, 2014

Re: Ebola: Graph - cumulative cases & deaths using WHO updates - August 28, 2014

Re: Ebola: Graph - cumulative cases & deaths using WHO updates - August 28, 2014
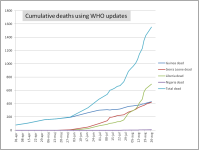
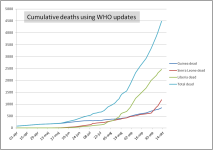
Ebola dead.png


Source WHO Ebola updates - 28 August 2014
http://www.who.int/csr/don/2014_08_28_ebola/en/
 
Re: Ebola: Graph - cumulative cases & deaths using WHO updates - August 28, 2014

Re: Ebola: Graph - cumulative cases & deaths using WHO updates - August 28, 2014

The graphs in this thread were interesting and useful. Have they been updated somewhere?
 
Re: Ebola: Graph - cumulative cases & deaths using WHO updates - August 22, 2014

Re: Ebola: Graph - cumulative cases & deaths using WHO updates - August 22, 2014

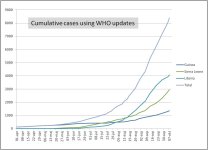
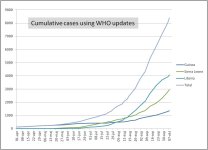
Here is an updated version using just the data in the WHO reports.

Graph.png
 
Re: Ebola: Graph - cumulative cases & deaths using WHO updates - August 22, 2014

Re: Ebola: Graph - cumulative cases & deaths using WHO updates - August 22, 2014

This is excellent - please keep up this fine service :tiphat:
 
Re: Ebola: Graph - cumulative cases & deaths using WHO updates - August 22, 2014

Re: Ebola: Graph - cumulative cases & deaths using WHO updates - August 22, 2014

Here is an updated version using just the data in the WHO reports.

Thanks!

Looks like the epidemic is still growing exponentially.
 
Re: Ebola: Graph - cumulative cases & deaths using WHO updates - August 22, 2014

Re: Ebola: Graph - cumulative cases & deaths using WHO updates - August 22, 2014

I neglected to label the above graph as cumulative deaths based on WHO reports. Sorry about that.

Nordica - would you be able to post updated charts occasionally?

Thanks.
 
Re: Ebola: Graph - cumulative cases & deaths using WHO updates - August 22, 2014

Re: Ebola: Graph - cumulative cases & deaths using WHO updates - August 22, 2014

Nordica - would you be able to post updated charts occasionally?

Thanks.

Yes, I can. :)

Do you think I should include other countries as well in the graph?
 
Re: Ebola: Graph - cumulative cases & deaths using WHO updates - August 22, 2014

Re: Ebola: Graph - cumulative cases & deaths using WHO updates - August 22, 2014

Do you think I should include other countries as well in the graph?

Senegal and Nigeria are in the noise at this stage, unless/until they have a recurrence.

DRC is probably worth tracking, though.
 
Re: Ebola: Graph - cumulative cases & deaths using WHO updates - August 22, 2014

Re: Ebola: Graph - cumulative cases & deaths using WHO updates - August 22, 2014

Senegal and Nigeria are in the noise at this stage, unless/until they have a recurrence.

DRC is probably worth tracking, though.

I agree.
 
Re: Ebola: Graph - cumulative cases & deaths using WHO updates - October 7, 2014

Re: Ebola: Graph - cumulative cases & deaths using WHO updates - October 7, 2014

Ebola cases 2014.jpg
 
Re: Ebola: Graph - cumulative cases & deaths using WHO updates - October 7, 2014

Re: Ebola: Graph - cumulative cases & deaths using WHO updates - October 7, 2014

Ebola dead.png
 
Re: Ebola: Graph - cumulative cases & deaths using WHO updates - October 7, 2014

Re: Ebola: Graph - cumulative cases & deaths using WHO updates - October 7, 2014

wouldn't it be better to use weekly new cases instead of cumulative
 
Re: Ebola: Graph - cumulative cases & deaths using WHO updates - October 7, 2014

Re: Ebola: Graph - cumulative cases & deaths using WHO updates - October 7, 2014

wouldn't it be better to use weekly new cases instead of cumulative

I don't think so. Sometimes data is held over from week to week. Then a lot of testing happens when a new lab comes on line like the Chinese lab in Sierra Leone. Delays in a given week make the weekly data noisy, but that noise is diminished in the cumulative cases curve.
 
Re: Ebola: Graph - cumulative cases & deaths using WHO updates - October 7, 2014

Re: Ebola: Graph - cumulative cases & deaths using WHO updates - October 7, 2014

Ronan Kelly, this "noise" is usually eliminated by moving averages,
where you list the average of the last n weeks(days) instead of the
actual week

this cumulative chart makes it hard to detect whether the trend is exponential or linear - it just goes up for the eye.

And I wonder whether that's the purpose that so many use
cumulative charts now in the first place.

You won't see that with e.g. weekly flu-surveillance numbers
How would you find the peak ?
 
Re: Ebola: Graph - cumulative cases & deaths using WHO updates - October 7, 2014

Re: Ebola: Graph - cumulative cases & deaths using WHO updates - October 7, 2014

sidescroll

(--> makes it hard for me to edit posts)
 
Re: Ebola: Graph - cumulative cases & deaths using WHO updates - October 7, 2014

Re: Ebola: Graph - cumulative cases & deaths using WHO updates - October 7, 2014

Ronan Kelly, this "noise" is usually eliminated by moving averages,
where you list the average of the last n weeks(days) instead of the
actual week

this cumulative chart makes it hard to detect whether the trend is exponential or linear - it just goes up for the eye.

And I wonder whether that's the purpose that so many use
cumulative charts now in the first place.

You won't see that with e.g. weekly flu-surveillance numbers
How would you find the peak ?

Have you plotted moving averages somewhere? What does it look like?
As an aside, I don't have any sidescroll running at 1920x1080.
 
Re: Ebola: Graph - cumulative cases & deaths using WHO updates - October 7, 2014

Re: Ebola: Graph - cumulative cases & deaths using WHO updates - October 7, 2014

WHO gives the number of new cases in the last 21 days.
In our weekly (non-cumulative) charts that would be
the 3-weeks moving average (MA3).
I added it now in my regional chart :
http://magictour.free.fr/reg0b.GIF
 
Re: Ebola: Graph - cumulative cases & deaths using WHO updates - October 7, 2014

Re: Ebola: Graph - cumulative cases & deaths using WHO updates - October 7, 2014

GS your charts need some explanation. What are the axes? What periods are being covered. Why so many lines on the MA? If you are using WHO data, they don't have local data, only at the country level? Could you explain a little?

What are you trying to show with these charts?
 
Back
Top