
Laidback Al
Well-known member
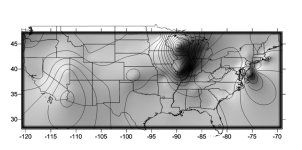
Shaded density map of infection rates within the continental <st1:country-region w:st="on"><st1 lace w:st="on">USA</st1lace></st1:country-region>, based on CDC data for May 10, 2009. Currently the highest areas of local infection occur in the upper Midwest centered in <st1:state w:st="on">Wisconsin</st1:state> and along the eastern seaboard centered in <st1:state w:st="on"><st1lace w:st="on">Delaware</st1lace></st1:state>. If more cases are confirmed in <st1:state w:st="on"><st1lace w:st="on">Arizona</st1lace></st1:state> in the coming days, it could also become a hot spot of infection.
<o> </o>
<o> </o>
<o> </o>
<o> </o>
Map notes: The density value for the geocentroid for each state is computed by the ratio of confirmed cases within the state to the total state population (as estimated by the <st1lace w:st="on"><st1:country-region w:st="on">US</st1:country-region></st1lace> Census Bureau for July, 2008). Only 49 data points are used to develop this map (49 lower continental states plus the <st1:state w:st="on"><st1lace w:st="on">District of Columbia</st1lace></st1:state>). Data points based on geocentroids of counties with confirmed cases in each state would be preferable for mapping purposes. Isolines are computed with a kriging algorithm and are scalar multiplied by 1000000.
lace w:st="on">USA</st1lace></st1:country-region>, based on CDC data for May 10, 2009. Currently the highest areas of local infection occur in the upper Midwest centered in <st1:state w:st="on">Wisconsin</st1:state> and along the eastern seaboard centered in <st1:state w:st="on"><st1lace w:st="on">Delaware</st1lace></st1:state>. If more cases are confirmed in <st1:state w:st="on"><st1lace w:st="on">Arizona</st1lace></st1:state> in the coming days, it could also become a hot spot of infection. <o
> </o><o
> </o>
<o
> </o><o
> </o>Map notes: The density value for the geocentroid for each state is computed by the ratio of confirmed cases within the state to the total state population (as estimated by the <st1
lace w:st="on"><st1:country-region w:st="on">US</st1:country-region></st1lace> Census Bureau for July, 2008). Only 49 data points are used to develop this map (49 lower continental states plus the <st1:state w:st="on"><st1lace w:st="on">District of Columbia</st1lace></st1:state>). Data points based on geocentroids of counties with confirmed cases in each state would be preferable for mapping purposes. Isolines are computed with a kriging algorithm and are scalar multiplied by 1000000.