• FluTrackers.com Inc. does not provide medical advice. Information on this web site is collected from various internet resources, and the FluTrackers board of directors makes no warranty to the safety, efficacy, correctness or completeness of the information posted on this site by any author or poster. The information collated here is for instructional and/or discussion purposes only and is NOT intended to diagnose or treat any disease, illness, or other medical condition. Every individual reader or poster should seek advice from their personal physician/healthcare practitioner before considering or using any interventions that are discussed on this website. By continuing to access this website you agree to consult your personal physican before using any interventions posted on this website, and you agree to hold harmless FluTrackers.com Inc., the board of directors, the members, and all authors and posters for any effects from use of any medication, supplement, vitamin or other substance, device, intervention, etc. mentioned in posts on this website, or other internet venues referenced in posts on this website.
  • We are not asking for any donations. Do not donate to any entity who says they are raising funds for us.

Critical Care Fatality Rate for Hospitalized Cases USA, H1N1 Seasonal Influenza 2013-2014

JimO

Well-known member
The following states both report the number of hospitalizations and are states where I have reasonable reports of fatalities. The hospitalized fatality rates (HFRs) in these states range from 1.82% to 9.82% and the average for all the states is 2.99%. I wish I could get the hospitalization data for California and Texas, but I haven't been able to. It seems that pH1N1 had a similar overall HFR for hospitalized cases in 2009 (close to 3%), with a critical care fatality rate (CCFR) for ICU cases of ~10%. I don't know why the Michigan number is so high, but I would bet that CA and TX are higher than average as well.

State - Total Deaths - Total Hospitalizations - HCFR in %

Arkansas - 22 - 600 - 3.67
Connecticut - 3 - 218 - 1.38
Iowa - 4 - 197 - 2.03
Michigan - 22 - 224 - 9.82
Montana - 3 - 165 - 1.82
Ohio - 25 - 1,233 - 2.03
Oklahoma - 12 - 399 - 3.01
Oregon - 14 - 408 - 3.43
South Carolina - 30 - 1,049 - 2.86
South Dakota - 5 - 115 - 4.35
Utah - 12 - 478 - 2.51

Total - 152 - 5,086 - 2.99
 
Last edited:
Re: Case Fatality Rate for Hospitalized Cases

Re: Case Fatality Rate for Hospitalized Cases

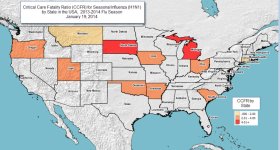
The map below shows the geographical distribution of the Critical Care Case Fatality Ratio (CCFR) for seasonal (H1N1) influenza in various states in the USA based on Jim's post above (denominator is hospitalized cases only). The range is 1.38 to 9.82%. The CCFR is not presented for all states.

CCFR H1N1 US 20140119  small.jpg
 
Last edited:
Re: Critical Care Fatality Rate for Hospitalized Cases USA, H1N1 Seasonal Influenza 2013-2014

As of Week 2, Dallas County, TX had 36 total deaths and 552 hospitalizations. The results in an HFR of 6.34%, which is probably more represenative of most of Texas. Since California doesn't report statewide hospitalizations, I'll try to get some data from counties where deaths have been recorded.
 
Re: Critical Care Fatality Rate for Hospitalized Cases USA, H1N1 Seasonal Influenza 2013-2014

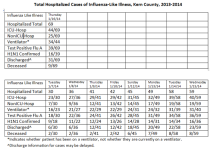
I just found this on the Kern County, CA website:

This results in an HFR of 13.04% and a CCFR of 20.45%

My records actually show total deaths in Kern County of 11, which would increase these percentages to 15.94% and 25.00%.

If this trend continues, especially given the relatively lower %ILI being reported, I believe this should give rise to significant concern.

Week 2 Kern County CA.png
 
Re: Critical Care Fatality Rate for Hospitalized Cases USA, H1N1 Seasonal Influenza 2013-2014

This chart is on Fresno County's website and shows 20 ICU admissions with 6 deaths and the remaining 14 still in ICU. Even if the remaining patients survive, that is a CCFR of 30%, which is three times higher than the average seen in 2009-10. In fact, I don't recall any CCFR being reported at that level in 2009-10. Again, this is of even greater concern given the moderate levels of %ILI being reported. The result, as pointed out by NS1 is that the actual CFR would be higher with a higher numerator (more deaths) and a lower denominator (fewer cases).

Week 2 Fresno.png
 
Re: Critical Care Fatality Rate for Hospitalized Cases USA, H1N1 Seasonal Influenza 2013-2014

Santa Clara County has reported 3 deaths and 14 ICU admissions through Week 2; however, 3 more deaths were reported last week. Using the Week 2 information, the CCFR is 21.43%. If the additional 3 deaths were among the other 11 in ICU, the CCFR could be as high as 42.86%.

These are scary numbers.
 
Re: Critical Care Fatality Rate for Hospitalized Cases USA, H1N1 Seasonal Influenza 2013-2014

Riverside County reports 21 ICU admissions with 3 deaths for a CCFR of 14.29%.
 
Re: Critical Care Fatality Rate for Hospitalized Cases USA, H1N1 Seasonal Influenza 2013-2014

Santa Clara County has reported 3 deaths and 14 ICU admissions through Week 2; however, 3 more deaths were reported last week. Using the Week 2 information, the CCFR is 21.43%. If the additional 3 deaths were among the other 11 in ICU, the CCFR could be as high as 42.86%.

These are scary numbers.

Clinical progression varies by influenza genotype, patient genotype, quality of care and drug resistance developments. These numbers seen here on fatality ratios are not surprising, but the point-in-time measurements should cause us to temper the impact by considering the volatility of the resulting calculations.

The useful ratio is a simple accounting of the number who are discharged after being admitted for ILI. The inverse ratio describes severity leading to fatality. Gather stats at the end of each day.

  • Admitted
  • Under Treatment
  • Discharged
 
Re: Critical Care Fatality Rate for Hospitalized Cases USA, H1N1 Seasonal Influenza 2013-2014

This chart is on Fresno County's website and shows 20 ICU admissions with 6 deaths and the remaining 14 still in ICU. Even if the remaining patients survive, that is a CCFR of 30%, which is three times higher than the average seen in 2009-10. In fact, I don't recall any CCFR being reported at that level in 2009-10. Again, this is of even greater concern given the moderate levels of %ILI being reported. The result, as pointed out by NS1 is that the actual CFR would be higher with a higher numerator (more deaths) and a lower denominator (fewer cases).

View attachment 17141

We would like to remind readers that these results are not DURABLE figures and may rise as patients who are obviously extremely ill when transferred to Critical Care do not recover under the treatment modalities.
 
Re: Critical Care Fatality Rate for Hospitalized Cases USA, H1N1 Seasonal Influenza 2013-2014

This chart is on Fresno County's website and shows 20 ICU admissions with 6 deaths and the remaining 14 still in ICU. Even if the remaining patients survive, that is a CCFR of 30%, which is three times higher than the average seen in 2009-10. In fact, I don't recall any CCFR being reported at that level in 2009-10. Again, this is of even greater concern given the moderate levels of %ILI being reported. The result, as pointed out by NS1 is that the actual CFR would be higher with a higher numerator (more deaths) and a lower denominator (fewer cases).

View attachment 17141

What Do These Numbers Mean?​

The Case Fatality Rate (CFR) by definition is a population-wide statistic for a definable disease / fatality cause.

Severity facets like Hospitalisation Fatality Rate and Critical Care Fatality Rate are restrictive subsets of the sample population, but generally share the same measure count (fatality count); most influenza fatalities have sought and had some form of medical interaction. A practical constraint on a numerator taken over an exponentially-variant denominator results in non-comparatives.

Keeping those parameters in mind while noting that data collection and reporting standards vary widely, the reader must consider carefully any comparative interpretation of this data.

A CFR cannot be evaluated next to a Fatality Rate associated with InPatient Care or Critical Care in a medical facility.

At most points of statistical significance, the medical fatality rates will be scaled differently than a population-wide statistic.

If we had valid interpretations from 2009 and early 2010, our conjecture is that 40%-plus Fatality Rates would be found across many Critical Care Facilities, especially in the US and the UK during and just after the extended "divert" periods. Those periods experienced exceptionally high case loads AND exceptional morbidity at presentation.

Today, the case loads vary considerably with many states demonstrating sub-epidemic case numbers while showing quantities of exceptional morbidity approaching and beyond 2009. That ratio should concern us.

The flashfire nature of high-intensity focused on a particular geography driven by a particular set of genetics is the matter of significant importance. The coalescence of pH1N1 High-CFR Upsilon polymorphisms onto widely-circulating model backgrounds is a further point of logic.

If we take the Upsilon sub-clade as a defined disease, the Fatality Rate approaches 5% by report and potentially much higher if comprehensive reporting was made public. The 1918 population-wide CFR has been estimated above 2% with fatality count estimates of 50 to 100 million people on a worldwide population close to 2 billion. While we cannot directly compare a population-wide rate with a sub-clade, we follow the increased mortality risk as a guide to take note of the virulence factors associated with that dangerous pH1N1 sub-clade.

Those Upsilon genetics inform the cases being mechanically ventilated and 'ECMO'ed today, but, as yet, few sequences have been made public to fully quantify the risk.

Overall medical facility Fatality Rates are obvious figures that should, in any estimation, be continually available and approachable for the general public. That citizens like Jim Oliveros and Laidback Al must devote professional expertise, give pursuit, carefully accumulate and then provide visualisations to these figures is further unanswered evidence of the limited benefit derived from modern public health institutes in the face of surging pathogenic disease, a predictable matter that comes each year.

 
Back
Top