Laidback Al
Well-known member
A variety of different approaches have been proposed over the years to assess potential outbreaks of circulating and novel infectious diseases. Besides traditional epidemiological measures, Google Flu Trends is the best known. Changes in economic indicators have sometimes been proposed as both leading and trailing indicators of infectious disease outbreaks; see this thread at FluTrackers Pandemic threat-level market indicators.
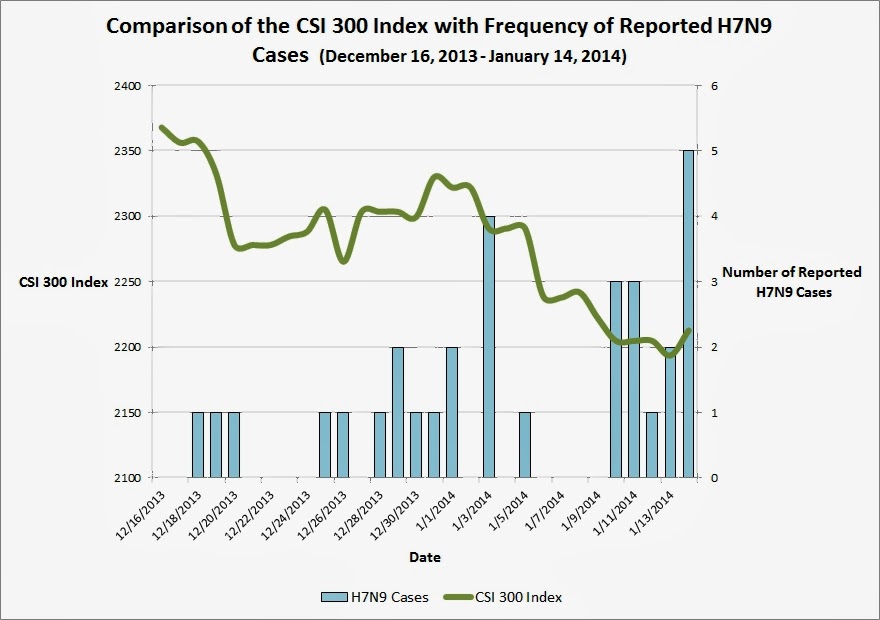
The China Securities Index 300 (CSI 300), also referred to as the Shanghai Shenzhen 300 Index, is a capitalization-weighted stock index designed to replication the performance of 300 major stocks on the Shanghai and Shenzhen stock exchanges. This index of China stocks has been down over the last 30 days as the number of H7N9 cases have been increasing. Whether the inverse correlation is a leading indicator of additional outbreaks of H7N9 or just a fortuitous coincidence will become apparent in the next several weeks.
Graph: Comparison of the CSI 300 Index (China) with the recent increase in H7N9 Cases
The China Securities Index 300 (CSI 300), also referred to as the Shanghai Shenzhen 300 Index, is a capitalization-weighted stock index designed to replication the performance of 300 major stocks on the Shanghai and Shenzhen stock exchanges. This index of China stocks has been down over the last 30 days as the number of H7N9 cases have been increasing. Whether the inverse correlation is a leading indicator of additional outbreaks of H7N9 or just a fortuitous coincidence will become apparent in the next several weeks.
Graph: Comparison of the CSI 300 Index (China) with the recent increase in H7N9 Cases