gsgs
Registered User
I'm starting a new thread about this.
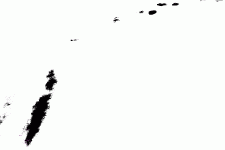
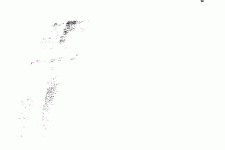
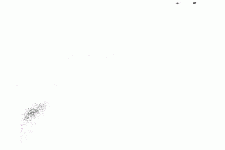
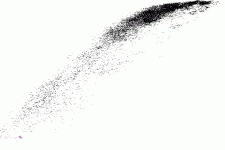
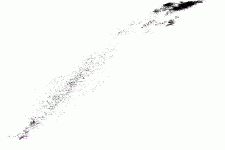
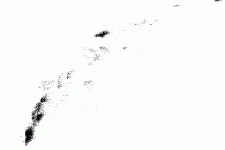
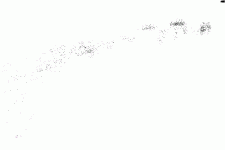
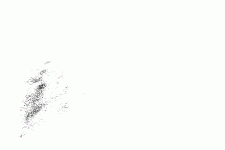
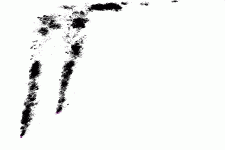
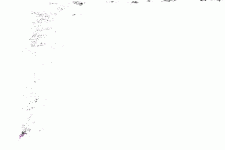
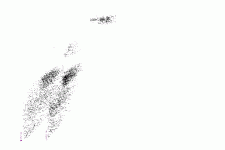
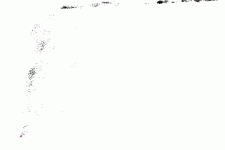
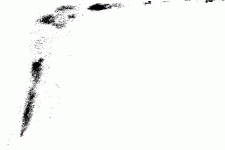
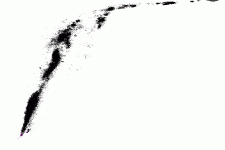
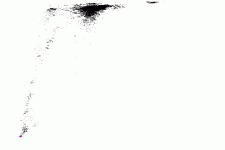
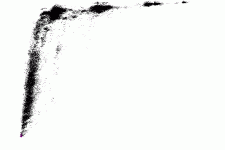
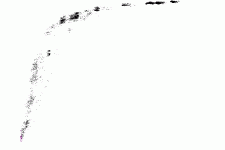
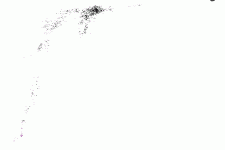
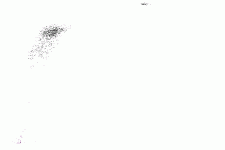
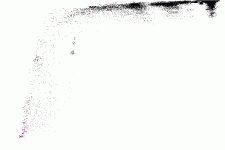
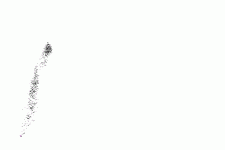
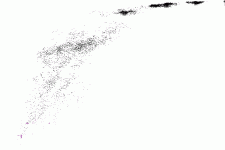
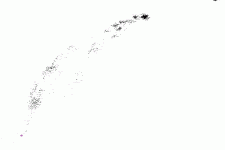
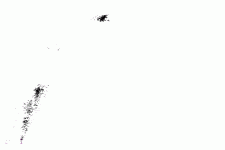
It's the analysis of organism evolution by plotting
nucleotide differences over amino acid differences
for pairs of viruses (bacteria,vertibrates,...(?))
so each such pair of organisms gives one pixel in the
2dimensional chart. This then looks like "clouds" in the
chart and that's how the name was chosen.
It shows how the organism evolves into different strains
and how much it maintains it's protein structure during
this process. It is assumed that nucleotide-mutations
happen almost uniformly over time and at a constant rate
over the whole genomes, while amino acid mutations
sometimes show some variation.
Periods where the virus doesn't mutate, doesn't mutate,
won't disturb these charts, since time is not included.
Recombinations (or reassortments in segments like flu,
when we consider whole genomes, not just segments)
however do disturb the graphs and should be excluded,
or the graphs are restricted to non-recombining areas.
One further idea would be to plot nucleotide mutations,
amino acid mutations and time-difference of pairs of organisms
in a 3dim chart.
I think this is an important tool to illustrate and analyse
evolution, but I never saw it. If someone knows who/where
else it is being used -or just a keyword - , I'd appreciate.
I first did this some years ago and it led to the discovery of the
"bird flu index", that flu doesn't mutate away from that index
in amino acids in mallards in the inner segments - presumably over
centuries. Other than in HA,NA, or in mammals,or in poultry,or in gulls,
or in nucleotides, where it acquired new mutations over time and
moves away more and more over time.
This index could show some genetic constraint, one locally superior
constellation with other nearby constellations being less fit in that
species and ecology. It could also indicate a (hidden) reservoir
which constantly feeds other species.
I did it with flu before, but am now trying to do it with other
organisms here. The ultimate goal is to write a program that
does this all automatically, from genbank records.
But that's tedious ... however, I predict that it will be done
earlier or later, if it wasn't already. It's so fundamental ...
----------------
so far examined:
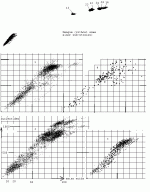
---influenza-A (8 segments)
mammalean is diagonal, poultry also somehow, we could do it for substrains like
H5N1-Qinghai to examine how much it evolves in poultry vs. wild birds ... (not done yet)
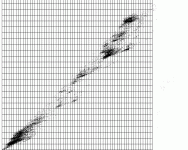
--- Dengue ~3100 full genomes of ~11000 nucleotides , 261=76+97+66+22 representatives picked,
--- PRRS , 211 full genomes of ~16000 nucleotides
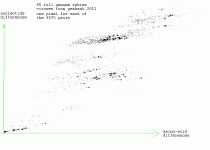
--- Rabies , 85 full genomes of ~12000 nucleotides
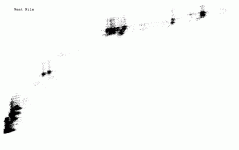
--- West Nile , 616 full genomes of ~11000 nucleotides
--- Hepatitis C,1129 full genomes, ~9000 nucleotides
--- Newcastle , 147 full genomes, ~15000 nucleotides, 160a/1000n, , .06-0.15
--- measles , 58 full genomes , ~15000 nucleotides
recombination frequent in positive strand RNA viruses, rarer in negative strand
assumed/proven in Newcastle (not so rare ?) , measles,rabies,RSV
(Han,>2008,
https://docs.google.com/viewer?a=v&..._jpCNs&sig=AHIEtbS_q5HEWZkqVnMOjGzdJFJkXY9XIg
need a list of viruses with characteristics , segments,proteins,type,family,how many at genbank,recombination
frequency,mutation rate,
also bacteria
and other species
need a list of keywords that can be included here so others doing the same will find this thread with searchengine
It's the analysis of organism evolution by plotting
nucleotide differences over amino acid differences
for pairs of viruses (bacteria,vertibrates,...(?))
so each such pair of organisms gives one pixel in the
2dimensional chart. This then looks like "clouds" in the
chart and that's how the name was chosen.
It shows how the organism evolves into different strains
and how much it maintains it's protein structure during
this process. It is assumed that nucleotide-mutations
happen almost uniformly over time and at a constant rate
over the whole genomes, while amino acid mutations
sometimes show some variation.
Periods where the virus doesn't mutate, doesn't mutate,
won't disturb these charts, since time is not included.
Recombinations (or reassortments in segments like flu,
when we consider whole genomes, not just segments)
however do disturb the graphs and should be excluded,
or the graphs are restricted to non-recombining areas.
One further idea would be to plot nucleotide mutations,
amino acid mutations and time-difference of pairs of organisms
in a 3dim chart.
I think this is an important tool to illustrate and analyse
evolution, but I never saw it. If someone knows who/where
else it is being used -or just a keyword - , I'd appreciate.
I first did this some years ago and it led to the discovery of the
"bird flu index", that flu doesn't mutate away from that index
in amino acids in mallards in the inner segments - presumably over
centuries. Other than in HA,NA, or in mammals,or in poultry,or in gulls,
or in nucleotides, where it acquired new mutations over time and
moves away more and more over time.
This index could show some genetic constraint, one locally superior
constellation with other nearby constellations being less fit in that
species and ecology. It could also indicate a (hidden) reservoir
which constantly feeds other species.
I did it with flu before, but am now trying to do it with other
organisms here. The ultimate goal is to write a program that
does this all automatically, from genbank records.
But that's tedious ... however, I predict that it will be done
earlier or later, if it wasn't already. It's so fundamental ...
----------------
so far examined:
---influenza-A (8 segments)
mammalean is diagonal, poultry also somehow, we could do it for substrains like
H5N1-Qinghai to examine how much it evolves in poultry vs. wild birds ... (not done yet)
--- Dengue ~3100 full genomes of ~11000 nucleotides , 261=76+97+66+22 representatives picked,
--- PRRS , 211 full genomes of ~16000 nucleotides
--- Rabies , 85 full genomes of ~12000 nucleotides
--- West Nile , 616 full genomes of ~11000 nucleotides
--- Hepatitis C,1129 full genomes, ~9000 nucleotides
--- Newcastle , 147 full genomes, ~15000 nucleotides, 160a/1000n, , .06-0.15
--- measles , 58 full genomes , ~15000 nucleotides
recombination frequent in positive strand RNA viruses, rarer in negative strand
assumed/proven in Newcastle (not so rare ?) , measles,rabies,RSV
(Han,>2008,
https://docs.google.com/viewer?a=v&..._jpCNs&sig=AHIEtbS_q5HEWZkqVnMOjGzdJFJkXY9XIg
need a list of viruses with characteristics , segments,proteins,type,family,how many at genbank,recombination
frequency,mutation rate,
also bacteria
and other species
need a list of keywords that can be included here so others doing the same will find this thread with searchengine