
• FluTrackers.com Inc. does not provide medical advice. Information on this web site is collected from various internet resources, and the FluTrackers board of directors makes no warranty to the safety, efficacy, correctness or completeness of the information posted on this site by any author or poster. The information collated here is for instructional and/or discussion purposes only and is NOT intended to diagnose or treat any disease, illness, or other medical condition. Every individual reader or poster should seek advice from their personal physician/healthcare practitioner before considering or using any interventions that are discussed on this website. By continuing to access this website you agree to consult your personal physican before using any interventions posted on this website, and you agree to hold harmless FluTrackers.com Inc., the board of directors, the members, and all authors and posters for any effects from use of any medication, supplement, vitamin or other substance, device, intervention, etc. mentioned in posts on this website, or other internet venues referenced in posts on this website.
  • We are not asking for any donations. Do not donate to any entity who says they are raising funds for us.

Chart - Comparison of Average Monthly Frequency of Human H5N1 Cases

Laidback Al

Well-known member
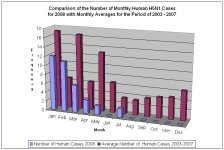
So far, 2008 is an unusual year in regards to reported human H5N1 cases. Through October 23, 2008, only 36 human cases have been reported and confirmed in 2008. The two most recent were from Indonesia in July.

We would have to go back to 2004 to find a year with such a similar low number. 2006 was the year with the most human cases. The graph below shows the average number of human cases by month for all WHO confirmed cases from 2003 through 2007. The graph of the 36 cases from 2008 is also presented to show how few cases have been reported and confirmed this year. Whether the decline in cases in 2008 is a function of fewer human infections this year or an artifact of reporting failures by news media and official government agencies is unknown.
 

Attachments

  • Monthly Average Human H5N1 Cases 20081023.jpg
    Monthly Average Human H5N1 Cases 20081023.jpg
    86.1 KB · Views: 1
Re: Chart - Comparison of Average Monthly Frequency of Human H5N1 Cases

Thanks for the graph!

Regarding the decline of confirmed cases, you rightly say:

"Whether the decline in cases in 2008 is a function of fewer human infections this year or an artifact of reporting failures by news media and official government agencies is unknown."

I would like to add:

A recent statement from Riau Health Service said the number of suspect bird flu cases went down - in Riau Province - with 50% from 156 in 2007 to 76 in 2008 (until sept. 15).

They were proud to say this was caused by handling Avian Influenza "quickly and immediately" with rapid response teams. In this way chances of contamination from poultry to humans are diminished; people with upcoming fevers are treated with Tamiflu on the spot.

Other regions are increaslingly following the same protocol: as soon as H5N1 is confirmed via "rapid tests" in poultry, a "Command Post" is installed, spreading information, monotoring people, etc.

I am glad this seems to work out OK.

As to the numbers: many feel there is serious underreporting, that is my feeling too. On the other hand, for the moment there really seems to be a decline in cases, a downward trend.

This containment policy is no solution, but it can buy time, to find solutions.

H5N1 is out there and is planning to stay, no downward trend can help that.
After the outbreak in 1997 in Hong Kong, there was a pause of 6 years or so, before H5N1 popped up again.
 
Back
Top