

Michael Coston
Editor, Senior Moderator
CDC Updated COVID Variant Map & Variant Proportion By State Data
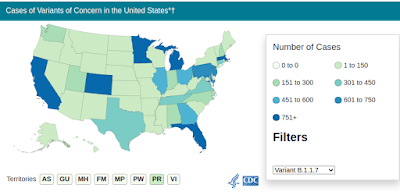
16,275 B.1.1.7 Variant Cases Across All 50 States.
#15,900
Prefaced by the usual caveat that due to limited surveillance and genomic sequencing - and inevitable reporting delays - the numbers we get on variants in the United States are believed to represent only a fraction of the actual total, we have the latest update from the CDC and it continues to show explosive growth around the nation.
Three weeks ago, the number of B.1.1.7 variants reported in the United States stood at 5,567 - with Florida leading the nation with 882 cases. Today, that national number has reached 16,275 and Florida's count has reached nearly 3,200.
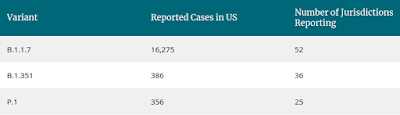
During the same time period, the number of B.1.351 variants detected has more than doubled, and there has been nearly an 8-fold increase in P.1 detections. Given the fragmented surveillance system, these numbers don't really tell us much about the prevalence of COVID variants around the nation, and are limited to just 3 COVID variants (B.1.1.7, B.1.351, P.1).
Last month, however, we looked at the CDC's new, evolving, dataset depicting COVID Variant Proportions by state, and today we have new data which allows us to compare the expansion rate of a wide range of VOCs (Variant of Concern) and VUIs (Variants Under Investigation) across the country.
Perhaps most telling is a side-by-side comparison of the proportion of variants (detected over a two week period) ending (on the left) on Feb 27th, and the more recently March 13th (below, right).
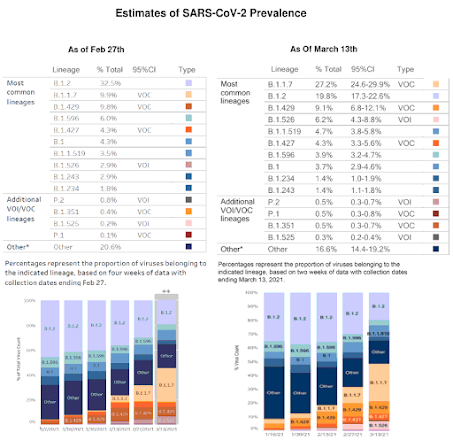
The dominant variant in late February was B.1.2, with a 32.5% share of the total. B.1.1.7 was in second place with just 9.9%, with B.1.429 just behind with 9.8%. Two others of concern; B.1.351 was at .4%, while P.1 only represented .1% of cases.
Fast-forward two weeks, and B.1.2 had dropped to second place with just under 20% share, while B.1.1.7 had nearly tripled (n=27.2%) to take the lead. B.1.429 dropped slightly to 9.1%, while P.1 leapt ahead to catch B.1.351 (both at .5%).
While better surveillance and testing probably accounts for some of these shifts, the trends are pretty obvious; VOCs like B.1.1.7, B.1.351, P.1, and B.1.429 continue to expand across the nation. Compared to the last update, Florida has jumped from reporting
Some highlights from the above graph include:
Stay tuned.
[url]https://afludiary.blogspot.com/2021/04/cdc-updated-covid-variant-map-variant.html[/URL]
16,275 B.1.1.7 Variant Cases Across All 50 States.
#15,900
Prefaced by the usual caveat that due to limited surveillance and genomic sequencing - and inevitable reporting delays - the numbers we get on variants in the United States are believed to represent only a fraction of the actual total, we have the latest update from the CDC and it continues to show explosive growth around the nation.
Three weeks ago, the number of B.1.1.7 variants reported in the United States stood at 5,567 - with Florida leading the nation with 882 cases. Today, that national number has reached 16,275 and Florida's count has reached nearly 3,200.
During the same time period, the number of B.1.351 variants detected has more than doubled, and there has been nearly an 8-fold increase in P.1 detections. Given the fragmented surveillance system, these numbers don't really tell us much about the prevalence of COVID variants around the nation, and are limited to just 3 COVID variants (B.1.1.7, B.1.351, P.1).
Last month, however, we looked at the CDC's new, evolving, dataset depicting COVID Variant Proportions by state, and today we have new data which allows us to compare the expansion rate of a wide range of VOCs (Variant of Concern) and VUIs (Variants Under Investigation) across the country.
Perhaps most telling is a side-by-side comparison of the proportion of variants (detected over a two week period) ending (on the left) on Feb 27th, and the more recently March 13th (below, right).

The dominant variant in late February was B.1.2, with a 32.5% share of the total. B.1.1.7 was in second place with just 9.9%, with B.1.429 just behind with 9.8%. Two others of concern; B.1.351 was at .4%, while P.1 only represented .1% of cases.
Fast-forward two weeks, and B.1.2 had dropped to second place with just under 20% share, while B.1.1.7 had nearly tripled (n=27.2%) to take the lead. B.1.429 dropped slightly to 9.1%, while P.1 leapt ahead to catch B.1.351 (both at .5%).
While better surveillance and testing probably accounts for some of these shifts, the trends are pretty obvious; VOCs like B.1.1.7, B.1.351, P.1, and B.1.429 continue to expand across the nation. Compared to the last update, Florida has jumped from reporting
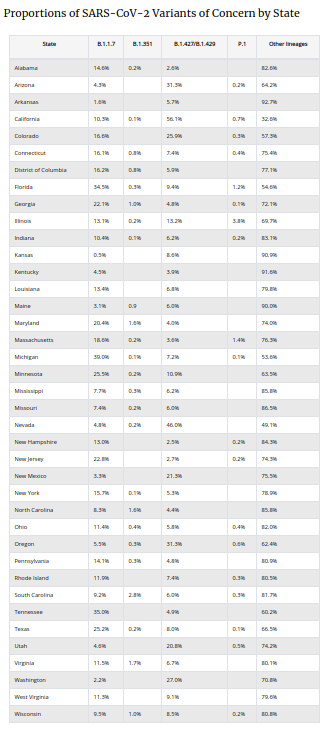
Variant proportions are based on representative CDC sequence data (NS3 + CDC-funded contract sequencing) collected over a 4-week period ending March 13, 2021. Proportions in Table 1 are only shown for states for which CDC has at least 300 sequences from specimens collected during this timeframe. Proportions are calculated using empirical (unweighted) data, which are subject to change over time and will be updated as more data become available. Proportions of variants do not represent the total number that may be circulating in the United States and may not match cases reported by states, territories, tribes, and local officials. For states and jurisdictions not listed, CDC has insufficient genomic surveillance data for the specified time period.
Some highlights from the above graph include:
- Compared to the last update, Florida has jumped from reporting 13.2% of cases as variant B.1.17 to nearly 35%.
- Georgia has jumped from 6.2% to 22%
- California is the only state to report more than a 50% share, with B.1.427/B.1.429 making up 56% of reported cases.
- Michigan reports the highest percentage of B.1.1.7 variants, at 39%
- South Carolina reports the highest percentage of B.1.351 (2.8%), followed by Virginia (1.7%) and Maryland (1.6%)
- While Florida and Massachusetts have more total cases, Illinois leads the nation with the highest percentage (3.8%) of P.1 variants.
Stay tuned.
[url]https://afludiary.blogspot.com/2021/04/cdc-updated-covid-variant-map-variant.html[/URL]