

Michael Coston
Editor, Senior Moderator
CDC Unveils COVID Variant By Region Breakdowns
#15,921
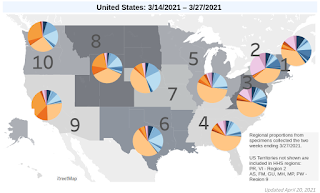
Although updated a bit less often than the CDC's old variant reporting format (discontinued 4/12), the CDC's new Variant Proportions website expanded coverage from 3 to 20 variant categories, and continues to add new ways to look at the data.
Updated every two weeks (with an interim `adjustment' to the data in the `off week'), this new tool now adds a regional breakdown of variants, as well as a national overview.
This is important since the impact of variants differs greatly in across the nation. Last week, by pulling numbers from the CDC's spreadsheet, I was able to point out.
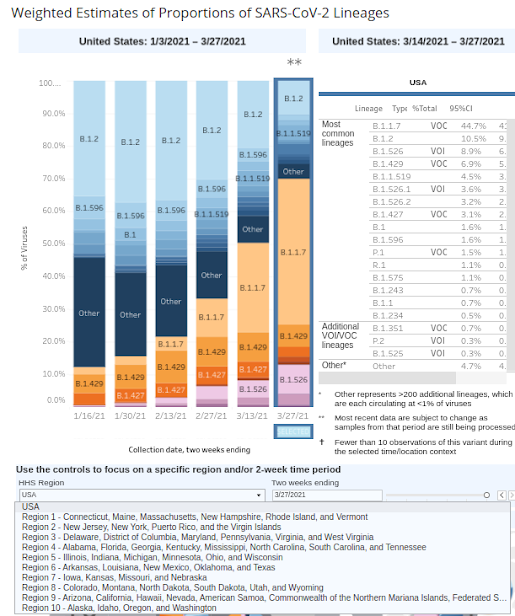
You can also select which of the past 6 two-week periods to view, giving the user the ability to compare not only current trends, but how they evolved over the the past 12 weeks.

All of this provides an interesting, and for local officials a presumably useful, view of the spread of variants around the nation, and reminds us that this pandemic has a lot of moving parts.
The data is, as with all surveillance data, a snapshot of what `was' - in this case more than 3 weeks ago - but by comparing that to what `was' 5 or 7 weeks ago, we may be able to spot trends that will tell us where we'll be a month from now.
For now, those who are enamoured with this type of data representation will find a plenty to keep them occupied on the CDC's updated website. We should be getting data on the next two-week period in the next week or so.
https://afludiary.blogspot.com/2021/04/cdc-unveils-covid-variant-by-region.html
#15,921
Although updated a bit less often than the CDC's old variant reporting format (discontinued 4/12), the CDC's new Variant Proportions website expanded coverage from 3 to 20 variant categories, and continues to add new ways to look at the data.
Updated every two weeks (with an interim `adjustment' to the data in the `off week'), this new tool now adds a regional breakdown of variants, as well as a national overview.
This is important since the impact of variants differs greatly in across the nation. Last week, by pulling numbers from the CDC's spreadsheet, I was able to point out.
- While the B.1.1.7 variant comprises 44.1% of cases nationwide, 4 states are reporting it in > 50% of cases; Tennessee (60.5%), Michigan (57.6%), Minnesota (55.6%), and Florida (52.2%). Arizona reports the least, with 14.1%.
- The `California' variant(s) B.1427/B.1429 dominate in California (53.8%) and Arizona (36.0%), and are nearly tied with B.1.1.7 in Colorado (29.1% vs 28.1%).
- The B.1.351 (South African) variant is most commonly reported in North Carolina (3.6%), Virginia (2.6%), and Maryland (2.4%).
- The P.1 (Brazilian) variant has the most reports from Illinois (7.9%), Massachusetts (3.1%), and Florida (2.4%)
You can also select which of the past 6 two-week periods to view, giving the user the ability to compare not only current trends, but how they evolved over the the past 12 weeks.
All of this provides an interesting, and for local officials a presumably useful, view of the spread of variants around the nation, and reminds us that this pandemic has a lot of moving parts.
The data is, as with all surveillance data, a snapshot of what `was' - in this case more than 3 weeks ago - but by comparing that to what `was' 5 or 7 weeks ago, we may be able to spot trends that will tell us where we'll be a month from now.
For now, those who are enamoured with this type of data representation will find a plenty to keep them occupied on the CDC's updated website. We should be getting data on the next two-week period in the next week or so.
https://afludiary.blogspot.com/2021/04/cdc-unveils-covid-variant-by-region.html