• FluTrackers.com Inc. does not provide medical advice. Information on this web site is collected from various internet resources, and the FluTrackers board of directors makes no warranty to the safety, efficacy, correctness or completeness of the information posted on this site by any author or poster. The information collated here is for instructional and/or discussion purposes only and is NOT intended to diagnose or treat any disease, illness, or other medical condition. Every individual reader or poster should seek advice from their personal physician/healthcare practitioner before considering or using any interventions that are discussed on this website. By continuing to access this website you agree to consult your personal physican before using any interventions posted on this website, and you agree to hold harmless FluTrackers.com Inc., the board of directors, the members, and all authors and posters for any effects from use of any medication, supplement, vitamin or other substance, device, intervention, etc. mentioned in posts on this website, or other internet venues referenced in posts on this website.
  • We are not asking for any donations. Do not donate to any entity who says they are raising funds for us.

CDC Surveillance Week 25

gsgs

Registered User
week 25 is available now at

http://www.cdc.gov/flu/weekly/

During week 25 (June 21-27, 2009), influenza activity decreased in the United States

positives rate = 30.7% (down from 40%)
98% are ******-flu
The proportion of outpatient visits for influenza-like illness (ILI) was below the national baseline
 
Re: CDC Surveillance Week 25

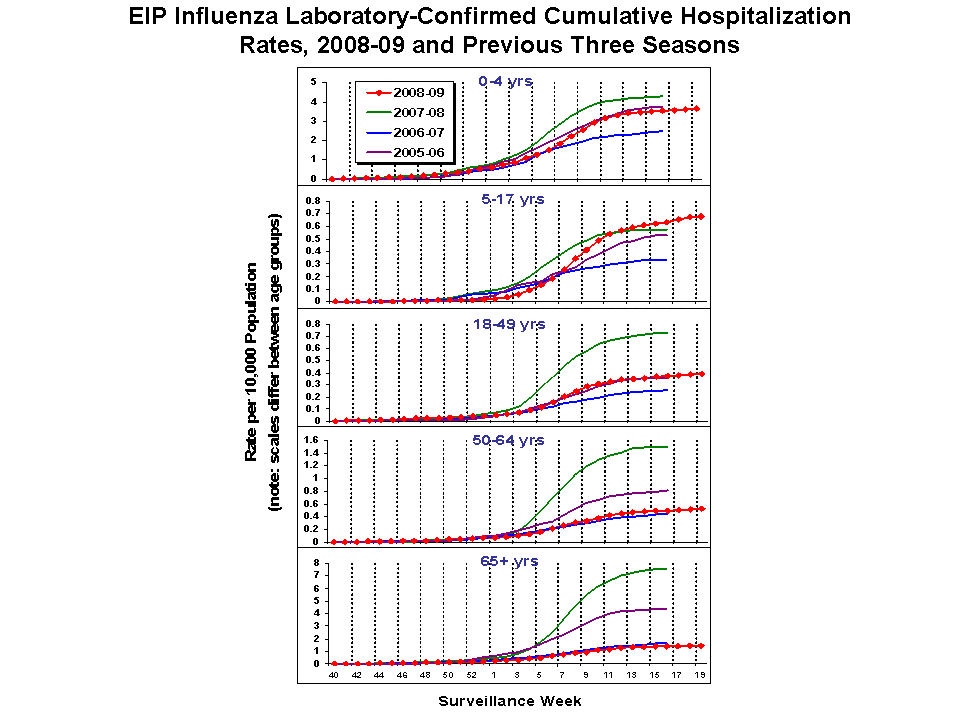
Hospitalization rates are increasing for all age groups...

Week 24:

EIP24_small.gif


Week 25:

EIP25_small.gif
 
Re: CDC Surveillance Week 25

You know, it's somewhat of an exercise in futility to argue over these data. I hope you are right gsgs and we see a dramatic drop in cases over the next few weeks. That might give the vaccine manufacturers time to catch up before and if we have a serious rebound in the fall. But, for myself, I think that there is enough uncertainty in the way the data are collected and reported that I am personally preparing for a sustained pandemic and advising family and friends to do the same.
 
Re: CDC Surveillance Week 25

I agree with JimO.
% of positif test doesn't say much. The denominator varies to much. Who is getting tested?
Check death
WTB
 
Re: CDC Surveillance Week 25

As a 61 year old layman who is trying to balance what is real and what is politics, I find all the numbers very confusing and therefore I count on Flutrackers for my information. Questions - 1) Why the 31 year gap in the 18 to 49 year old group? I would certainly like to have HALF of that back. 2) At this point in a pandemic, aren't the exact case counts for infections basically useless? I would think the medical and political folks would be more concerned with CFR's and a more exact baseline for age groups and exactly what "underlying" conditions are suspect. Sorry for the rant.

Oldman
 
Re: CDC Surveillance Week 25

I agree with JimO.
% of positif test doesn't say much. The denominator varies to much. Who is getting tested?
Check death
WTB


I second that... Also the data on these fresh reports change as they are always incomplete. The confirmed cases bar which is dropping off this week has done that for every single weeks fresh report, next week's report will show it higher rather than lower because CDC will have more of the data.
 
Re: CDC Surveillance Week 25

QUOTE=oldman;260115]As a 61 year old layman who is trying to balance what is real and what is politics, I find all the numbers very confusing and therefore I count on Flutrackers for my information. Questions - 1) Why the 31 year gap in the 18 to 49 year old group? I would certainly like to have HALF of that back. 2) At this point in a pandemic, aren't the exact case counts for infections basically useless? I would think the medical and political folks would be more concerned with CFR's and a more exact baseline for age groups and exactly what "underlying" conditions are suspect. Sorry for the rant.

Oldman[/QUOTE]Here are a couple of charts I got from a posted article published in the New England Journal of Medicine.

When looking at the charts, keep in mind that the 2009 data includes illnesses and deaths from seasonal flu from the first quarter, which are largely at the two extremes of the graph.

The attachment wasn't the correct file and now I can't upload the correct one - I'm getting an error message saying that it's an invalid file. I'll keep working on it. Sorry.
 
Last edited:
Re: CDC Surveillance Week 25

I can't get the file to open, which I take to mean you are still having problems with it. Do I understand you to say there is a W shaped mortality curve this year?
 
Re: CDC Surveillance Week 25

I second that... Also the data on these fresh reports change as they are always incomplete. The confirmed cases bar which is dropping off this week has done that for every single weeks fresh report, next week's report will show it higher rather than lower because CDC will have more of the data.
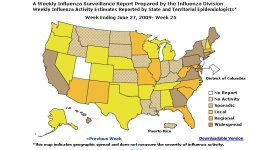
The CDC also posted the data a day early this week due to the holiday. Some of the states did not report in time and they missed data collected the last 24 hours in the reporting period.
 
Re: CDC Surveillance Week 25

The CDC also posted the data a day early this week due to the holiday. Some of the states did not report in time and they missed data collected the last 24 hours in the reporting period.

Nice find, I saw those white states in the map but didn't connect the dots as to why they didn't report.
 
Re: CDC Surveillance Week 25

those are "cumulative" hospitalization rates. It always goes up
by definition.

compare with the seasonal wave:
http://www.cdc.gov/flu/weekly/weeklyarchives2008-2009/EIP20.htm

Your comparison chart shows previous years up to week 17 (ending may 2nd), yet the CDC chart is from week 20 (official end of flu season), this is another example of data manipulation by the CDC. Here is the chart you referenced...

EIP20.GIF


This shows older Novel H1N1 hospitalizations though May 23rd and incomplete data from previous years. If previous year data and current H1N1 data through week 25 was shown you would see the red line spike away from Green Blue and Purple.
 
Re: CDC Surveillance Week 25

The CDC also posted the data a day early this week due to the holiday. Some of the states did not report in time and they missed data collected the last 24 hours in the reporting period.

did they mention that somewhere ? (they really should !)
 
Re: CDC Surveillance Week 25

cumulative presentation of EIP-data is not so good, IMO.
They didn't use cumulative numbers for serotype testing
or ILI either.
Also, I can't find the numbers, only the chart.
For the other charts they have a link to see the chart-data,
but not for EIP.
Maybe the 10 states have the data and we can add them
up (weighted)


http://www.cdc.gov/ncidod/osr/site/eip/sites.htm
 
Re: CDC Surveillance Week 25

did they mention that somewhere ? (they really should !)

Why point out what they are trying to hide. This is the first white I've seen on that map since swine broke...


u1.jpg


Notice how it's NJ, Utah, and DC. Why not North Dakota, Idaho, or Vermont. It's a game they can play because the only people who care are a few crack pots like us who are actually following this.
 
Re: CDC Surveillance Week 25

those are "cumulative" hospitalization rates. It always goes up by definition.

compare with the seasonal wave:
http://www.cdc.gov/flu/weekly/weeklyarchives2008-2009/EIP20.htm
Yes, but the bar chart represents new deaths for each reporting period, and the slope of the cumulative line hasn't decreased. When the situation begins to improve, the slope of the line for cumulative data will decrease until it is horizontal. I know that you know all this, but am just pointing it out for those who don't.

As I said before, I think we'll have a sustained pandemic into the fall, but I will be happy and relieved to be completely wrong.
 
Back
Top