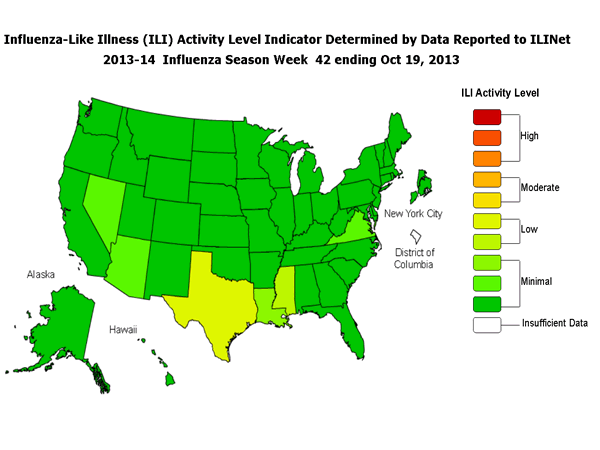
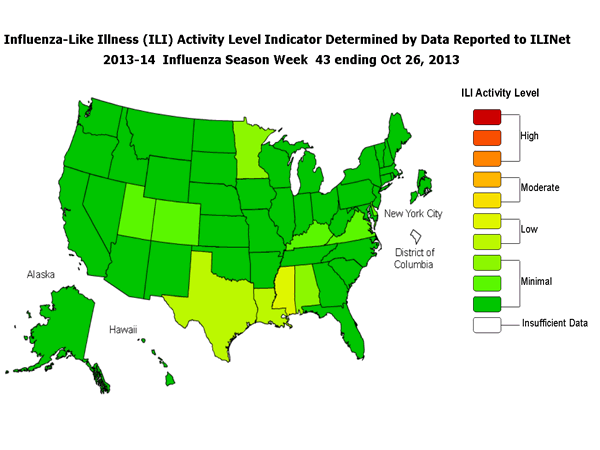
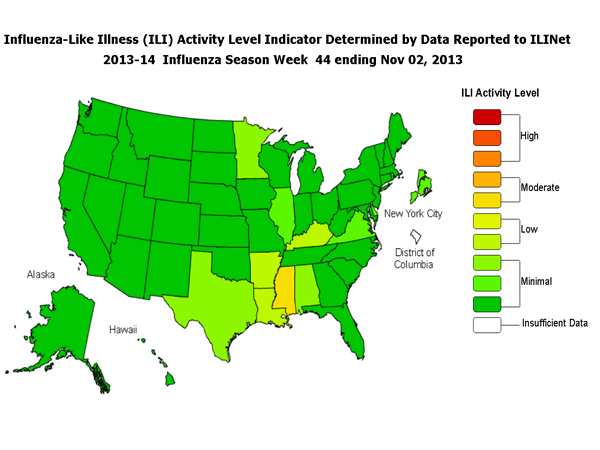
Re: CDC Maps Showing Spread of Influenza 2013-14; Wks 41-47
Re: CDC Maps Showing Spread of Influenza 2013-14; Wks 41-47
that map or similar in computer-readable form
as a 24-bit-.bmp with the pixels of the States-boundaries
and the coordinates of the centers
it should be available somewhere ?!
how would it be called
useful for all sorts of US-States statistics
then we can generate our own maps from the weekly data
or for google-flu-trend even daily data
the data from the States are not being collected and
presented weekly, afaik. They are only on the States'
websites.
CDC has the 10 regions
we could cooperate to collect the weekly data
CDC should do it
ISDS
compare with the maps that
Germany and
France
and probably other countries show weekly
the data from all the sentinal providers and their
locations, who collects them, who has them ?
Presumably CDC = government = vulnerable
to FOA requests
why are these being kept secret ?
Presumably CDC doesn't want others to make these maps.
Attention would go away from the CDC-website to others
who provide better presentations.
But the CDC has links to other websites that they want to show,
that they want visitors to click, like general information
about influenza, where to get the vax etc.
Those other websites in turn would rather show advertisements
and possibly links to online pharmacies where you can buy antivirals.
For some reason, apparently CDC=government doesn't want
us to buy tamiflu,relenza,flu-tests etc. online. Remember 2006.
-------------------------
since 2012? the data is being "protected" at gis , you get delays and can't access without signing
some agreement, saying that you aware that the data may contain errors or such.
the data is still there, but somehow protected, so you can't easily download it.
e.g. the ILI-data for region 1:
PERCENTAGE OF VISITS FOR INFLUENZA-LIKE-ILLNESS REPORTED BY SENTINEL PROVIDERS
YEAR,WEEK,AGE 0-4,AGE 5-24,AGE 25-49,AGE 25-64,AGE 50-64,AGE 65,ILITOTAL,TOTAL PATIENTS,NUM. OF PROVIDERS,% Unweighted ILI,% Weighted ILI
2013,40,116,125,44,X,19,20,324,55621,153,0.582513798745078,0.487263123889574
2013,41,126,144,39,X,15,16,340,55841,158,0.608871617628624,0.532103037353605
2013,42,136,143,38,X,17,22,356,51239,158,0.694783270555631,0.614013968853079
2013,43,164,124,33,X,18,13,352,55831,163,0.630474109365765,0.577132773773759
2013,44,141,143,26,X,11,12,333,53236,151,0.625516567736118,0.568101938419323
2013,45,126,144,39,X,25,24,358,51557,145,0.694377097193398,0.672516181682035
2013,46,160,126,38,X,19,9,352,49300,142,0.713995943204868,0.685690191570864
2013,47,122,110,29,X,21,13,295,44632,121,0.660960745653343,0.679110505309982
google doesn't have it either,
no result for e.g. "0.630474109365765"
well, now they probably have it, since I posted it here.
Was that illegal ? But it's free government-data ...
as with all the other examples that we had, like genbank,euroflu,flunet,NCHS,eurostat, etc.
it woulf be best to provide everything in one big computer-readable file
in uniformized format, to be processed offfline.
This is usually not being done. Wonder why.
google flu-trends is better, still not one file, but one file per country in nice format