

Pathfinder
Editor, Senior Moderator
Influenza A Virus Wastewater Data
Updated May 23, 2024
Main Findings from Wastewater Surveillance
Number of Sites with Data Meeting Criteria for Analysis Reporting Influenza A Wastewater Data in Past Two Weeks: 281
Influenza A in Wastewater – Site Level
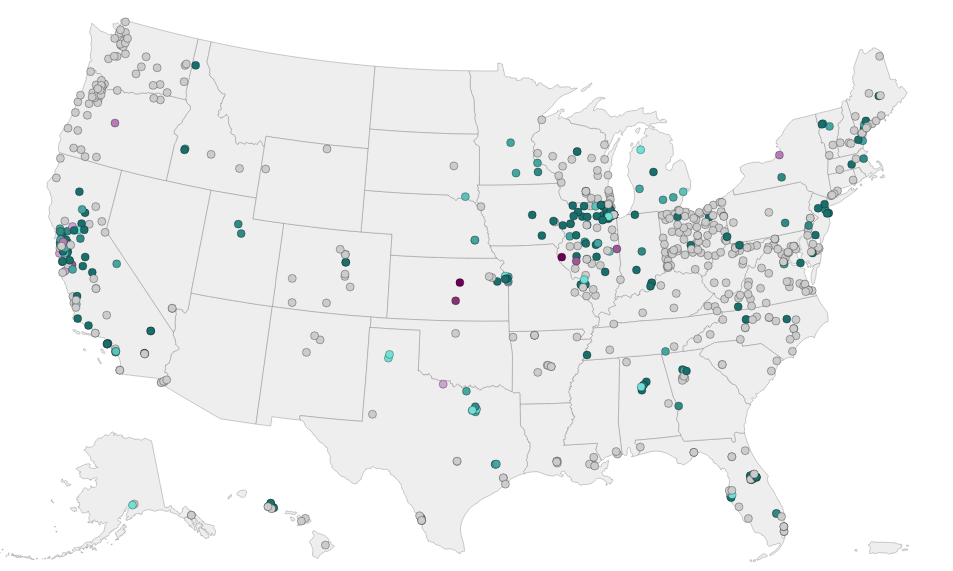
This interactive map shows current site-level data for influenza A virus in wastewater. Each dot on the map represents a wastewater sampling site. Sites are categorized based on the current level of influenza A compared to the past levels at the same site during the 2023-2024 influenza season. When influenza A virus levels are at the 80th percentile or higher, CDC will work with relevant partners to better understand the factors that could be contributing to these levels.
Wastewater data for influenza A is available for the most recent two weeks:
Week2024-05-182024-05-11 Select a color from the legend to add or remove it from the map.
All data are preliminary and may change as more reports are received. Wastewater data does not distinguish between human and animal waste or by-products. Download Data (CSV) Skip Data Table
Data Table Skipped data table.
About the Data:
Last Reviewed: May 24, 2024
...
https://www.cdc.gov/nwss/wastewater-surveillance/Flu-A-data.html
Updated May 23, 2024
Main Findings from Wastewater Surveillance
- During the two most recent weeks, (May 5, 2024–May 18, 2024), a total of 281 of 689 sites reported data meeting criteria for analysis for influenza A virus for both weeks or for either week, and 3 (1%) sites from 2 states were at a high level (>80th percentile compared to levels recorded at that site between October 1, 2023 and March 2, 2024).
- Current wastewater monitoring methods detect influenza A viruses but do not determine the subtype. This means that avian influenza A(H5N1) viruses can be detected but would not be distinguished from other influenza A virus subtypes.
- Wastewater testing cannot determine the source of the influenza A virus. It could come from a human or from an animal (like a bird) or an animal product (like milk from an infected cow).
- Public health officials at CDC and state and local health departments are monitoring these data. For areas where influenza A virus levels in wastewater are high, CDC works with relevant partners to better understand the factors that could be contributing to these levels.
- Efforts to monitor influenza A virus activity using wastewater data are likely to evolve as the methodologies and interpretation are evaluated and refined.
- For the latest information on H5N1, and what you can do to protect yourself, visit H5N1 Bird Flu: Current Situation. For the latest information on influenza activity in people, visit the Weekly U.S. Influenza Surveillance Report.
Number of Sites with Data Meeting Criteria for Analysis Reporting Influenza A Wastewater Data in Past Two Weeks: 281
Influenza A in Wastewater – Site Level
This interactive map shows current site-level data for influenza A virus in wastewater. Each dot on the map represents a wastewater sampling site. Sites are categorized based on the current level of influenza A compared to the past levels at the same site during the 2023-2024 influenza season. When influenza A virus levels are at the 80th percentile or higher, CDC will work with relevant partners to better understand the factors that could be contributing to these levels.
Wastewater data for influenza A is available for the most recent two weeks:
- May 5, 2024 – May 11, 2024
- May 12, 2024 – May 18, 2024
Week2024-05-182024-05-11 Select a color from the legend to add or remove it from the map.
All data are preliminary and may change as more reports are received. Wastewater data does not distinguish between human and animal waste or by-products. Download Data (CSV) Skip Data Table
Data Table Skipped data table.
About the Data:
Last Reviewed: May 24, 2024
...
https://www.cdc.gov/nwss/wastewater-surveillance/Flu-A-data.html