Follow along with the video below to see how to install our site as a web app on your home screen.
Note: This feature may not be available in some browsers.
FluTrackers.com Inc. does not provide medical advice. Information on this web site is collected from various internet resources, and the FluTrackers board of directors makes no warranty to the safety, efficacy, correctness or completeness of the information posted on this site by any author or poster.
The information collated here is for instructional and/or discussion purposes only and is NOT intended to diagnose or treat any disease, illness, or other medical condition. Every individual reader or poster should seek advice from their personal physician/healthcare practitioner before considering or using any interventions that are discussed on this website.
By continuing to access this website you agree to consult your personal physican before using any interventions posted on this website, and you agree to hold harmless FluTrackers.com Inc., the board of directors, the members, and all authors and posters for any effects from use of any medication, supplement, vitamin or other substance, device, intervention, etc. mentioned in posts on this website, or other internet venues referenced in posts on this website.
We are not asking for any donations. Do not donate to any entity who says they are raising funds for us.
Influenza activity continued to increase in week 47.
Influenza A is the most common influenza virus circulating in Canada, and the majority of these viruses are A(H1N1)pdm09.
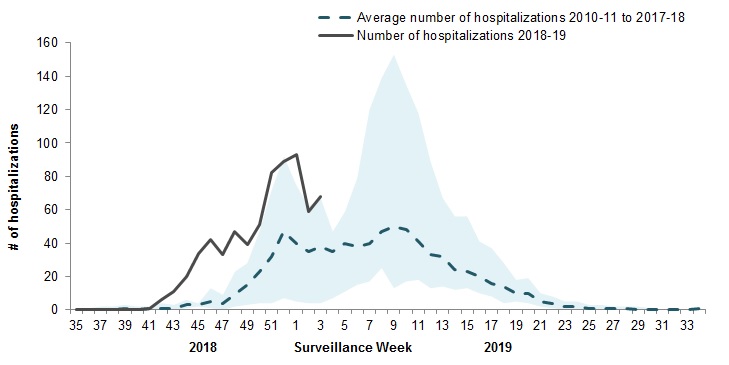
The number of influenza-associated hospitalizations continued to increase in week 47. In particular, the number of pediatric hospitalizations is significantly higher than in recent years.
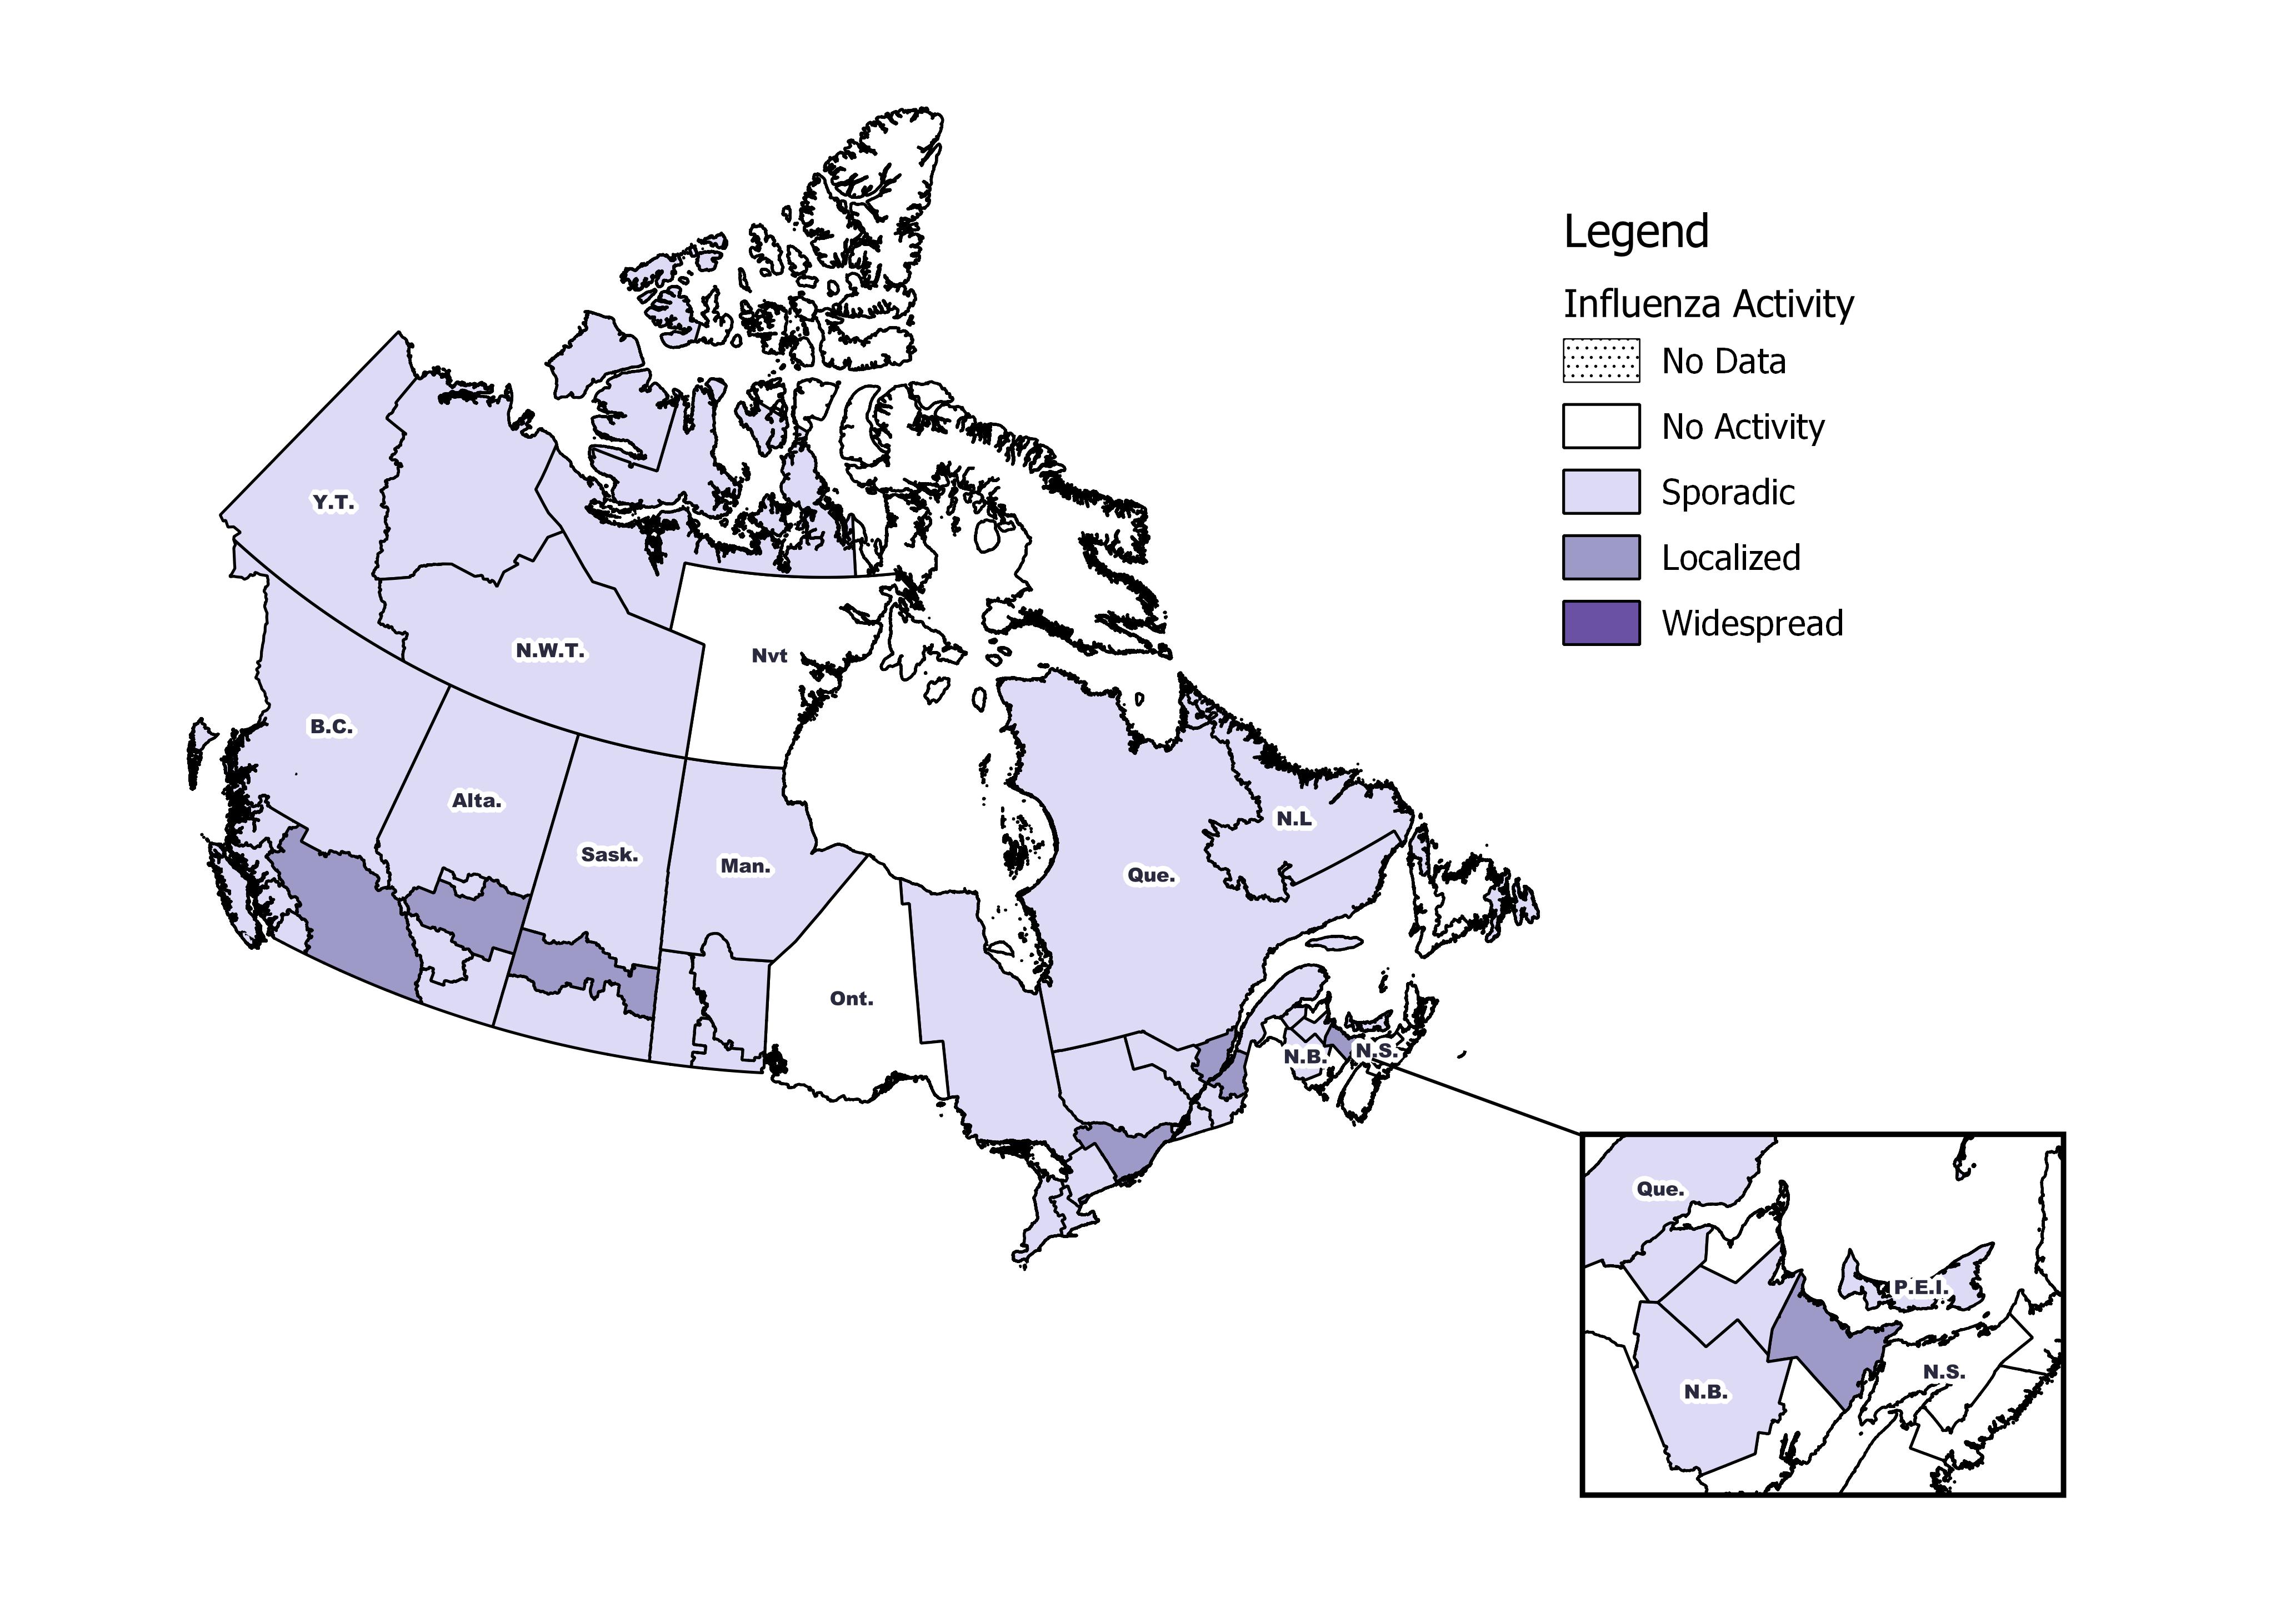
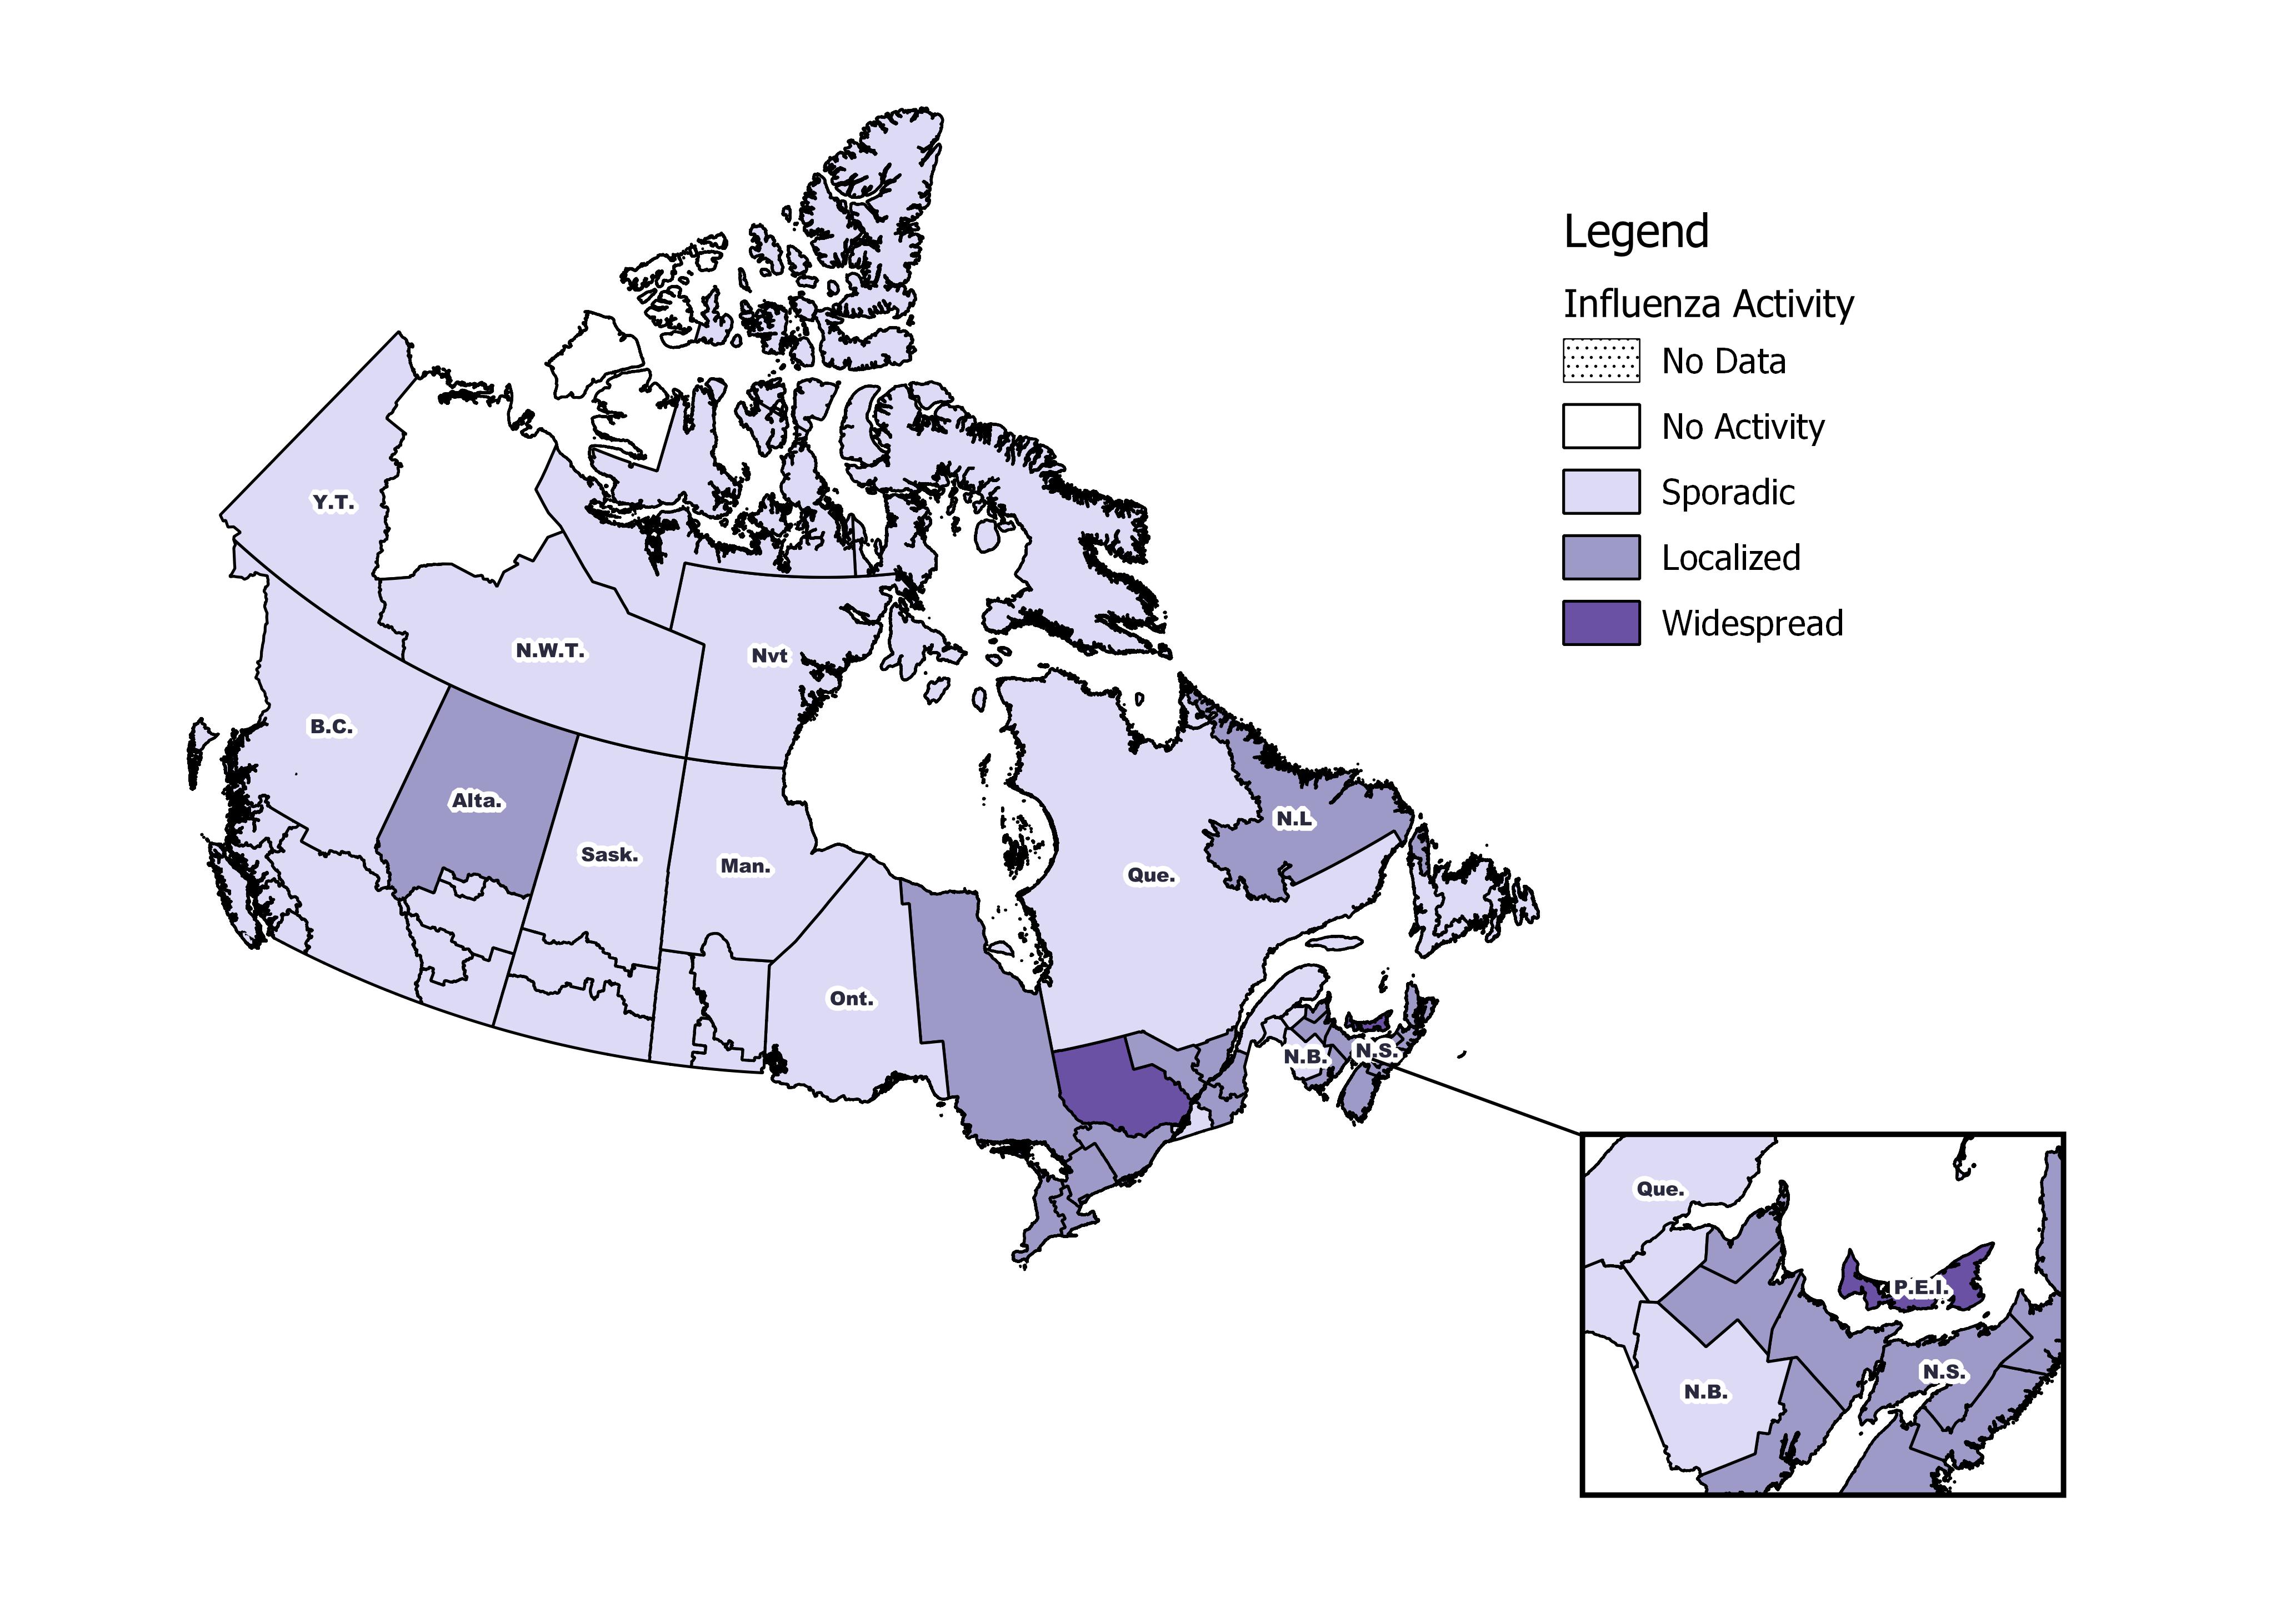
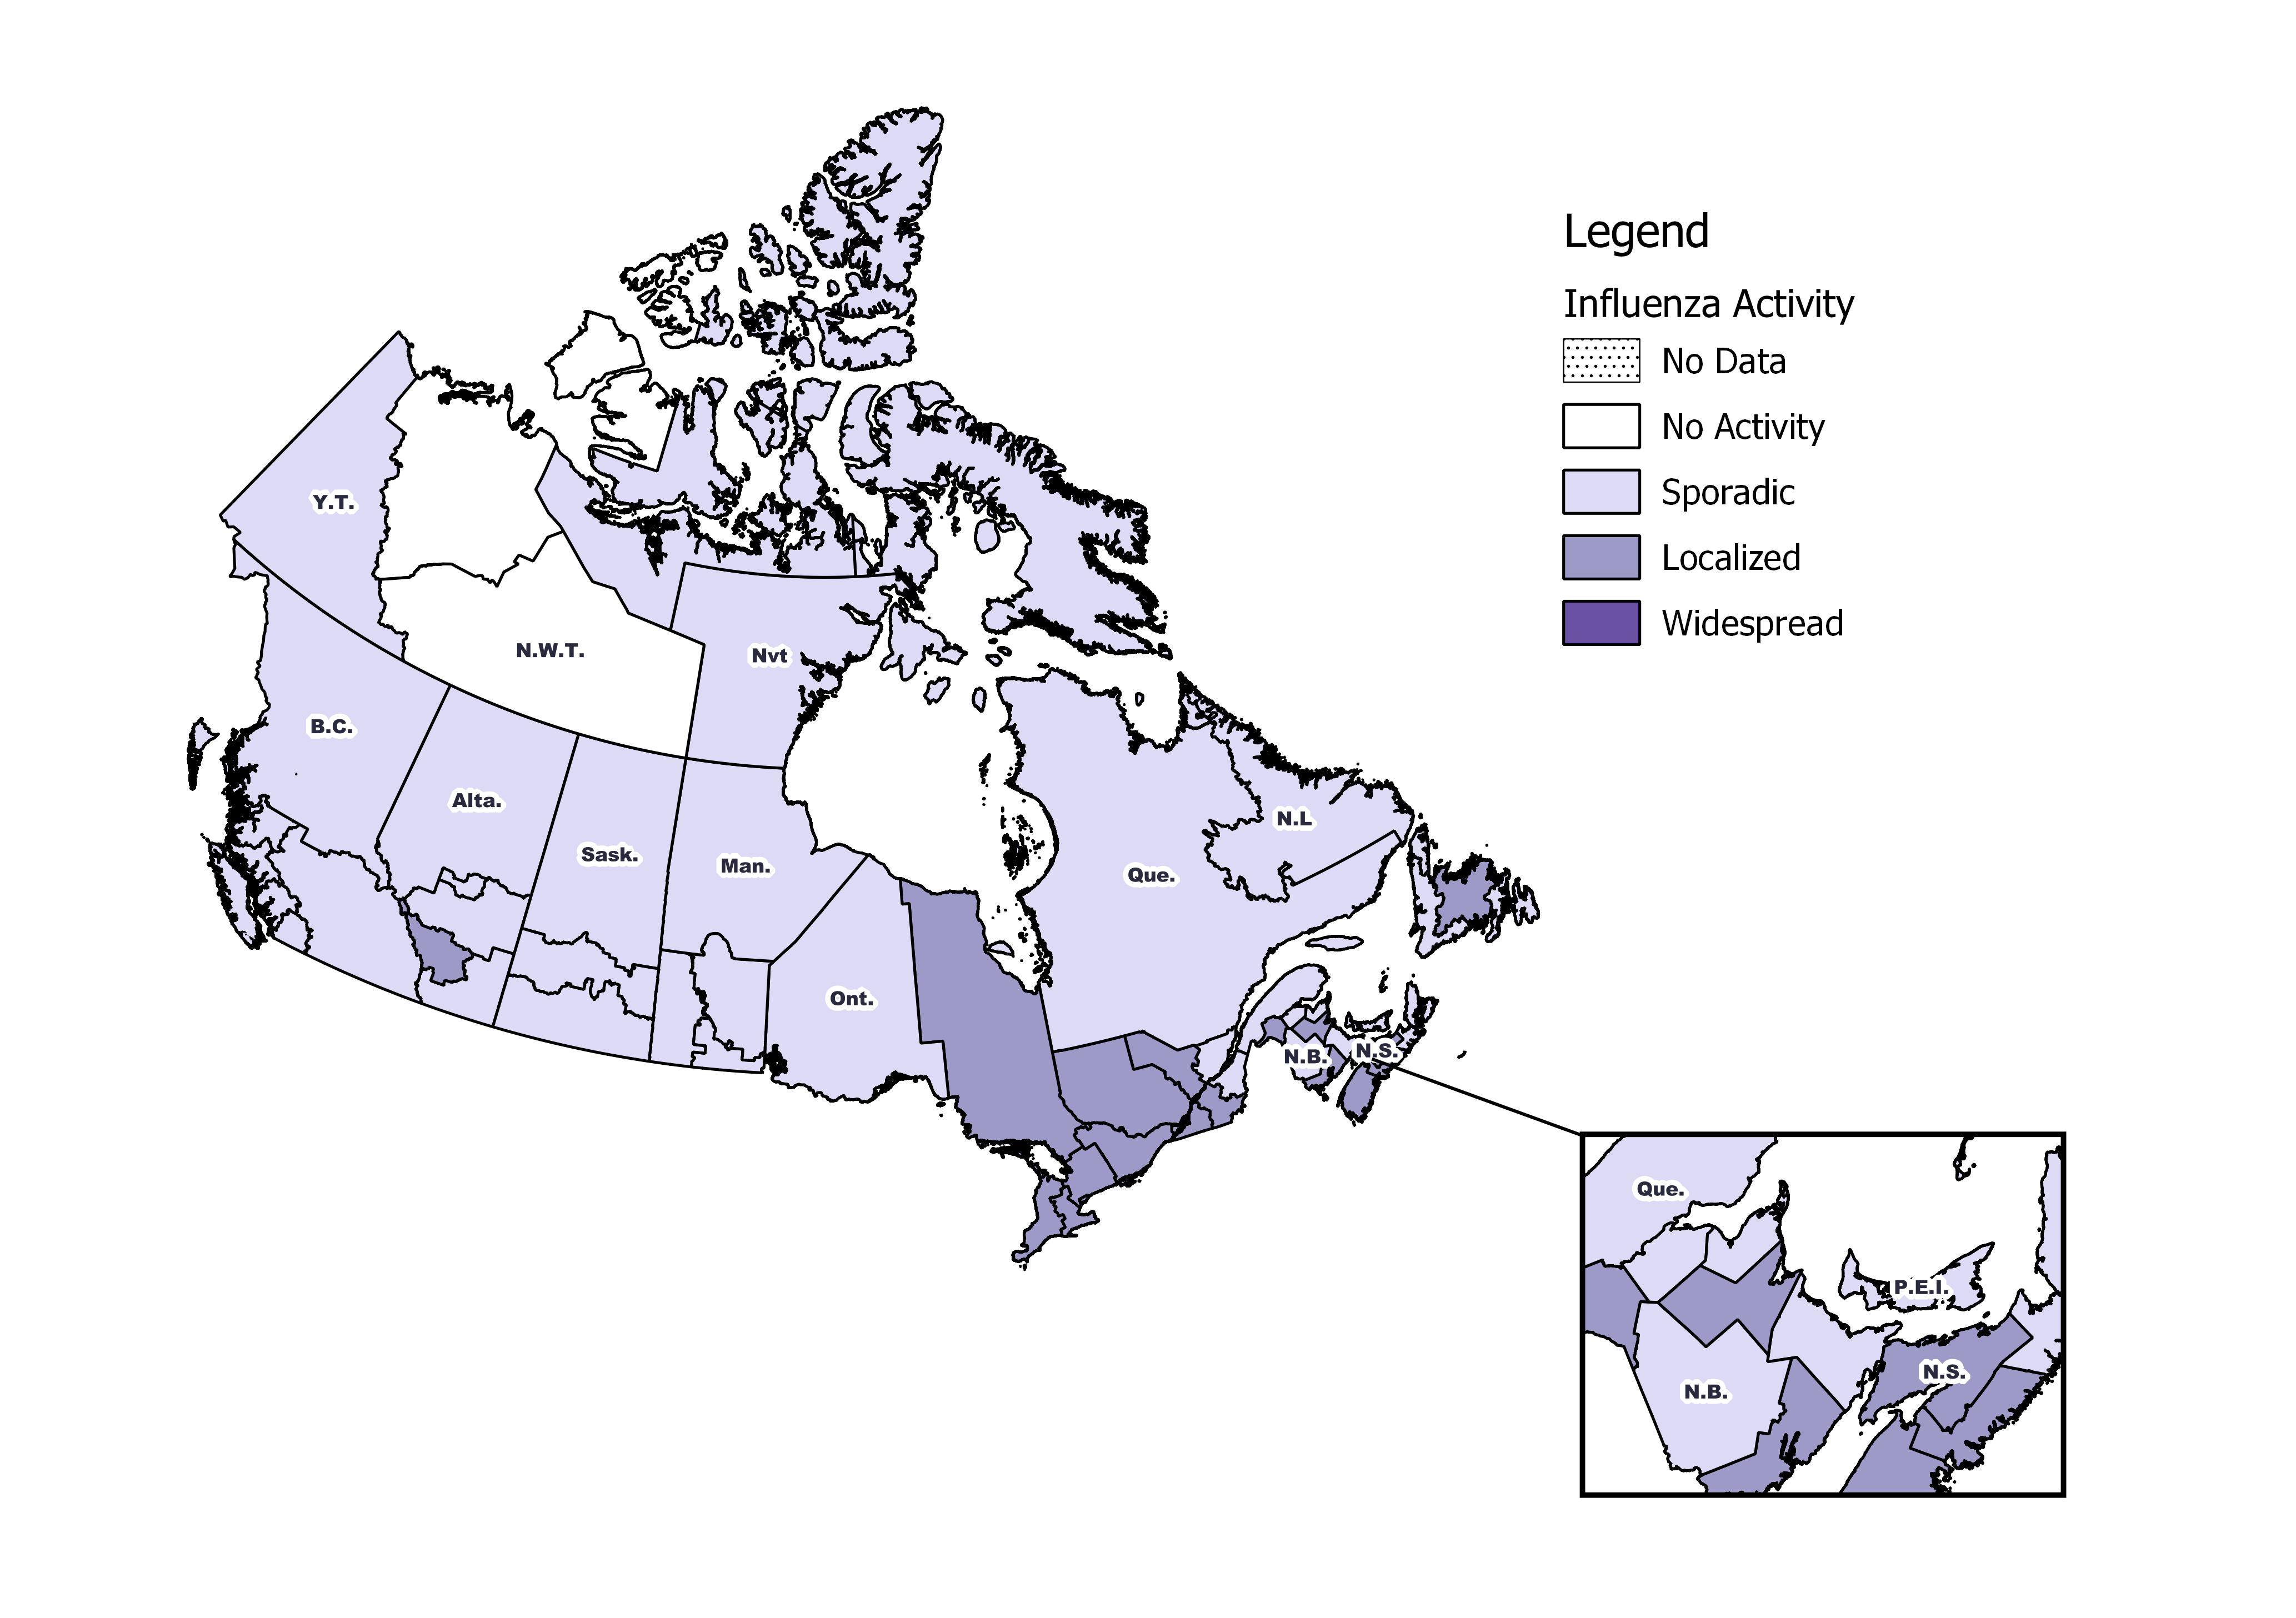
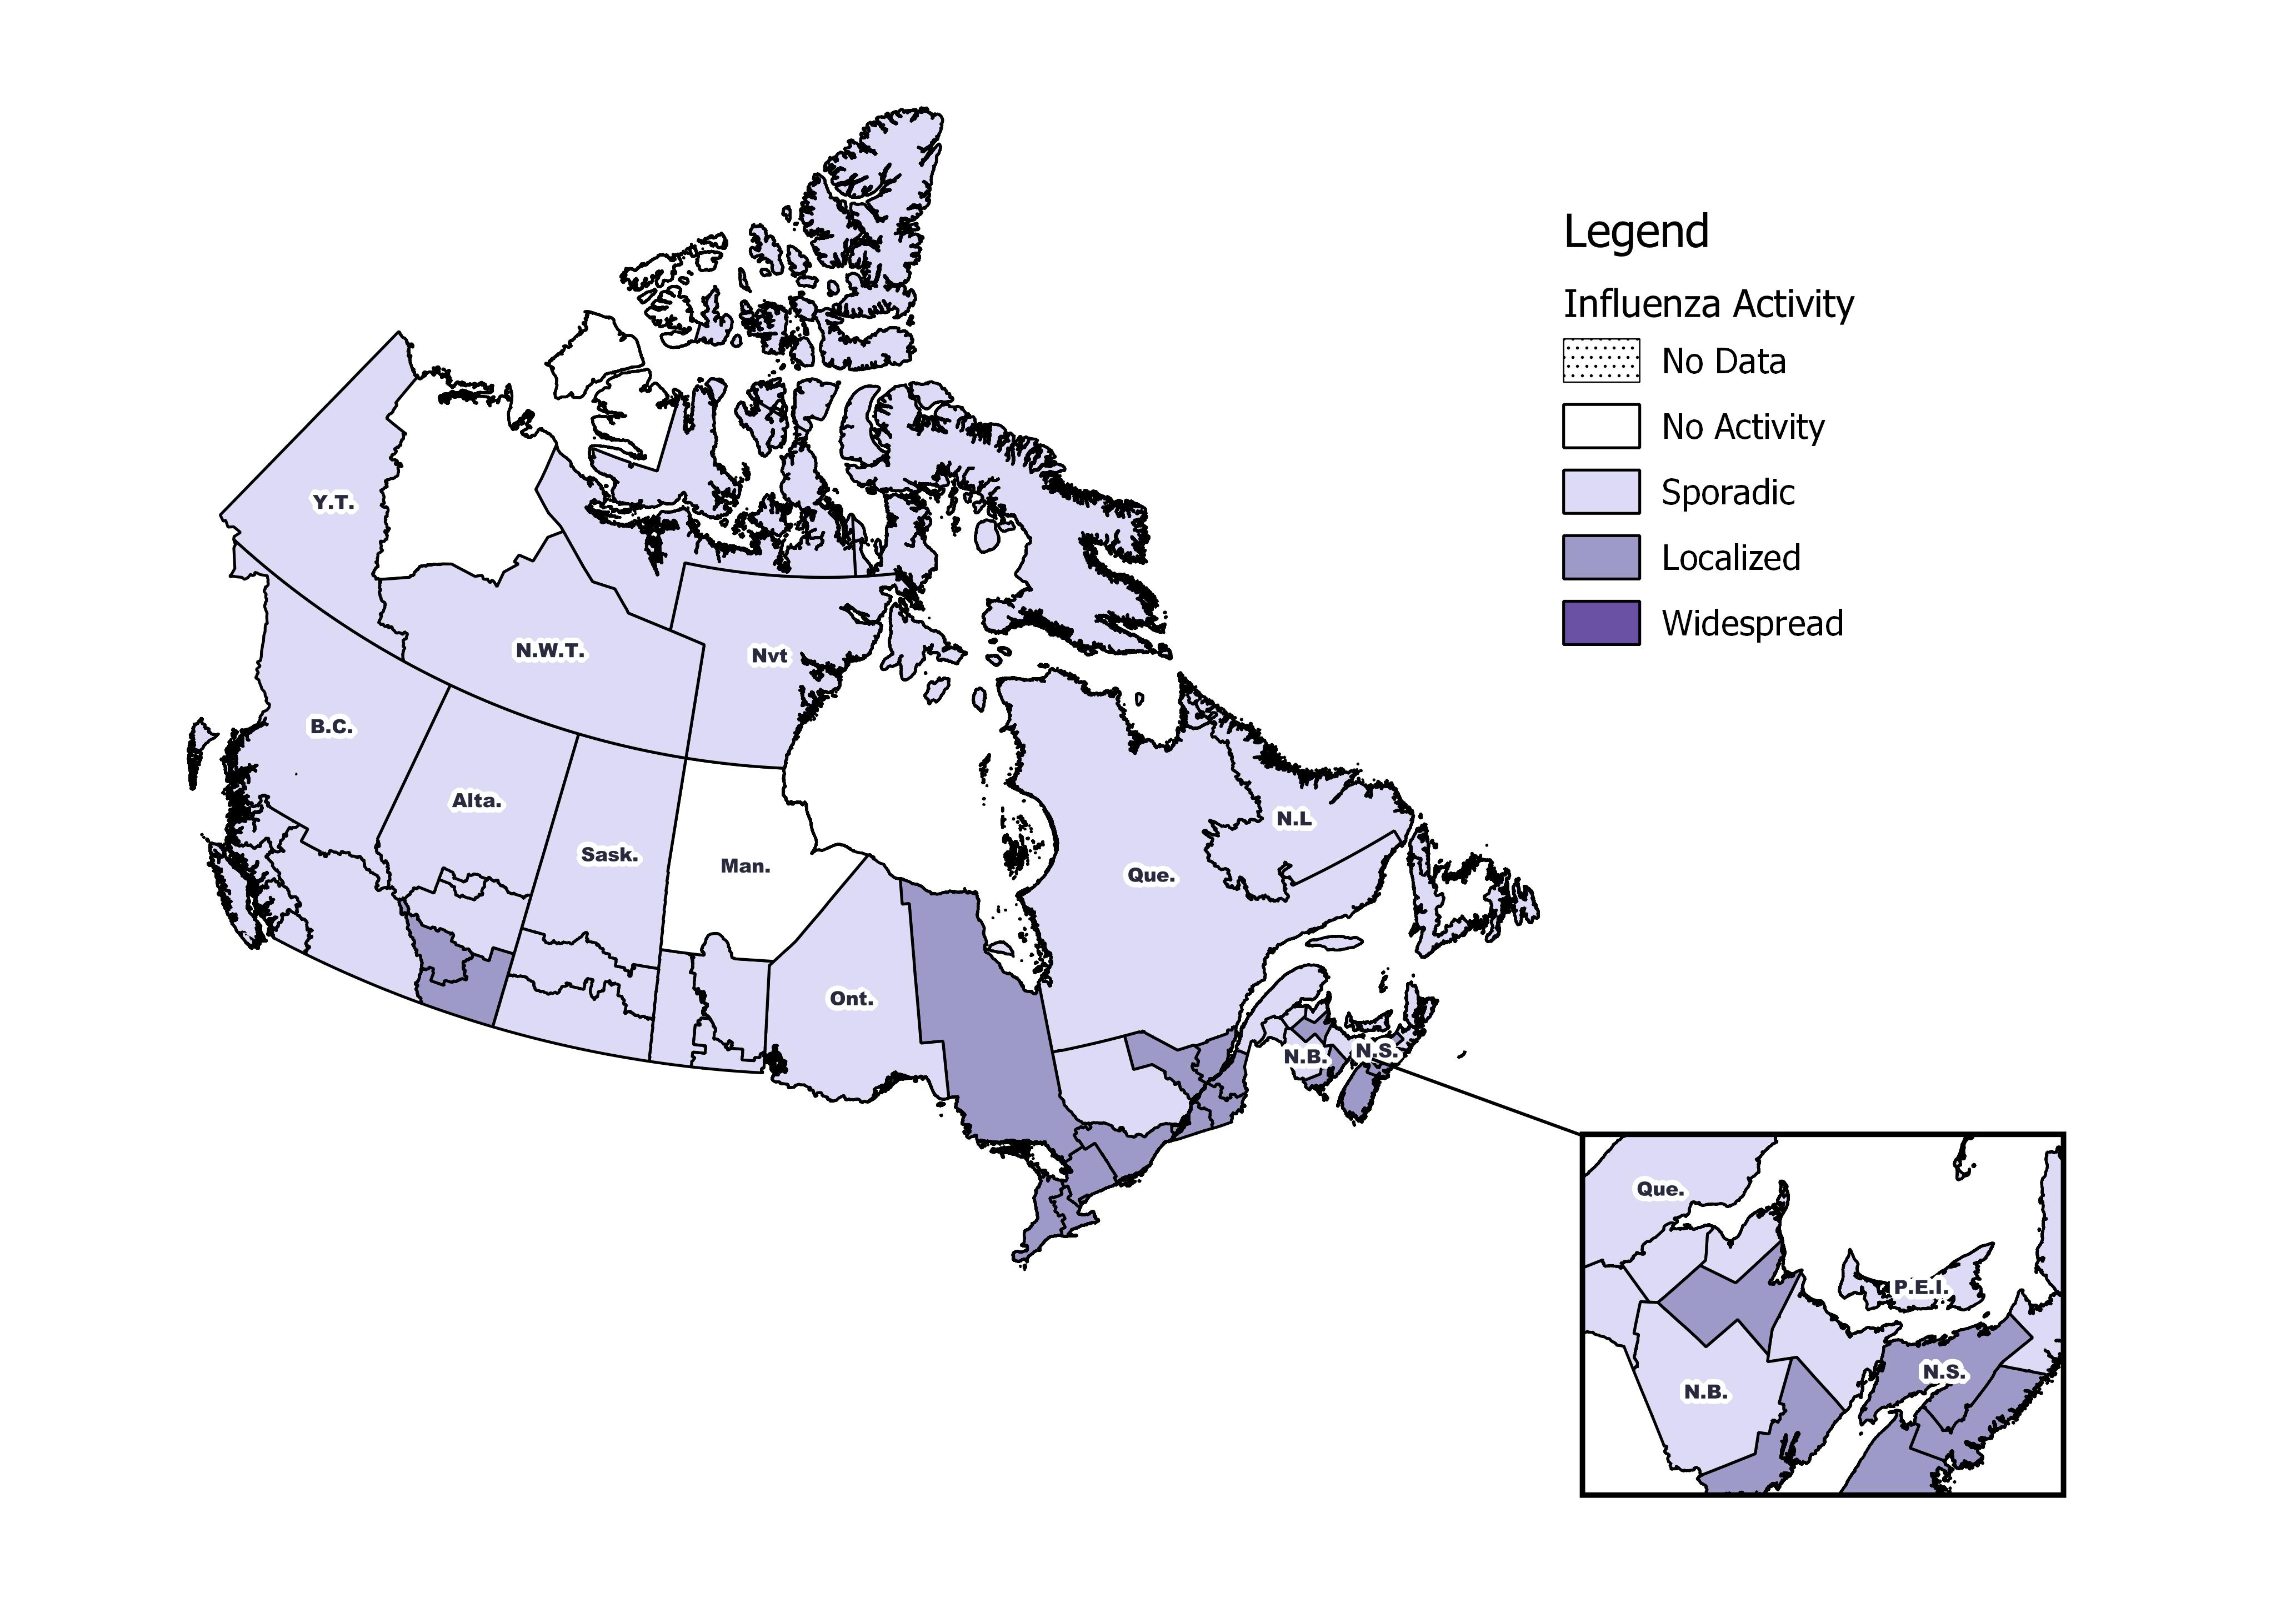
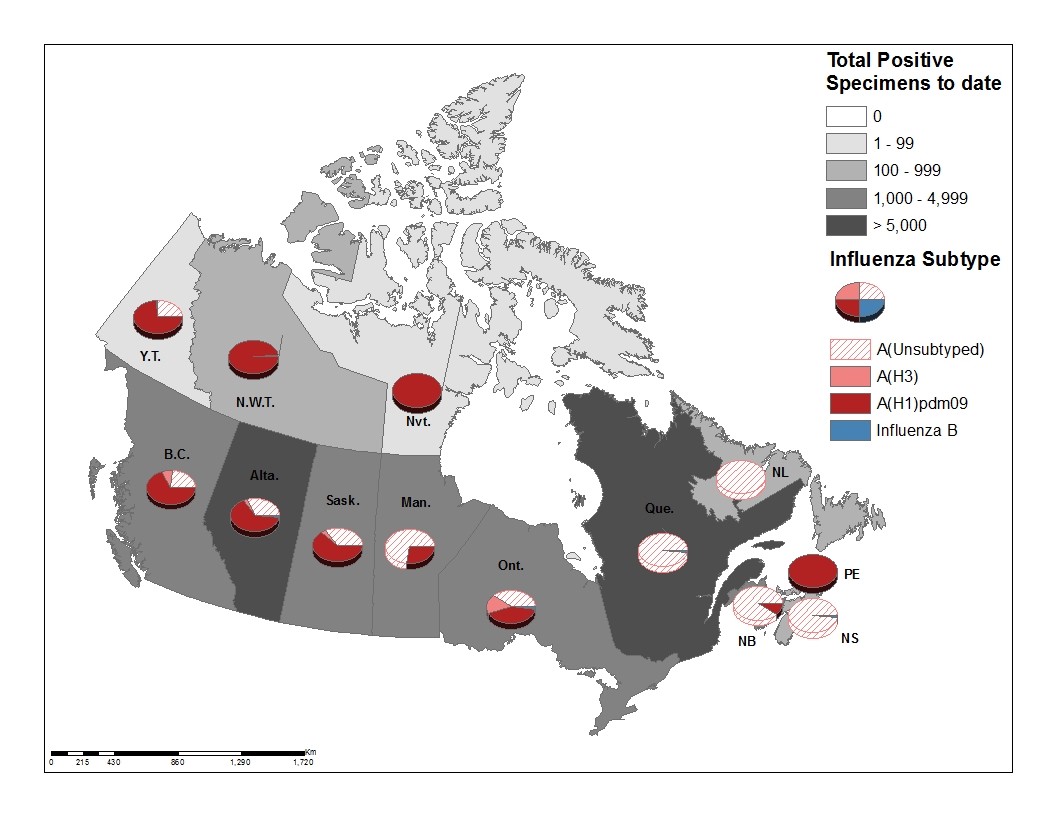
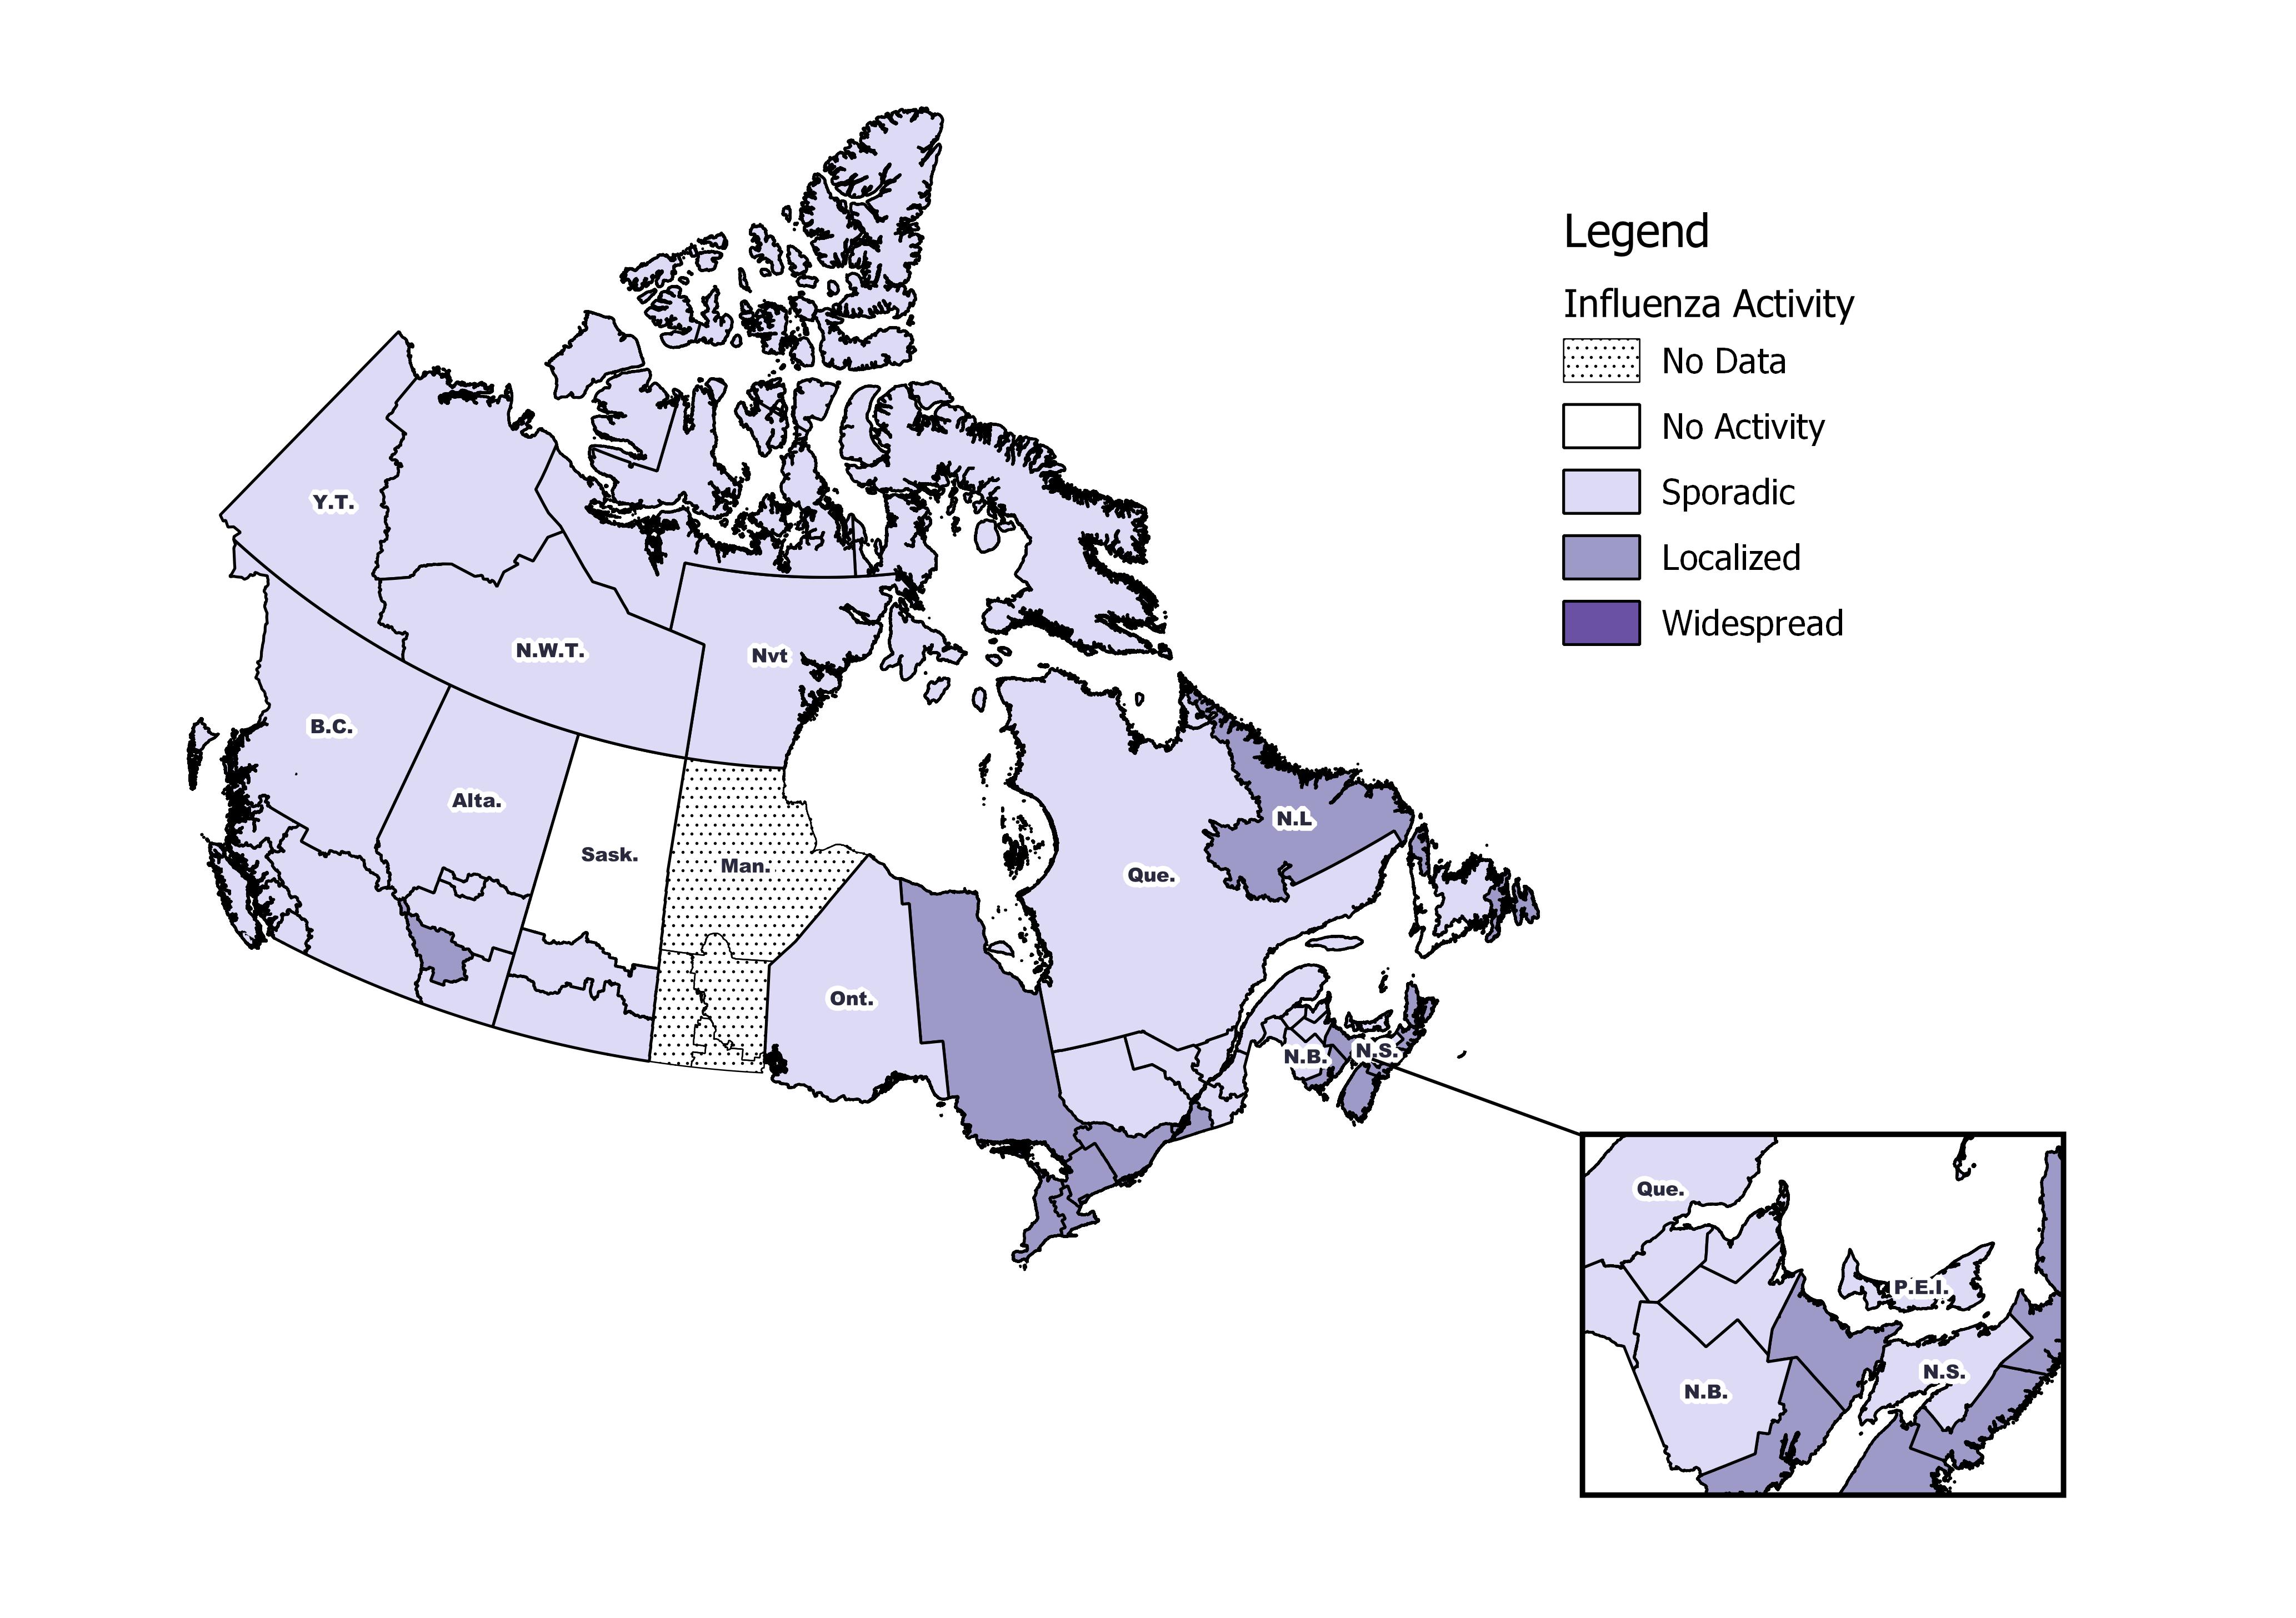
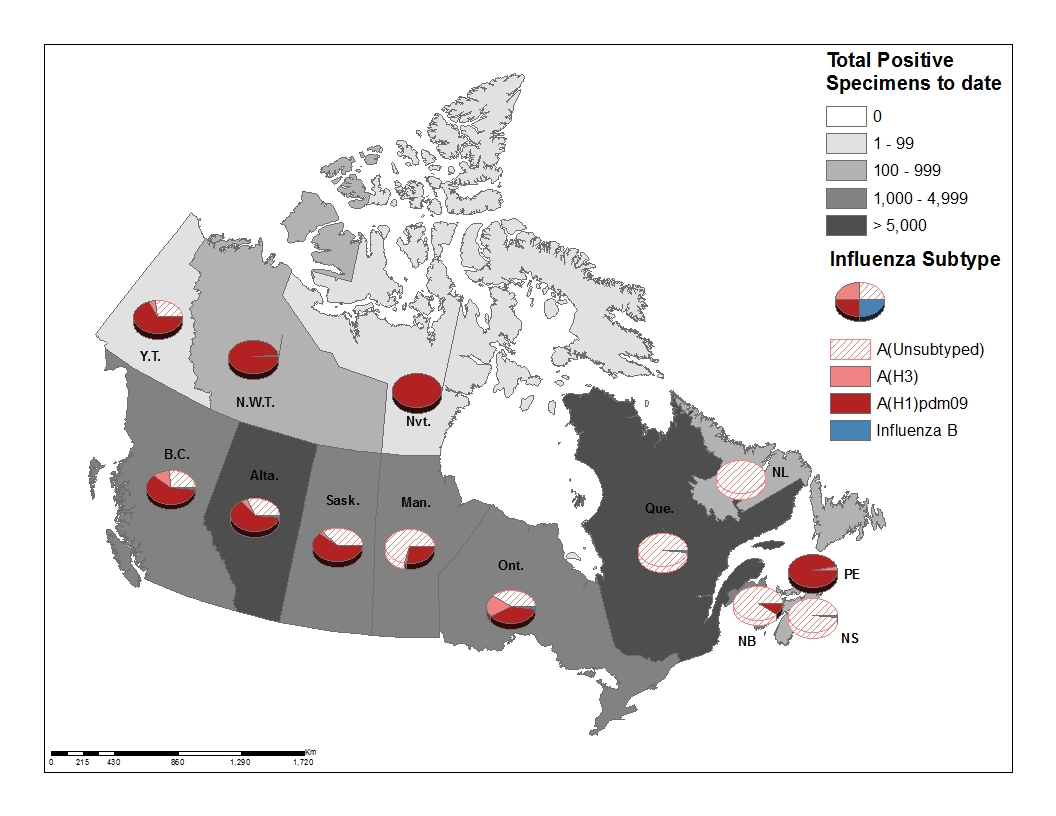
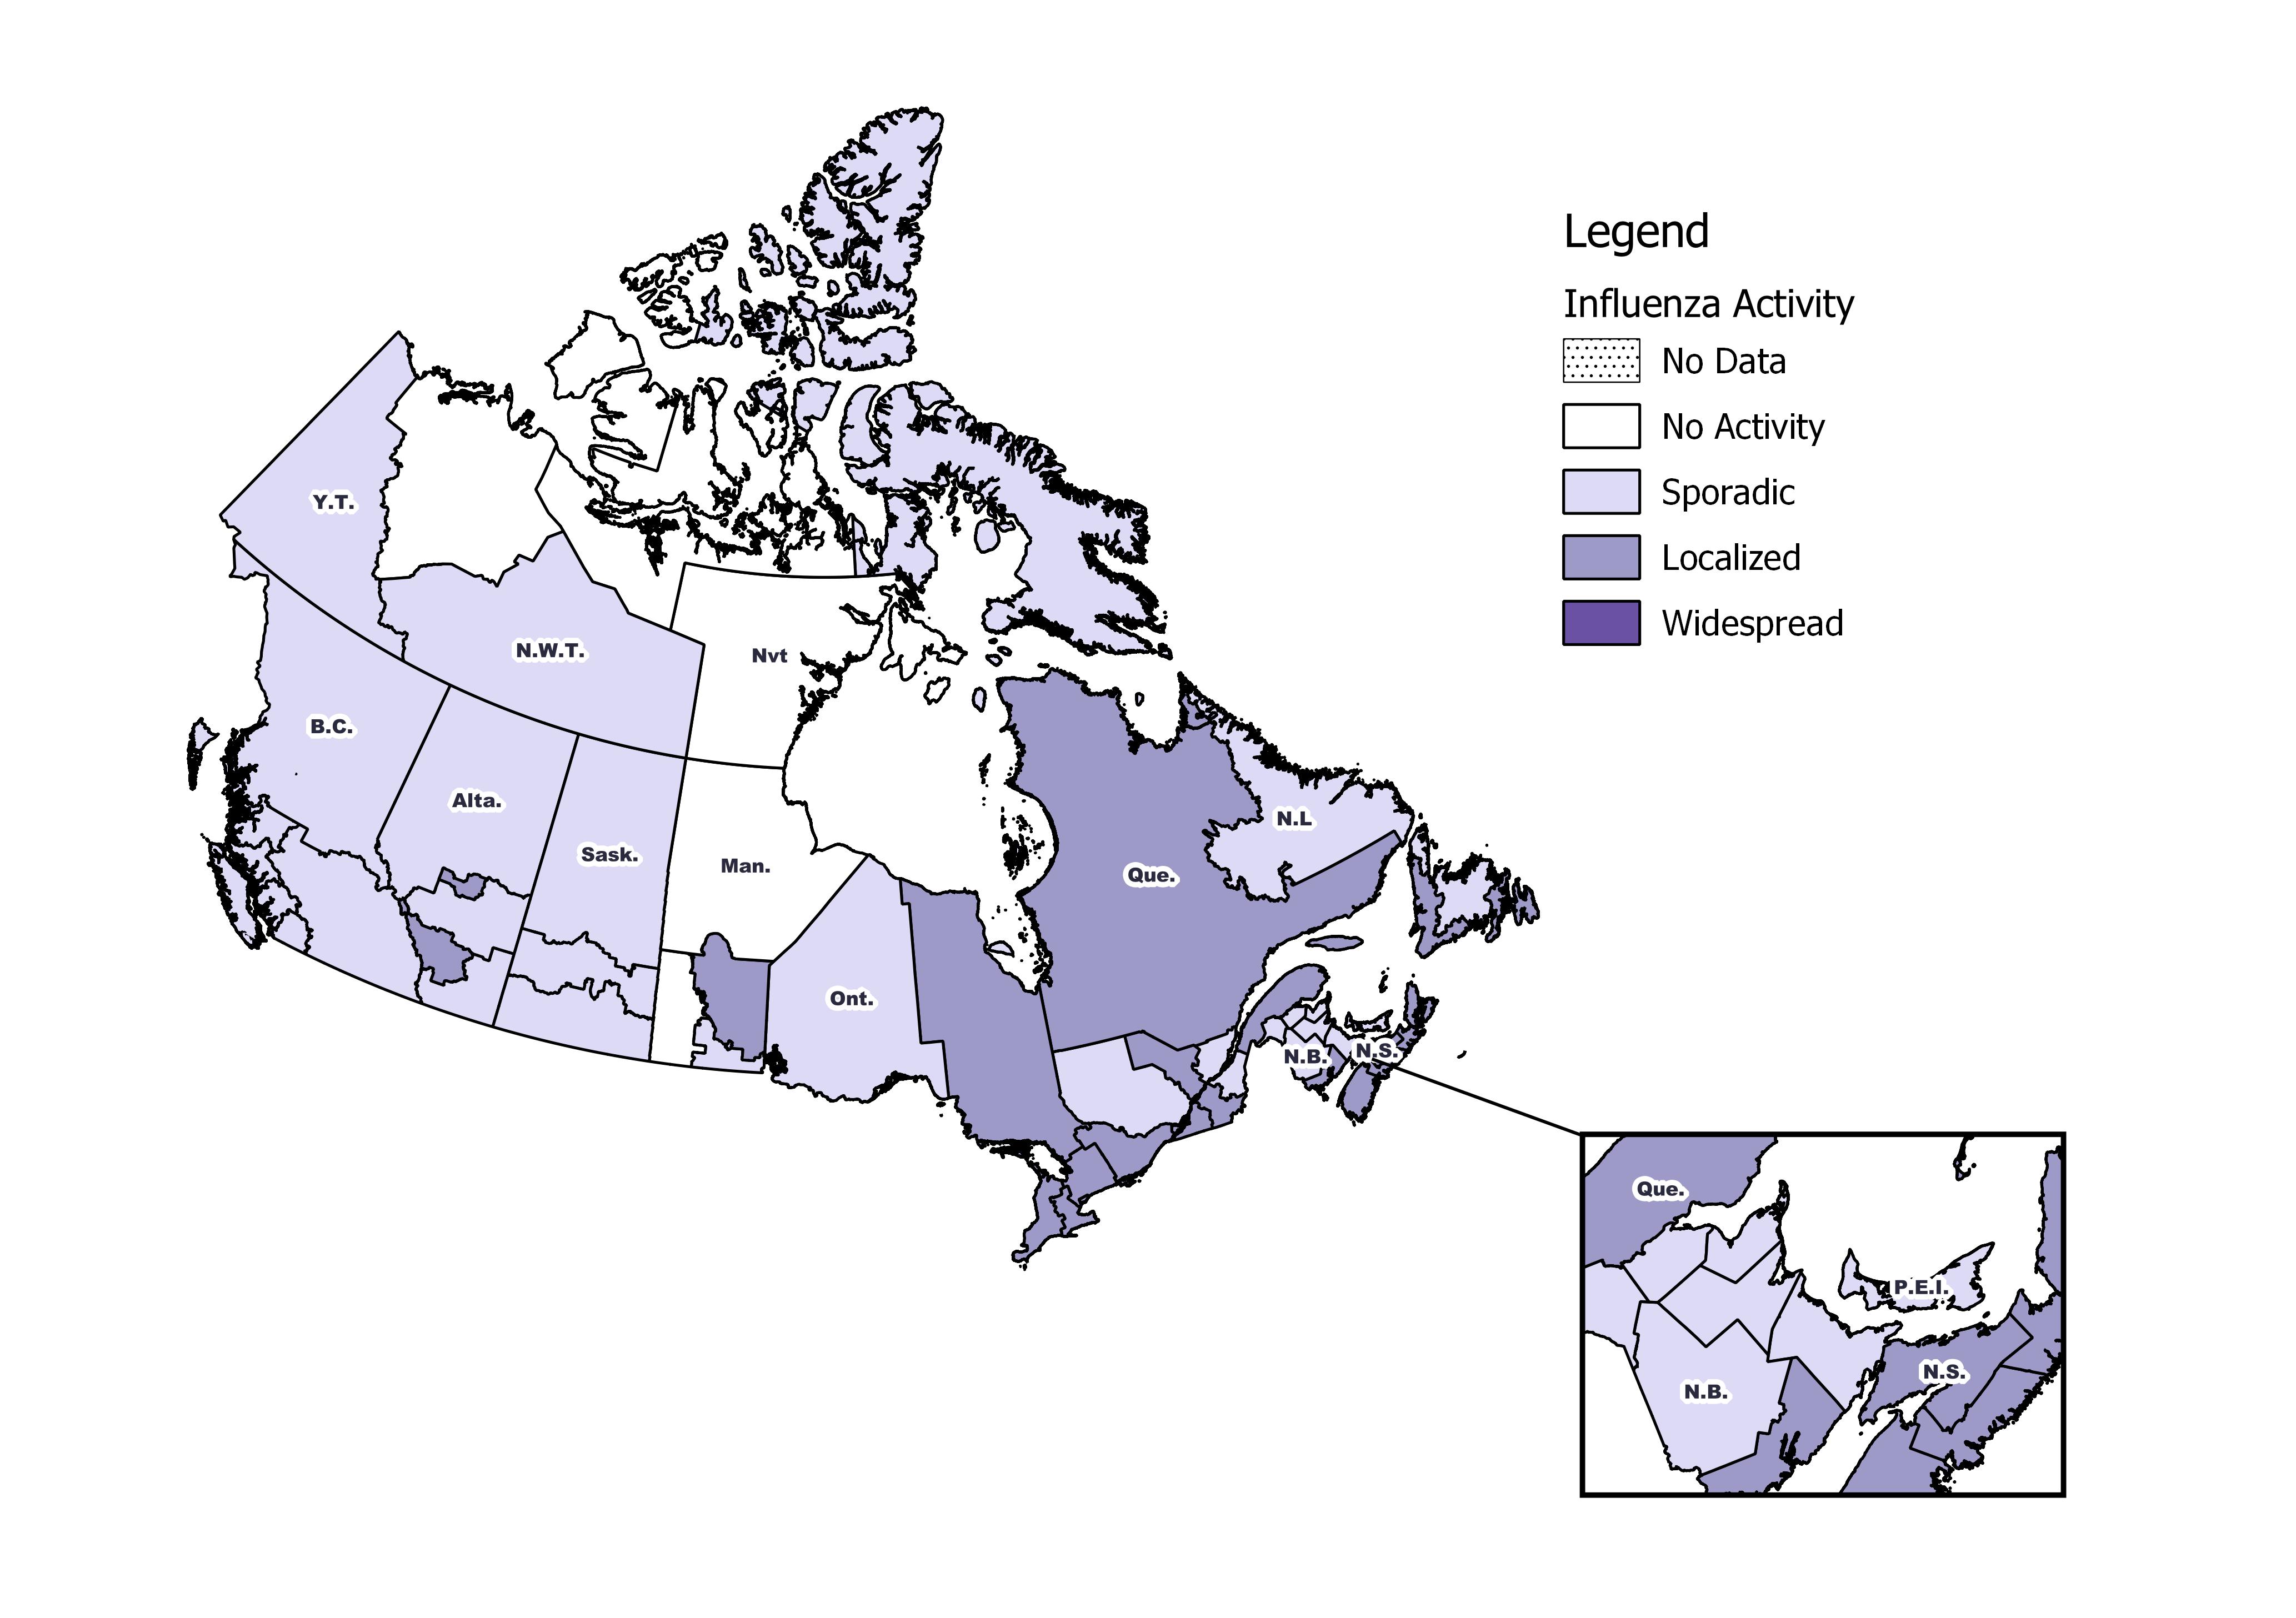
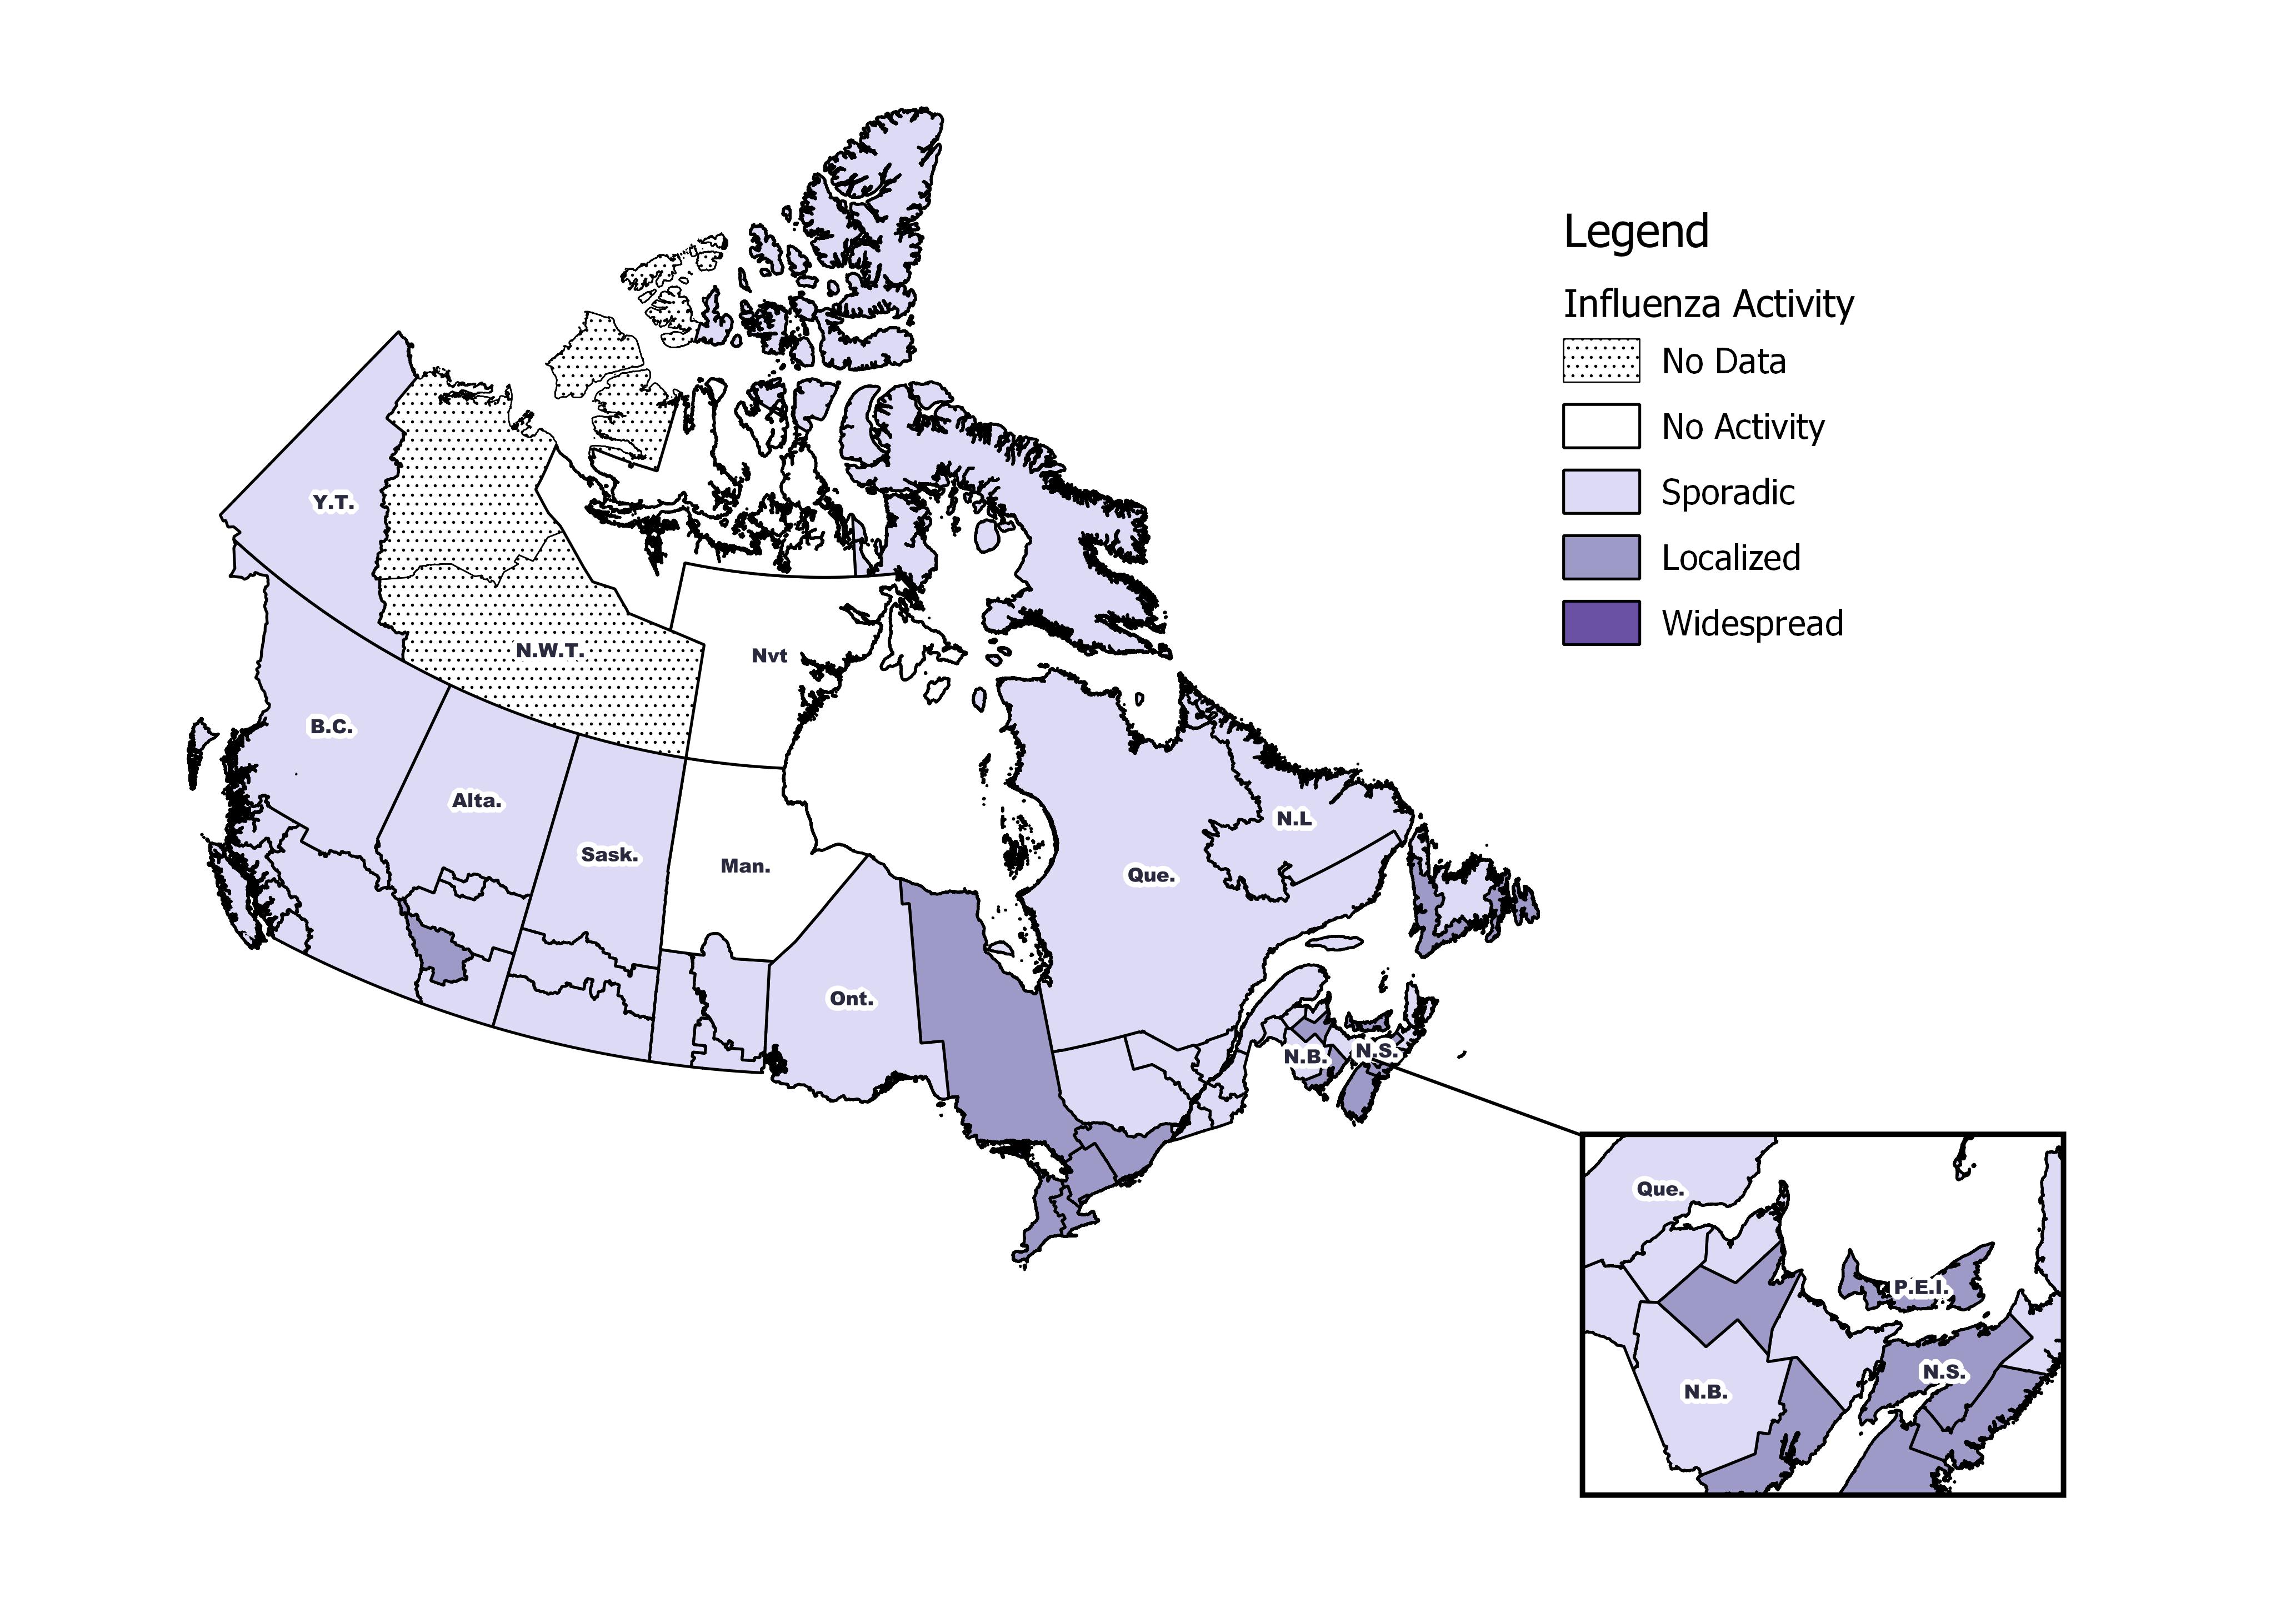
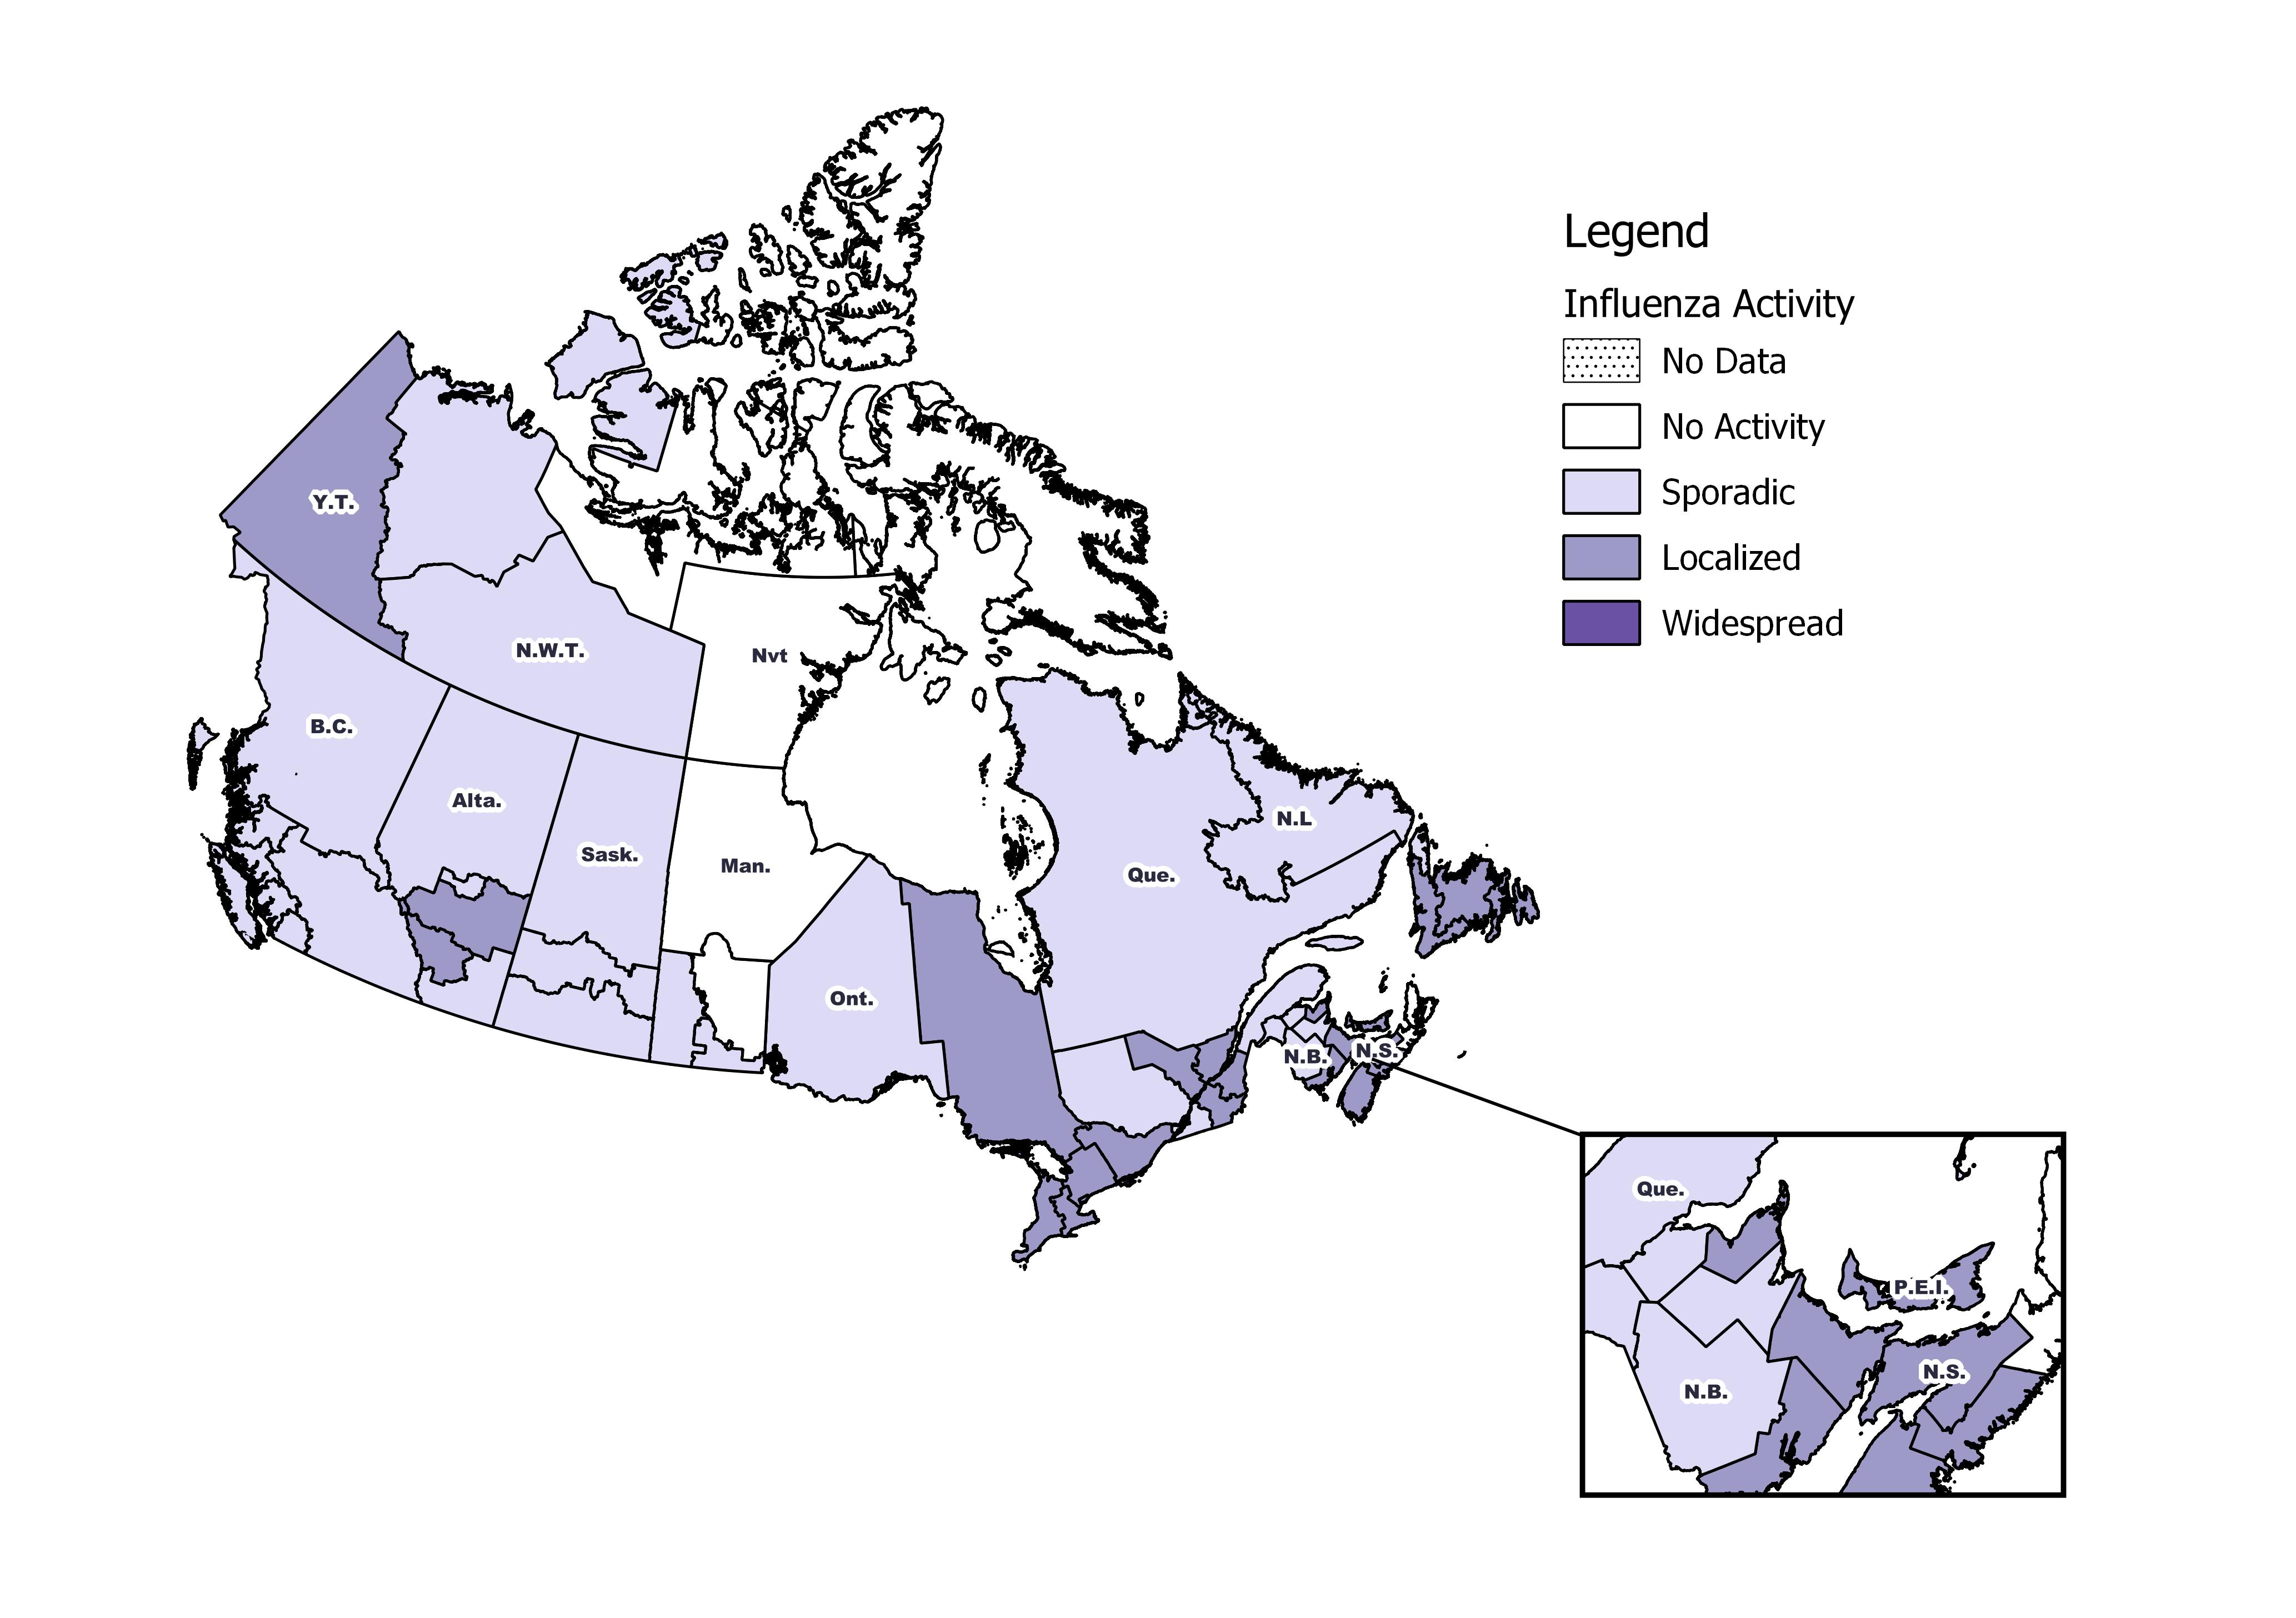
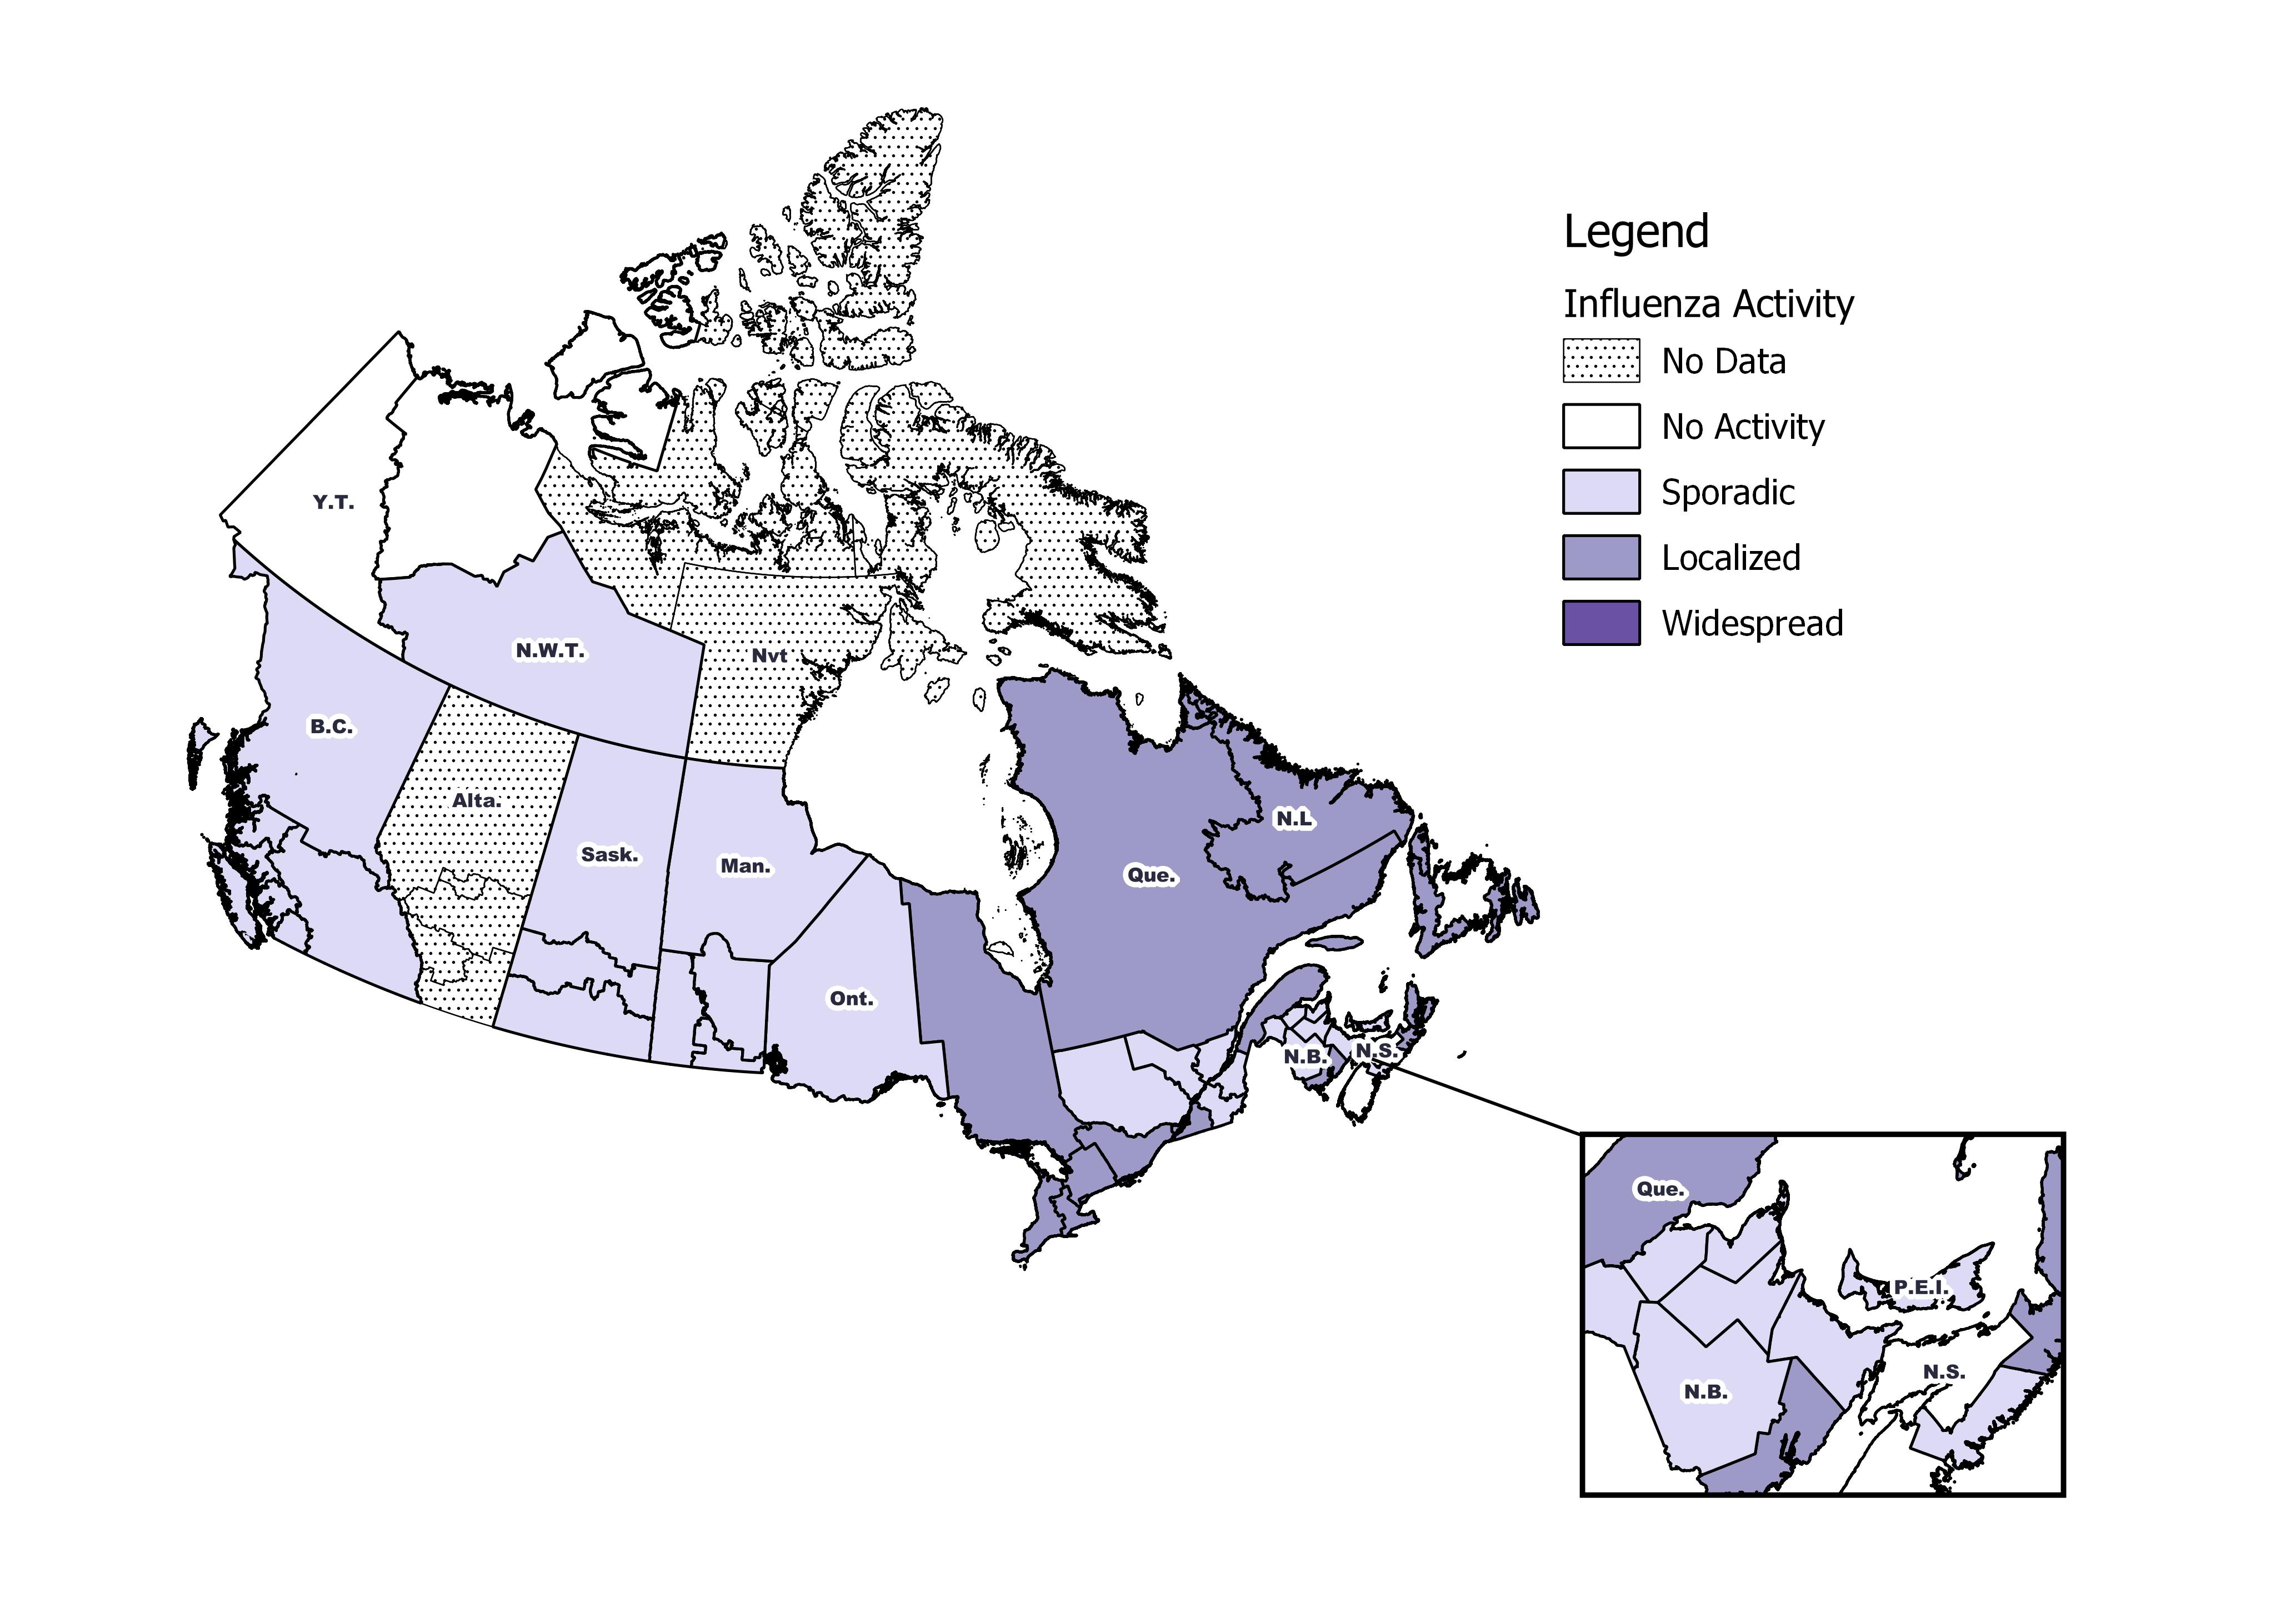
[h=2]Influenza/Influenza-like Illness Activity (geographic spread)[/h] During week 47, influenza activity levels increased slightly compared to the previous week (Figure 1):
One region reported widespread activity: in Que.(1),
Four regions reported localized activity: in Alta.(1), Ont.(2), and N.B.(1),
Sporadic activity was reported by 32 regions, in B.C.(5), Alta.(4), Sask.(3), Man.(3), Ont.(3), Que.(5), N.B.(2), N.S.(1), P.E.I.(1), N.L.(2), N.W.T(2) and Nvt.(1).
No activity was reported by 16 regions.
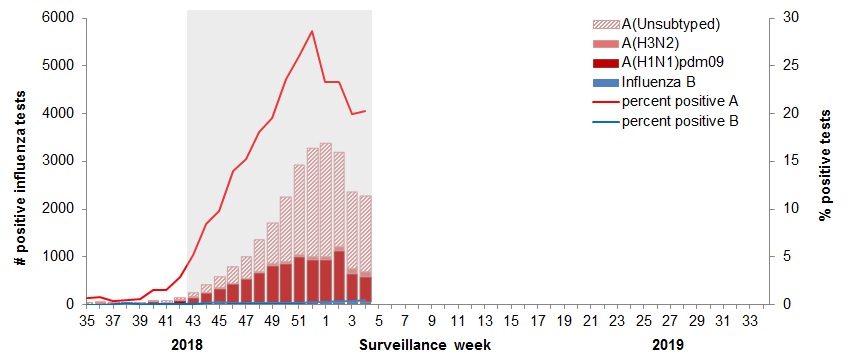
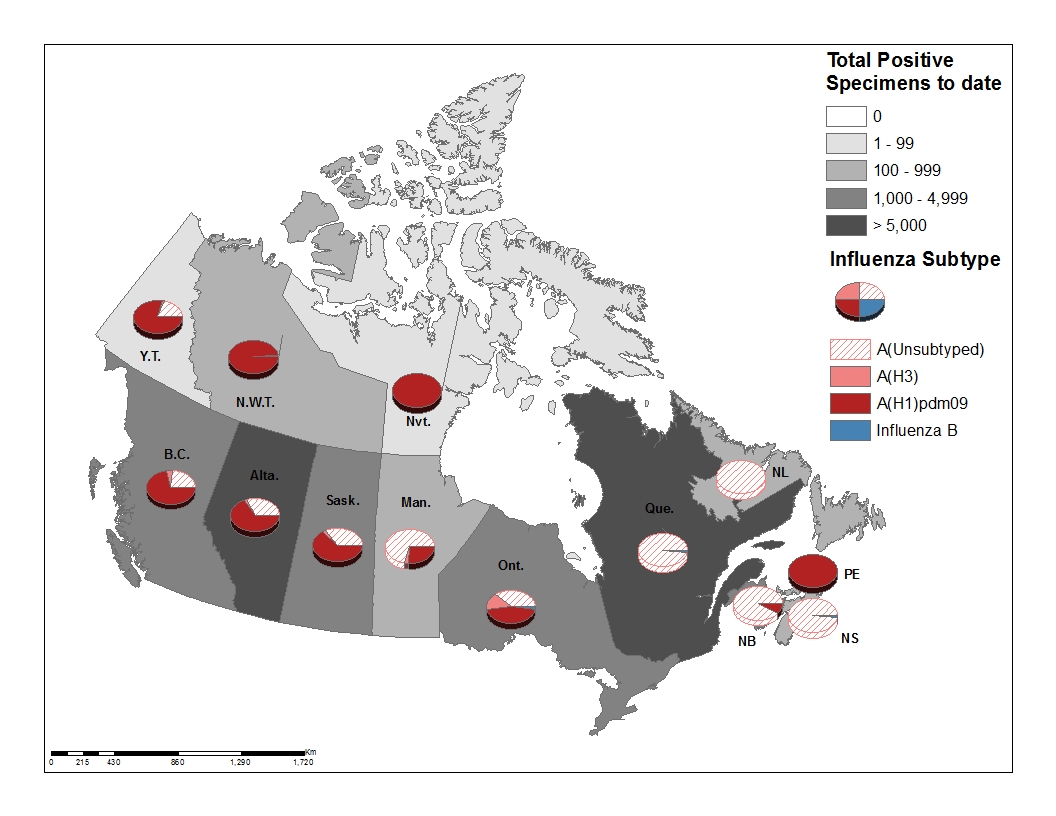
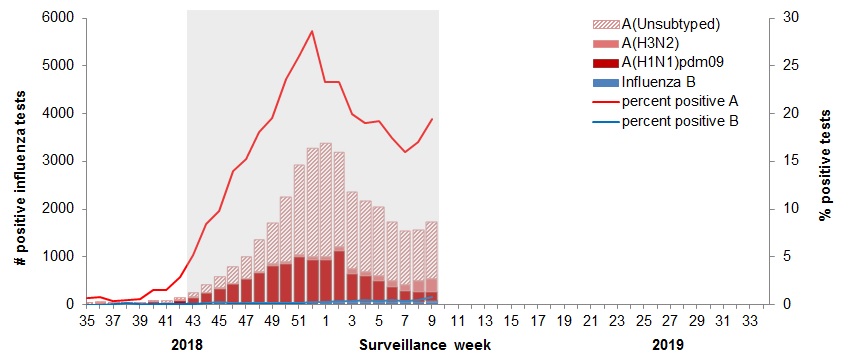
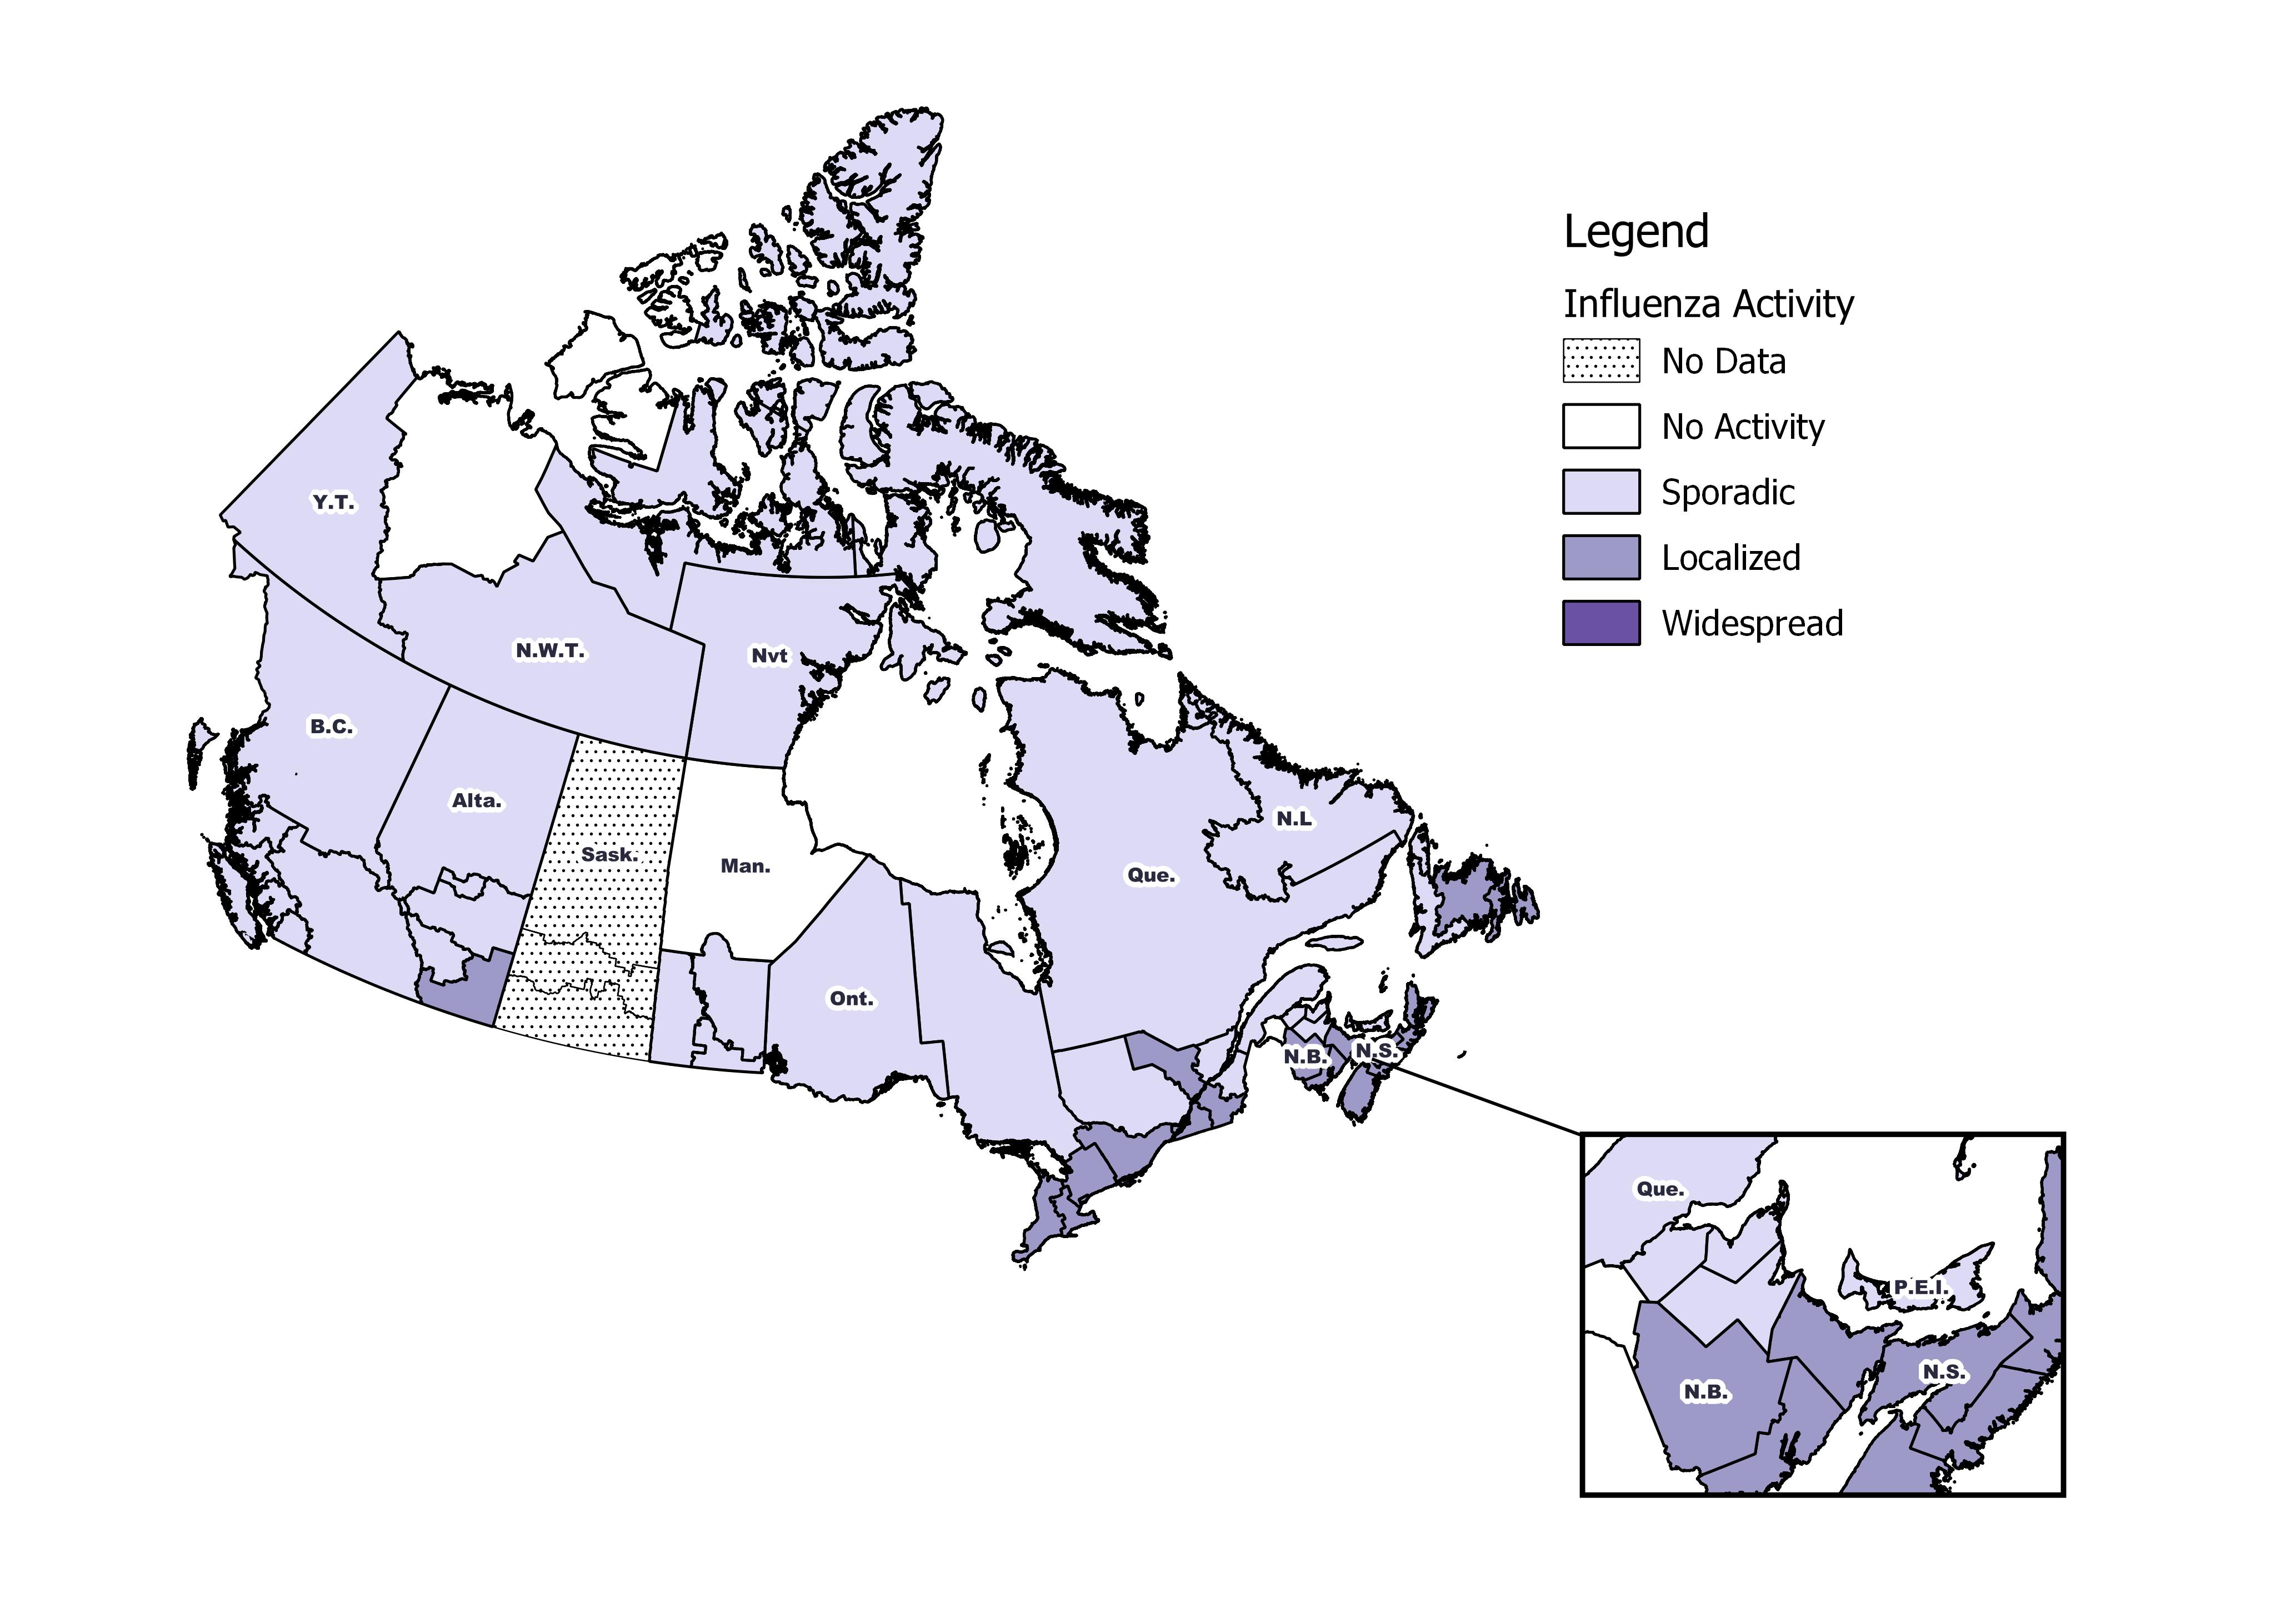
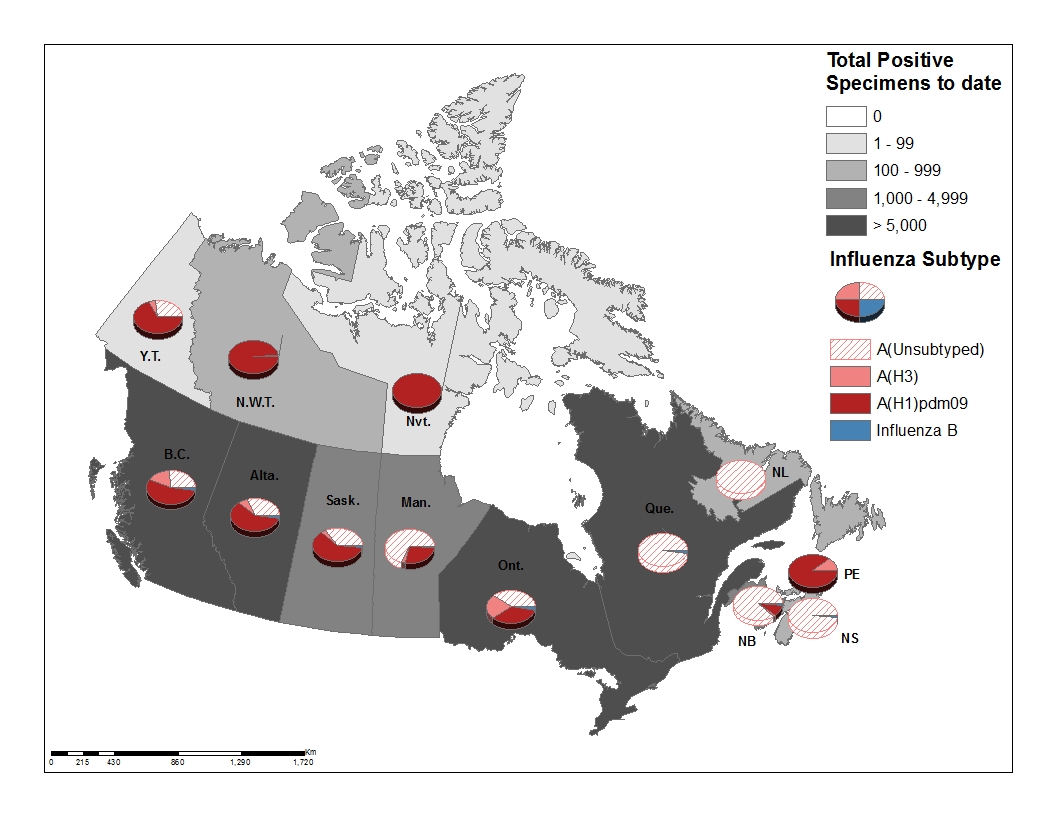
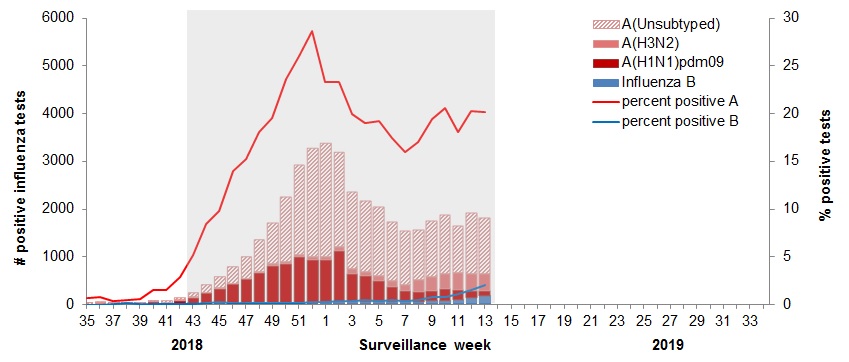
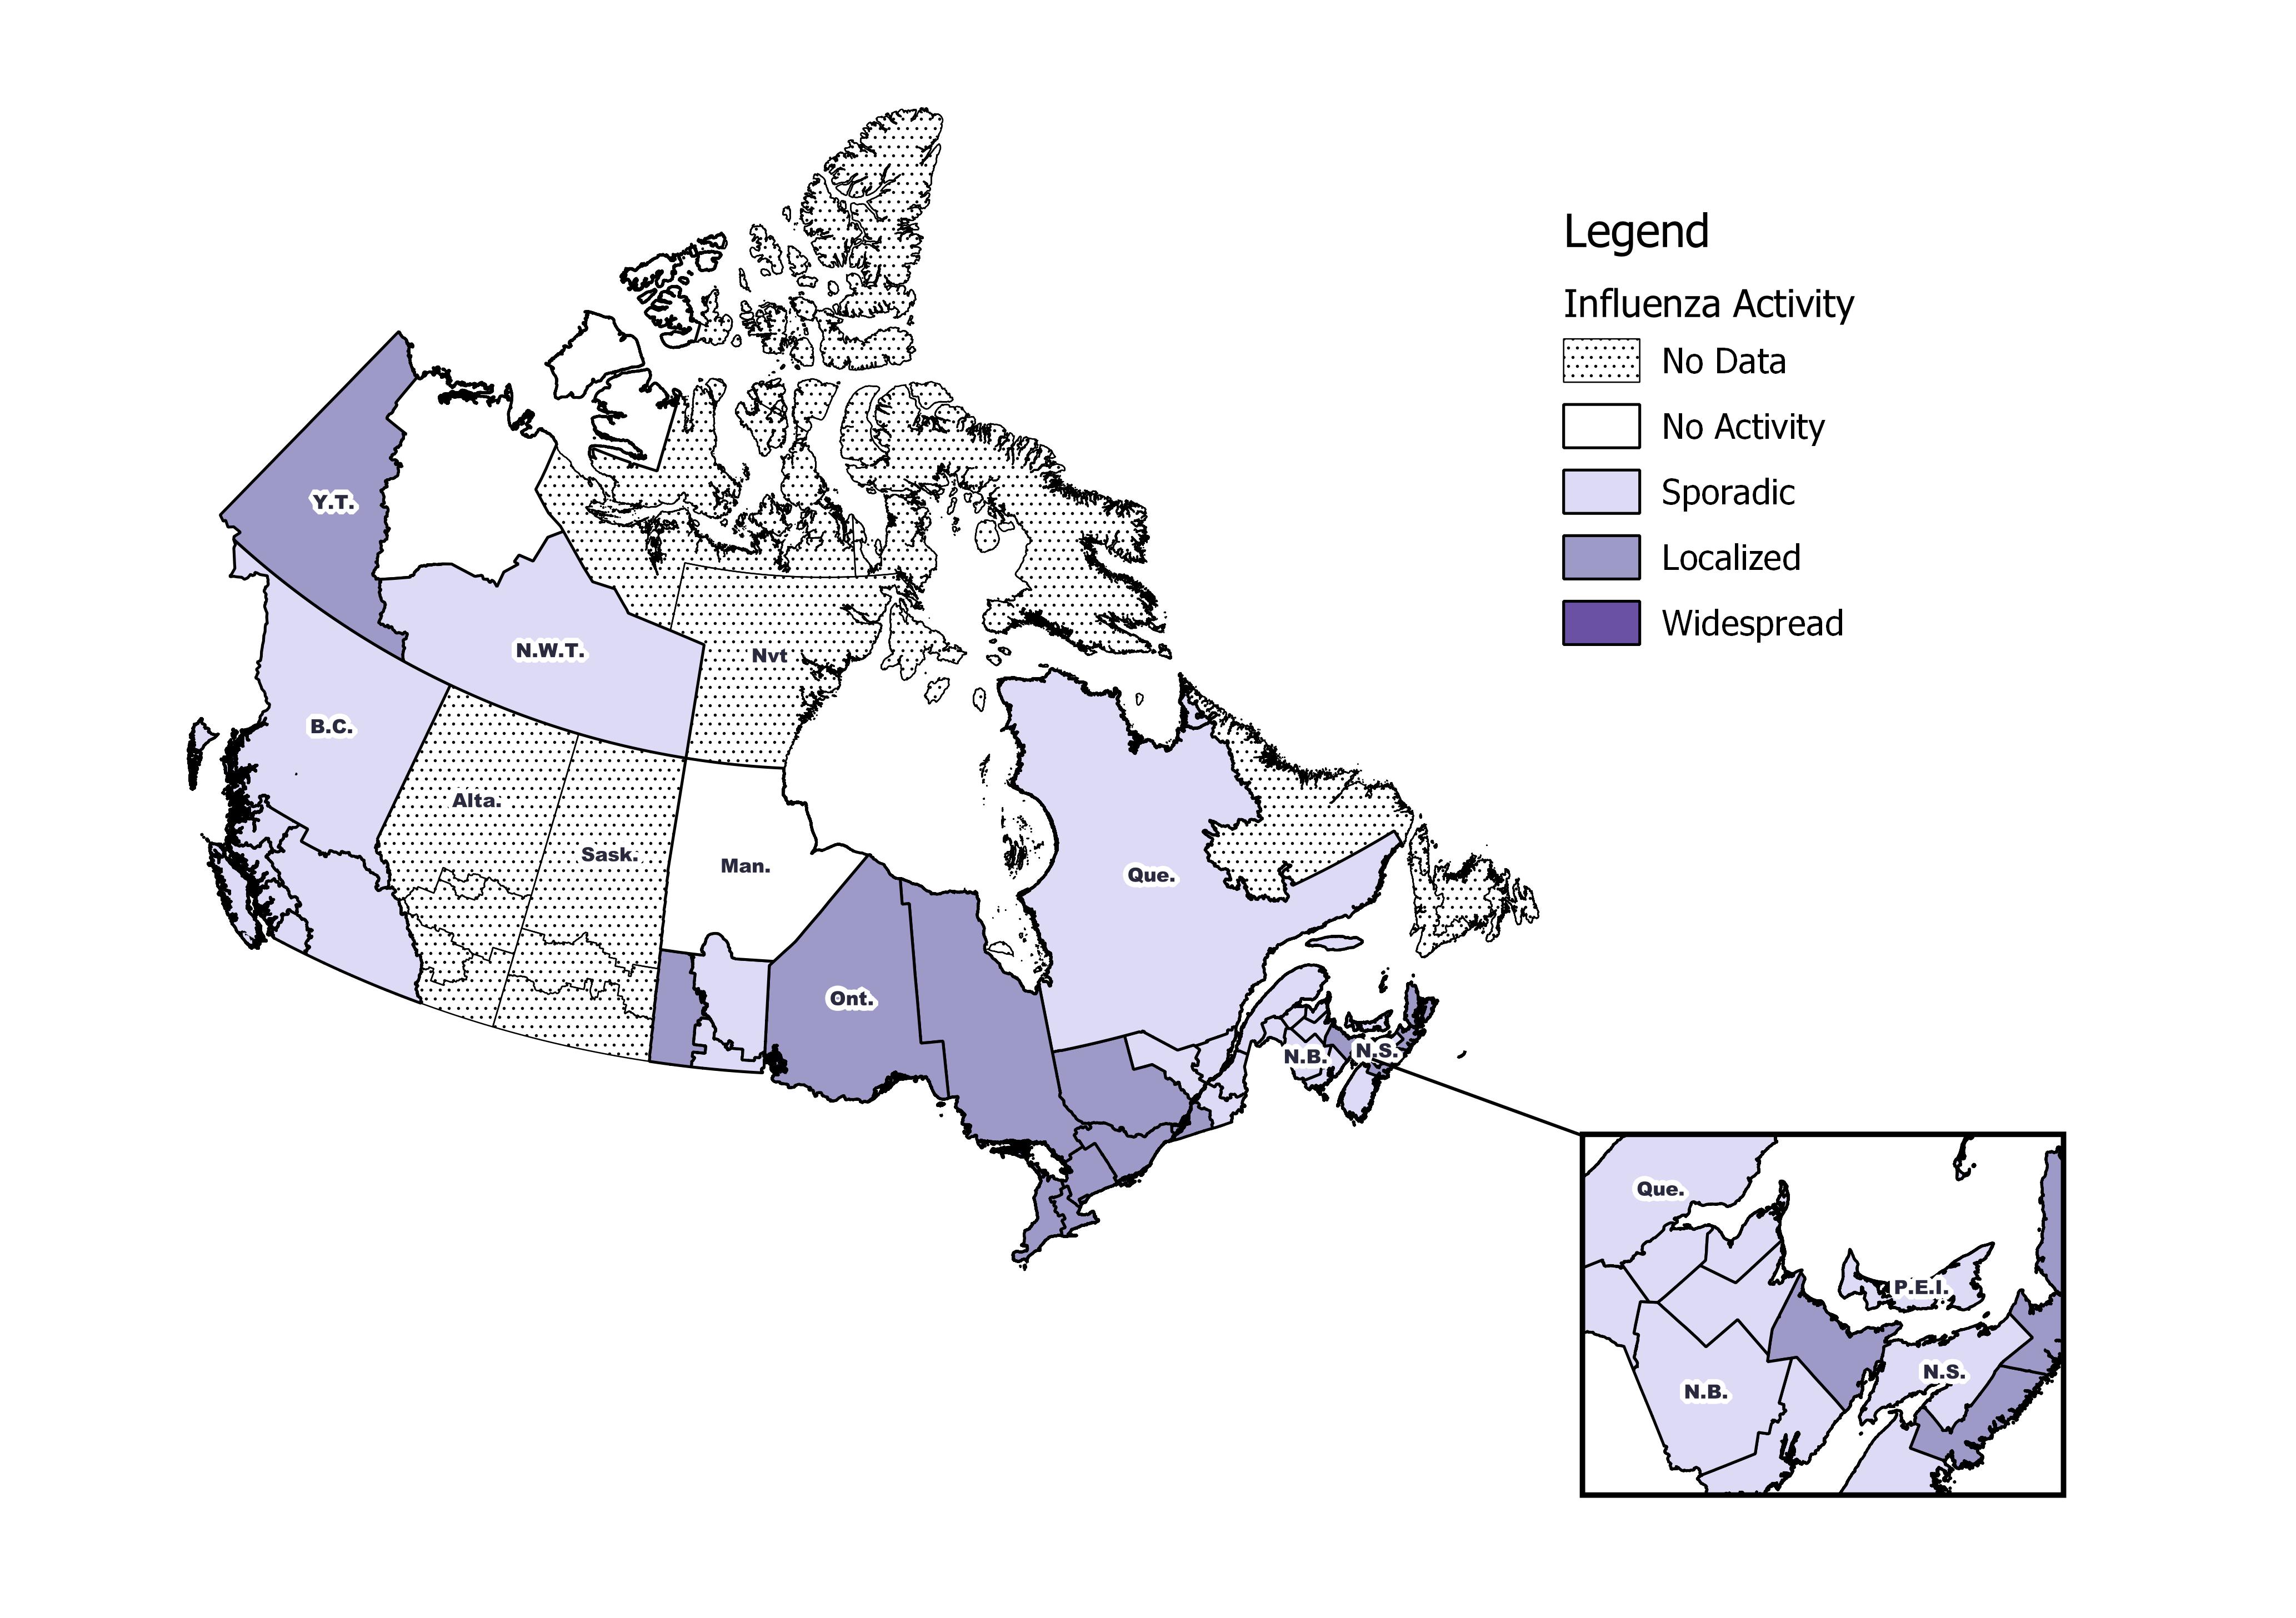
[h=3]Figure 1 ? Map of overall influenza/ILI activity by province and territory, Canada, week 2018-47[/h] Figure 1 - Text description [h=2]Laboratory Confirmed Influenza Detections[/h] In week 47, the following results were reported from sentinel laboratories across Canada (Figure 2):
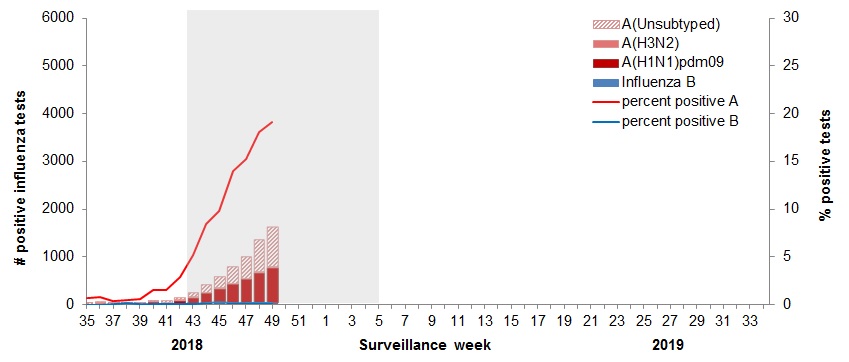
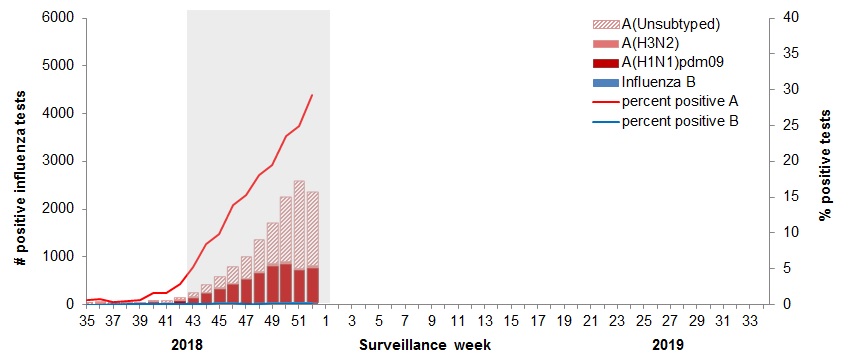
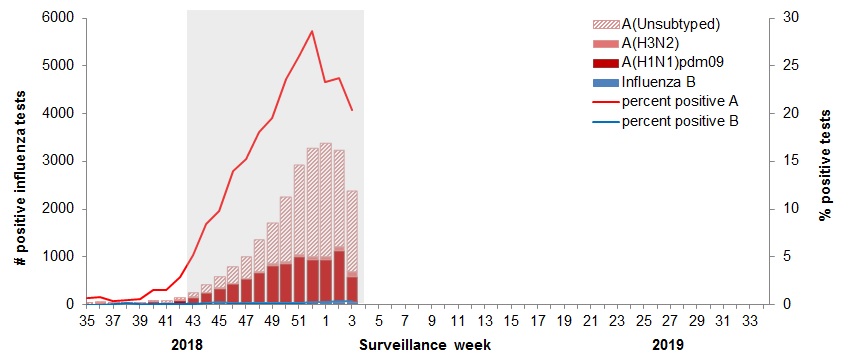
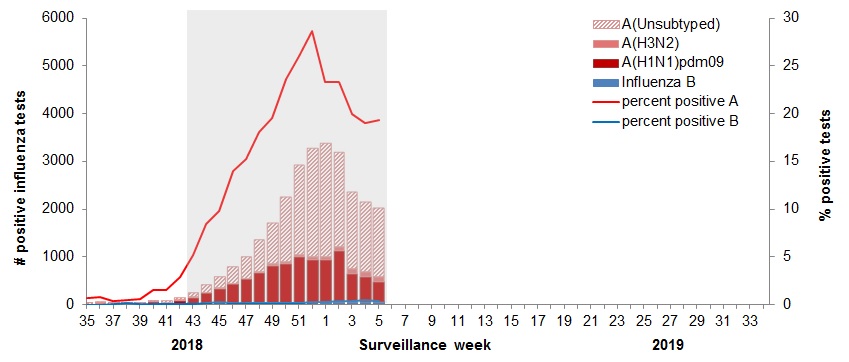
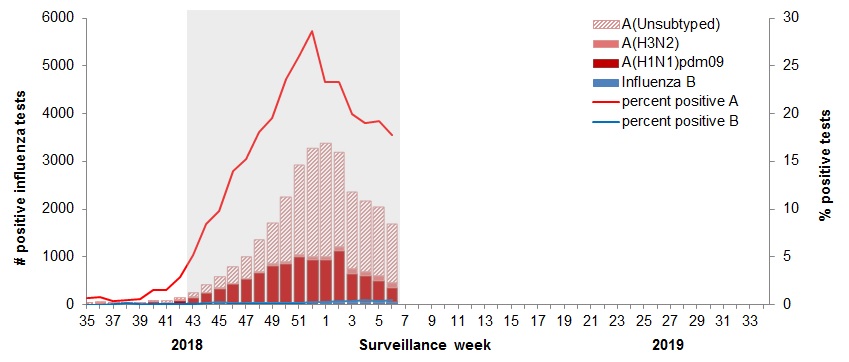
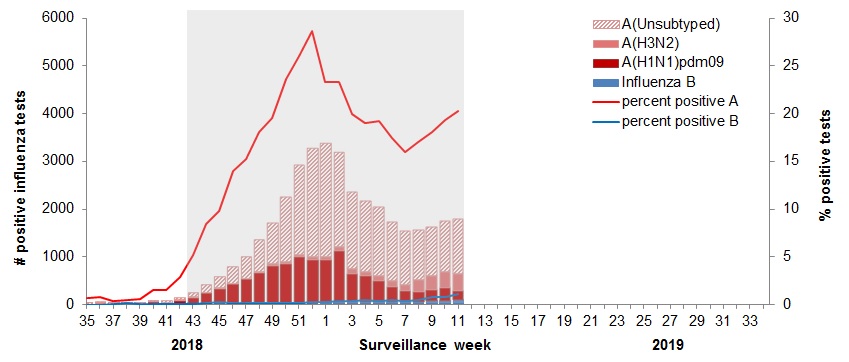
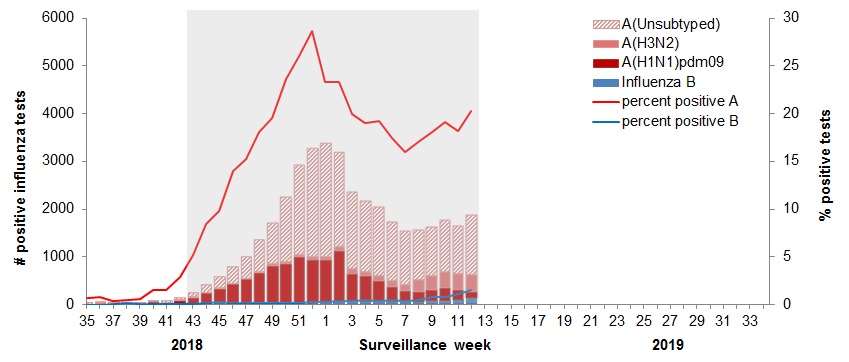
The percentage of tests positive for influenza continued to increase to 15.3% of tests positive.
The percentage of tests positive for influenza A is higher for this time of year compared to the same period during the previous eight seasons.
In week 47, 950 laboratory detections of influenza were reported, of which 99% were influenza A.
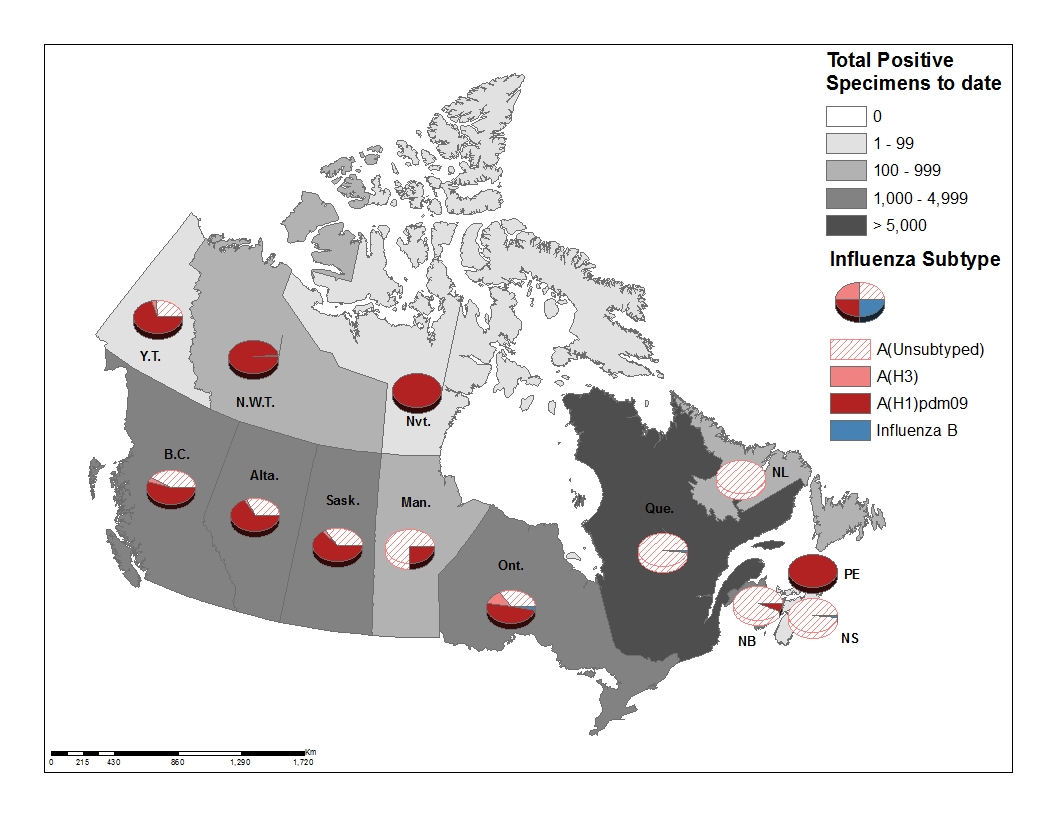
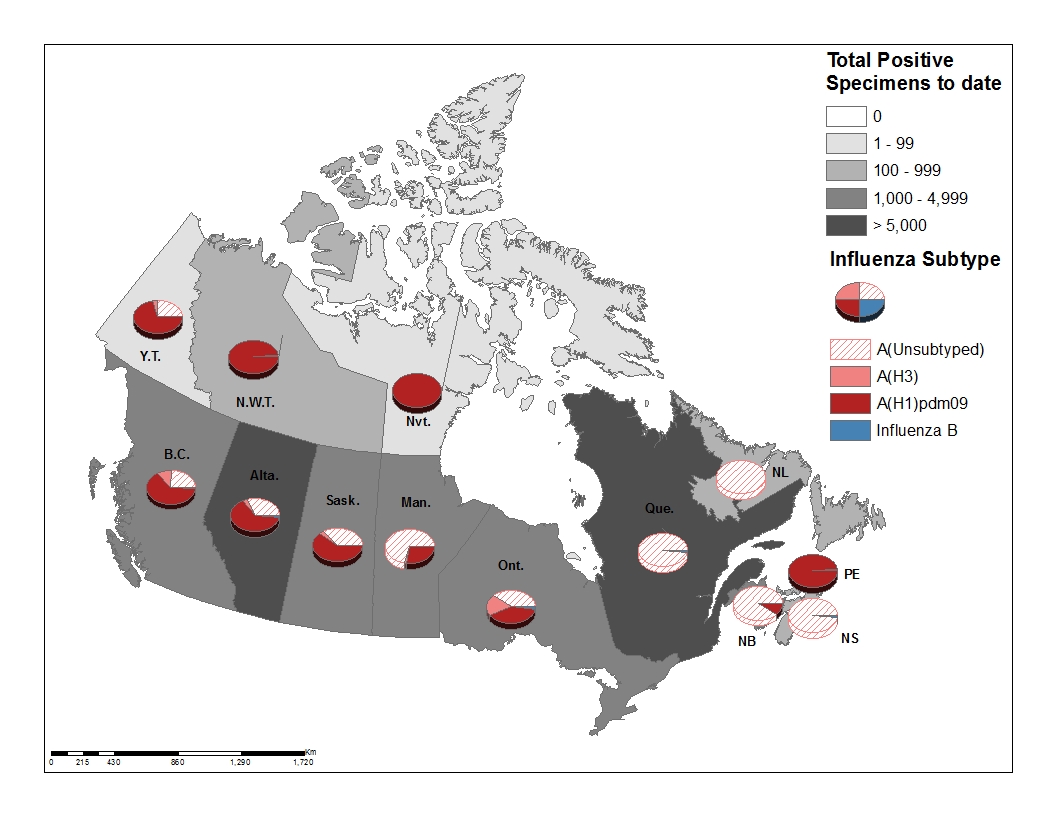
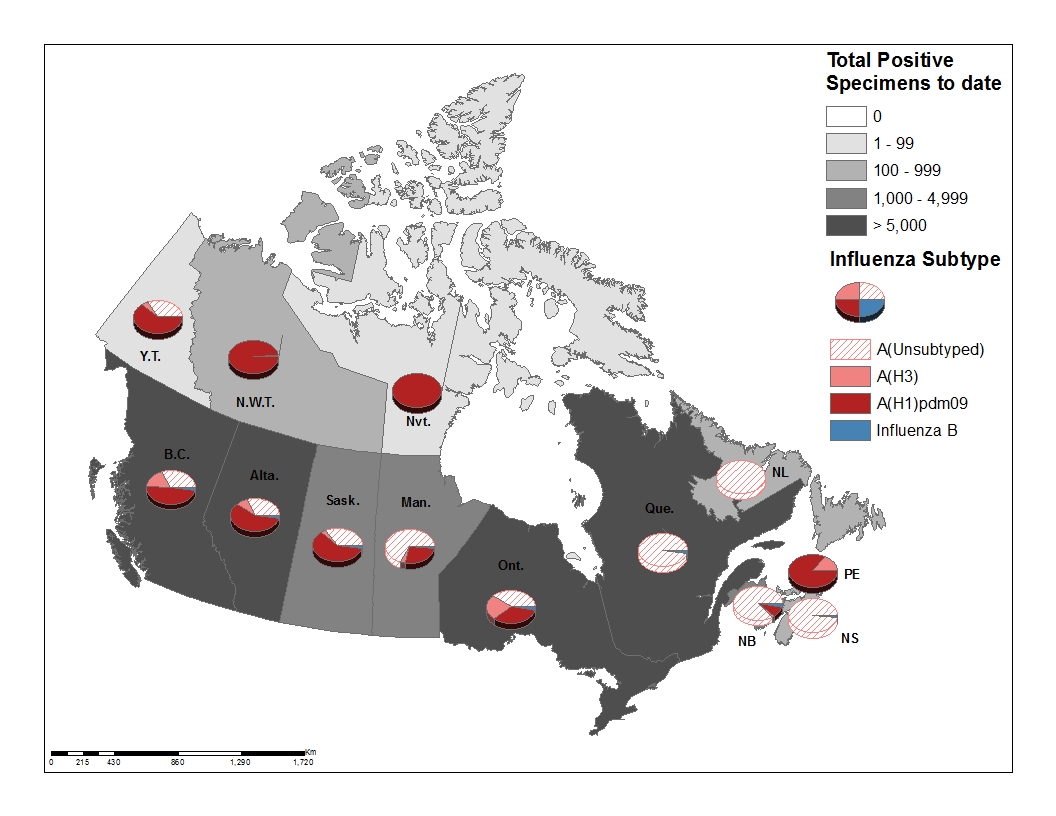
To date this season 3,176 laboratory-confirmed influenza detections have been reported (Figure 3):
92% have been influenza A.
Among the 1,760 influenza A viruses subtyped, 82% have been A(H1N1)pdm09.
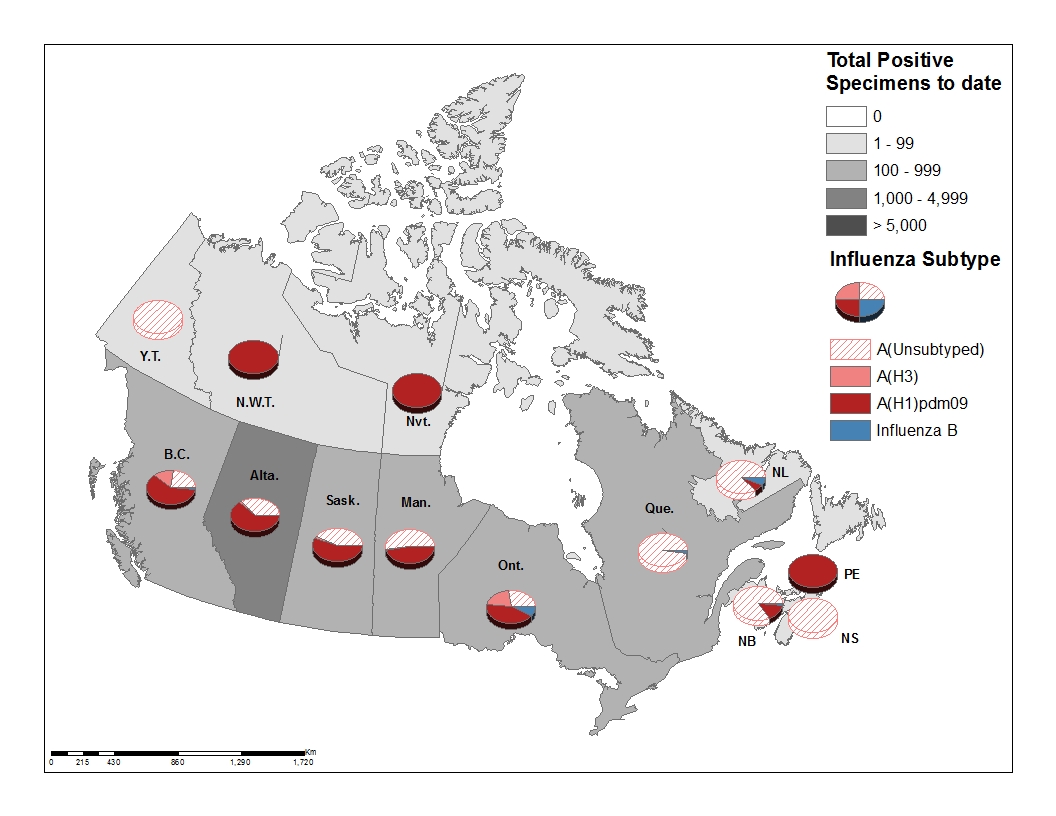
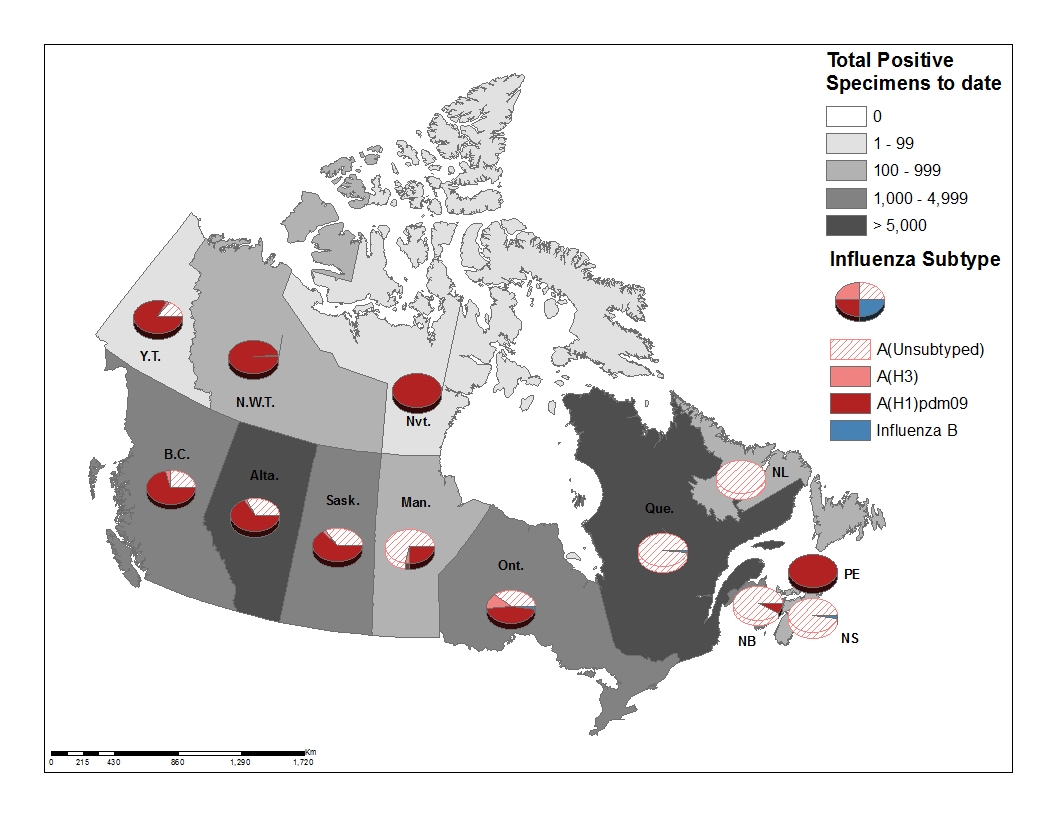
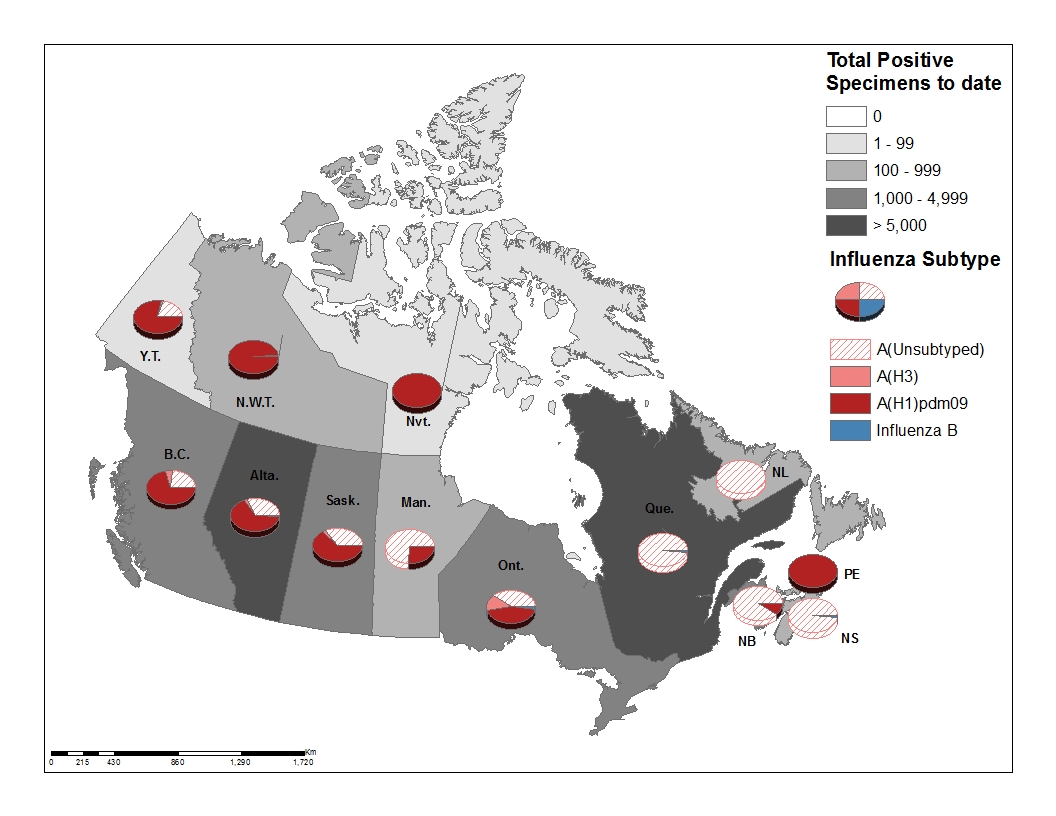
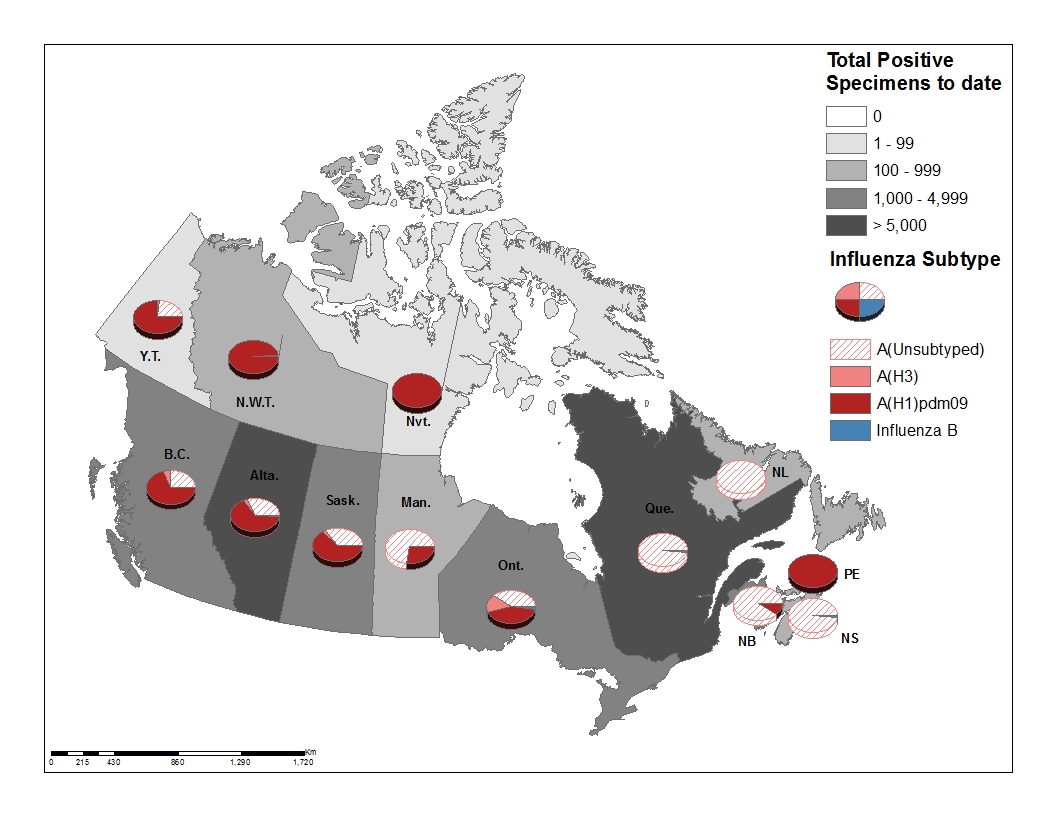
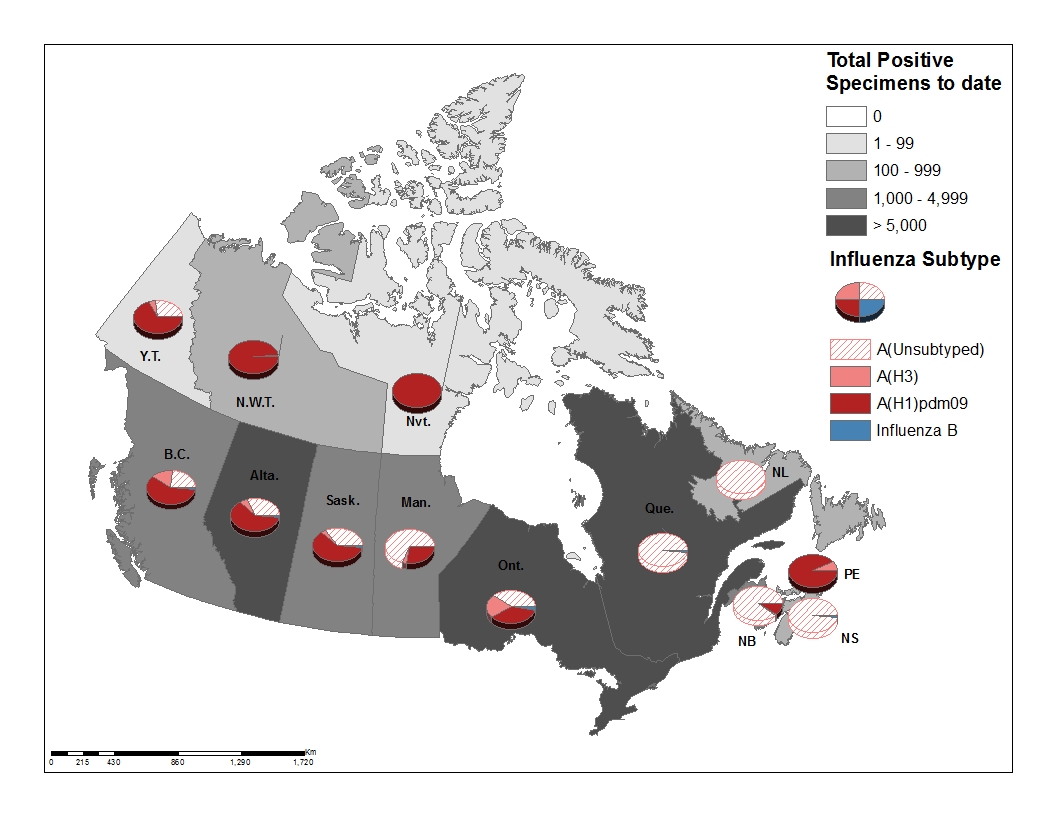
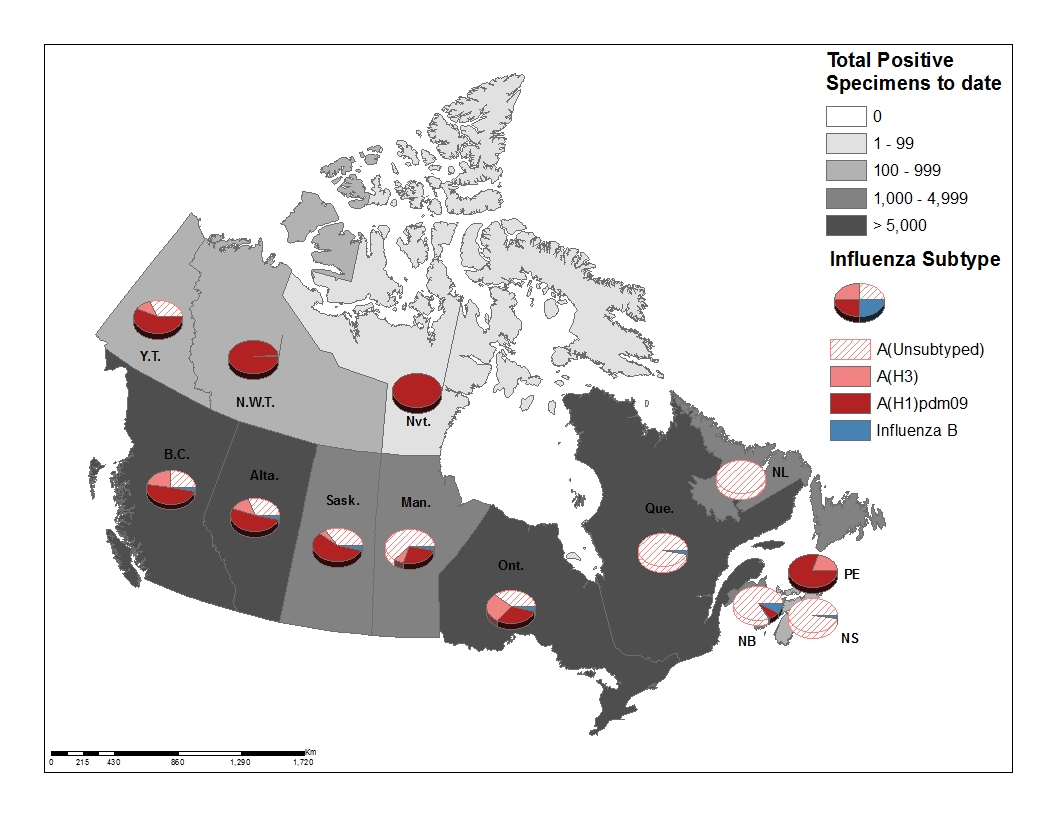
Provincial and territorial differences in influenza type/subtype distribution are observed (Figure 3).
To date this season, detailed information on age and type/subtype has been received for 3,155 laboratory-confirmed influenza cases (Table 1):
69% of all influenza A(H1N1)pdm09 detections have been reported in individuals younger than 45 years of age.
70% of all influenza A(H3N2) detections have been reported in adults 65 years of age and older.
For more detailed weekly and cumulative influenza data, see the text descriptions for Figures 2 and 3 or the Respiratory Virus Detections in Canada Report.
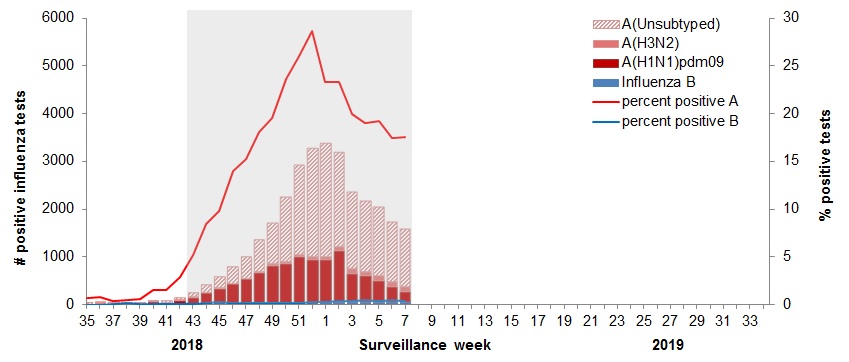
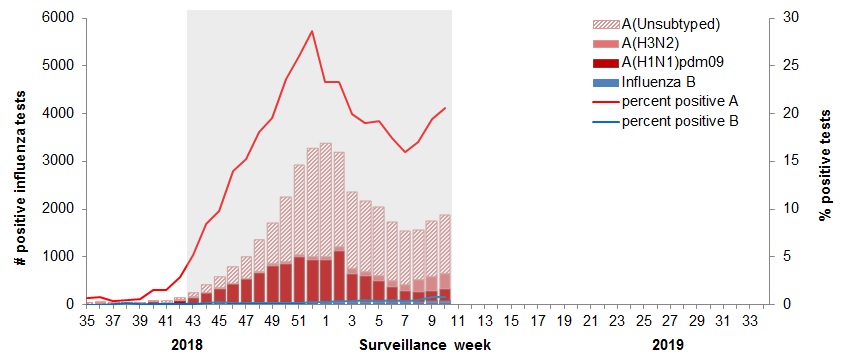
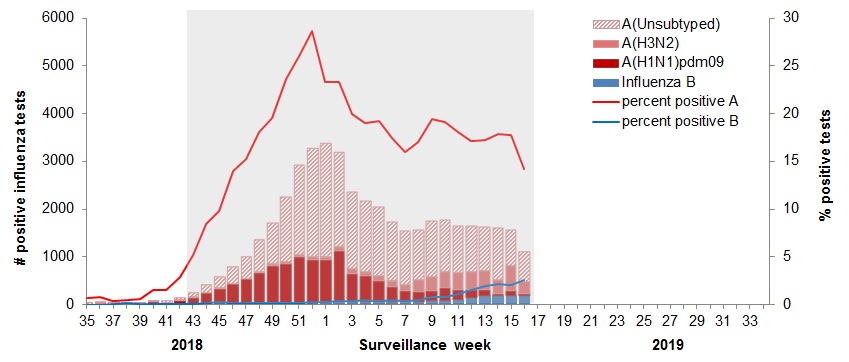
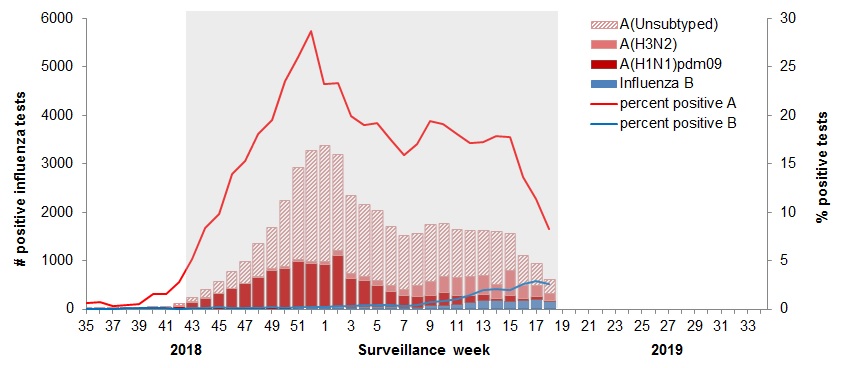
[h=3]Figure 2 ? Number of positive influenza tests and percentage of tests positive, by type, subtype and report week, Canada, weeks 2018-35 to 2018-47[/h]
The shaded area indicates weeks where the positivity rate was at least 5% and a minimum of 15 positive tests were observed, signalling the period of seasonal influenza activity.
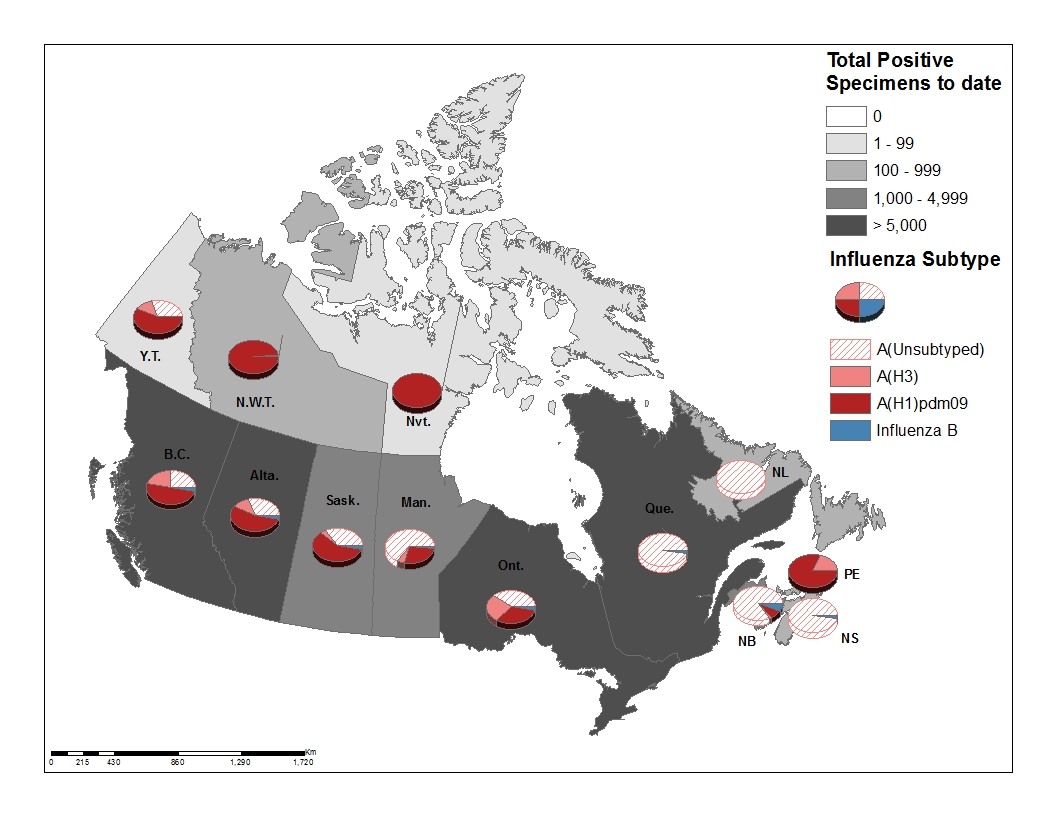
Figure 2 - Text description [h=3]Figure 3 ? Cumulative numbers of positive influenza specimens by type/subtype and province/territory, Canada, weeks 2018-35 to 2018-47[/h]
Figure 3 - Text description [TABLE="class: table table-striped table-bordered table-hover table-condensed, width: 1140"]
Table 1 ? Cumulative numbers of positive influenza specimens by type, subtype and age-group reported through case-based laboratory reporting, Canada, weeks 2018-35 to 2018-47 [TR="class: bg-primary, bgcolor: #2572B4"]
Age groups (years) Cumulative (August 26, 2018 to November 24, 2018) [/TR]
[TR="class: bg-primary, bgcolor: #2572B4"]
Influenza A B Influenza A and B [/TR]
[TR="class: bg-primary, bgcolor: #2572B4"]
A Total A(H1) pdm09 A(H3) A (UnS)Footnote1 Total # % [/TR]
[TR="bgcolor: #F5F5F5"]
[TD]0-4[/TD]
[TD]632[/TD]
[TD]377[/TD]
[TD]3[/TD]
[TD]252[/TD]
[TD]5[/TD]
[TD]637[/TD]
[TD]20%[/TD]
[/TR]
[TR]
[TD]5-19[/TD]
[TD]650[/TD]
[TD]334[/TD]
[TD]5[/TD]
[TD]311[/TD]
[TD]11[/TD]
[TD]661[/TD]
[TD]21%[/TD]
[/TR]
[TR="bgcolor: #F5F5F5"]
[TD]20-44[/TD]
[TD]797[/TD]
[TD]399[/TD]
[TD]15[/TD]
[TD]383[/TD]
[TD]9[/TD]
[TD]806[/TD]
[TD]26%[/TD]
[/TR]
[TR]
[TD]45-64[/TD]
[TD]565[/TD]
[TD]285[/TD]
[TD]32[/TD]
[TD]248[/TD]
[TD]7[/TD]
[TD]572[/TD]
[TD]18[/TD]
[/TR]
[TR="bgcolor: #F5F5F5"]
[TD]65+[/TD]
[TD]465[/TD]
[TD]206[/TD]
[TD]131[/TD]
[TD]128[/TD]
[TD]14[/TD]
[TD]479[/TD]
[TD]15%[/TD]
[/TR]
[TR]
[TD]Total[/TD]
[TD]3109[/TD]
[TD]1601[/TD]
[TD]186[/TD]
[TD]1322[/TD]
[TD]46[/TD]
[TD]3155[/TD]
[TD]100%[/TD]
[/TR]
[TR]
[TD="colspan: 8"] Table 1 - Note 1 UnS: unsubtyped: The specimen was typed as influenza A, but no result for subtyping was available; Return to Table 1 - Note1
[/TD]
[/TR]
[/TABLE]
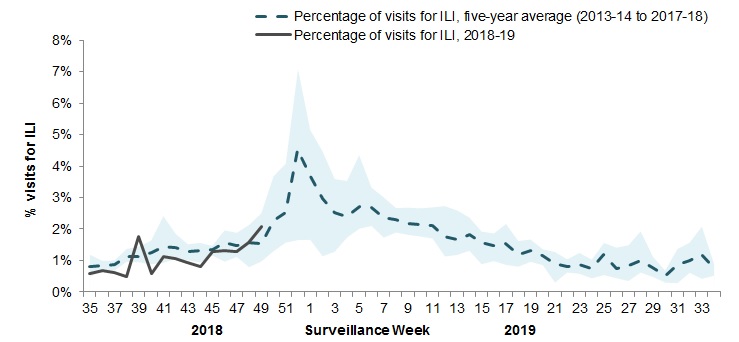
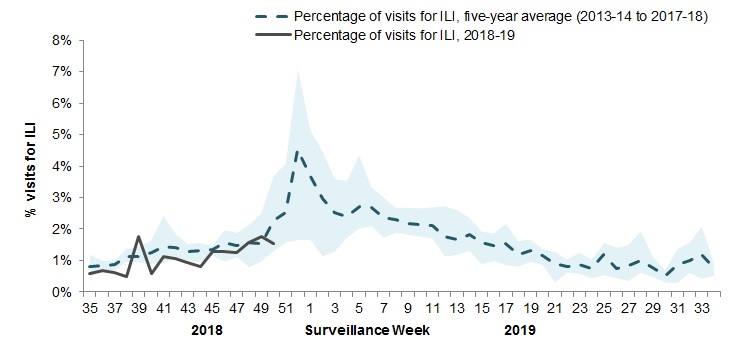
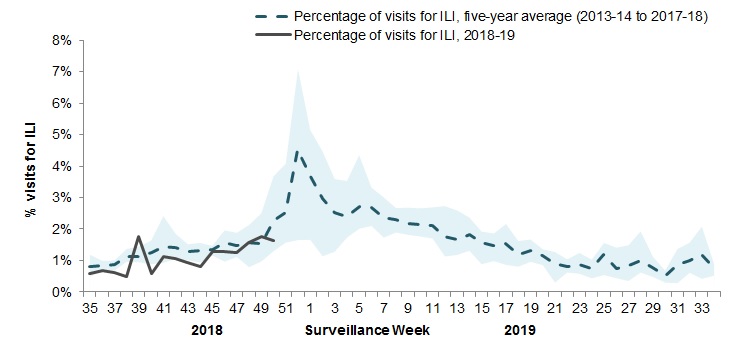
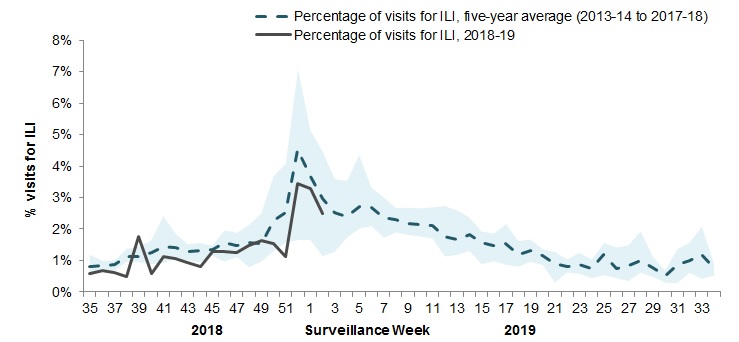
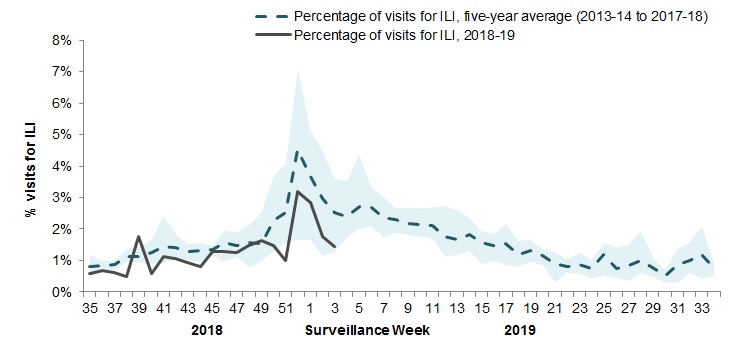
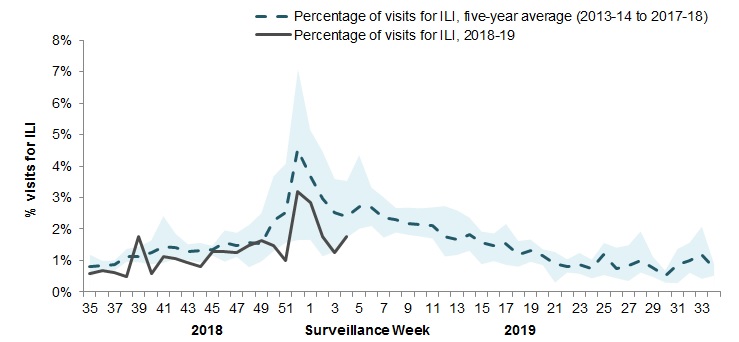
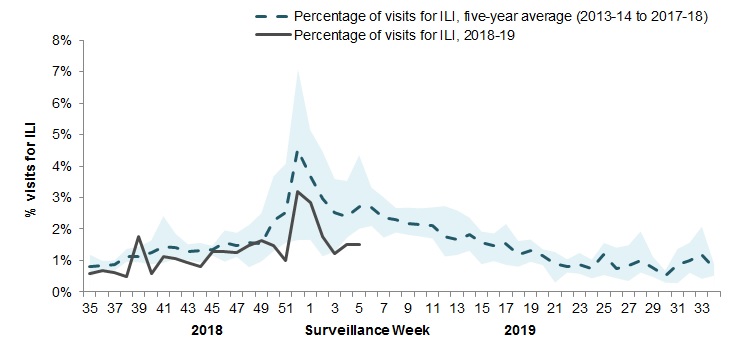
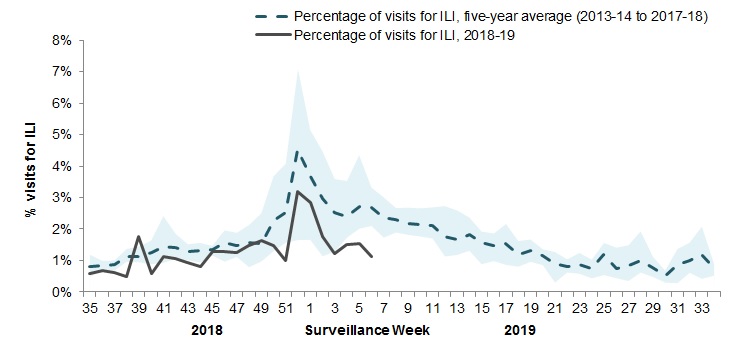
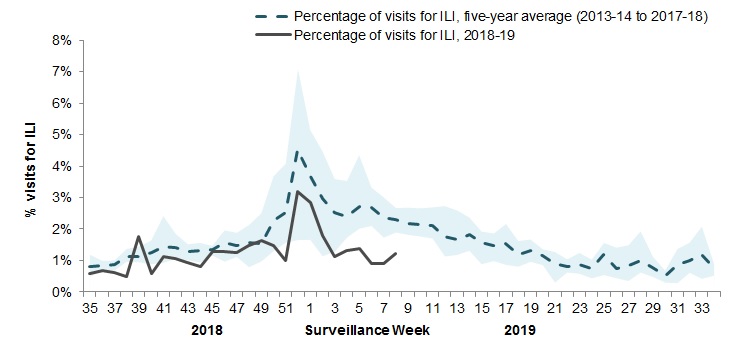
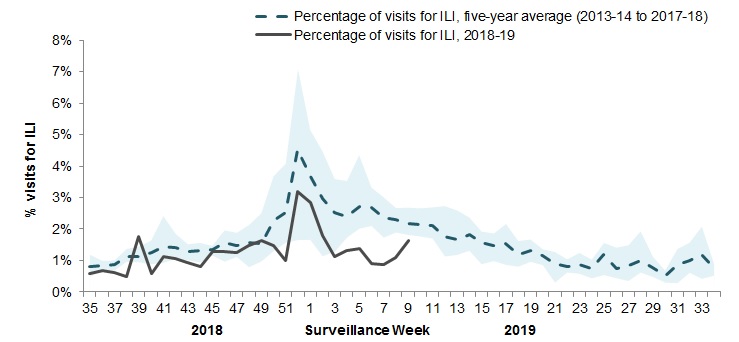
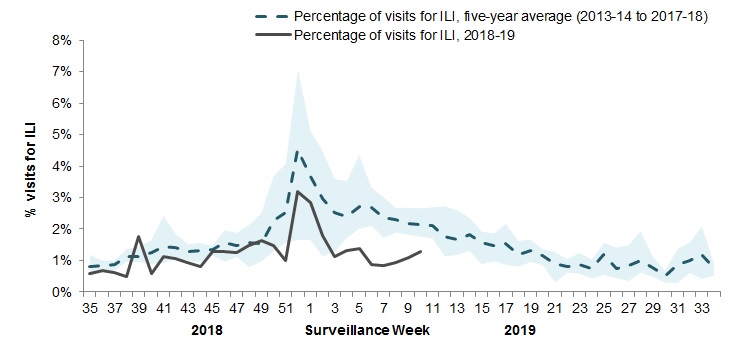
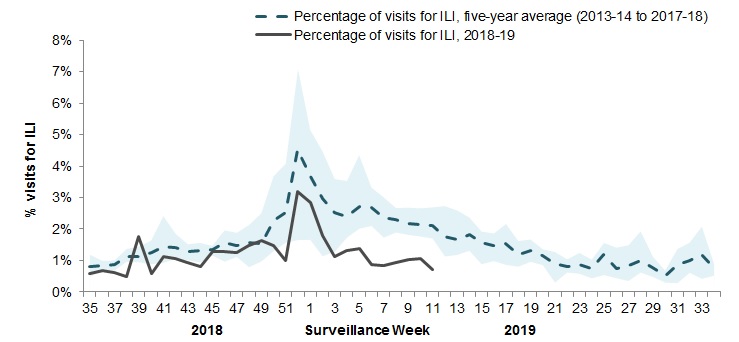
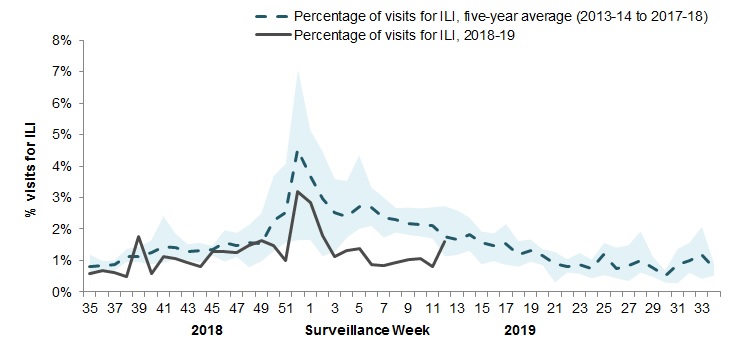
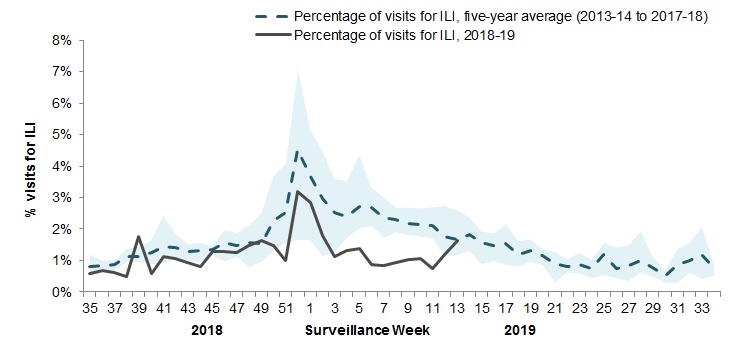
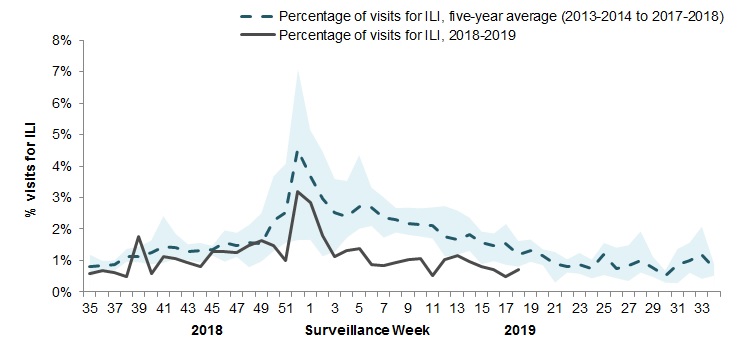
[h=2]Syndromic/Influenza-like Illness Surveillance[/h] [h=3]Healthcare Professionals Sentinel Syndromic Surveillance[/h] In week 47, 1.9% of visits to healthcare professionals were due to influenza-like illness (ILI) (Figure 4). The percentage of visits for ILI is within expected levels.
[h=3]Figure 4 ? Percentage of visits for ILI reported by sentinels by report week, Canada, weeks 2018-35 to 2018-47[/h] Number of Sentinels Reporting in Week 47: 84
The shaded area represents the maximum and minimum percentage of visits for ILI reported by week from seasons 2013-14 to 2017-18
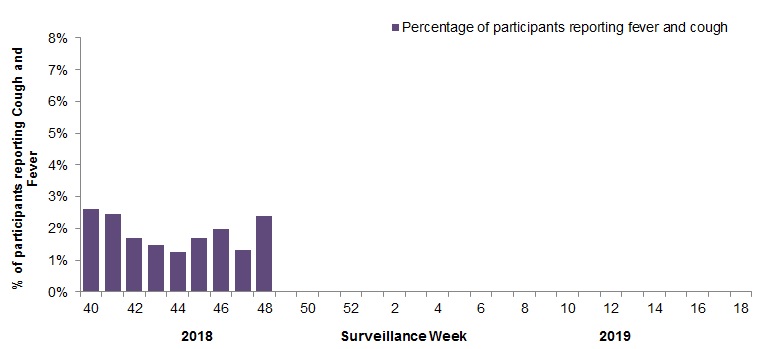
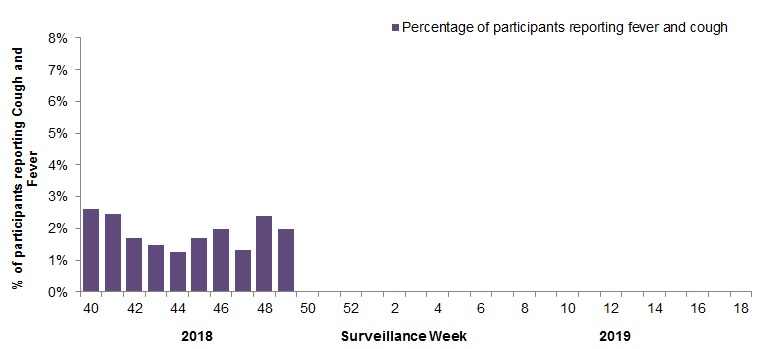
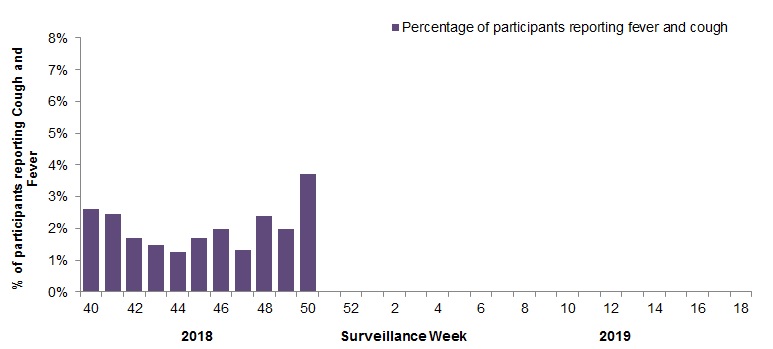
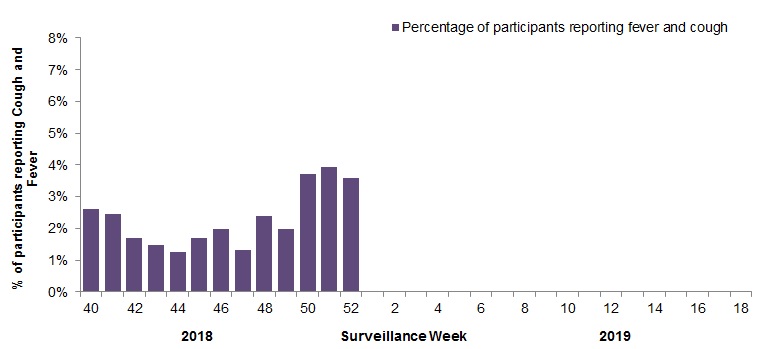
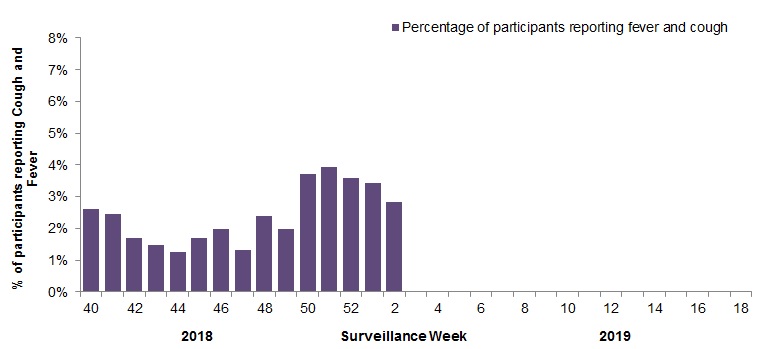
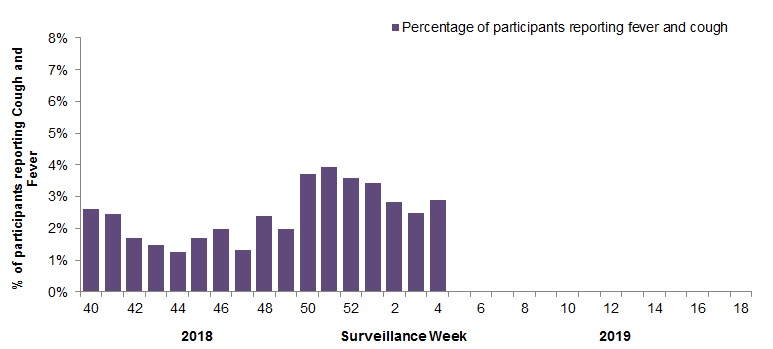
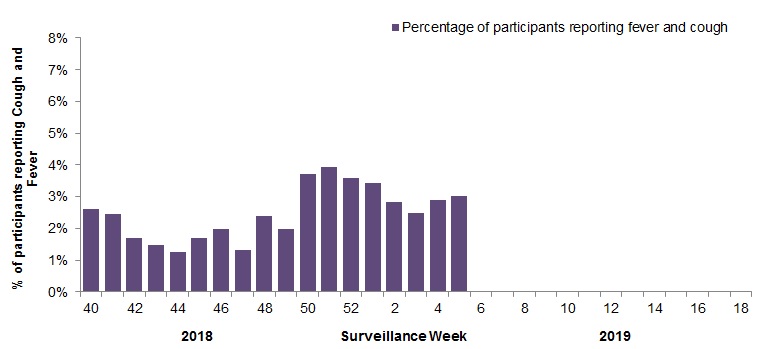
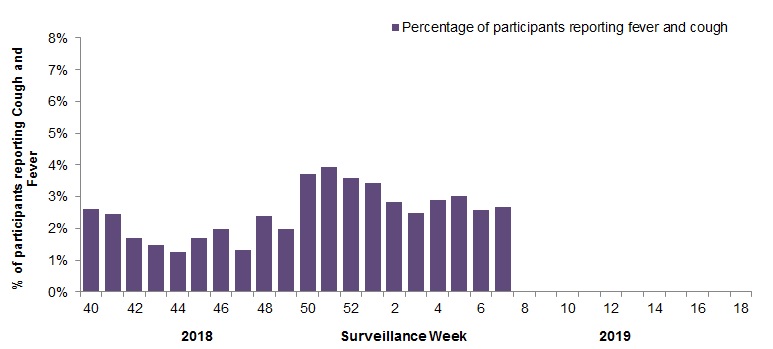
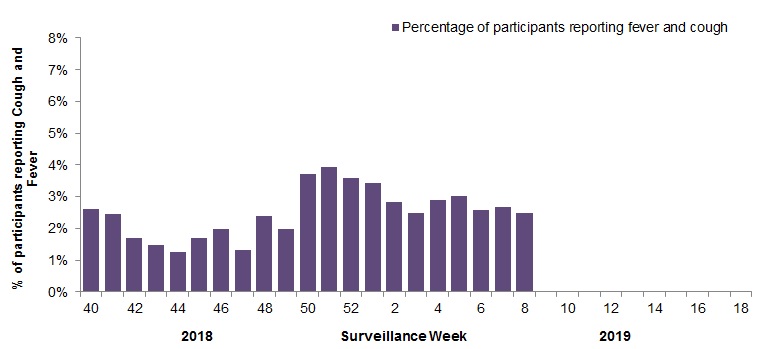
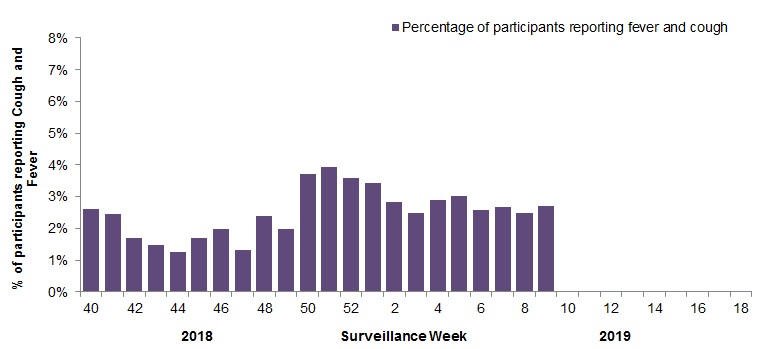
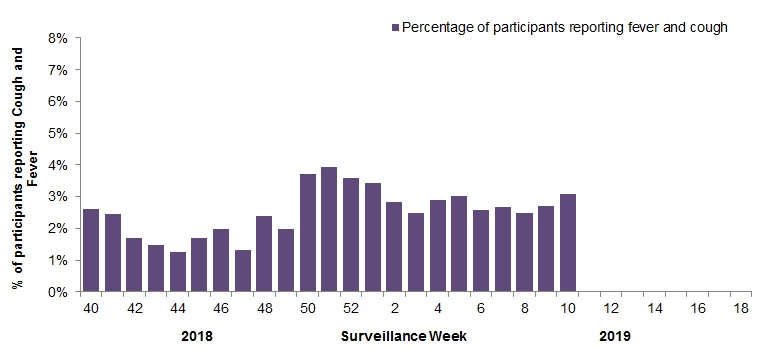
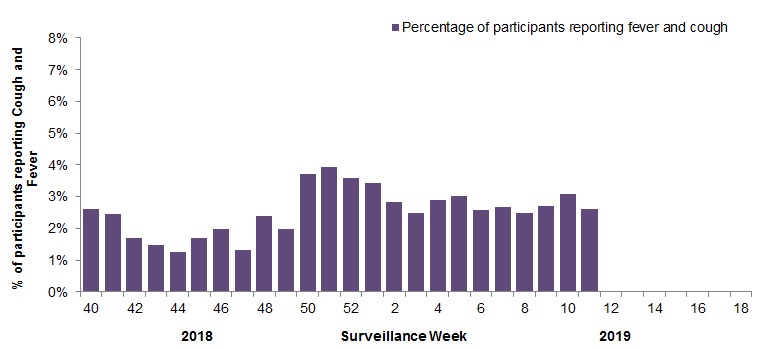
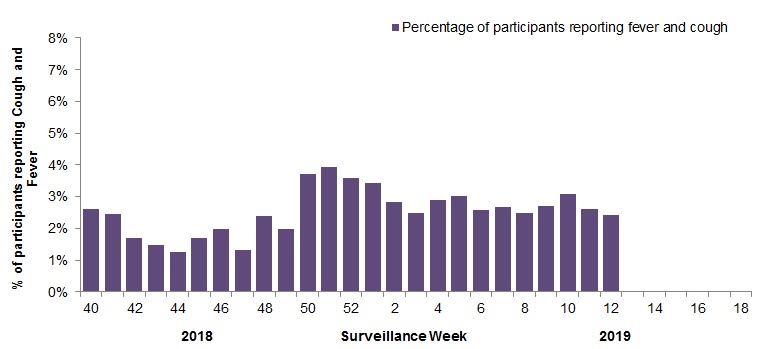
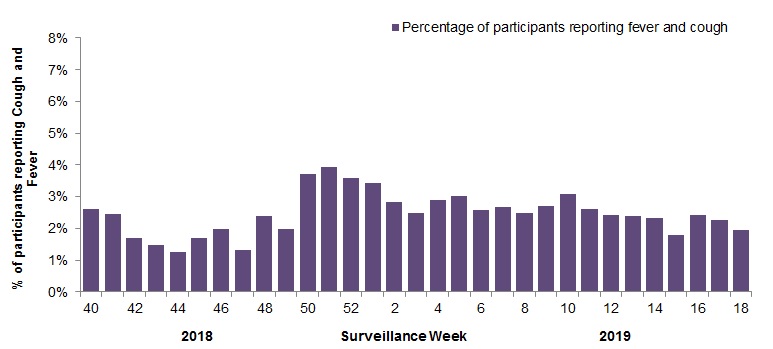
Figure 4 - Text description [h=2]Participatory Syndromic Surveillance[/h] In week 47, 2,182 participants reported to FluWatchers, of which 29 (1.3%) reported symptoms of cough and fever (Figure 5).
Among the 29 participants who reported fever and cough:
28% consulted a healthcare professional;
83% reported days missed from work or school, resulting in a combined total of 66 missed days of work or school.
[h=3]Figure 5 ? Percentage of participants reporting cough and fever, Canada, weeks 2018-40 to 2018-47[/h] Number of Participants Reporting in Week 47: 2,182
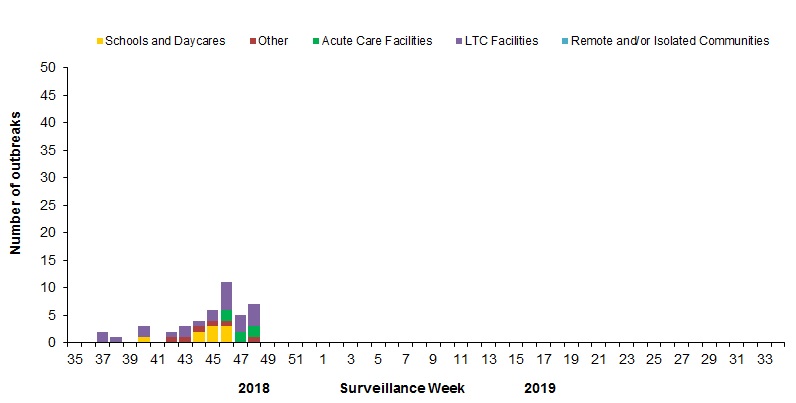
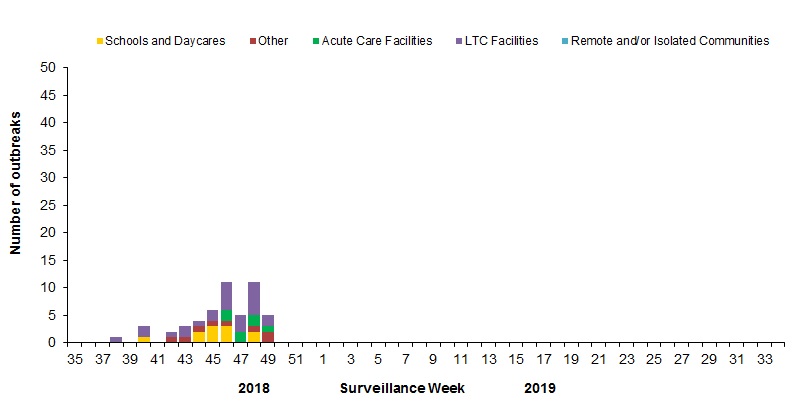
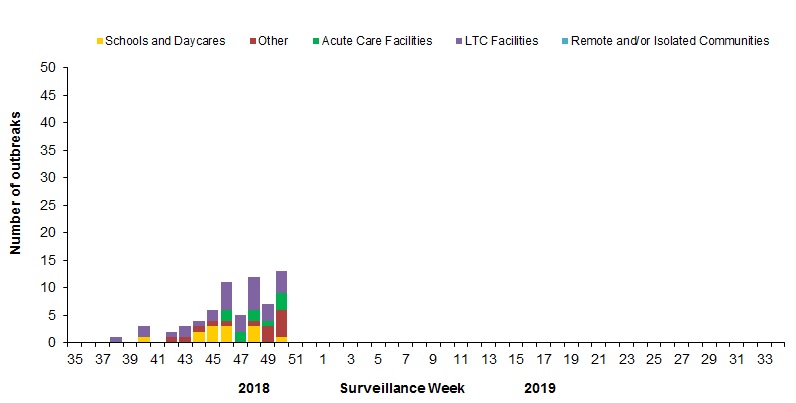
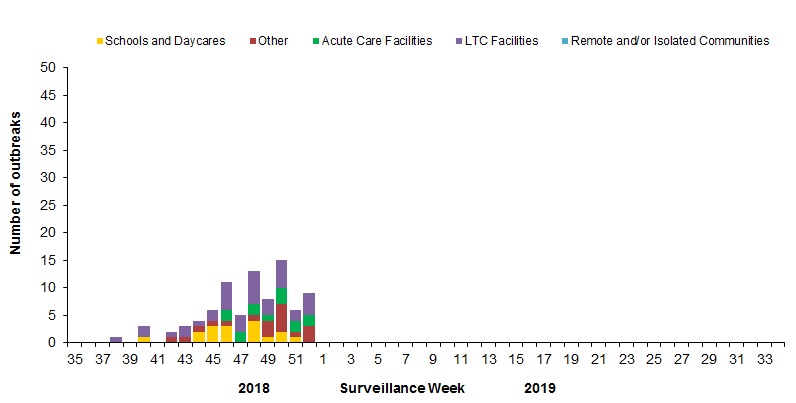
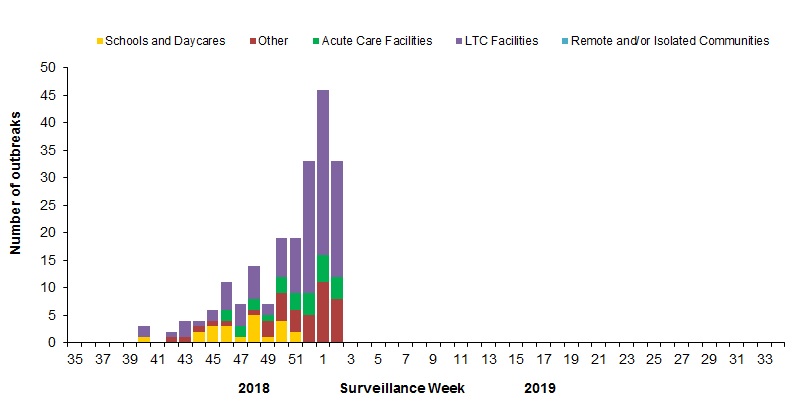
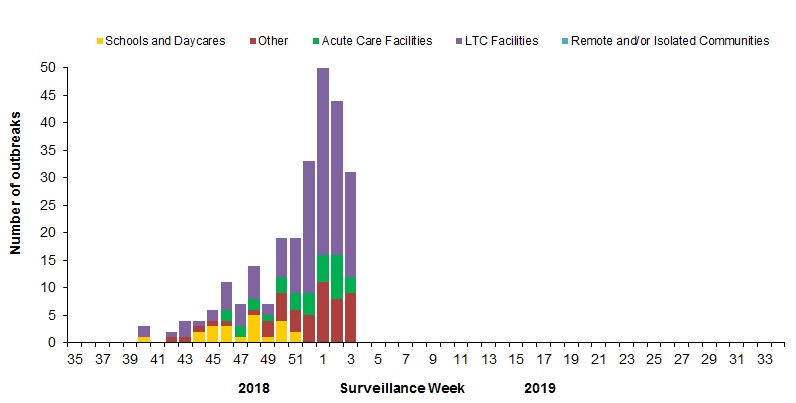
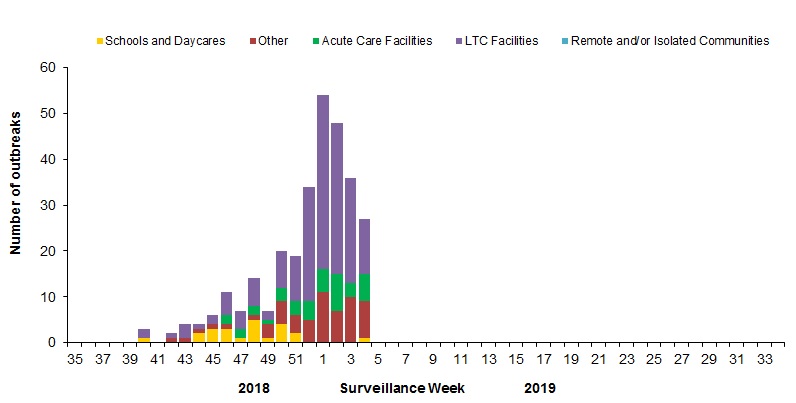
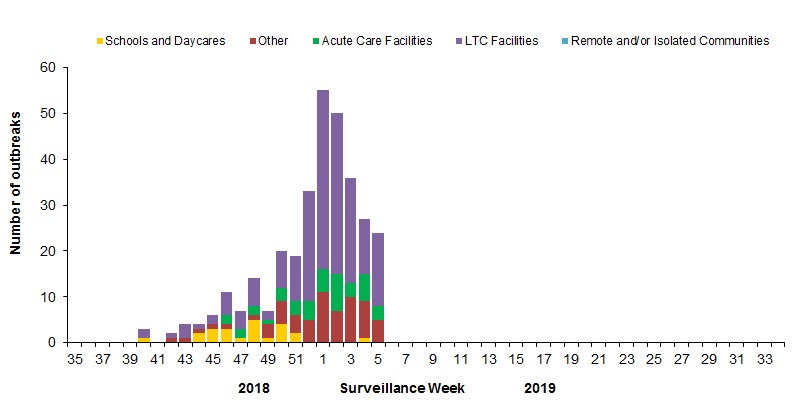
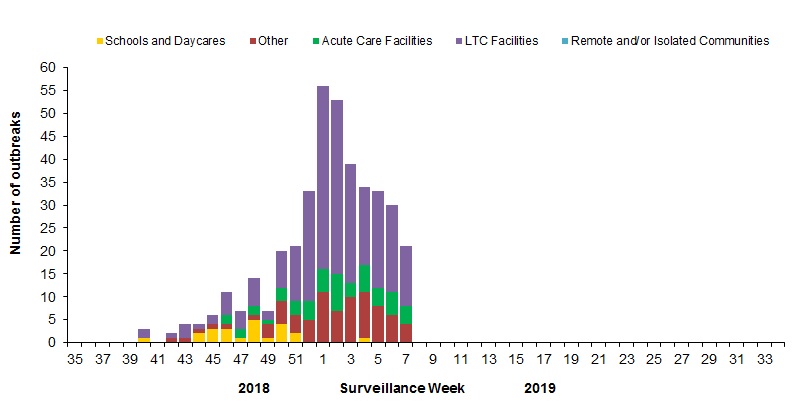
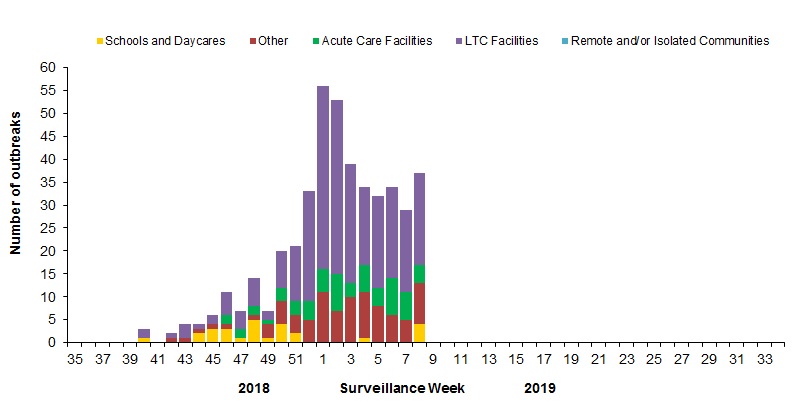
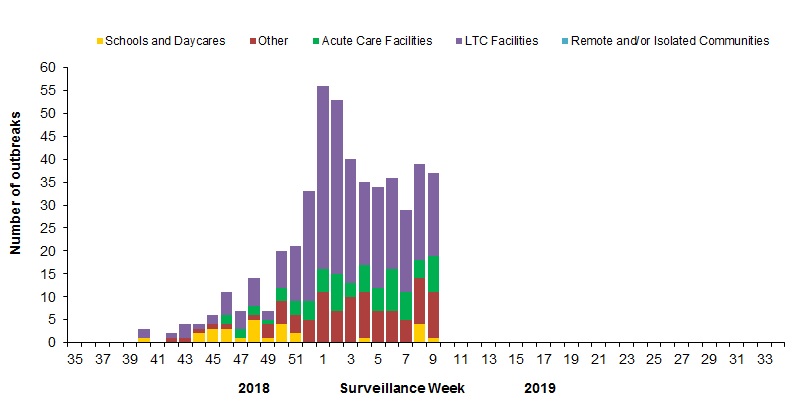
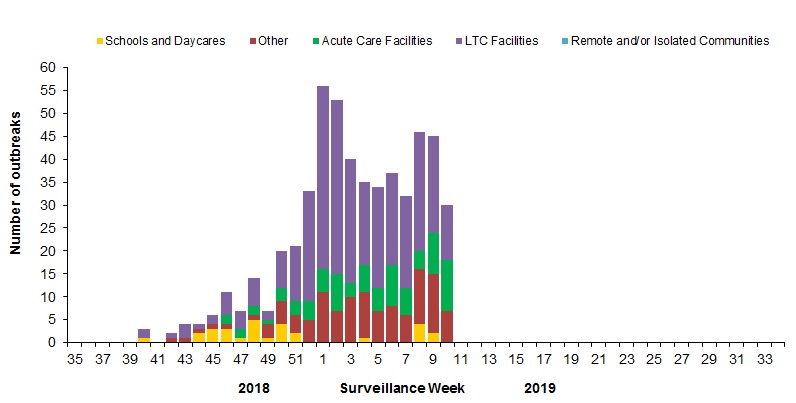
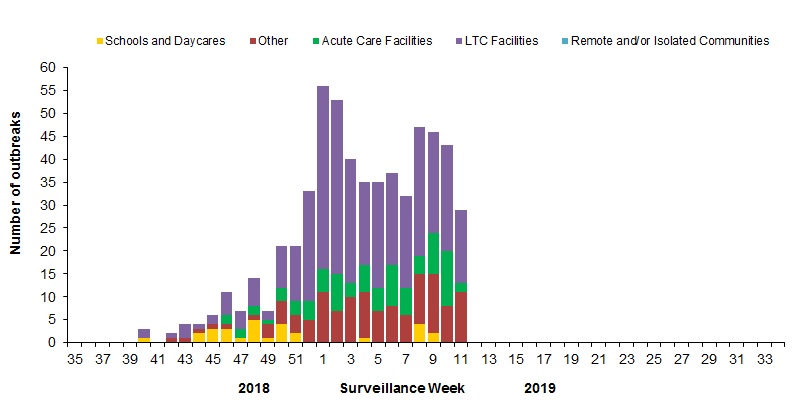
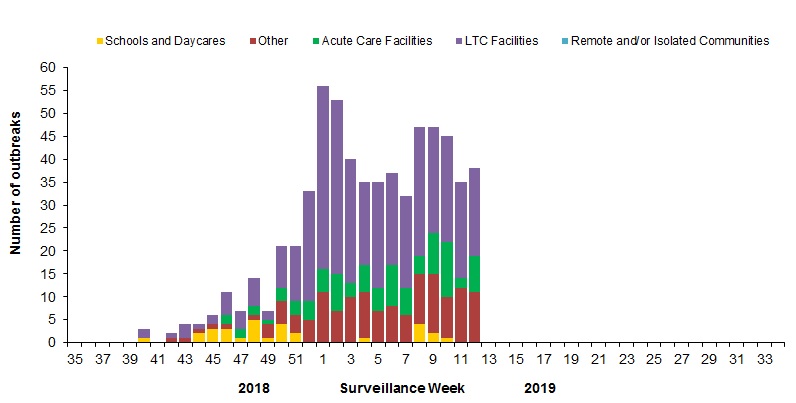
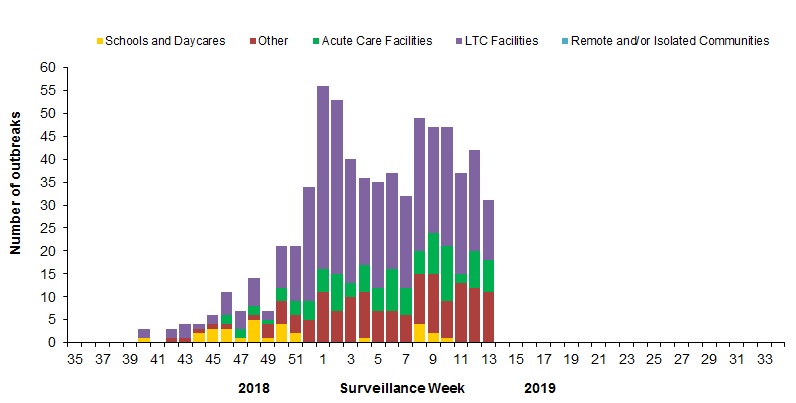
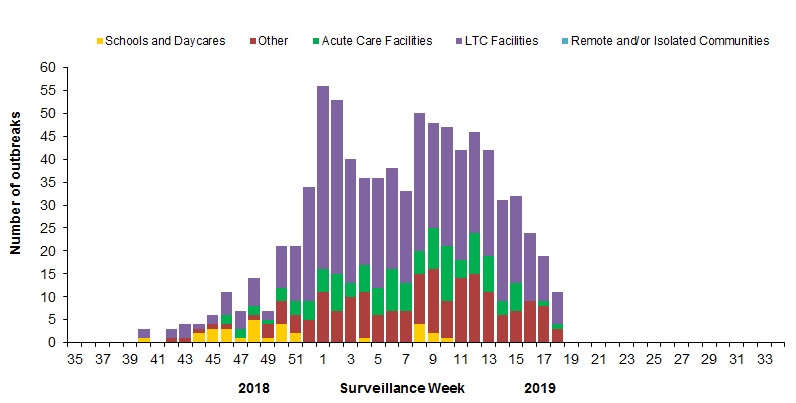
Figure 5 - Text description [h=2]Influenza Outbreak Surveillance[/h] In week 47, five new laboratory-confirmed influenza outbreaks were reported in long-term care (3) and acute care (2) facilities.
To date this season, 36 laboratory-confirmed influenza outbreaks have been reported (Figure 6):
19 outbreaks were in LTCF, eight were in schools, and five were in other settings.
All of the 30 outbreaks for which the influenza type was available were associated with influenza A.
Among the 21 outbreaks for which the influenza A subtype was available:
17 were associated with influenza A(H1N1)pdm09;
Four were associated with A(H3N2);
One new ILI outbreak in a LTCF was reported in week 47.
To date this season, 25 ILI outbreaks have been reported; 23 occurred in LTCF, one in a school, and one in an acute care facility.
[h=3]Figure 6 ? Number of new outbreaks of laboratory-confirmed influenza by report week, Canada, weeks 2018-35 to 2018-47[/h]
Figure 6 - Text description [h=2]Severe Outcomes Influenza Surveillance[/h] [h=3]Provincial/Territorial Influenza Hospitalizations and Deaths[/h] To date this season, more than 471 influenza-associated hospitalizations have been reported by participating provinces and territoriesFootnote1. Hospitalizations (Table 2):
99% (471) were associated with influenza A
The highest estimated rates of hospitalization are among children under 5 years of age.
Intensive Care Unit (ICU) cases and deaths:
To date this season 49 ICU admissions and nine deaths have been reported.
Footnote 1 Influenza-associated hospitalizations are reported by Alberta, Manitoba, New Brunswick, Newfoundland and Labrador, Northwest Territories, Nova Scotia, Prince Edward Island and Yukon. Only hospitalizations that require intensive medical care are reported by Saskatchewan. The cumulative rate of hospitalizations is calculated using the total population by age-group in participating provinces and territories. Return to footnote1referrer
[TABLE="class: table table-striped table-bordered table-hover table-condensed, width: 1140"]
Table 2 ? Cumulative number and estimated rate of hospitalizations by age-group reported by participating provinces and territoriesFootnote1, Canada, weeks 2018-35 to 2018-47 [TR="class: bg-primary, bgcolor: #2572B4"]
Age Groups Cumulative (August 26, 2018 to November 24, 2018) [/TR]
[TR="class: bg-primary, bgcolor: #2572B4"]
Influenza A Influenza B Rate per 100,000 population [/TR]
[TR="bgcolor: #F5F5F5"]
[TD]0-4[/TD]
[TD]95[/TD]
[TD]0[/TD]
[TD]7.77[/TD]
[/TR]
[TR]
[TD]5-19[/TD]
[TD]64[/TD]
[TD]0[/TD]
[TD]2.31[/TD]
[/TR]
[TR="bgcolor: #F5F5F5"]
[TD]20-44[/TD]
[TD]72[/TD]
[TD]0[/TD]
[TD]1.20[/TD]
[/TR]
[TR]
[TD]45-64[/TD]
[TD]115[/TD]
[TD]0[/TD]
[TD]2.39[/TD]
[/TR]
[TR="bgcolor: #F5F5F5"]
[TD]65+[/TD]
[TD]125[/TD]
[TD]<5[/TD]
[TD]5.18[/TD]
[/TR]
[TR]
[TD]Total[/TD]
[TD]471[/TD]
[TD]<5[/TD]
[TD] [/TD]
[/TR]
[TR="bgcolor: #F5F5F5"]
[TD]%[/TD]
[TD]99%[/TD]
[TD]1%[/TD]
[TD] [/TD]
[/TR]
[TR]
[TD="colspan: 6"] Table 2 - Footnote 1 Influenza-associated hospitalizations are reported by Alberta, Manitoba, New Brunswick, Newfoundland and Labrador, Northwest Territories, Nova Scotia, Prince Edward Island and Yukon. Only hospitalizations that require intensive medical care are reported by Saskatchewan. The cumulative rate of hospitalizations is calculated using the total population by age-group in participating provinces and territories. Return to Table 2 - Footnote1referrer
[/TD]
[/TR]
[/TABLE]
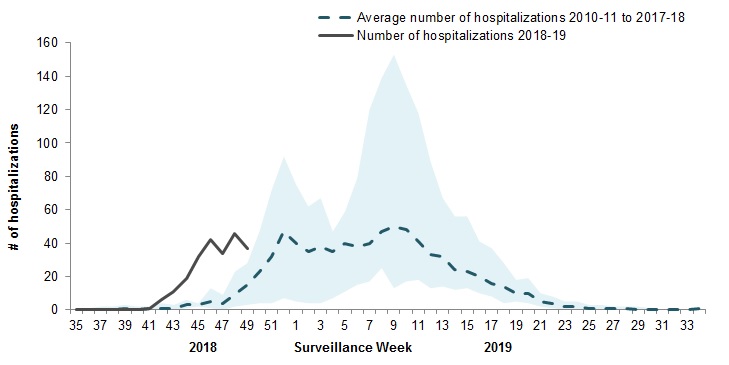
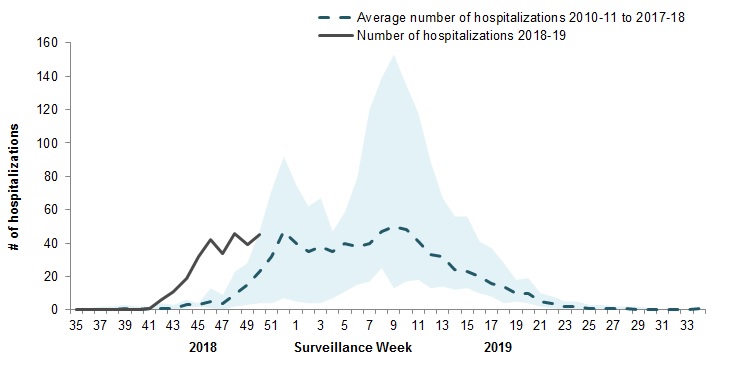
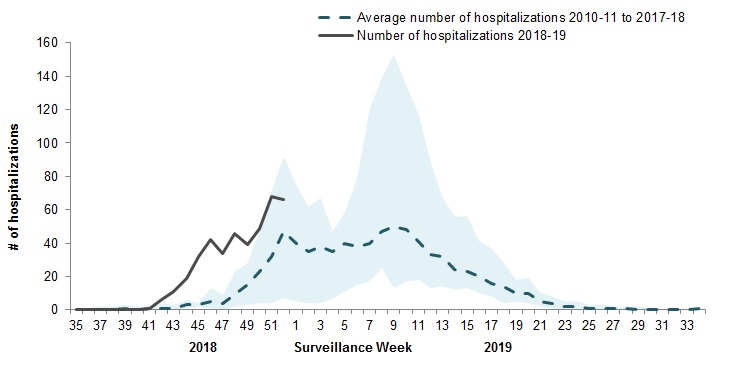
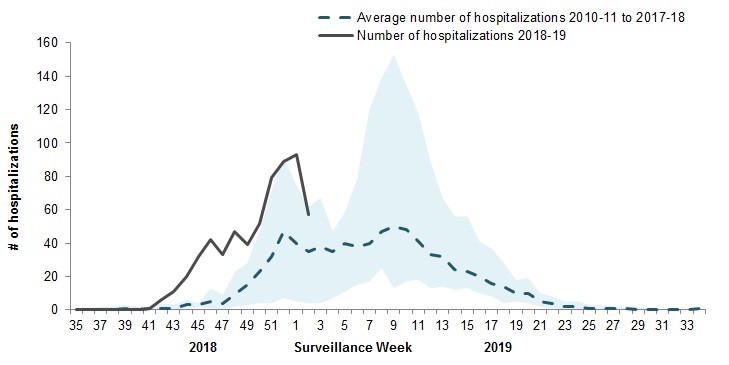
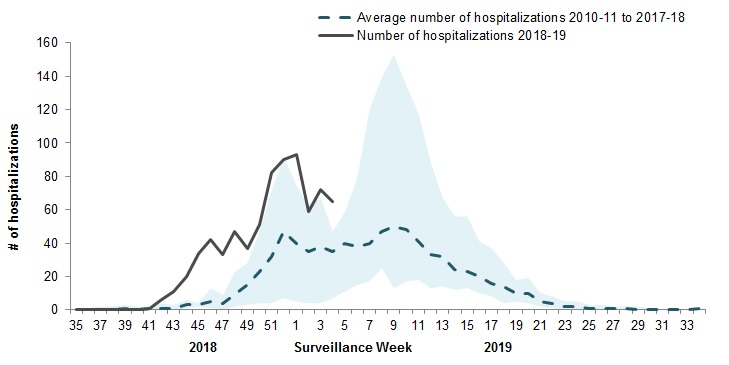
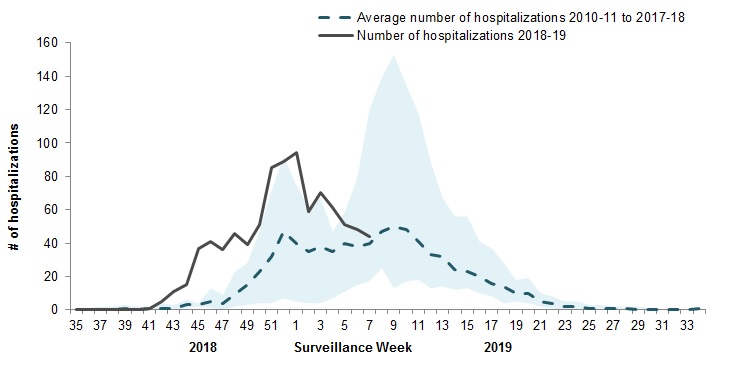
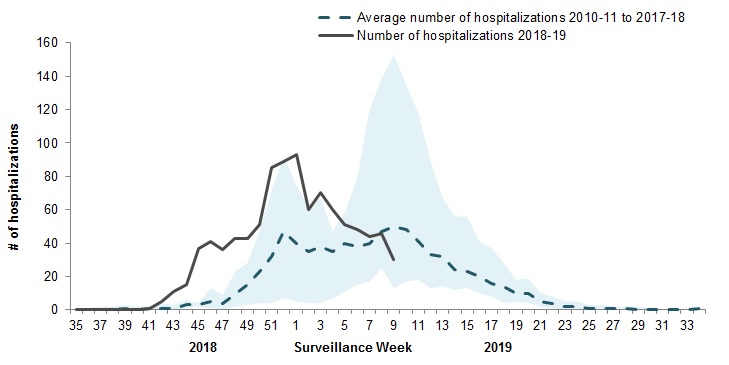
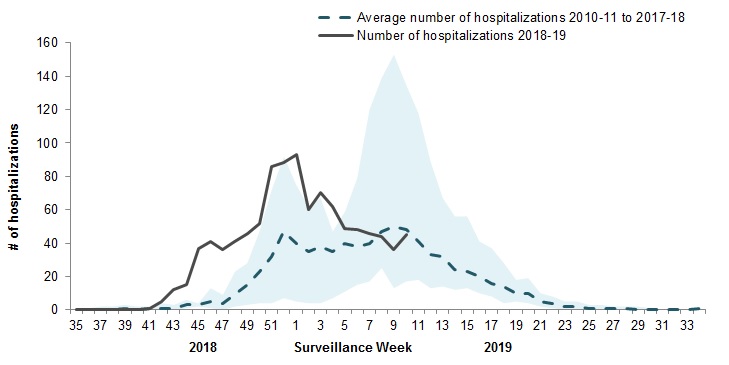
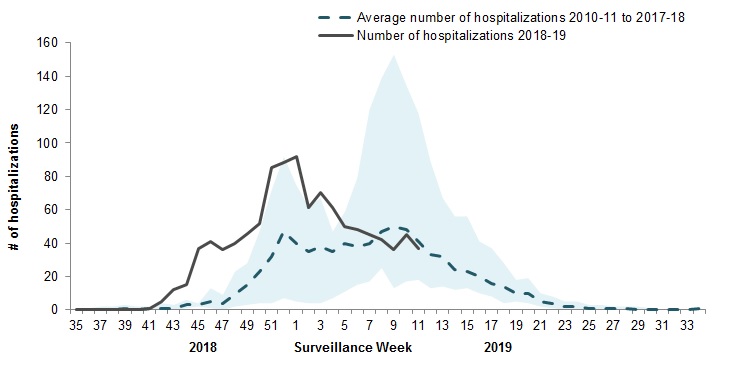
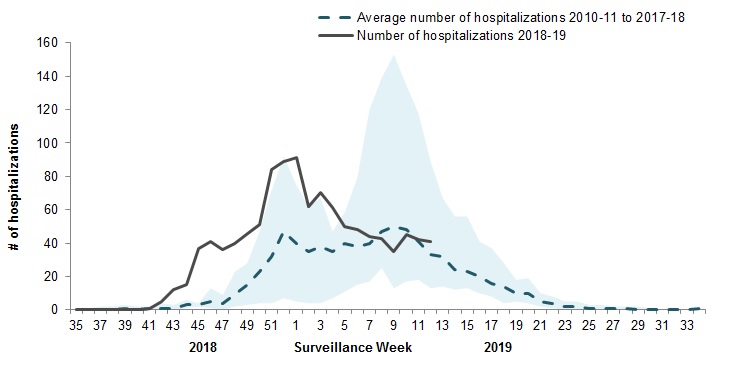
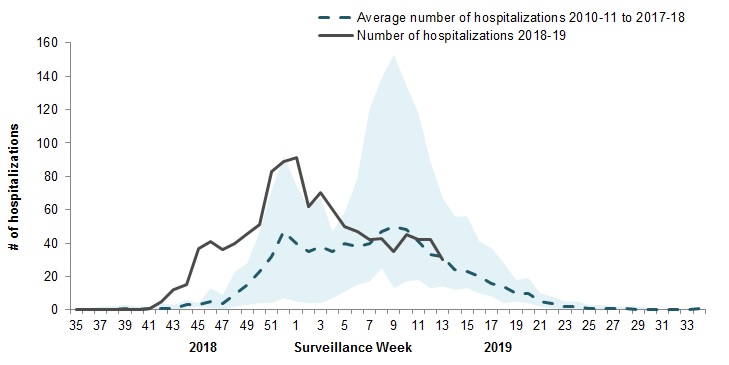
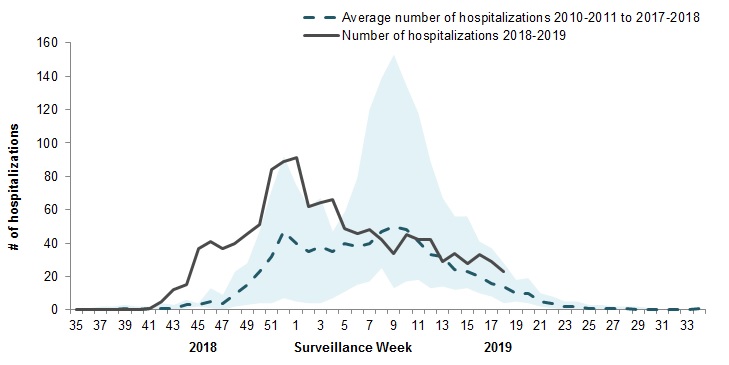
[h=3]Pediatric Influenza Hospitalizations and Deaths[/h] In week 47, 34 pediatric (≤16 years of age) hospitalizations with influenza have been reported by the Immunization Monitoring Program Active (IMPACT) network. Pediatric hospitalizations reported by IMPACT are at levels not normally seen until late December (4-6 weeks earlier than in recent seasons) (Figure 7).
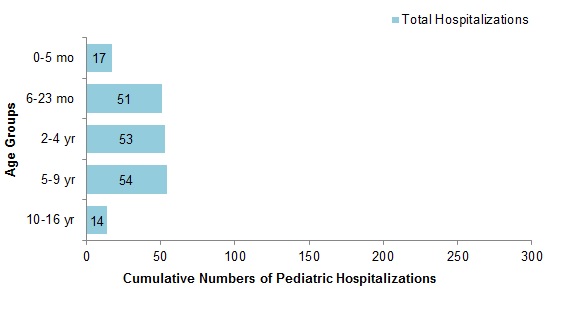
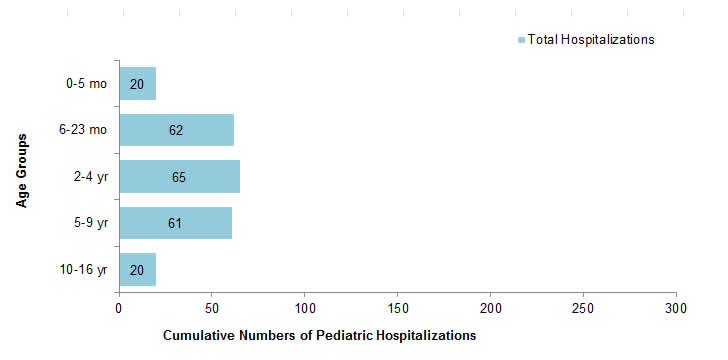
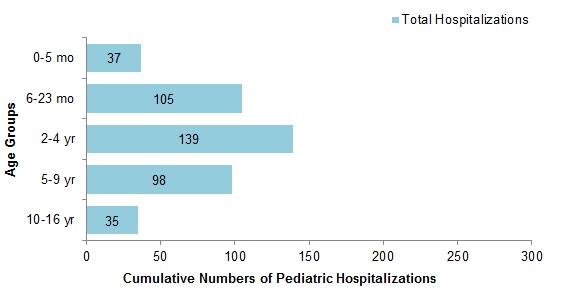
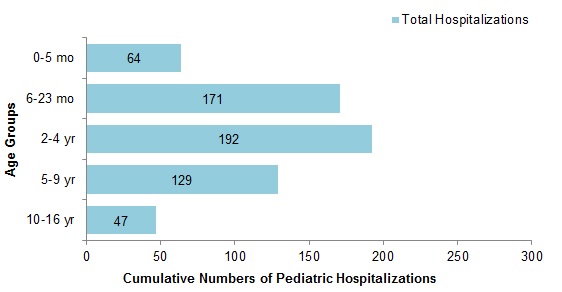
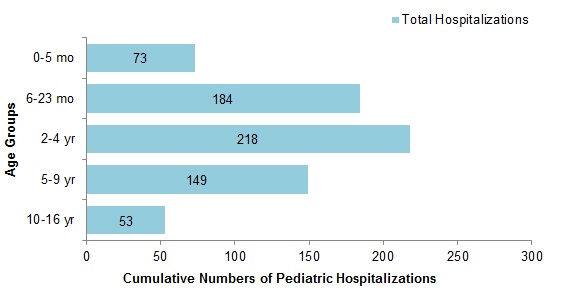
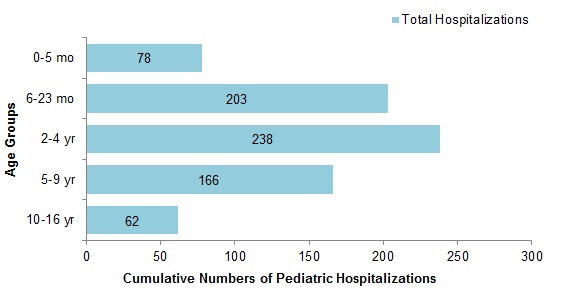
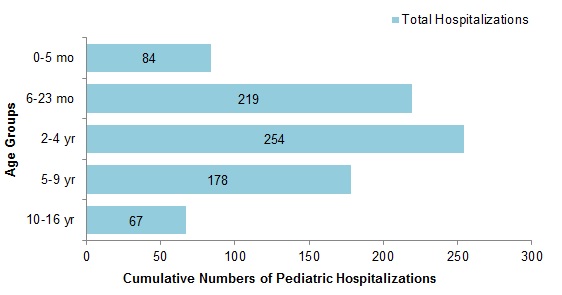
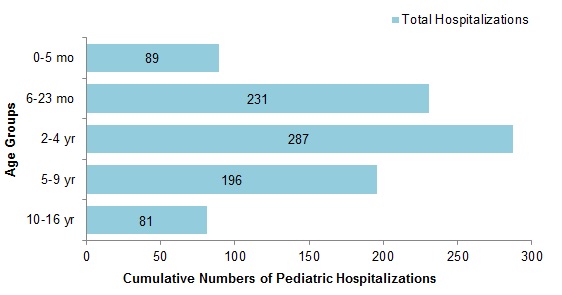
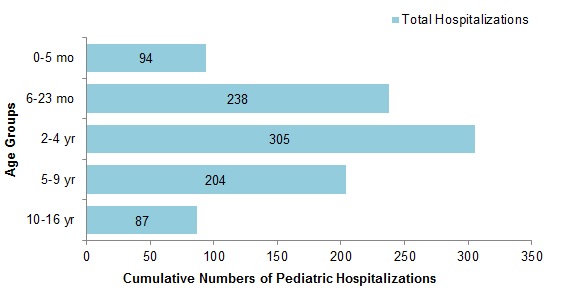
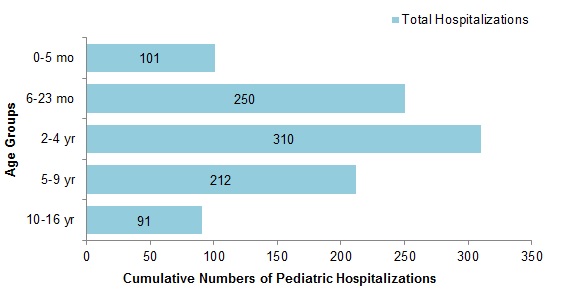
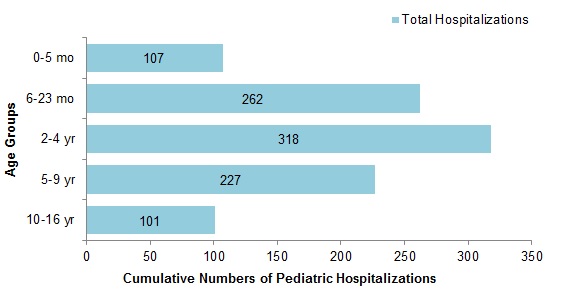
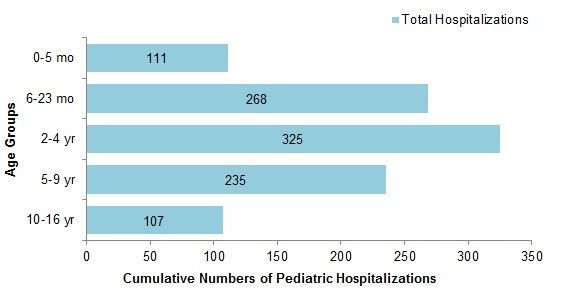
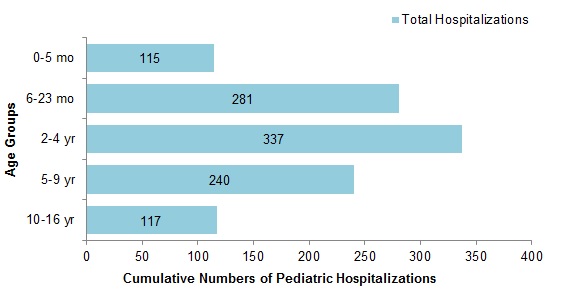
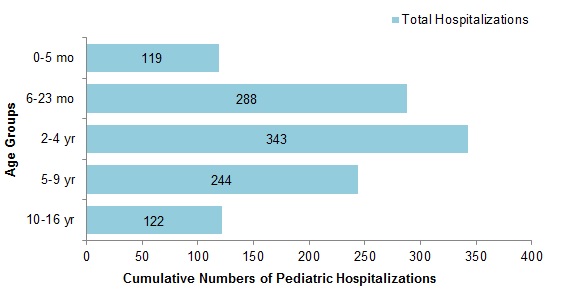
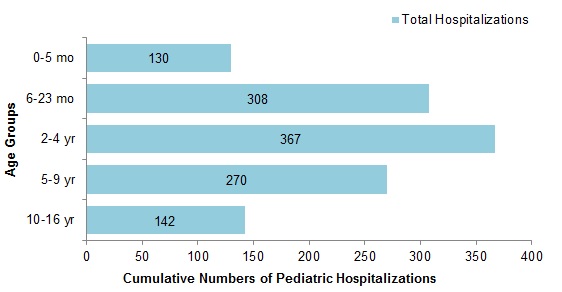
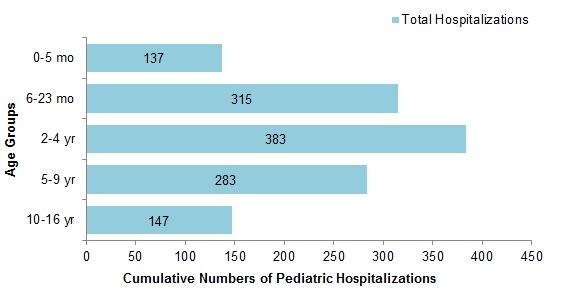
To date this season, 145 pediatric hospitalizations have been reported (Figure 8):
All but two cases have been associated with influenza A.
Among the 109 cases for which the influenza subtype was available, 108 were associated with A(H1N1)pdm09.
To date this season, 18 ICU admissions, and no deaths have been reported.
[h=3]Figure 7 ? Number of pediatric (≤16 years of age) hospitalizations reported by the IMPACT network, by week, Canada, weeks 2018-35 to 2018-47[/h]
Figure 7 - Text description [h=3]Figure 8 - Cumulative numbers of pediatric hospitalizations (≤16 years of age) with influenza by age-group reported by the IMPACT network, Canada, weeks 2018-35 to 2018-47[/h]
Figure 8 - Text description [h=3]Adult Influenza Hospitalizations and Deaths[/h] Surveillance of laboratory-confirmed influenza-associated adult (≥16 years of age) hospitalizations by the Canadian Immunization Research Network (CIRN) Serious Outcomes Surveillance (SOS) network began on November 1st for the 2018-19 season.
To date this season, 17 hospitalizations have been reported, of which 15 were associated with influenza A and 2 with influenza B.
[h=2]Influenza Strain Characterizations[/h] Since September 1, 2018, the National Microbiology Laboratory (NML) has characterized 101 influenza viruses (11 A(H3N2), 80 A(H1N1) and 10 B) that were received from Canadian laboratories.
[h=3]Genetic Characterization of Influenza A (H3N2):[/h] Ten influenza A(H3N2) viruses did not grow to sufficient hemagglutination titer for antigenic characterization by hemagglutination inhibition (HI) assay. Therefore, NML has performed genetic characterization to determine the genetic group identity of these viruses.
Sequence analysis of the HA gene of the viruses showed that:
One virus belonged to genetic group 3C.2a.
Nine viruses belonged to subclade 3C.2a1.
A/Singapore/INFIMH-16-0019/2016-like virus belongs to genetic group 3C.2a1 and is the influenza A(H3N2) component of the 2018-19 Northern Hemisphere influenza vaccine
[h=3]Antigenic Characterization:[/h] [h=4]Influenza A(H3N2):[/h]
One influenza A(H3N2) virus was antigenically characterized as A/Singapore/INFIMH-16-0019/2016-like by HI testing using antiserum raised against egg-propagated A/Singapore/INFIMH-16-0019/2016.
A/Singapore/INFIMH-16-0019/2016-like virus is the influenza A(H3N2) component of the 2018-19 Northern Hemisphere influenza vaccine.
The influenza A (H3N2) virus characterized belonged to genetic group 3C.2a1.
[h=4]Influenza A(H1N1):[/h]
80 A(H1N1) viruses characterized were antigenically similar to A/Michigan/45/2015, which is the influenza A(H1N1) component of the 2018-19 Northern Hemisphere influenza vaccine.
[h=4]Influenza B:[/h] Influenza B viruses can be divided into two antigenically distinct lineages represented by B/Yamagata/16/88 and B/Victoria/2/87 viruses. The recommended influenza B components for the 2018-19 Northern Hemisphere influenza vaccine are B/Colorado/06/2017 (Victoria lineage) and B/Phuket/3073/2013 (Yamagata lineage).
Ten influenza B viruses were characterized as B/Phuket/3073/2013-like, which belongs to the Yamagata lineage and is included as an influenza B component of the 2018-19 Northern Hemisphere quadrivalent influenza vaccine.
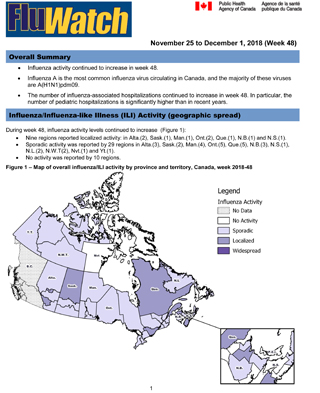
Influenza activity continued to increase in week 48.
Influenza A is the most common influenza virus circulating in Canada, and the majority of these viruses are A(H1N1)pdm09.
The number of influenza-associated hospitalizations continued to increase in week 48. In particular, the number of pediatric hospitalizations is significantly higher than in recent years.
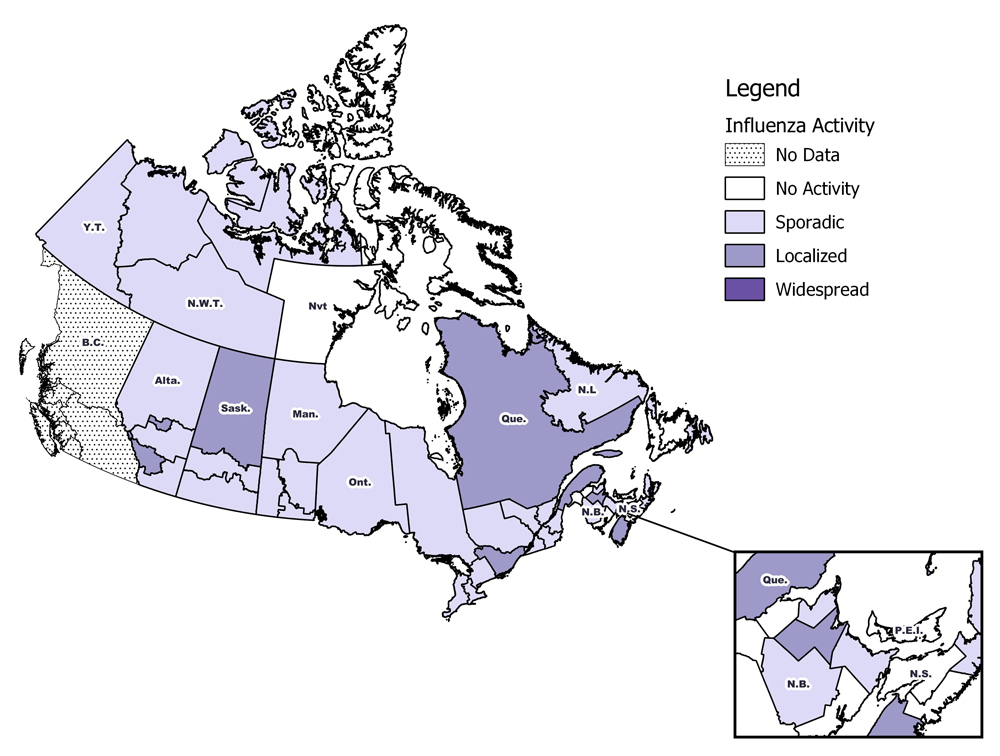
[h=2]Influenza/Influenza-like Illness Activity (geographic spread)[/h] During week 48, influenza activity levels continued to increase (Figure 1):
Nine regions reported localized activity: in Alta.(2), Sask.(1), Man.(1), Ont.(2), Que.(1), N.B.(1) and N.S.(1).
Sporadic activity was reported by 29 regions in Alta.(3), Sask.(2), Man.(4), Ont.(5), Que.(5), N.B.(3), N.S.(1), N.L.(2), N.W.T(2), Nvt.(1) and Yt.(1).
No activity was reported by 10 regions.
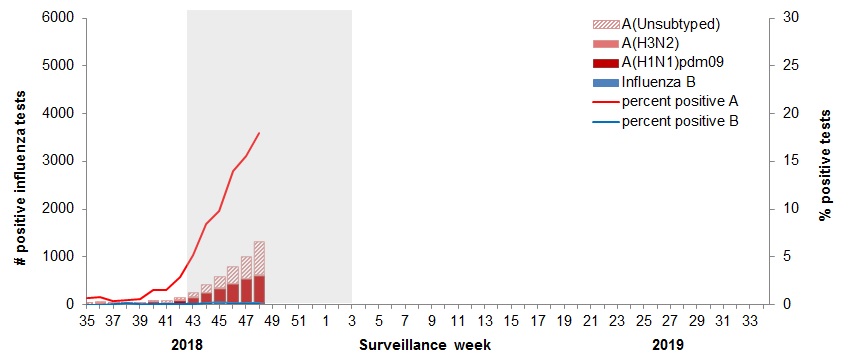
[h=3]Figure 1 ? Map of overall influenza/ILI activity by province and territory, Canada, week 2018-48[/h] Figure 1 - Text description [h=2]Laboratory Confirmed Influenza Detections[/h] In week 48, the following results were reported from sentinel laboratories across Canada (Figure 2):
The percentage of tests positive for influenza continued to increase to 18.1% of tests positive.
The percentage of tests positive for influenza A is higher for this time of year compared to the same period during the previous eight seasons.
In week 48, 1,301 laboratory detections of influenza were reported, of which 99% were influenza A.
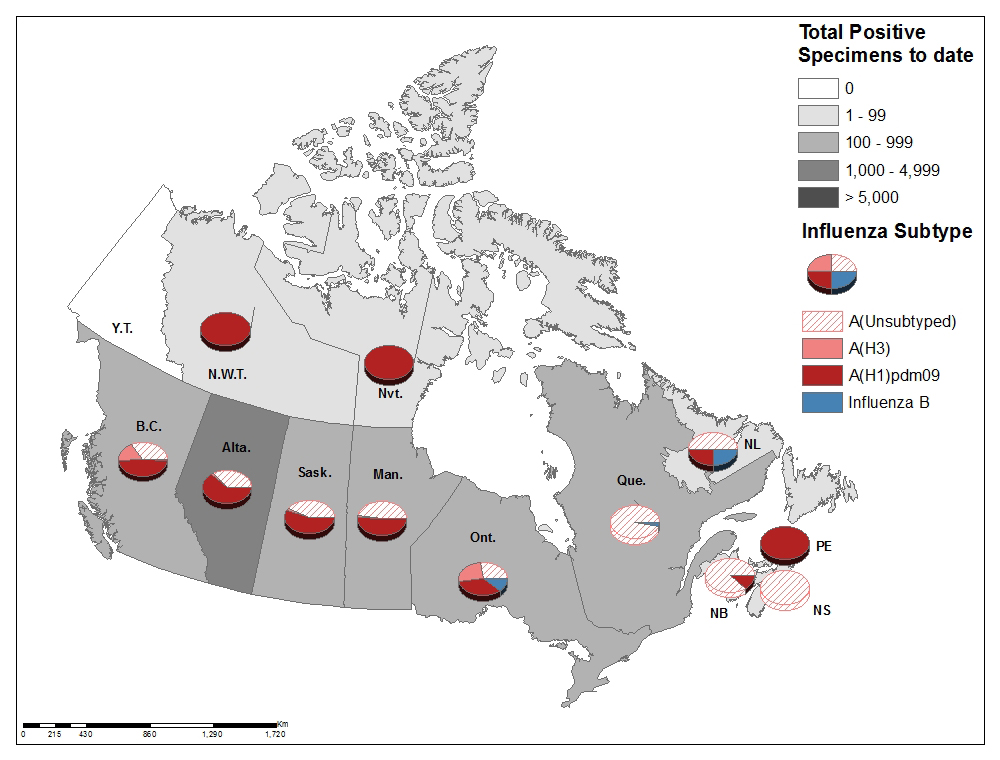
To date this season 4,485 laboratory-confirmed influenza detections have been reported (Figure 3):
99% have been influenza A.
Among the 2,384 influenza A viruses subtyped, 93% have been A(H1N1)pdm09.
To date this season, detailed information on age and type/subtype has been received for 4,409 laboratory-confirmed influenza cases (Table 1):
70% of all influenza A(H1N1)pdm09 detections have been reported in individuals younger than 45 years of age.
70% of all influenza A(H3N2) detections have been reported in adults 65 years of age and older.
For more detailed weekly and cumulative influenza data, see the text descriptions for Figures 2 and 3 or the Respiratory Virus Detections in Canada Report.
[h=3]Figure 2 ? Number of positive influenza tests and percentage of tests positive, by type, subtype and report week, Canada, weeks 2018-35 to 2018-48[/h]
The shaded area indicates weeks where the positivity rate was at least 5% and a minimum of 15 positive tests were observed, signalling the period of seasonal influenza activity.
Figure 2 - Text description [h=3]Figure 3 ? Cumulative numbers of positive influenza specimens by type/subtype and province/territory, Canada, weeks 2018-35 to 2018-48[/h]
Figure 3 - Text description [TABLE="class: table table-striped table-bordered table-hover table-condensed, width: 1140"]
Table 1 ? Cumulative numbers of positive influenza specimens by type, subtype and age-group reported through case-based laboratory reporting, Canada, weeks 2018-35 to 2018-48 [TR="class: bg-primary, bgcolor: #2572B4"]
Age groups (years) Cumulative (August 26, 2018 to December 1, 2018) [/TR]
[TR="class: bg-primary, bgcolor: #2572B4"]
Influenza A B Influenza A and B [/TR]
[TR="class: bg-primary, bgcolor: #2572B4"]
A Total A(H1) pdm09 A(H3) A (UnS)Footnote1 Total # % [/TR]
[TR="bgcolor: #F5F5F5"]
[TD]0-4[/TD]
[TD]908[/TD]
[TD]517[/TD]
[TD]3[/TD]
[TD]388[/TD]
[TD]6[/TD]
[TD]914[/TD]
[TD]21%[/TD]
[/TR]
[TR]
[TD]5-19[/TD]
[TD]925[/TD]
[TD]467[/TD]
[TD]5[/TD]
[TD]453[/TD]
[TD]13[/TD]
[TD]938[/TD]
[TD]21%[/TD]
[/TR]
[TR="bgcolor: #F5F5F5"]
[TD]20-44[/TD]
[TD]1100[/TD]
[TD]551[/TD]
[TD]17[/TD]
[TD]532[/TD]
[TD]12[/TD]
[TD]1112[/TD]
[TD]25%[/TD]
[/TR]
[TR]
[TD]45-64[/TD]
[TD]816[/TD]
[TD]392[/TD]
[TD]38[/TD]
[TD]386[/TD]
[TD]9[/TD]
[TD]825[/TD]
[TD]19%[/TD]
[/TR]
[TR="bgcolor: #F5F5F5"]
[TD]65+[/TD]
[TD]604[/TD]
[TD]259[/TD]
[TD]149[/TD]
[TD]196[/TD]
[TD]16[/TD]
[TD]620[/TD]
[TD]14%[/TD]
[/TR]
[TR]
[TD]Total[/TD]
[TD]4353[/TD]
[TD]2186[/TD]
[TD]212[/TD]
[TD]1955[/TD]
[TD]56[/TD]
[TD]4409[/TD]
[TD]100%[/TD]
[/TR]
[TR]
[TD="colspan: 8"] Table 1 - Note 1 UnS: unsubtyped: The specimen was typed as influenza A, but no result for subtyping was available; Return to Table 1 - Note1
[/TD]
[/TR]
[/TABLE]
[h=2]Syndromic/Influenza-like Illness Surveillance[/h] [h=3]Healthcare Professionals Sentinel Syndromic Surveillance[/h] In week 48, 2.3% of visits to healthcare professionals were due to influenza-like illness (ILI) (Figure 4). The percentage of visits for ILI is slightly above expected levels.
[h=3]Figure 4 ? Percentage of visits for ILI reported by sentinels by report week, Canada, weeks 2018-35 to 2018-48[/h] Number of Sentinels Reporting in Week 48: 86
The shaded area represents the maximum and minimum percentage of visits for ILI reported by week from seasons 2013-14 to 2017-18
Figure 4 - Text description [h=2]Participatory Syndromic Surveillance[/h] In week 48, 2,226 participants reported to FluWatchers, of which 53 (2.3%) reported symptoms of cough and fever (Figure 5).
Among the 53 participants who reported fever and cough:
21% consulted a healthcare professional;
64% reported days missed from work or school, resulting in a combined total of 89 missed days of work or school.
[h=3]Figure 5 ? Percentage of participants reporting cough and fever, Canada, weeks 2018-40 to 2018-48[/h] Number of Participants Reporting in Week 48: 2,226
Figure 5 - Text description [h=2]Influenza Outbreak Surveillance[/h] In week 48, seven new laboratory-confirmed influenza outbreaks were reported in long-term care (4), acute care facilities (2) and other settings (1).
To date this season, 44 laboratory-confirmed influenza outbreaks have been reported (Figure 6):
23 outbreaks were in LTCF, nine were in schools, six in acute care facilities, and six were in other settings.
All of the 36 outbreaks for which the influenza type was available were associated with influenza A.
Among the 27 outbreaks for which the influenza A subtype was available:
21 were associated with influenza A(H1N1)pdm09;
6 were associated with A(H3N2),
Three new ILI outbreaks were reported in week 48.
To date this season, 31 ILI outbreaks have been reported; 25 occurred in LTCF, three in schools, and three in acute care facilities.
[h=3]Figure 6 ? Number of new outbreaks of laboratory-confirmed influenza by report week, Canada, weeks 2018-35 to 2018-48[/h]
Figure 6 - Text description [h=2]Severe Outcomes Influenza Surveillance[/h] [h=3]Provincial/Territorial Influenza Hospitalizations and Deaths[/h] To date this season, more than 588 influenza-assocaited hospitalizations have been reported by participating provinces and territoriesFootnote1. Hospitalizations (Table 2):
99% (588) were associated with influenza A
The highest estimated rate of hospitalization is among children under 5 years of age.
Intensive Care Unit (ICU) cases and deaths:
To date this season 65 ICU admissions and 9 deaths have been reported.
Footnote 1 Influenza-associated hospitalizations are reported by Alberta, Manitoba, New Brunswick, Newfoundland and Labrador, Northwest Territories, Nova Scotia, Prince Edward Island and Yukon. Only hospitalizations that require intensive medical care are reported by Saskatchewan. The cumulative rate of hospitalizations is calculated using the total population by age-group in participating provinces and territories. Return to footnote1referrer
[TABLE="class: table table-striped table-bordered table-hover table-condensed, width: 1140"]
Table 2 ? Cumulative number and estimated rate of hospitalizations by age-group reported by participating provinces and territoriesFootnote1, Canada, weeks 2018-35 to 2018-48 [TR="class: bg-primary, bgcolor: #2572B4"]
Age Groups Cumulative (August 26, 2018 to December 1, 2018) [/TR]
[TR="class: bg-primary, bgcolor: #2572B4"]
Influenza A Influenza B Rate per 100,000 population [/TR]
[TR="bgcolor: #F5F5F5"]
[TD]0-4[/TD]
[TD]108[/TD]
[TD]0[/TD]
[TD]22.69[/TD]
[/TR]
[TR]
[TD]5-19[/TD]
[TD]75[/TD]
[TD]0[/TD]
[TD]5.41[/TD]
[/TR]
[TR="bgcolor: #F5F5F5"]
[TD]20-44[/TD]
[TD]91[/TD]
[TD]0[/TD]
[TD]3.20[/TD]
[/TR]
[TR]
[TD]45-64[/TD]
[TD]149[/TD]
[TD]0[/TD]
[TD]6.85[/TD]
[/TR]
[TR="bgcolor: #F5F5F5"]
[TD]65+[/TD]
[TD]165[/TD]
[TD]<5[/TD]
[TD]13.81[/TD]
[/TR]
[TR]
[TD]Total[/TD]
[TD]588[/TD]
[TD]<5[/TD]
[TD] [/TD]
[/TR]
[TR="bgcolor: #F5F5F5"]
[TD]%[/TD]
[TD]99%[/TD]
[TD]1%[/TD]
[TD] [/TD]
[/TR]
[TR]
[TD="colspan: 6"] Table 2 - Footnote 1 Influenza-associated hospitalizations are reported by Alberta, Manitoba, New Brunswick, Newfoundland and Labrador, Northwest Territories, Nova Scotia, Prince Edward Island and Yukon. Only hospitalizations that require intensive medical care are reported by Saskatchewan. The cumulative rate of hospitalizations is calculated using the total population by age-group in participating provinces and territories. Return to Table 2 - Footnote1referrer
[/TD]
[/TR]
[/TABLE]
[h=3]Pediatric Influenza Hospitalizations and Deaths[/h] In week 48, 44 pediatric (≤16 years of age) hospitalizations with influenza have been reported by the Immunization Monitoring Program Active (IMPACT) network. Pediatric hospitalizations reported by IMPACT are at levels not normally seen until late December (approximately 4 weeks earlier than in recent seasons) (Figure 7).
To date this season, 189 pediatric hospitalizations have been reported (Figure 8):
All but three cases have been associated with influenza A.
Among the 132 cases for which the influenza subtype was available, 130 (98.5%) were associated with A(H1N1)pdm09.
To date this season, 28 ICU admissions, and no deaths have been reported.
[h=3]Figure 7 ? Number of pediatric (≤16 years of age) hospitalizations reported by the IMPACT network, by week, Canada, weeks 2018-35 to 2018-48[/h]
Figure 7 - Text description [h=3]Figure 8 - Cumulative numbers of pediatric hospitalizations (≤16 years of age) with influenza by age-group reported by the IMPACT network, Canada, weeks 2018-35 to 2018-48[/h]
Figure 8 - Text description [h=3]Adult Influenza Hospitalizations and Deaths[/h] Surveillance of laboratory-confirmed influenza-associated adult (≥16 years of age) hospitalizations by the Canadian Immunization Research Network (CIRN) Serious Outcomes Surveillance (SOS) network began on November 1st for the 2018-19 season.
To date this season, 23 hospitalizations have been reported:
20 (87%) were associated with influenza A and 3 with influenza B.
11 of the 23 cases (48%) were adults 65 years of age and older.
[h=2]Influenza Strain Characterizations[/h] Since September 1, 2018, the National Microbiology Laboratory (NML) has characterized 142 influenza viruses (20 A(H3N2), 112 A(H1N1) and 10 B) that were received from Canadian laboratories.
[h=3]Genetic Characterization of Influenza A (H3N2):[/h] 19 influenza A(H3N2) viruses did not grow to sufficient hemagglutination titer for antigenic characterization by hemagglutination inhibition (HI) assay. Therefore, NML has performed genetic characterization to determine the genetic group identity of these viruses.
Sequence analysis of the HA gene of the viruses showed that:
Two viruses belonged to genetic group 3C.2a.
17 viruses belonged to subclade 3C.2a1.
A/Singapore/INFIMH-16-0019/2016-like virus belongs to genetic group 3C.2a1 and is the influenza A(H3N2) component of the 2018-19 Northern Hemisphere influenza vaccine.
[h=3]Antigenic Characterization:[/h] [h=4]Influenza A(H3N2):[/h]
One influenza A(H3N2) virus was antigenically characterized as A/Singapore/INFIMH-16-0019/2016-like by HI testing using antiserum raised against egg-propagated A/Singapore/INFIMH-16-0019/2016.
A/Singapore/INFIMH-16-0019/2016-like virus is the influenza A(H3N2) component of the 2018-19 Northern Hemisphere influenza vaccine.
The influenza A (H3N2) virus characterized belonged to genetic group 3C.2a1.
[h=4]Influenza A(H1N1):[/h]
112 A(H1N1) viruses characterized were antigenically similar to A/Michigan/45/2015, which is the influenza A(H1N1) component of the 2018-19 Northern Hemisphere influenza vaccine.
[h=4]Influenza B:[/h] Influenza B viruses can be divided into two antigenically distinct lineages represented by B/Yamagata/16/88 and B/Victoria/2/87 viruses. The recommended influenza B components for the 2018-19 Northern Hemisphere influenza vaccine are B/Colorado/06/2017 (Victoria lineage) and B/Phuket/3073/2013 (Yamagata lineage).
Ten influenza B viruses were characterized as B/Phuket/3073/2013-like, which belongs to the Yamagata lineage and is included as an influenza B component of the 2018-19 Northern Hemisphere quadrivalent influenza vaccine.
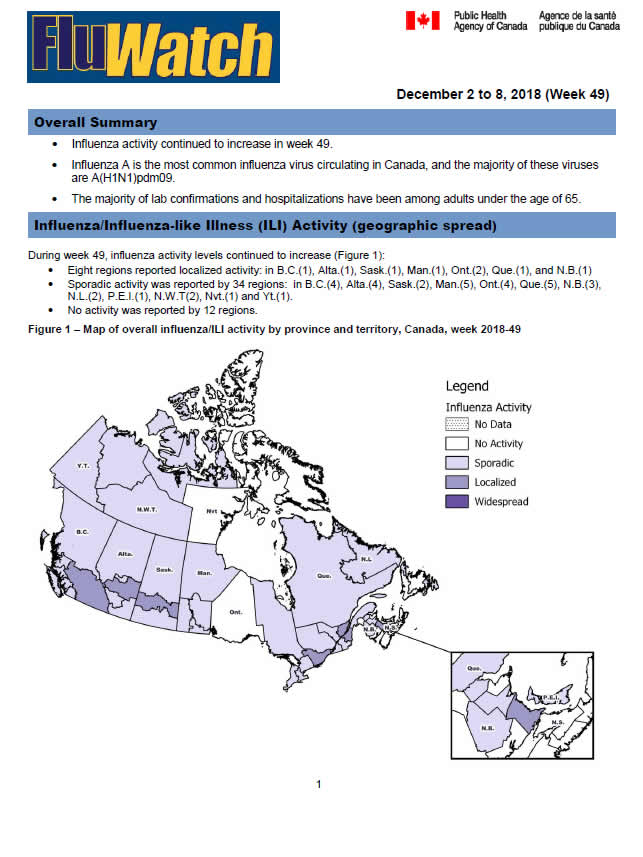
[h=2]Influenza/Influenza-like Illness Activity (geographic spread)[/h] During week 49, influenza activity levels continued to increase (Figure 1):
Eight regions reported localized activity: in B.C.(1), Alta.(1), Sask.(1), Man.(1), Ont.(2), Que.(1), and N.B.(1)
Sporadic activity was reported by 34 regions: in B.C.(4), Alta.(4), Sask.(2), Man.(5), Ont.(4), Que.(5), N.B.(3), N.L.(2), P.E.I.(1), N.W.T(2), Nvt.(1) and Yt.(1).
No activity was reported by 12 regions.
[h=3]Figure 1 ? Map of overall influenza/ILI activity by province and territory, Canada, week 2018-49[/h] Figure 1 - Text description [h=2]Laboratory Confirmed Influenza Detections[/h] In week 49, the following results were reported from sentinel laboratories across Canada (Figure 2):
The percentage of tests positive for influenza continued to 19.3%.
1,500 laboratory detections of influenza were reported, of which 99% were influenza A.
To date this season 6,158 laboratory-confirmed influenza detections have been reported (Figure 3):
99% have been influenza A.
Among the 3,209 influenza A viruses subtyped, 94% have been A(H1N1)pdm09.
Provincial and territorial differences in influenza type/subtype distribution are observed.
To date this season, detailed information on age and type/subtype has been received for 6,024 laboratory-confirmed influenza cases (Table 1):
70% of all influenza A(H1N1)pdm09 detections have been reported in individuals younger than 45 years of age.
68% of all influenza A(H3N2) detections have been reported in adults 65 years of age and older.
For more detailed weekly and cumulative influenza data, see the text descriptions for Figures 2 and 3 or the Respiratory Virus Detections in Canada Report.
[h=3]Figure 2 ? Number of positive influenza tests and percentage of tests positive, by type, subtype and report week, Canada, weeks 2018-35 to 2018-49[/h]
The shaded area indicates weeks where the positivity rate was at least 5% and a minimum of 15 positive tests were observed, signalling the period of seasonal influenza activity.
Figure 2 - Text description [h=3]Figure 3 ? Cumulative numbers of positive influenza specimens by type/subtype and province/territory, Canada, weeks 2018-35 to 2018-49[/h]
Figure 3 - Text description [TABLE="class: table table-striped table-bordered table-hover table-condensed, width: 1140"]
Table 1 ? Cumulative numbers of positive influenza specimens by type, subtype and age-group reported through case-based laboratory reporting, Canada, weeks 2018-35 to 2018-49 [TR="class: bg-primary, bgcolor: #2572B4"]
Age groups (years) Cumulative (August 26, 2018 to December 8, 2018) [/TR]
[TR="class: bg-primary, bgcolor: #2572B4"]
Influenza A B Influenza A and B [/TR]
[TR="class: bg-primary, bgcolor: #2572B4"]
A Total A(H1) pdm09 A(H3) A (UnS)Footnote1 Total # % [/TR]
[TR="bgcolor: #F5F5F5"]
[TD]0-4[/TD]
[TD="class: text-right"]1277[/TD]
[TD="class: text-right"]698[/TD]
[TD="class: text-right"]4[/TD]
[TD="class: text-right"]575[/TD]
[TD="class: text-right"]10[/TD]
[TD="class: text-right"]1287[/TD]
[TD="class: text-right"]21%[/TD]
[/TR]
[TR]
[TD]5-19[/TD]
[TD="class: text-right"]1247[/TD]
[TD="class: text-right"]637[/TD]
[TD="class: text-right"]5[/TD]
[TD="class: text-right"]605[/TD]
[TD="class: text-right"]15[/TD]
[TD="class: text-right"]1262[/TD]
[TD="class: text-right"]21%[/TD]
[/TR]
[TR="bgcolor: #F5F5F5"]
[TD]20-44[/TD]
[TD="class: text-right"]1490[/TD]
[TD="class: text-right"]724[/TD]
[TD="class: text-right"]27[/TD]
[TD="class: text-right"]739[/TD]
[TD="class: text-right"]13[/TD]
[TD="class: text-right"]1503[/TD]
[TD="class: text-right"]25%[/TD]
[/TR]
[TR]
[TD]45-64[/TD]
[TD="class: text-right"]1131[/TD]
[TD="class: text-right"]555[/TD]
[TD="class: text-right"]43[/TD]
[TD="class: text-right"]533[/TD]
[TD="class: text-right"]9[/TD]
[TD="class: text-right"]1140[/TD]
[TD="class: text-right"]19%[/TD]
[/TR]
[TR="bgcolor: #F5F5F5"]
[TD]65+[/TD]
[TD="class: text-right"]813[/TD]
[TD="class: text-right"]331[/TD]
[TD="class: text-right"]167[/TD]
[TD="class: text-right"]315[/TD]
[TD="class: text-right"]19[/TD]
[TD="class: text-right"]832[/TD]
[TD="class: text-right"]14%[/TD]
[/TR]
[TR]
[TD]Total[/TD]
[TD="class: text-right"]5958[/TD]
[TD="class: text-right"]2945[/TD]
[TD="class: text-right"]246[/TD]
[TD="class: text-right"]2767[/TD]
[TD="class: text-right"]66[/TD]
[TD="class: text-right"]6024[/TD]
[TD="class: text-right"]100%[/TD]
[/TR]
[TR]
[TD="colspan: 8"] Table 1 - Note 1 UnS: unsubtyped: The specimen was typed as influenza A, but no result for subtyping was available; Return to Table 1 - Note1
[/TD]
[/TR]
[/TABLE]
[h=2]Syndromic/Influenza-like Illness Surveillance[/h] [h=3]Healthcare Professionals Sentinel Syndromic Surveillance[/h] In week 49, 2.1% of visits to healthcare professionals were due to influenza-like illness (ILI) (Figure 4). The percentage of visits for ILI is within expected levels.
[h=3]Figure 4 ? Percentage of visits for ILI reported by sentinels by report week, Canada, weeks 2018-35 to 2018-49[/h] Number of Sentinels Reporting in Week 49: 102
The shaded area represents the maximum and minimum percentage of visits for ILI reported by week from seasons 2013-14 to 2017-18
Figure 4 - Text description [h=2]Participatory Syndromic Surveillance[/h] In week 49, 2,218 participants reported to FluWatchers, of which 44 (2.0%) reported symptoms of cough and fever (Figure 5).
Among the 53 participants who reported fever and cough:
27% consulted a healthcare professional;
80% reported days missed from work or school, resulting in a combined total of 118 missed days of work or school.
[h=3]Figure 5 ? Percentage of participants reporting cough and fever, Canada, weeks 2018-40 to 2018-49[/h] Number of Participants Reporting in Week 49: 2,218
Figure 5 - Text description [h=2]Influenza Outbreak Surveillance[/h] In week 49, five new laboratory-confirmed influenza outbreaks were reported in long-term care (2), acute care facilities (1) and other settings (2). Four new ILI outbreaks were also reported in week 49.
To date this season, 52 laboratory-confirmed influenza outbreaks have been reported (Figure 6):
25 outbreaks were in LTCF, 11 were in schools, seven in acute care facilities, and eight were in other settings.
All of the 36 outbreaks for which the influenza type was available were associated with influenza A.
Among the 33 outbreaks for which the influenza A subtype was available:
25 were associated with influenza A(H1N1)pdm09;
8 were associated with A(H3N2),
To date this season, 35 ILI outbreaks have been reported; 26 occurred in LTCF, six in schools, and three in acute care facilities.
[h=3]Figure 6 ? Number of new outbreaks of laboratory-confirmed influenza by report week, Canada, weeks 2018-35 to 2018-49[/h]
Figure 6 - Text description [h=2]Severe Outcomes Influenza Surveillance[/h] [h=3]Provincial/Territorial Influenza Hospitalizations and Deaths[/h] To date this season, 705 influenza-associated hospitalizations have been reported by participating provinces and territoriesFootnote1. Hospitalizations (Table 2):
99% (702) were associated with influenza A
The highest estimated rate of hospitalization is among children under 5 years of age.
Intensive Care Unit (ICU) cases and deaths:
To date this season 90 ICU admissions and 16 deaths have been reported.
Footnote 1 Influenza-associated hospitalizations are reported by Alberta, Manitoba, New Brunswick, Newfoundland and Labrador, Northwest Territories, Nova Scotia, Prince Edward Island and Yukon. Only hospitalizations that require intensive medical care are reported by Saskatchewan. The cumulative rate of hospitalizations is calculated using the total population by age-group in participating provinces and territories. Return to footnote1referrer
[TABLE="class: table table-striped table-bordered table-hover table-condensed, width: 1140"]
Table 2 ? Cumulative number and estimated rate of hospitalizations by age-group reported by participating provinces and territoriesFootnote1, Canada, weeks 2018-35 to 2018-49 [TR="class: bg-primary, bgcolor: #2572B4"]
Age Groups Cumulative (August 26, 2018 to December 8, 2018) [/TR]
[TR="class: bg-primary, bgcolor: #2572B4"]
Influenza A Influenza B Rate per 100,000 population [/TR]
[TR="bgcolor: #F5F5F5"]
[TD]0-4[/TD]
[TD="class: text-right"]131[/TD]
[TD="class: text-right"]0[/TD]
[TD="class: text-right"]27.5223961[/TD]
[/TR]
[TR]
[TD]5-19[/TD]
[TD="class: text-right"]88[/TD]
[TD="class: text-right"]0[/TD]
[TD="class: text-right"]6.3418807[/TD]
[/TR]
[TR="bgcolor: #F5F5F5"]
[TD]20-44[/TD]
[TD="class: text-right"]115[/TD]
[TD="class: text-right"]0[/TD]
[TD="class: text-right"]4.0420613[/TD]
[/TR]
[TR]
[TD]45-64[/TD]
[TD="class: text-right"]182[/TD]
[TD="class: text-right"]0[/TD]
[TD="class: text-right"]8.3629752[/TD]
[/TR]
[TR="bgcolor: #F5F5F5"]
[TD]65+[/TD]
[TD="class: text-right"]186[/TD]
[TD="class: text-right"]3[/TD]
[TD="class: text-right"]15.5342679[/TD]
[/TR]
[TR]
[TD]Total[/TD]
[TD="class: text-right"]702[/TD]
[TD="class: text-right"]3[/TD]
[TD="class: text-right"] [/TD]
[/TR]
[TR="bgcolor: #F5F5F5"]
[TD]%[/TD]
[TD="class: text-right"]100%[/TD]
[TD="class: text-right"]0%[/TD]
[TD="class: text-right"] [/TD]
[/TR]
[TR]
[TD="colspan: 6"] Table 2 - Footnote 1 Influenza-associated hospitalizations are reported by Alberta, Manitoba, New Brunswick, Newfoundland and Labrador, Northwest Territories, Nova Scotia, Prince Edward Island and Yukon. Only hospitalizations that require intensive medical care are reported by Saskatchewan. The cumulative rate of hospitalizations is calculated using the population by age-group in participating provinces and territories. Return to Table 2 - Footnote1referrer
[/TD]
[/TR]
[/TABLE]
[h=3]Pediatric Influenza Hospitalizations and Deaths[/h] In week 49, 37 pediatric (≤16 years of age) hospitalizations with influenza have been reported by the Immunization Monitoring Program Active (IMPACT) network. Pediatric hospitalizations reported by IMPACT are at levels not normally seen until late December (Figure 7).
To date this season, 228 pediatric hospitalizations have been reported (Figure 8):
All but three cases have been associated with influenza A.
Among the 154 cases for which the influenza subtype was available, 152 (98.7%) were associated with A(H1N1)pdm09.
To date this season, 33 ICU admissions, and no deaths have been reported.
[h=3]Figure 7 ? Number of pediatric (≤16 years of age) hospitalizations reported by the IMPACT network, by week, Canada, weeks 2018-35 to 2018-49[/h]
Figure 7 - Text description [h=3]Figure 8 - Cumulative numbers of pediatric hospitalizations (≤16 years of age) with influenza by age-group reported by the IMPACT network, Canada, weeks 2018-35 to 2018-49[/h]
Figure 8 - Text description [h=3]Adult Influenza Hospitalizations and Deaths[/h] Surveillance of laboratory-confirmed influenza-associated adult (≥16 years of age) hospitalizations by the Canadian Immunization Research Network (CIRN) Serious Outcomes Surveillance (SOS) network began on November 1st for the 2018-19 season.
To date this season, 38 hospitalizations have been reported:
33 (87%) were associated with influenza A and 5 with influenza B.
20 of the 38 cases (53%) were adults 65 years of age and older.
[h=2]Influenza Strain Characterizations[/h] Since September 1, 2018, the National Microbiology Laboratory (NML) has characterized 182 influenza viruses (25 A(H3N2), 144 A(H1N1) and 13 B) that were received from Canadian laboratories.
[h=3]Genetic Characterization of Influenza A (H3N2):[/h] 23 influenza A(H3N2) viruses did not grow to sufficient hemagglutination titer for antigenic characterization by hemagglutination inhibition (HI) assay. Therefore, NML has performed genetic characterization to determine the genetic group identity of these viruses.
Sequence analysis of the HA gene of the viruses showed that:
Three viruses belonged to genetic group 3C.2a.
20 viruses belonged to subclade 3C.2a1.
A/Singapore/INFIMH-16-0019/2016-like virus belongs to genetic group 3C.2a1 and is the influenza A(H3N2) component of the 2018-19 Northern Hemisphere influenza vaccine.
[h=3]Antigenic Characterization:[/h] [h=4]Influenza A(H3N2):[/h]
Two influenza A(H3N2) virus was antigenically characterized as A/Singapore/INFIMH-16-0019/2016-like by HI testing using antiserum raised against egg-propagated A/Singapore/INFIMH-16-0019/2016.
A/Singapore/INFIMH-16-0019/2016-like virus is the influenza A(H3N2) component of the 2018-19 Northern Hemisphere influenza vaccine.
The two influenza A (H3N2) viruses characterized belonged to genetic group 3C.2a1.
[h=4]Influenza A(H1N1):[/h]
144 A(H1N1) viruses characterized were antigenically similar to A/Michigan/45/2015, which is the influenza A(H1N1) component of the 2018-19 Northern Hemisphere influenza vaccine.
[h=4]Influenza B:[/h] Influenza B viruses can be divided into two antigenically distinct lineages represented by B/Yamagata/16/88 and B/Victoria/2/87 viruses. The recommended influenza B components for the 2018-19 Northern Hemisphere influenza vaccine are B/Colorado/06/2017 (Victoria lineage) and B/Phuket/3073/2013 (Yamagata lineage).
13 influenza B viruses were characterized as B/Phuket/3073/2013-like, which belongs to the Yamagata lineage and is included as an influenza B component of the 2018-19 Northern Hemisphere quadrivalent influenza vaccine.
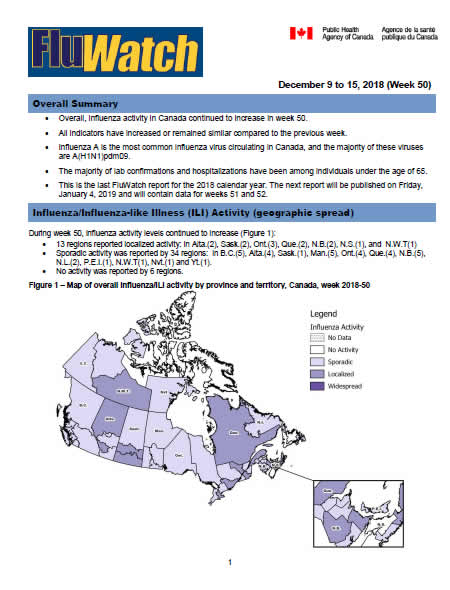
Overall, influenza activity in Canada continued to increase in week 50.
All indicators have increased or remained similar compared to the previous week.
Influenza A is the most common influenza virus circulating in Canada, and the majority of these viruses are A(H1N1)pdm09.
The majority of lab confirmations and hospitalizations have been among individuals under the age of 65.
This is the last FluWatch report for the 2018 calendar year. The next report will be published on Friday, January 4, 2019 and will contain data for weeks 51 and 52.
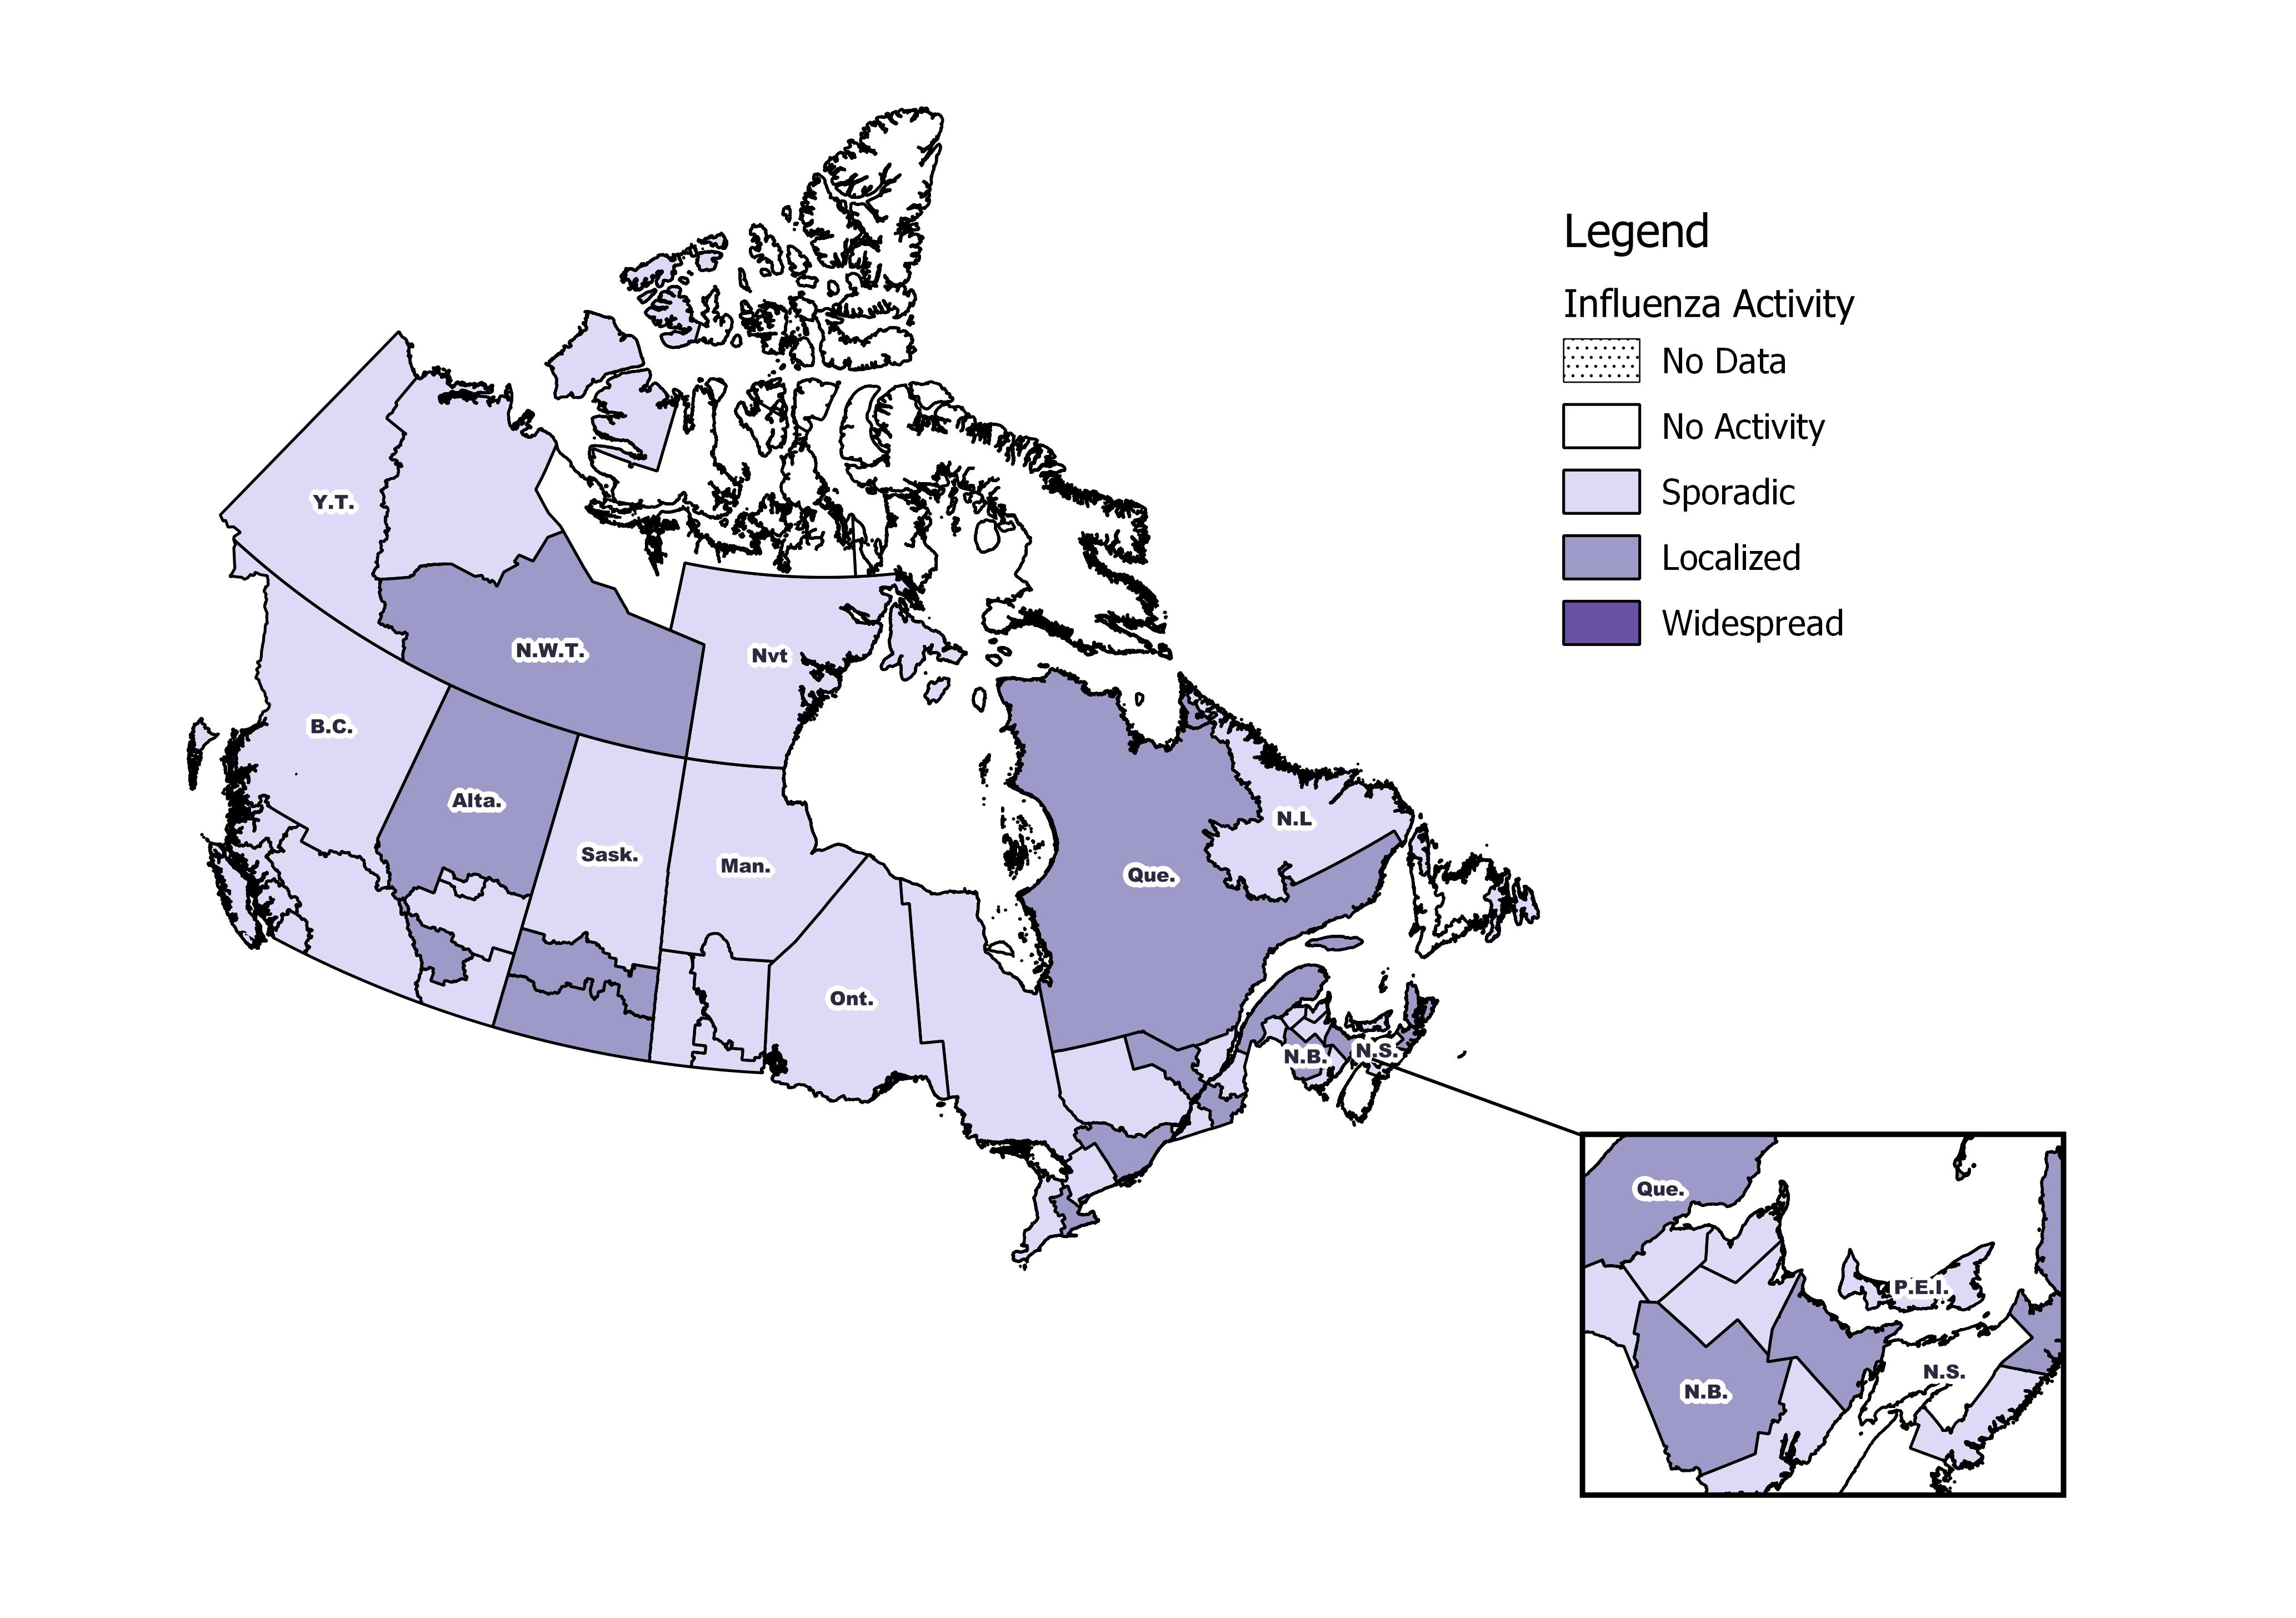
[h=2]Influenza/Influenza-like Illness Activity (geographic spread)[/h] During week 50, influenza activity levels continued to increase (Figure 1):
13 regions reported localized activity: in Alta.(2), Sask.(2), Ont.(3), Que.(2), N.B.(2), N.S.(1), and N.W.T(1)
Sporadic activity was reported by 34 regions: in B.C.(5), Alta.(4), Sask.(1), Man.(5), Ont.(4), Que.(4), N.B.(5), N.L.(2), P.E.I.(1), N.W.T(1), Nvt.(1) and Yt.(1).
No activity was reported by 6 regions.
[h=3]Figure 1 ? Map of overall influenza/ILI activity by province and territory, Canada, week 2018-50[/h] Figure 1 - Text description [h=2]Laboratory Confirmed Influenza Detections[/h] In week 50, the following results were reported from sentinel laboratories across Canada (Figure 2):
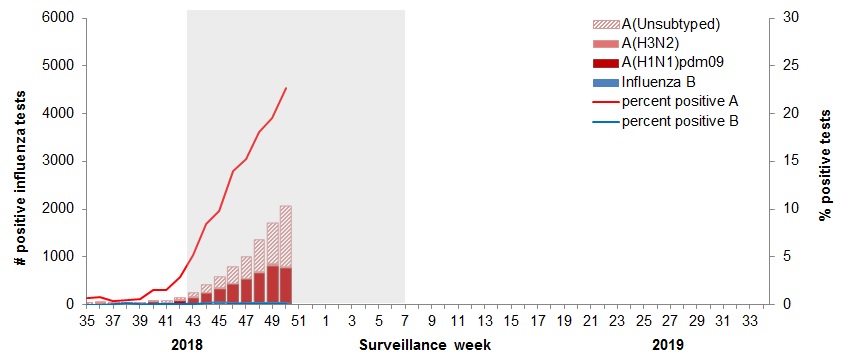
The percentage of tests positive for influenza continued to increase to 22.8%.
1,869 laboratory detections of influenza were reported, of which 99% were influenza A.
To date this season 8,245 laboratory-confirmed influenza detections have been reported (Figure 3):
99% have been influenza A.
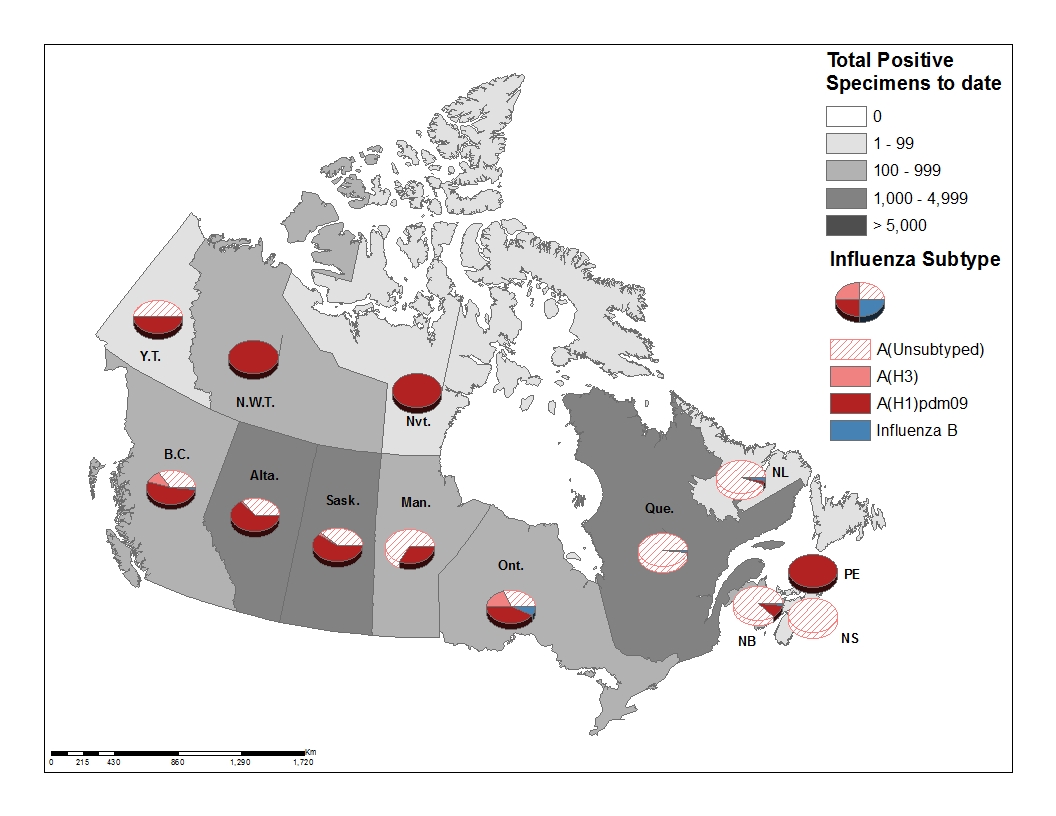
Among the 4,024 influenza A viruses subtyped, 94% have been A(H1N1)pdm09.
Provincial and territorial differences in influenza type/subtype distribution are observed.
To date this season, detailed information on age and type/subtype has been received for 7,914 laboratory-confirmed influenza cases (Table 1):
70% of all influenza A(H1N1)pdm09 detections have been reported in individuals younger than 45 years of age.
66% of all influenza A(H3N2) detections have been reported in adults 65 years of age and older.
For more detailed weekly and cumulative influenza data, see the text descriptions for Figures 2 and 3 or the Respiratory Virus Detections in Canada Report.
[h=3]Figure 2 ? Number of positive influenza tests and percentage of tests positive, by type, subtype and report week, Canada, weeks 2018-35 to 2018-50[/h]
The shaded area indicates weeks where the positivity rate was at least 5% and a minimum of 15 positive tests were observed, signalling the period of seasonal influenza activity.
Figure 2 - Text description [h=3]Figure 3 ? Cumulative numbers of positive influenza specimens by type/subtype and province/territory, Canada, weeks 2018-35 to 2018-50[/h]
Figure 3 - Text description [TABLE="class: table table-striped table-bordered table-hover table-condensed, width: 1140"]
Table 1 ? Cumulative numbers of positive influenza specimens by type, subtype and age-group reported through case-based laboratory reporting, Canada, weeks 2018-35 to 2018-50 [TR="class: bg-primary, bgcolor: #2572B4"]
Age groups (years) Cumulative (August 26, 2018 to December 15, 2018) [/TR]
[TR="class: bg-primary, bgcolor: #2572B4"]
Influenza A B Influenza A and B [/TR]
[TR="class: bg-primary, bgcolor: #2572B4"]
A Total A(H1) pdm09 A(H3) A (UnS)Footnote1 Total # % [/TR]
[TR="bgcolor: #F5F5F5"]
[TD]0-4[/TD]
[TD="class: text-right"]1695[/TD]
[TD="class: text-right"]865[/TD]
[TD="class: text-right"]5[/TD]
[TD="class: text-right"]825[/TD]
[TD="class: text-right"]10[/TD]
[TD="class: text-right"]1705[/TD]
[TD="class: text-right"]22%[/TD]
[/TR]
[TR]
[TD]5-19[/TD]
[TD="class: text-right"]1629[/TD]
[TD="class: text-right"]818[/TD]
[TD="class: text-right"]6[/TD]
[TD="class: text-right"]805[/TD]
[TD="class: text-right"]19[/TD]
[TD="class: text-right"]1648[/TD]
[TD="class: text-right"]21%[/TD]
[/TR]
[TR="bgcolor: #F5F5F5"]
[TD]20-44[/TD]
[TD="class: text-right"]1903[/TD]
[TD="class: text-right"]898[/TD]
[TD="class: text-right"]34[/TD]
[TD="class: text-right"]971[/TD]
[TD="class: text-right"]13[/TD]
[TD="class: text-right"]1916[/TD]
[TD="class: text-right"]24%[/TD]
[/TR]
[TR]
[TD]45-64[/TD]
[TD="class: text-right"]1543[/TD]
[TD="class: text-right"]726[/TD]
[TD="class: text-right"]49[/TD]
[TD="class: text-right"]768[/TD]
[TD="class: text-right"]11[/TD]
[TD="class: text-right"]1554[/TD]
[TD="class: text-right"]20%[/TD]
[/TR]
[TR="bgcolor: #F5F5F5"]
[TD]65+[/TD]
[TD="class: text-right"]1071[/TD]
[TD="class: text-right"]414[/TD]
[TD="class: text-right"]181[/TD]
[TD="class: text-right"]476[/TD]
[TD="class: text-right"]20[/TD]
[TD="class: text-right"]1091[/TD]
[TD="class: text-right"]14%[/TD]
[/TR]
[TR]
[TD]Total[/TD]
[TD="class: text-right"]7841[/TD]
[TD="class: text-right"]3721[/TD]
[TD="class: text-right"]275[/TD]
[TD="class: text-right"]3845[/TD]
[TD="class: text-right"]73[/TD]
[TD="class: text-right"]7914[/TD]
[TD="class: text-right"]100%[/TD]
[/TR]
[TR]
[TD="colspan: 8"] Table 1 - Note 1 UnS: unsubtyped: The specimen was typed as influenza A, but no result for subtyping was available; Return to Table 1 - Note1
[/TD]
[/TR]
[/TABLE]
[h=2]Syndromic/Influenza-like Illness Surveillance[/h] [h=3]Healthcare Professionals Sentinel Syndromic Surveillance[/h] In week 50, 1.5% of visits to healthcare professionals were due to influenza-like illness (ILI) (Figure 4). The percentage of visits for ILI is within expected levels.
[h=3]Figure 4 ? Percentage of visits for ILI reported by sentinels by report week, Canada, weeks 2018-35 to 2018-50[/h] Number of Sentinels Reporting in Week 50: 103
The shaded area represents the maximum and minimum percentage of visits for ILI reported by week from seasons 2013-14 to 2017-18
Figure 4 - Text description [h=2]Participatory Syndromic Surveillance[/h] In week 50, 2,210 participants reported to FluWatchers, of which 82 (3.7%) reported symptoms of cough and fever (Figure 5).
Among the 82 participants who reported fever and cough:
15% consulted a healthcare professional;
74% reported days missed from work or school, resulting in a combined total of 180 missed days of work or school.
[h=3]Figure 5 ? Percentage of participants reporting cough and fever, Canada, weeks 2018-40 to 2018-50[/h] Number of Participants Reporting in Week 50: 2,210
Figure 5 - Text description [h=2]Influenza Outbreak Surveillance[/h] In week 50, 13 new laboratory-confirmed influenza outbreaks were reported: long-term care facilities (LTCF) (4), acute care facilities (3), schools (1), and other settings (5). One new ILI outbreak was also reported in week 50.
To date this season, 67 laboratory-confirmed influenza outbreaks have been reported (Figure 6):
30 outbreaks were in LTCF, 13 were in schools, 10 in acute care facilities, and 14 were in other settings.
All of the 55 outbreaks for which the influenza type was available were associated with influenza A.
Among the 41 outbreaks for which the influenza A subtype was available:
80% (33) were associated with influenza A(H1N1)pdm09;
20% (8) were associated with A(H3N2),
To date this season, 36 ILI outbreaks have been reported; 26 occurred in LTCF, seven in schools, and three in acute care facilities.
[h=3]Figure 6 ? Number of new outbreaks of laboratory-confirmed influenza by report week, Canada, weeks 2018-35 to 2018-50[/h]
Figure 6 - Text description [h=2]Severe Outcomes Influenza Surveillance[/h] [h=3]Provincial/Territorial Influenza Hospitalizations and Deaths[/h] To date this season, 864 influenza-associated hospitalizations have been reported by participating provinces and territoriesFootnote1. Hospitalizations (Table 2):
99% (861) were associated with influenza A
The highest estimated rate of hospitalization is among children under 5 years of age.
Intensive Care Unit (ICU) cases and deaths:
To date this season 118 ICU admissions and 22 deaths have been reported.
41% (48) of reported ICU admissions were in adults aged 45-64 years.
All reported deaths were associated with influenza A(H1N1)pdm09.
Footnote 1 Influenza-associated hospitalizations are reported by Alberta, Manitoba, New Brunswick, Newfoundland and Labrador, Northwest Territories, Nova Scotia, Prince Edward Island and Yukon. Only hospitalizations that require intensive medical care are reported by Saskatchewan. The cumulative rate of hospitalizations is calculated using the total population by age-group in participating provinces and territories. Return to footnote1referrer
[TABLE="class: table table-striped table-bordered table-hover table-condensed, width: 1140"]
Table 2 ? Cumulative number and estimated rate of hospitalizations by age-group reported by participating provinces and territoriesFootnote1, Canada, weeks 2018-35 to 2018-50 [TR="class: bg-primary, bgcolor: #2572B4"]
Age Groups Cumulative (August 26, 2018 to December 15, 2018) [/TR]
[TR="class: bg-primary, bgcolor: #2572B4"]
Influenza A Influenza B Rate per 100,000 population [/TR]
[TR="bgcolor: #F5F5F5"]
[TD]0-4[/TD]
[TD="class: text-right"]153[/TD]
[TD="class: text-right"]0[/TD]
[TD="class: text-right"]32.14[/TD]
[/TR]
[TR]
[TD]5-19[/TD]
[TD="class: text-right"]108[/TD]
[TD="class: text-right"]0[/TD]
[TD="class: text-right"]7.78[/TD]
[/TR]
[TR="bgcolor: #F5F5F5"]
[TD]20-44[/TD]
[TD="class: text-right"]135[/TD]
[TD="class: text-right"]0[/TD]
[TD="class: text-right"]4.75[/TD]
[/TR]
[TR]
[TD]45-64[/TD]
[TD="class: text-right"]228[/TD]
[TD="class: text-right"]0[/TD]
[TD="class: text-right"]10.48[/TD]
[/TR]
[TR="bgcolor: #F5F5F5"]
[TD]65+[/TD]
[TD="class: text-right"]237[/TD]
[TD="class: text-right"]3[/TD]
[TD="class: text-right"]19.73[/TD]
[/TR]
[TR]
[TD]Total[/TD]
[TD="class: text-right"]861[/TD]
[TD="class: text-right"]3[/TD]
[TD="class: text-right"] [/TD]
[/TR]
[TR="bgcolor: #F5F5F5"]
[TD]%[/TD]
[TD="class: text-right"]100%[/TD]
[TD="class: text-right"]0%[/TD]
[TD="class: text-right"] [/TD]
[/TR]
[TR]
[TD="colspan: 6"] Table 2 - Footnote 1 Influenza-associated hospitalizations are reported by Alberta, Manitoba, New Brunswick, Newfoundland and Labrador, Northwest Territories, Nova Scotia, Prince Edward Island and Yukon. Only hospitalizations that require intensive medical care are reported by Saskatchewan. The cumulative rate of hospitalizations is calculated using the total population by age-group in participating provinces and territories. Return to Table 2 - Footnote1referrer
[/TD]
[/TR]
[/TABLE]
[h=3]Pediatric Influenza Hospitalizations and Deaths[/h] In week 50, 45 pediatric (≤16 years of age) hospitalizations with influenza have been reported by the Immunization Monitoring Program Active (IMPACT) network (Figure 7).
To date this season, 281 pediatric hospitalizations have been (Figure 8):
99% (278) of cases have been associated with influenza A.
Among the 174 cases for which the influenza subtype was available, 172 (98.9%) were associated with A(H1N1)pdm09.
To date this season, 47 ICU admissions, and less than five deaths have been reported.
90% (41) of ICU admissions were in children under the age of 10
98% (46) of ICU admissions have been associated with influenza A.
[h=3]Figure 7 ? Number of pediatric (≤16 years of age) hospitalizations reported by the IMPACT network, by week, Canada, weeks 2018-35 to 2018-50[/h]
Figure 7 - Text description [h=3]Figure 8 - Cumulative numbers of pediatric hospitalizations (≤16 years of age) with influenza by age-group reported by the IMPACT network, Canada, weeks 2018-35 to 2018-50[/h]
Figure 8 - Text description [h=3]Adult Influenza Hospitalizations and Deaths[/h] Surveillance of laboratory-confirmed influenza-associated adult (≥16 years of age) hospitalizations by the Canadian Immunization Research Network (CIRN) Serious Outcomes Surveillance (SOS) network began on November 1st for the 2018-19 season.
To date this season, 55 hospitalizations have been reported:
49 (89%) were associated with influenza A.
29 cases (53%) were adults 65 years of age and older.
The most commonly reported comorbidity among hospitalized cases was endocrine disorders, which were reported in 67.2% of hospitalized cases.
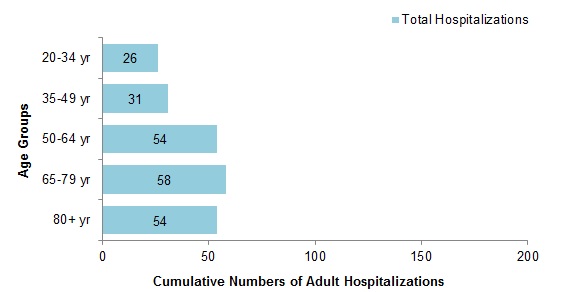
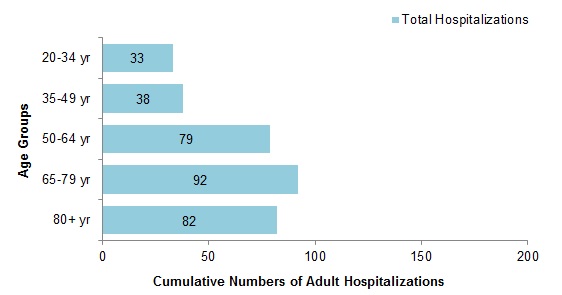
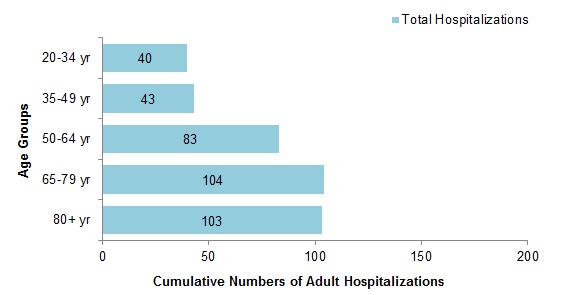
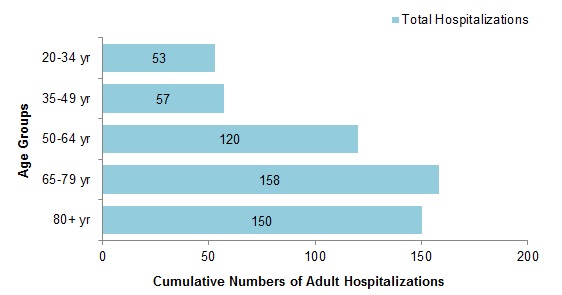
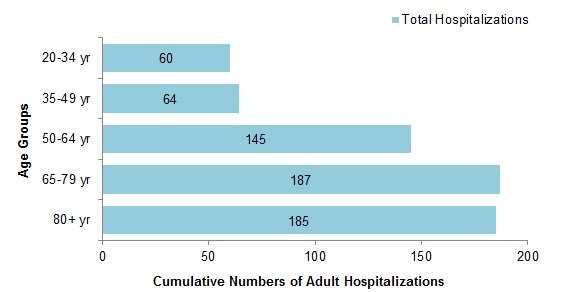
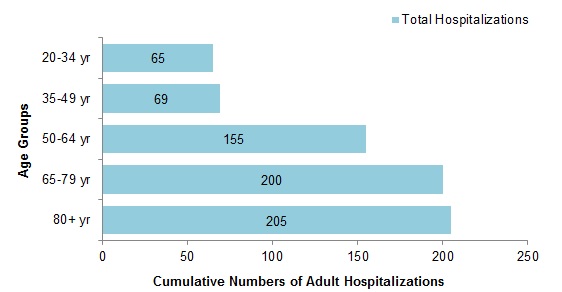
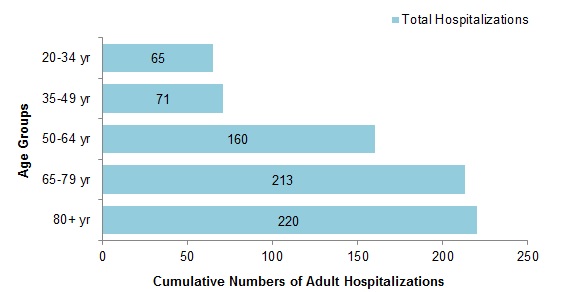
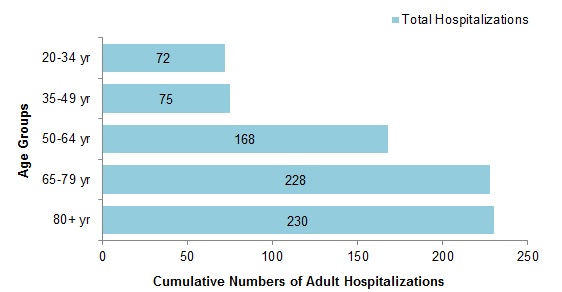
[h=3]Figure 9 - Cumulative numbers of adult hospitalizations (>20 years of age) with influenza by age-group reported by CIRN, Canada, 2018-19, weeks 2018-44 to 2018-50[/h]
Figure 9 - Text description [h=2]Influenza Strain Characterizations[/h] Since September 1, 2018, the National Microbiology Laboratory (NML) has characterized 264 influenza viruses (29 A(H3N2), 221 A(H1N1) and 14 B) that were received from Canadian laboratories.
[h=3]Genetic Characterization of Influenza A (H3N2):[/h] 24 influenza A(H3N2) viruses did not grow to sufficient hemagglutination titer for antigenic characterization by hemagglutination inhibition (HI) assay. Therefore, NML has performed genetic characterization to determine the genetic group identity of these viruses.
Sequence analysis of the HA gene of the viruses showed that:
Three viruses belonged to genetic group 3C.2a.
21 viruses belonged to subclade 3C.2a1.
A/Singapore/INFIMH-16-0019/2016-like virus belongs to genetic group 3C.2a1 and is the influenza A(H3N2) component of the 2018-19 Northern Hemisphere influenza vaccine.
[h=3]Antigenic Characterization:[/h] [h=4]Influenza A(H3N2):[/h]
Five influenza A(H3N2) virus was antigenically characterized as A/Singapore/INFIMH-16-0019/2016-like by HI testing using antiserum raised against egg-propagated A/Singapore/INFIMH-16-0019/2016.
A/Singapore/INFIMH-16-0019/2016-like virus is the influenza A(H3N2) component of the 2018-19 Northern Hemisphere influenza vaccine.
Two influenza A (H3N2) viruses characterized belonged to genetic group 3C.2a1. Sequencing is pending for the remaining three viruses.
[h=4]Influenza A(H1N1):[/h]
221 A(H1N1) viruses characterized were antigenically similar to A/Michigan/45/2015, which is the influenza A(H1N1) component of the 2018-19 Northern Hemisphere influenza vaccine.
[h=4]Influenza B:[/h] Influenza B viruses can be divided into two antigenically distinct lineages represented by B/Yamagata/16/88 and B/Victoria/2/87 viruses. The recommended influenza B components for the 2018-19 Northern Hemisphere influenza vaccine are B/Colorado/06/2017 (Victoria lineage) and B/Phuket/3073/2013 (Yamagata lineage).
14 influenza B viruses were characterized as B/Phuket/3073/2013-like, which belongs to the Yamagata lineage and is included as an influenza B component of the 2018-19 Northern Hemisphere quadrivalent influenza vaccine.
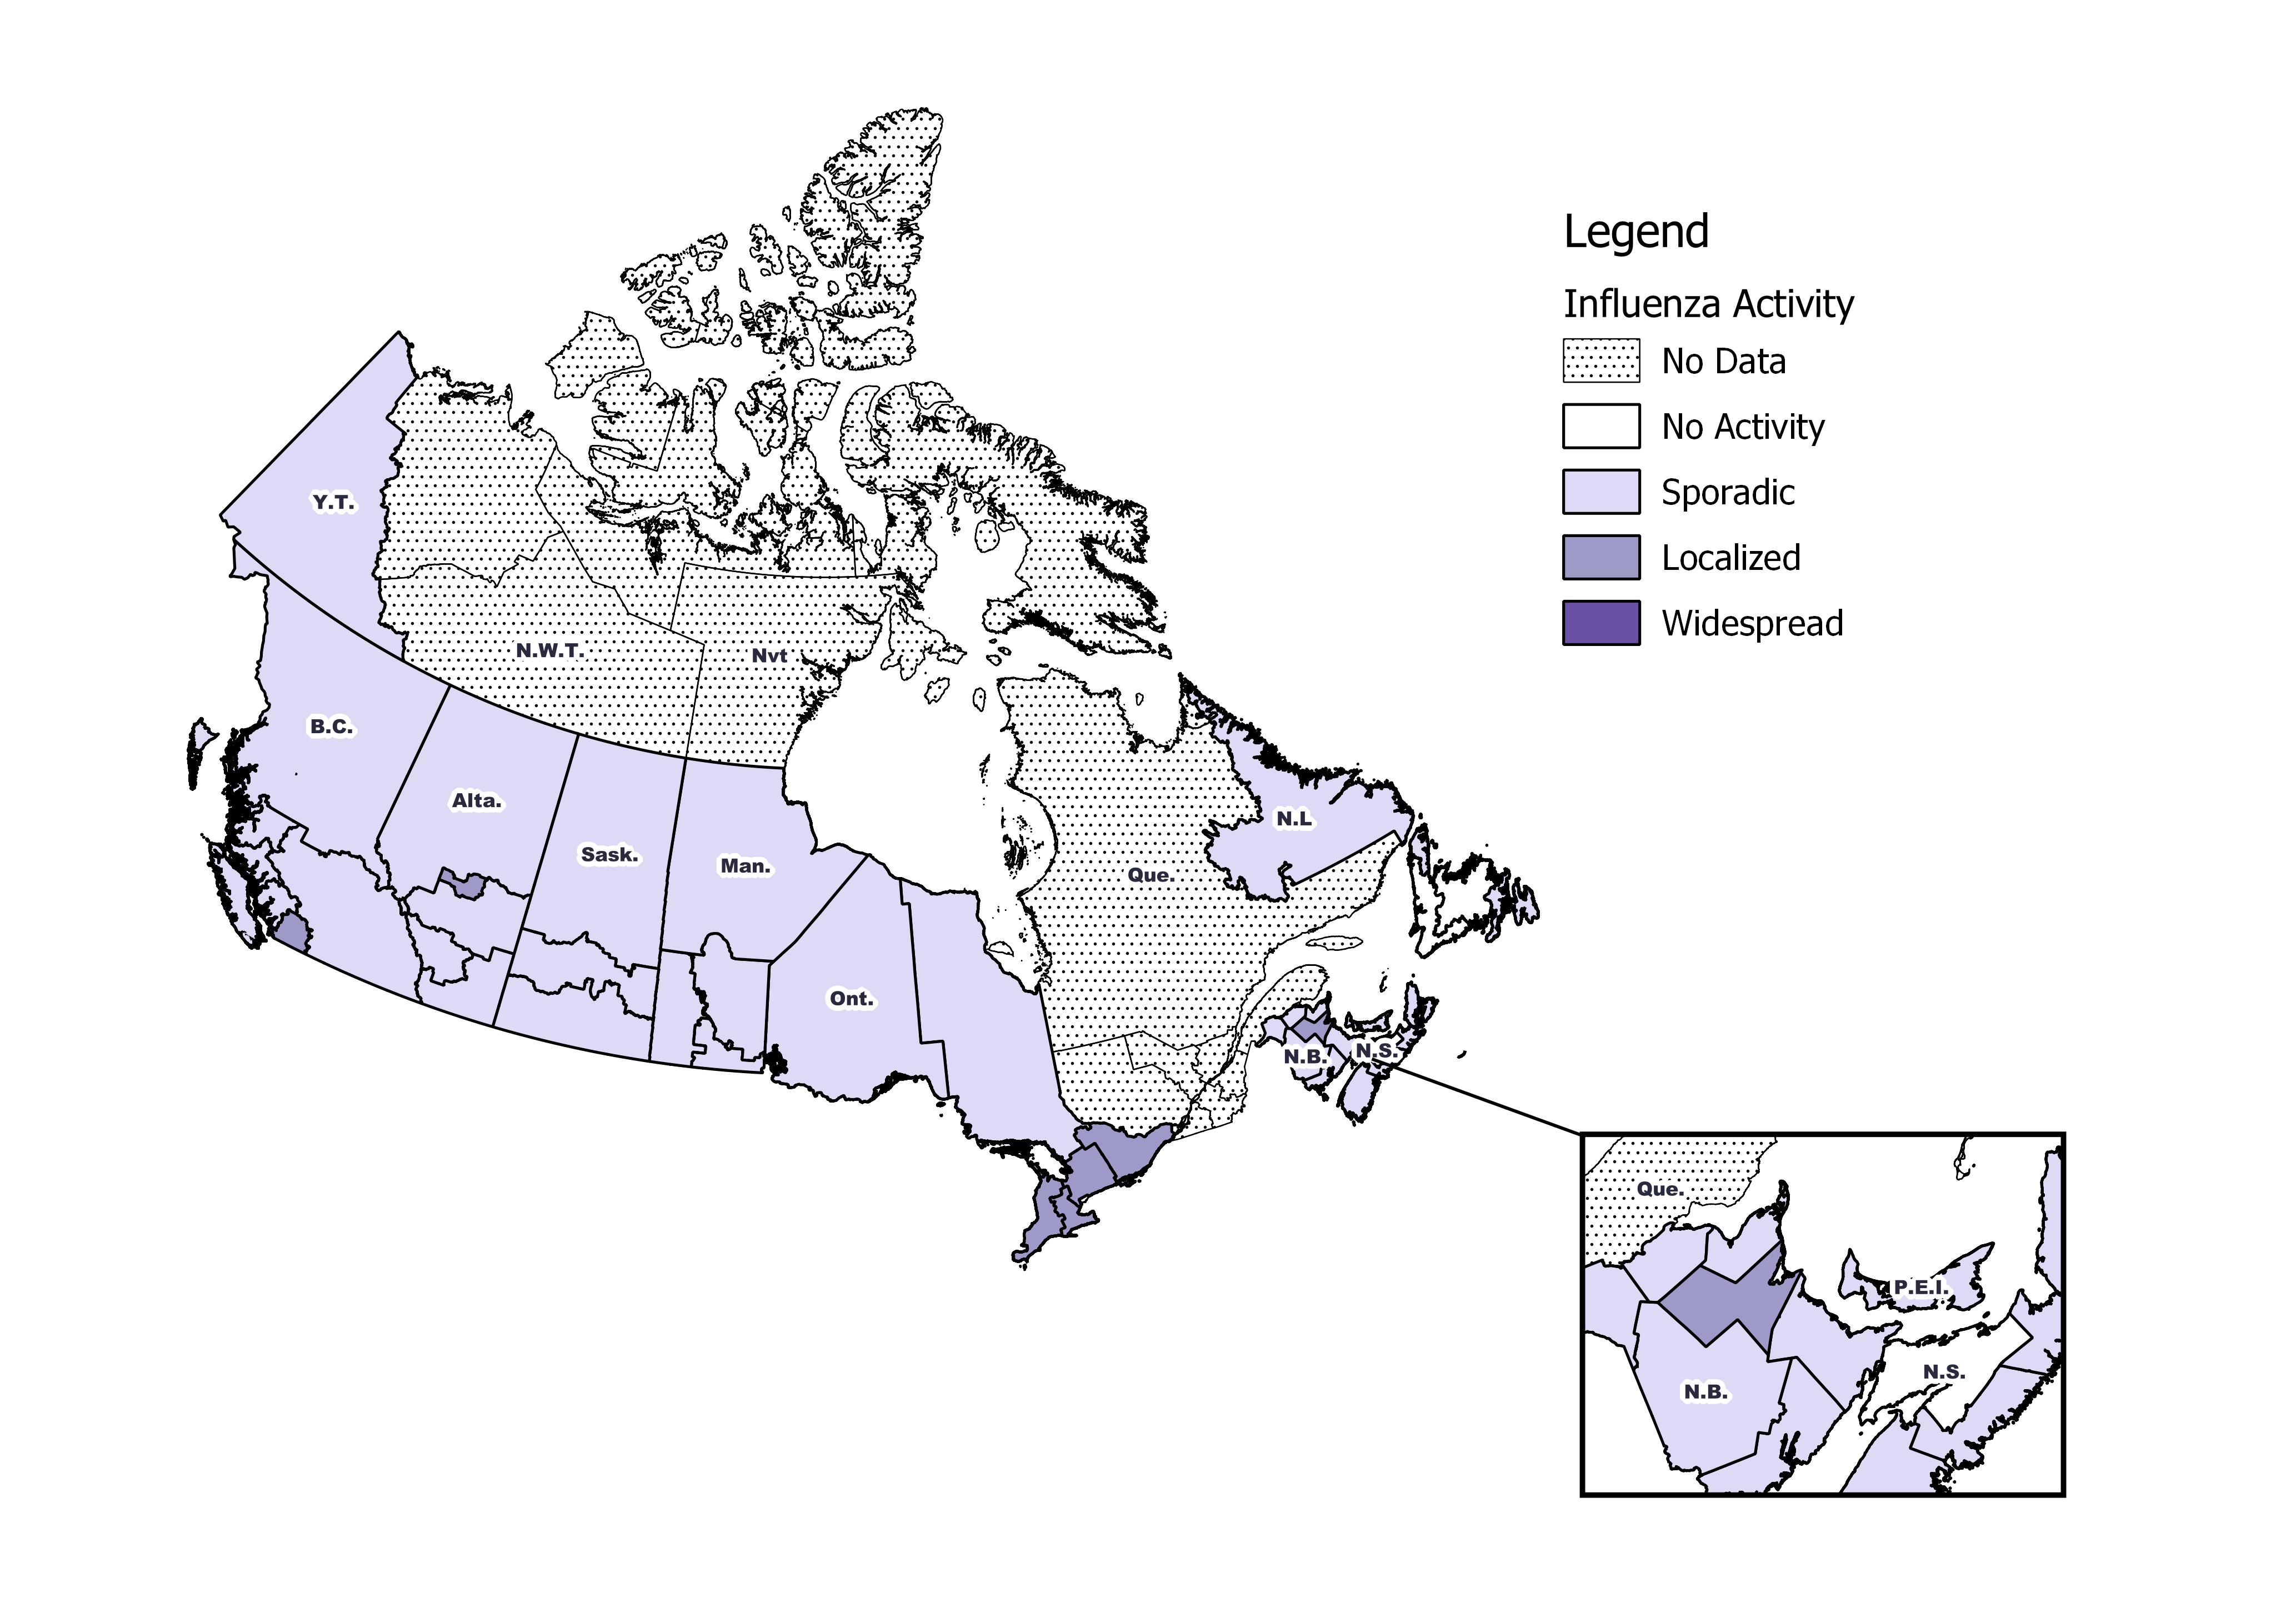
[h=2]Influenza/Influenza-like Illness Activity (geographic spread)[/h] During week 52, influenza activity levels continued to increase (Figure 1):
7 regions reported localized activity: in Alta.(1), Ont.(4), B.C.(1), and N.B.(1)
Sporadic activity was reported by 31 regions: in B.C.(4), Alta.(4), Sask.(3), Man.(5), Ont.(2), N.B.(6), N.S.(3), N.L.(2), P.E.I.(1), and Yt.(1).
No activity was reported by 3 regions.
No data was reported by 12 regions.
[h=3]Figure 1 ? Map of overall influenza/ILI activity by province and territory, Canada, week 2018-52[/h] Figure 1 - Text description [h=2]Laboratory Confirmed Influenza Detections[/h] In weeks 51 and 52, the following results were reported from sentinel laboratories across Canada (Figure 2):
The percentage of tests positive for influenza continued to increase from 25.1% in week 51 to 29.4% in week 52.
A total 3,387 laboratory detections of influenza were reported, of which 99% were influenza A.
To date this season 13,796 laboratory-confirmed influenza detections have been reported (Figure 3):
99% have been influenza A.
Among the 6,007 influenza A viruses subtyped, 94% have been A(H1N1)pdm09.
Provincial and territorial differences in influenza type/subtype distribution are observed.
To date this season, detailed information on age and type/subtype has been received for 11,531 laboratory-confirmed influenza cases (Table 1):
68% of all influenza A(H1N1)pdm09 detections have been reported in individuals younger than 45 years of age.
63% of all influenza A(H3N2) detections have been reported in adults 65 years of age and older.
For more detailed weekly and cumulative influenza data, see the text descriptions for Figures 2 and 3 or the Respiratory Virus Detections in Canada Report.
[h=3]Figure 2 ? Number of positive influenza tests and percentage of tests positive, by type, subtype and report week, Canada, weeks 2018-35 to 2018-52[/h]
The shaded area indicates weeks where the positivity rate was at least 5% and a minimum of 15 positive tests were observed, signalling the period of seasonal influenza activity.
Figure 2 - Text description [h=3]Figure 3 ? Cumulative numbers of positive influenza specimens by type/subtype and province/territory, Canada, weeks 2018-35 to 2018-52[/h]
Figure 3 - Text description [TABLE="class: table table-striped table-bordered table-hover table-condensed, width: 1140"]
Table 1 ? Cumulative numbers of positive influenza specimens by type, subtype and age-group reported through case-based laboratory reporting, Canada, weeks 2018-35 to 2018-52 [TR="class: bg-primary, bgcolor: #2572B4"]
Age groups (years) Cumulative (August 26, 2018 to December 29, 2018) [/TR]
[TR="class: bg-primary, bgcolor: #2572B4"]
Influenza A B Influenza A and B [/TR]
[TR="class: bg-primary, bgcolor: #2572B4"]
A Total A(H1) pdm09 A(H3) A (UnS)Footnote1 Total # % [/TR]
[TR="bgcolor: #F5F5F5"]
[TD]0-4[/TD]
[TD="class: text-right"]2512[/TD]
[TD="class: text-right"]1058[/TD]
[TD="class: text-right"]12[/TD]
[TD="class: text-right"]1442[/TD]
[TD="class: text-right"]18[/TD]
[TD="class: text-right"]2530[/TD]
[TD="class: text-right"]22%[/TD]
[/TR]
[TR]
[TD]5-19[/TD]
[TD="class: text-right"]2149[/TD]
[TD="class: text-right"]968[/TD]
[TD="class: text-right"]9[/TD]
[TD="class: text-right"]1172[/TD]
[TD="class: text-right"]23[/TD]
[TD="class: text-right"]2172[/TD]
[TD="class: text-right"]19%[/TD]
[/TR]
[TR="bgcolor: #F5F5F5"]
[TD]20-44[/TD]
[TD="class: text-right"]2634[/TD]
[TD="class: text-right"]1118[/TD]
[TD="class: text-right"]46[/TD]
[TD="class: text-right"]1470[/TD]
[TD="class: text-right"]16[/TD]
[TD="class: text-right"]2650[/TD]
[TD="class: text-right"]23%[/TD]
[/TR]
[TR]
[TD]45-64[/TD]
[TD="class: text-right"]2302[/TD]
[TD="class: text-right"]935[/TD]
[TD="class: text-right"]60[/TD]
[TD="class: text-right"]1307[/TD]
[TD="class: text-right"]18[/TD]
[TD="class: text-right"]2320[/TD]
[TD="class: text-right"]20%[/TD]
[/TR]
[TR="bgcolor: #F5F5F5"]
[TD]65+[/TD]
[TD="class: text-right"]1830[/TD]
[TD="class: text-right"]568[/TD]
[TD="class: text-right"]214[/TD]
[TD="class: text-right"]1048[/TD]
[TD="class: text-right"]29[/TD]
[TD="class: text-right"]1859[/TD]
[TD="class: text-right"]16%[/TD]
[/TR]
[TR]
[TD]Total[/TD]
[TD="class: text-right"]11427[/TD]
[TD="class: text-right"]4647[/TD]
[TD="class: text-right"]341[/TD]
[TD="class: text-right"]6439[/TD]
[TD="class: text-right"]104[/TD]
[TD="class: text-right"]11531[/TD]
[TD="class: text-right"]100%[/TD]
[/TR]
[TR]
[TD="colspan: 8"] Table 1 - Note 1 UnS: unsubtyped: The specimen was typed as influenza A, but no result for subtyping was available; Return to Table 1 - Note1
[/TD]
[/TR]
[/TABLE]
[h=2]Syndromic/Influenza-like Illness Surveillance[/h] [h=3]Healthcare Professionals Sentinel Syndromic Surveillance[/h] In week 50, 1.6% of visits to healthcare professionals were due to influenza-like illness (ILI) (Figure 4). In weeks 51 and 52, an insufficient number of sentinels reported ILI activity. Data will be updated in the report for week 01.
[h=3]Figure 4 ? Percentage of visits for ILI reported by sentinels by report week, Canada, weeks 2018-35 to 2018-50[/h] Number of Sentinels Reporting in Week 50: 115
The shaded area represents the maximum and minimum percentage of visits for ILI reported by week from seasons 2013-14 to 2017-18
Figure 4 - Text description [h=2]Participatory Syndromic Surveillance[/h] In week 52, 1,947 participants reported to FluWatchers, of which 70 (4%) reported symptoms of cough and fever (Figure 5).
Among the 70 participants who reported fever and cough:
27% consulted a healthcare professional;
63% reported days missed from work or school, resulting in a combined total of 150 missed days of work or school.
[h=3]Figure 5 ? Percentage of participants reporting cough and fever, Canada, weeks 2018-40 to 2018-52[/h] Number of Participants Reporting in Week 52: 1,947
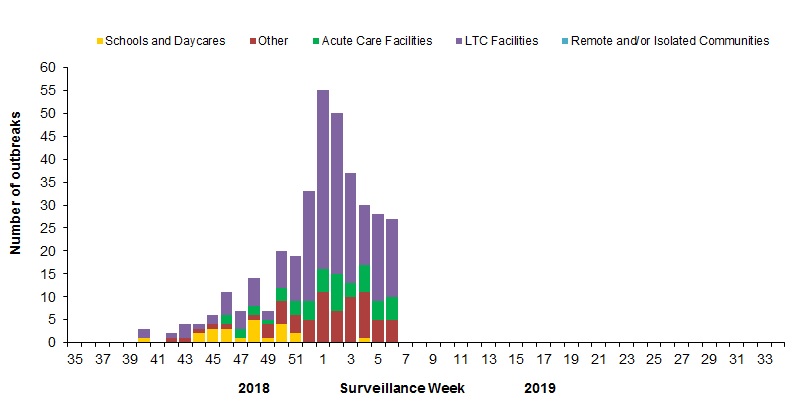
Figure 5 - Text description [h=2]Influenza Outbreak Surveillance[/h] In weeks 51 and 52, 15 new laboratory-confirmed influenza outbreaks were reported: long-term care facilities (LTCF) (4), acute care facilities (6), schools (1), and other settings (4).
To date this season, 86 laboratory-confirmed influenza outbreaks have been reported (Figure 6):
37 outbreaks were in LTCF, 17 were in schools, 14 in acute care facilities, and 18 were in other settings.
All of the 73 outbreaks for which the influenza type was available were associated with influenza A.
Among the 50 outbreaks for which the influenza A subtype was available:
82% (41) were associated with influenza A(H1N1)pdm09;
18% (9) were associated with A(H3N2),
To date this season, 38 ILI outbreaks have been reported; 28 occurred in LTCF, seven in schools, and three in acute care facilities.
[h=3]Figure 6 ? Number of new outbreaks of laboratory-confirmed influenza by report week, Canada, weeks 2018-35 to 2018-52[/h]
Figure 6 - Text description [h=2]Severe Outcomes Influenza Surveillance[/h] [h=3]Provincial/Territorial Influenza Hospitalizations and Deaths[/h] To date this season, 1046 influenza-associated hospitalizations have been reported by participating provinces and territoriesFootnote1. Hospitalizations (Table 2):
99.6% (1042) were associated with influenza A
The highest estimated rate of hospitalization is among children under 5 years of age.
Intensive Care Unit (ICU) cases and deaths:
To date this season 119 ICU admissions and 24 deaths have been reported.
44% (52) of reported ICU admissions were in adults aged 45-64 years.
All reported deaths were associated with influenza A.
Footnote 1 Influenza-associated hospitalizations are reported by Alberta, Manitoba, New Brunswick, Newfoundland and Labrador, Northwest Territories, Nova Scotia, Prince Edward Island and Yukon. Only hospitalizations that require intensive medical care are reported by Saskatchewan. The cumulative rate of hospitalizations is calculated using the total population by age-group in participating provinces and territories. Return to footnote1referrer
[TABLE="class: table table-striped table-bordered table-hover table-condensed, width: 1140"]
Table 2 ? Cumulative number and estimated rate of hospitalizations by age-group reported by participating provinces and territoriesFootnote1, Canada, weeks 2018-35 to 2018-52 [TR="class: bg-primary, bgcolor: #2572B4"]
Age Groups Cumulative (August 26, 2018 to December 29, 2018) [/TR]
[TR="class: bg-primary, bgcolor: #2572B4"]
Influenza A Influenza B Rate per 100,000 population [/TR]
[TR="bgcolor: #F5F5F5"]
[TD]0-4[/TD]
[TD="class: text-right"]179[/TD]
[TD="class: text-right"]1[/TD]
[TD="class: text-right"]37.82[/TD]
[/TR]
[TR]
[TD]5-19[/TD]
[TD="class: text-right"]124[/TD]
[TD="class: text-right"]0[/TD]
[TD="class: text-right"]8.94[/TD]
[/TR]
[TR="bgcolor: #F5F5F5"]
[TD]20-44[/TD]
[TD="class: text-right"]164[/TD]
[TD="class: text-right"]0[/TD]
[TD="class: text-right"]5.76[/TD]
[/TR]
[TR]
[TD]45-64[/TD]
[TD="class: text-right"]272[/TD]
[TD="class: text-right"]0[/TD]
[TD="class: text-right"]12.50[/TD]
[/TR]
[TR="bgcolor: #F5F5F5"]
[TD]65+[/TD]
[TD="class: text-right"]303[/TD]
[TD="class: text-right"]3[/TD]
[TD="class: text-right"]25.15[/TD]
[/TR]
[TR]
[TD]Total[/TD]
[TD="class: text-right"]1042[/TD]
[TD="class: text-right"]4[/TD]
[TD] [/TD]
[/TR]
[TR="bgcolor: #F5F5F5"]
[TD]%[/TD]
[TD="class: text-right"]99.6[/TD]
[TD="class: text-right"]0.4[/TD]
[TD] [/TD]
[/TR]
[TR]
[TD="colspan: 4"] Table 2 - Footnote 1 Influenza-associated hospitalizations are reported by Alberta, Manitoba, New Brunswick, Newfoundland and Labrador, Northwest Territories, Nova Scotia, Prince Edward Island and Yukon. Only hospitalizations that require intensive medical care are reported by Saskatchewan. The cumulative rate of hospitalizations is calculated using the total population by age-group in participating provinces and territories. Return to Table 2 - Footnote1referrer
[/TD]
[/TR]
[/TABLE]
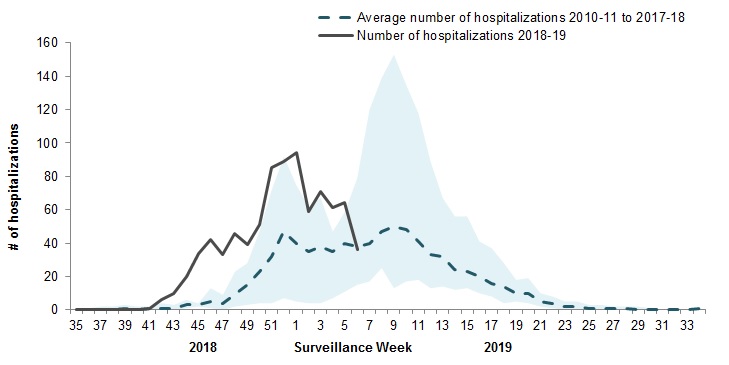
[h=3]Pediatric Influenza Hospitalizations and Deaths[/h] In weeks 51 and 52, 133 pediatric (≤16 years of age) hospitalizations with influenza have been reported by the Immunization Monitoring Program Active (IMPACT) network (Figure 7).
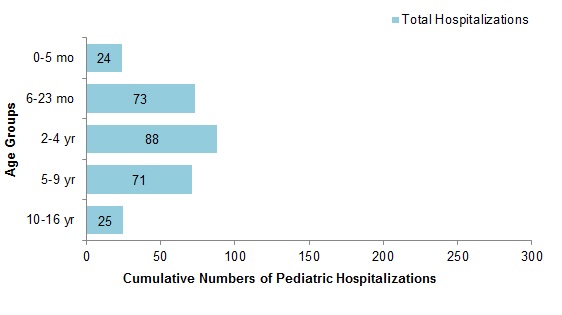
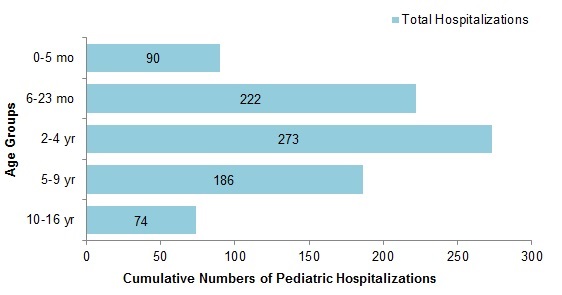
To date this season, 414 pediatric hospitalizations have been reported (Figure 8):
99% (408) of cases have been associated with influenza A.
Among the 203 cases for which the influenza subtype was available, 199 (98%) were associated with A(H1N1)pdm09.
To date this season, 71 ICU admissions, and less than five deaths have been reported.
85% (60) of ICU admissions were in children under the age of 10
99% (69) of ICU admissions have been associated with influenza A.
[h=3]Figure 7 ? Number of pediatric (≤16 years of age) hospitalizations reported by the IMPACT network, by week, Canada, weeks 2018-35 to 2018-52[/h]
Figure 7 - Text description [h=3]Figure 8 - Cumulative numbers of pediatric hospitalizations (≤16 years of age) with influenza by age-group reported by the IMPACT network, Canada, weeks 2018-35 to 2018-52[/h]
Figure 8 - Text description [h=3]Adult Influenza Hospitalizations and Deaths[/h] Surveillance of laboratory-confirmed influenza-associated adult (≥16 years of age) hospitalizations by the Canadian Immunization Research Network (CIRN) Serious Outcomes Surveillance (SOS) network began on November 1st for the 2018-19 season.
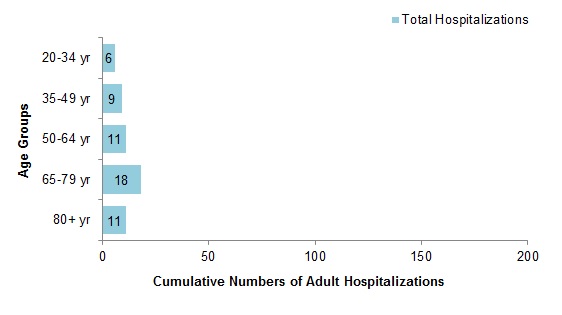
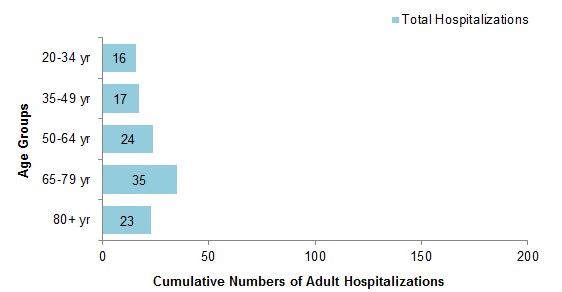
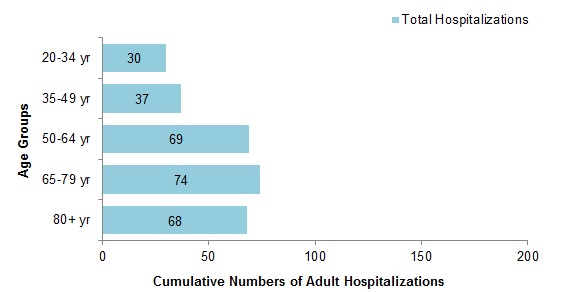
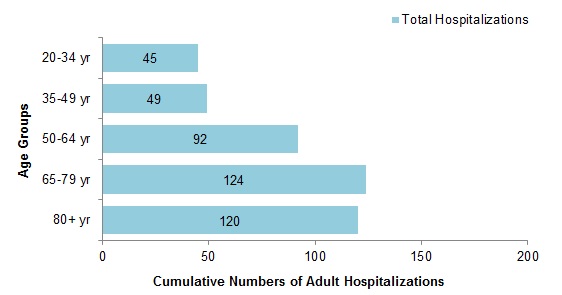
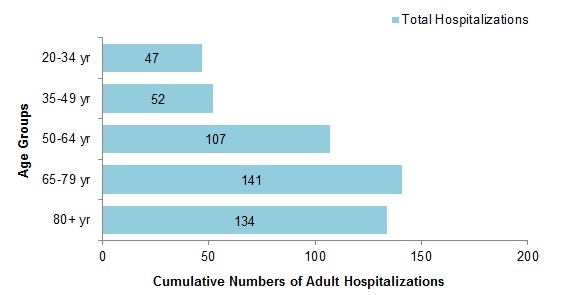
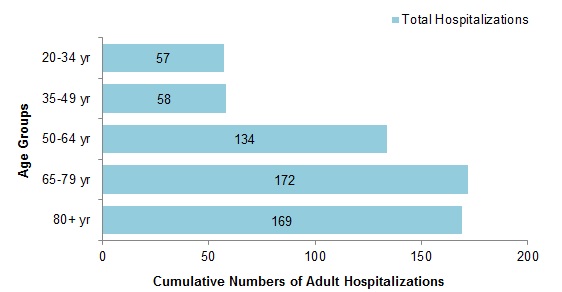
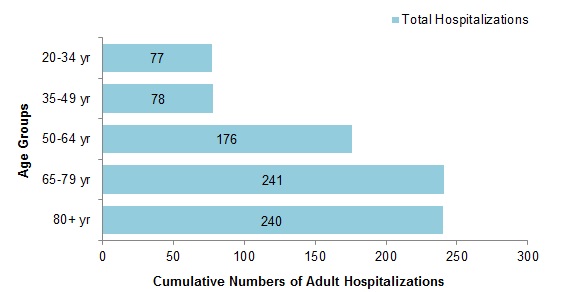
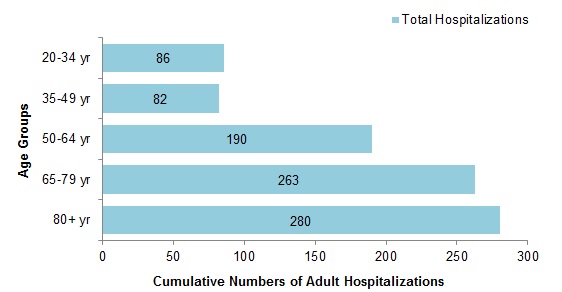
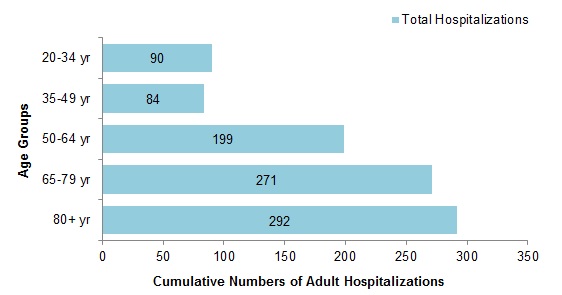
To date this season, 115 hospitalizations have been reported (Figure 9):
108 (94%) were associated with influenza A.
58 cases (50%) were adults 65 years of age and older.
The most commonly reported comorbidity among hospitalized cases was endocrine disorders, which were reported in 84% of hospitalized cases.
[h=3]Figure 9 - Cumulative numbers of adult hospitalizations (>20 years of age) with influenza by age-group reported by CIRN, Canada, 2018-19, weeks 2018-44 to 2018-52[/h]
Figure 9 - Text description [h=2]Influenza Strain Characterizations[/h] Since September 1, 2018, the National Microbiology Laboratory (NML) has characterized 395 influenza viruses (30 A(H3N2), 350 A(H1N1) and 15 B) that were received from Canadian laboratories.
[h=3]Genetic Characterization of Influenza A (H3N2):[/h] 24 influenza A(H3N2) viruses did not grow to sufficient hemagglutination titer for antigenic characterization by hemagglutination inhibition (HI) assay. Therefore, NML has performed genetic characterization to determine the genetic group identity of these viruses.
Sequence analysis of the HA gene of the viruses showed that:
Three viruses belonged to genetic group 3C.2a.
21 viruses belonged to subclade 3C.2a1.
A/Singapore/INFIMH-16-0019/2016-like virus belongs to genetic group 3C.2a1 and is the influenza A(H3N2) component of the 2018-19 Northern Hemisphere influenza vaccine.
[h=3]Antigenic Characterization:[/h] [h=4]Influenza A(H3N2):[/h]
Six influenza A(H3N2) virus was antigenically characterized as A/Singapore/INFIMH-16-0019/2016-like by HI testing using antiserum raised against egg-propagated A/Singapore/INFIMH-16-0019/2016.
A/Singapore/INFIMH-16-0019/2016-like virus is the influenza A(H3N2) component of the 2018-19 Northern Hemisphere influenza vaccine.
Four influenza A (H3N2) viruses characterized belonged to genetic group 3C.2a1. Sequencing is pending for the remaining three viruses.
[h=4]Influenza A(H1N1):[/h]
345 A(H1N1) viruses characterized were antigenically similar to A/Michigan/45/2015, which is the influenza A(H1N1) component of the 2018-19 Northern Hemisphere influenza vaccine.
Five viruses showed reduced titer with ferret antisera raised against cell culture-propagated A/Michigan/45/2015
[h=4]Influenza B:[/h] Influenza B viruses can be divided into two antigenically distinct lineages represented by B/Yamagata/16/88 and B/Victoria/2/87 viruses. The recommended influenza B components for the 2018-19 Northern Hemisphere influenza vaccine are B/Colorado/06/2017 (Victoria lineage) and B/Phuket/3073/2013 (Yamagata lineage).
One influenza B virus was characterized as B/Colorado/06/2017, which belongs to the Victoria lineage and is included as an influenza B component of the 2018-19 Northern Hemisphere influenza vaccine
14 influenza B viruses were characterized as B/Phuket/3073/2013-like, which belongs to the Yamagata lineage and is included as an influenza B component of the 2018-19 Northern Hemisphere quadrivalent influenza vaccine.
In week 01, laboratory detections declined from the previous week suggesting that nationally the influenza season may have reached peak levels in the last week of December.
Overall, influenza activity remains high in Canada.
Influenza A is the most common influenza virus circulating in Canada, and the majority of these viruses are A(H1N1)pdm09.
The majority of lab confirmations and hospitalizations have been among individuals under the age of 65.
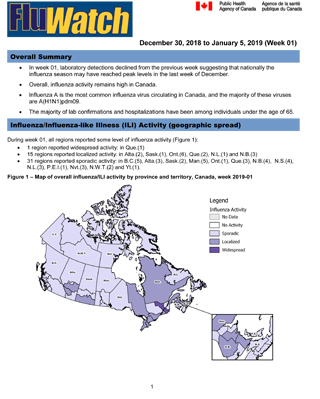
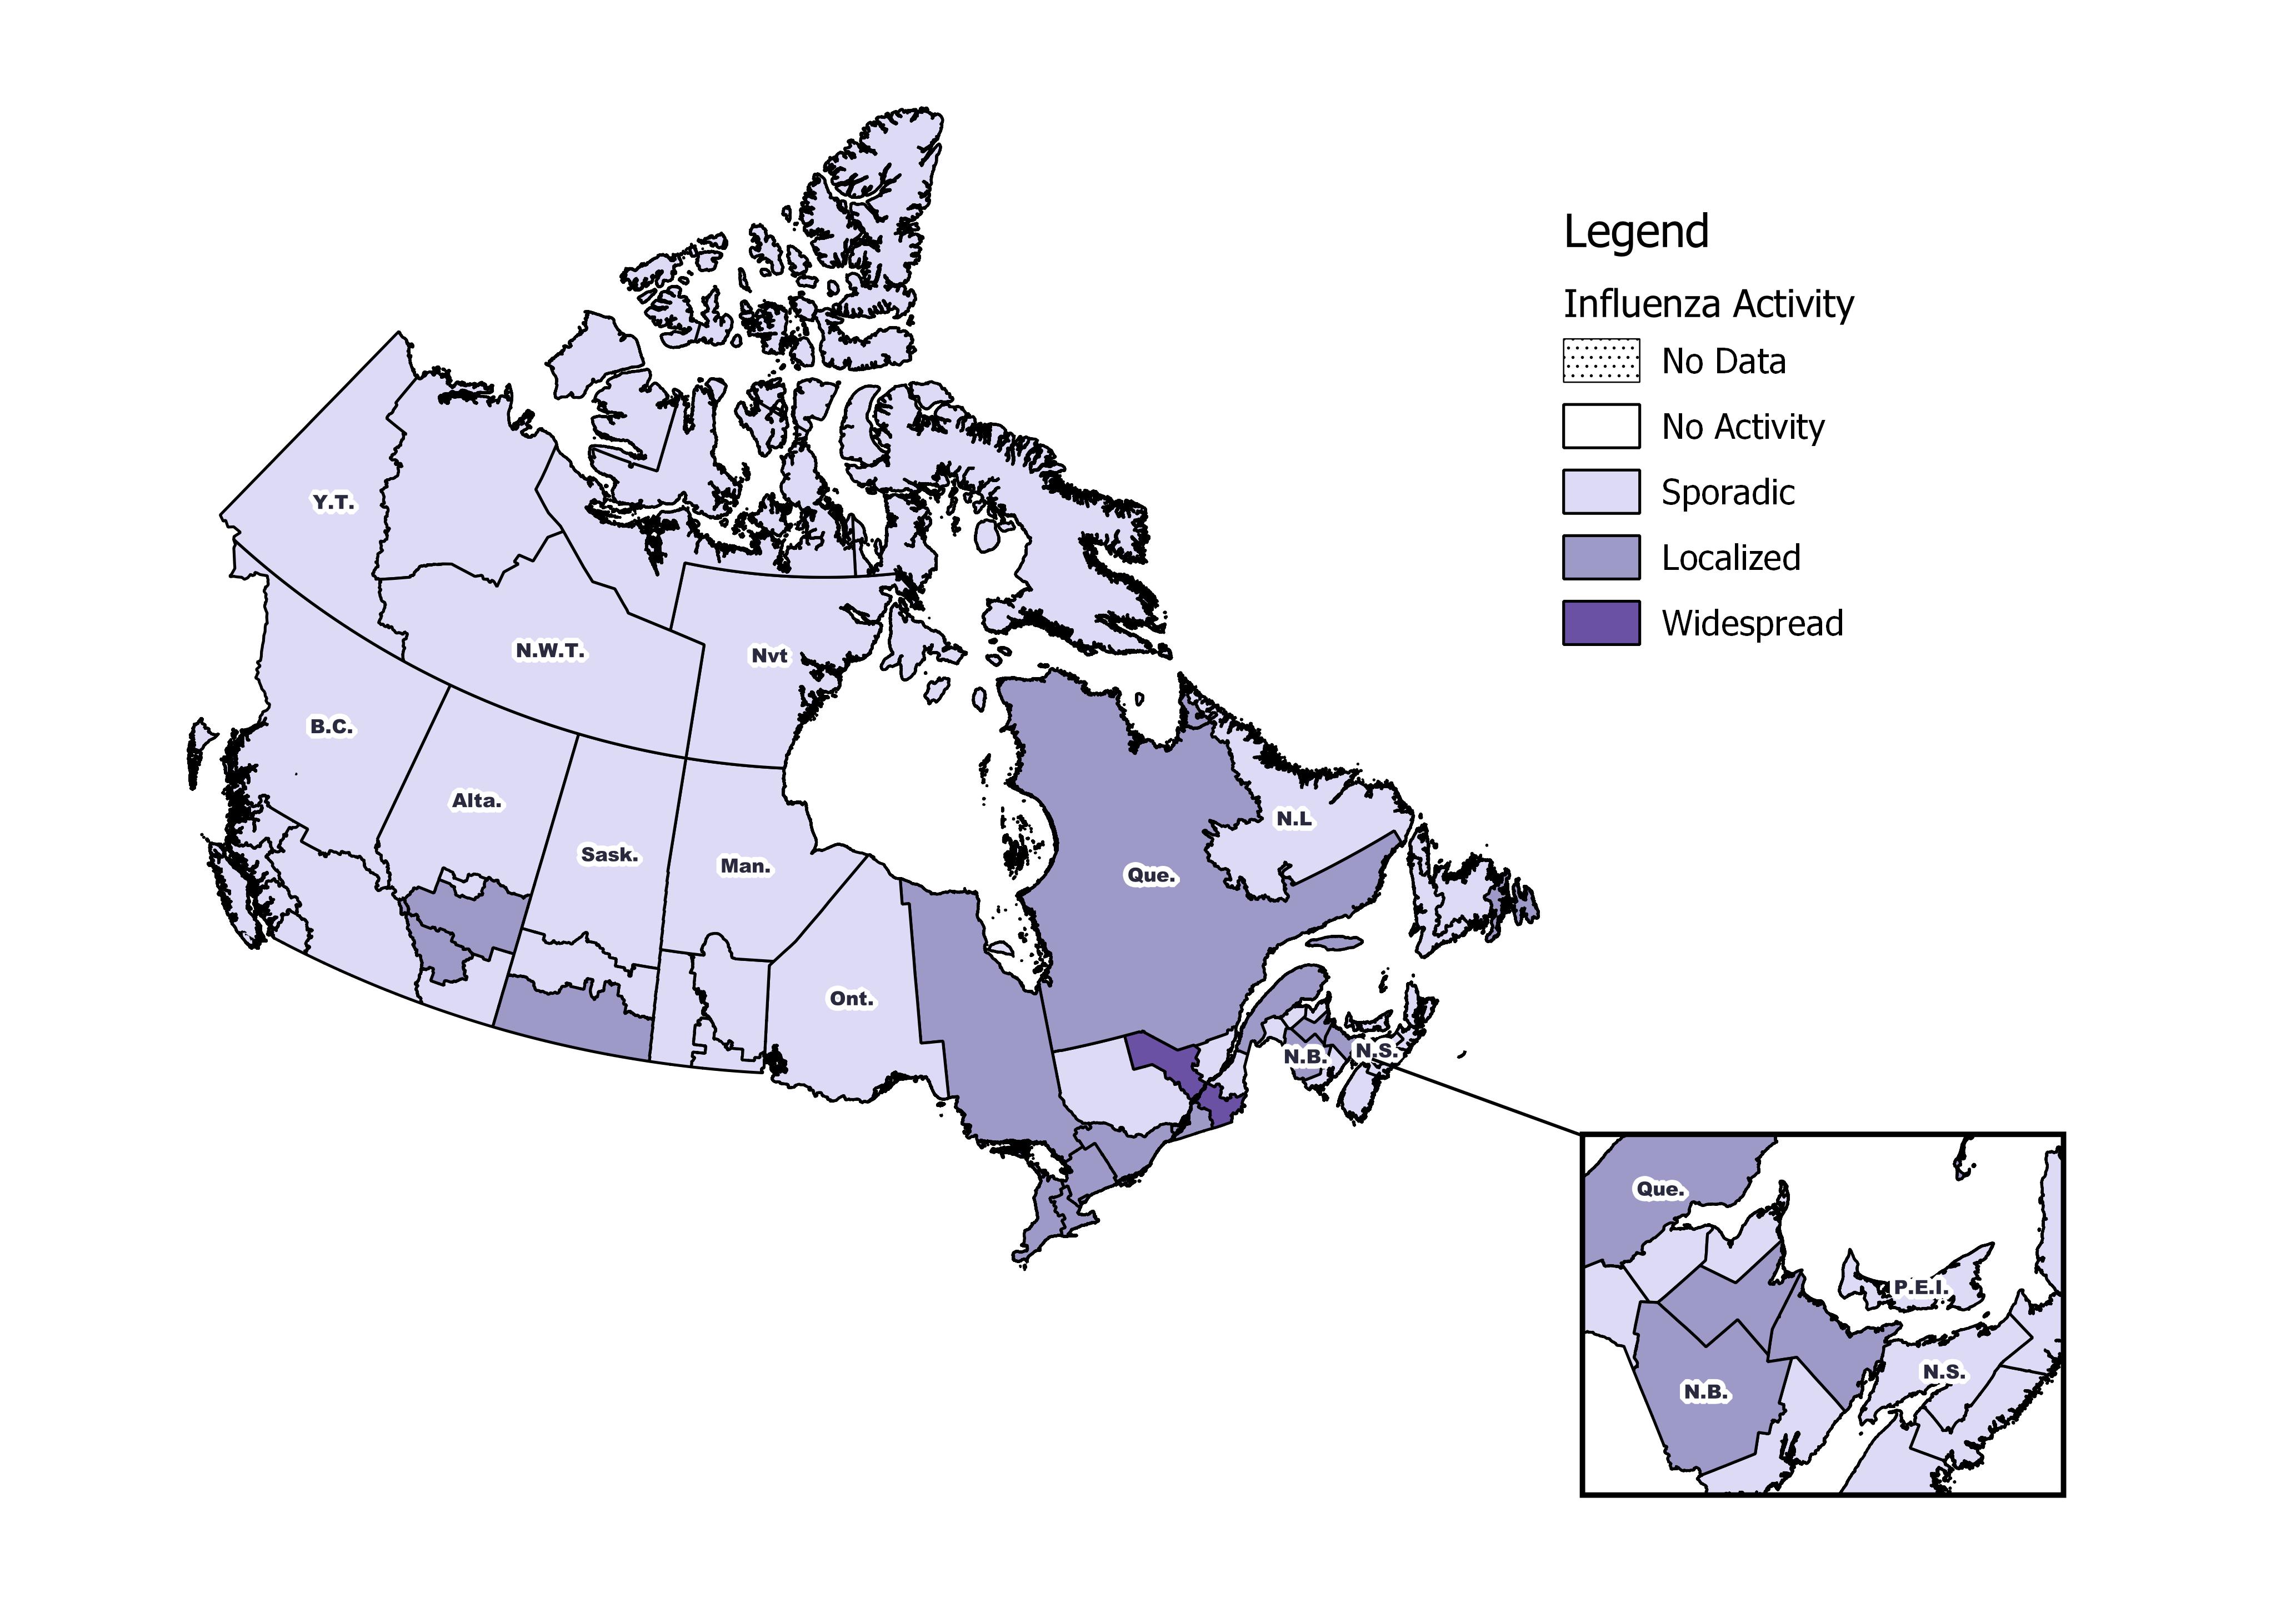
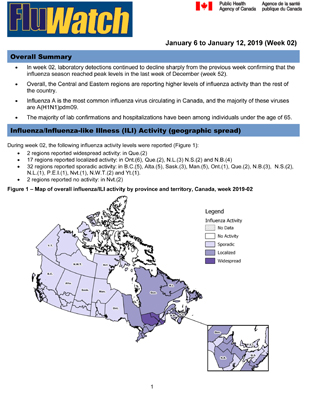
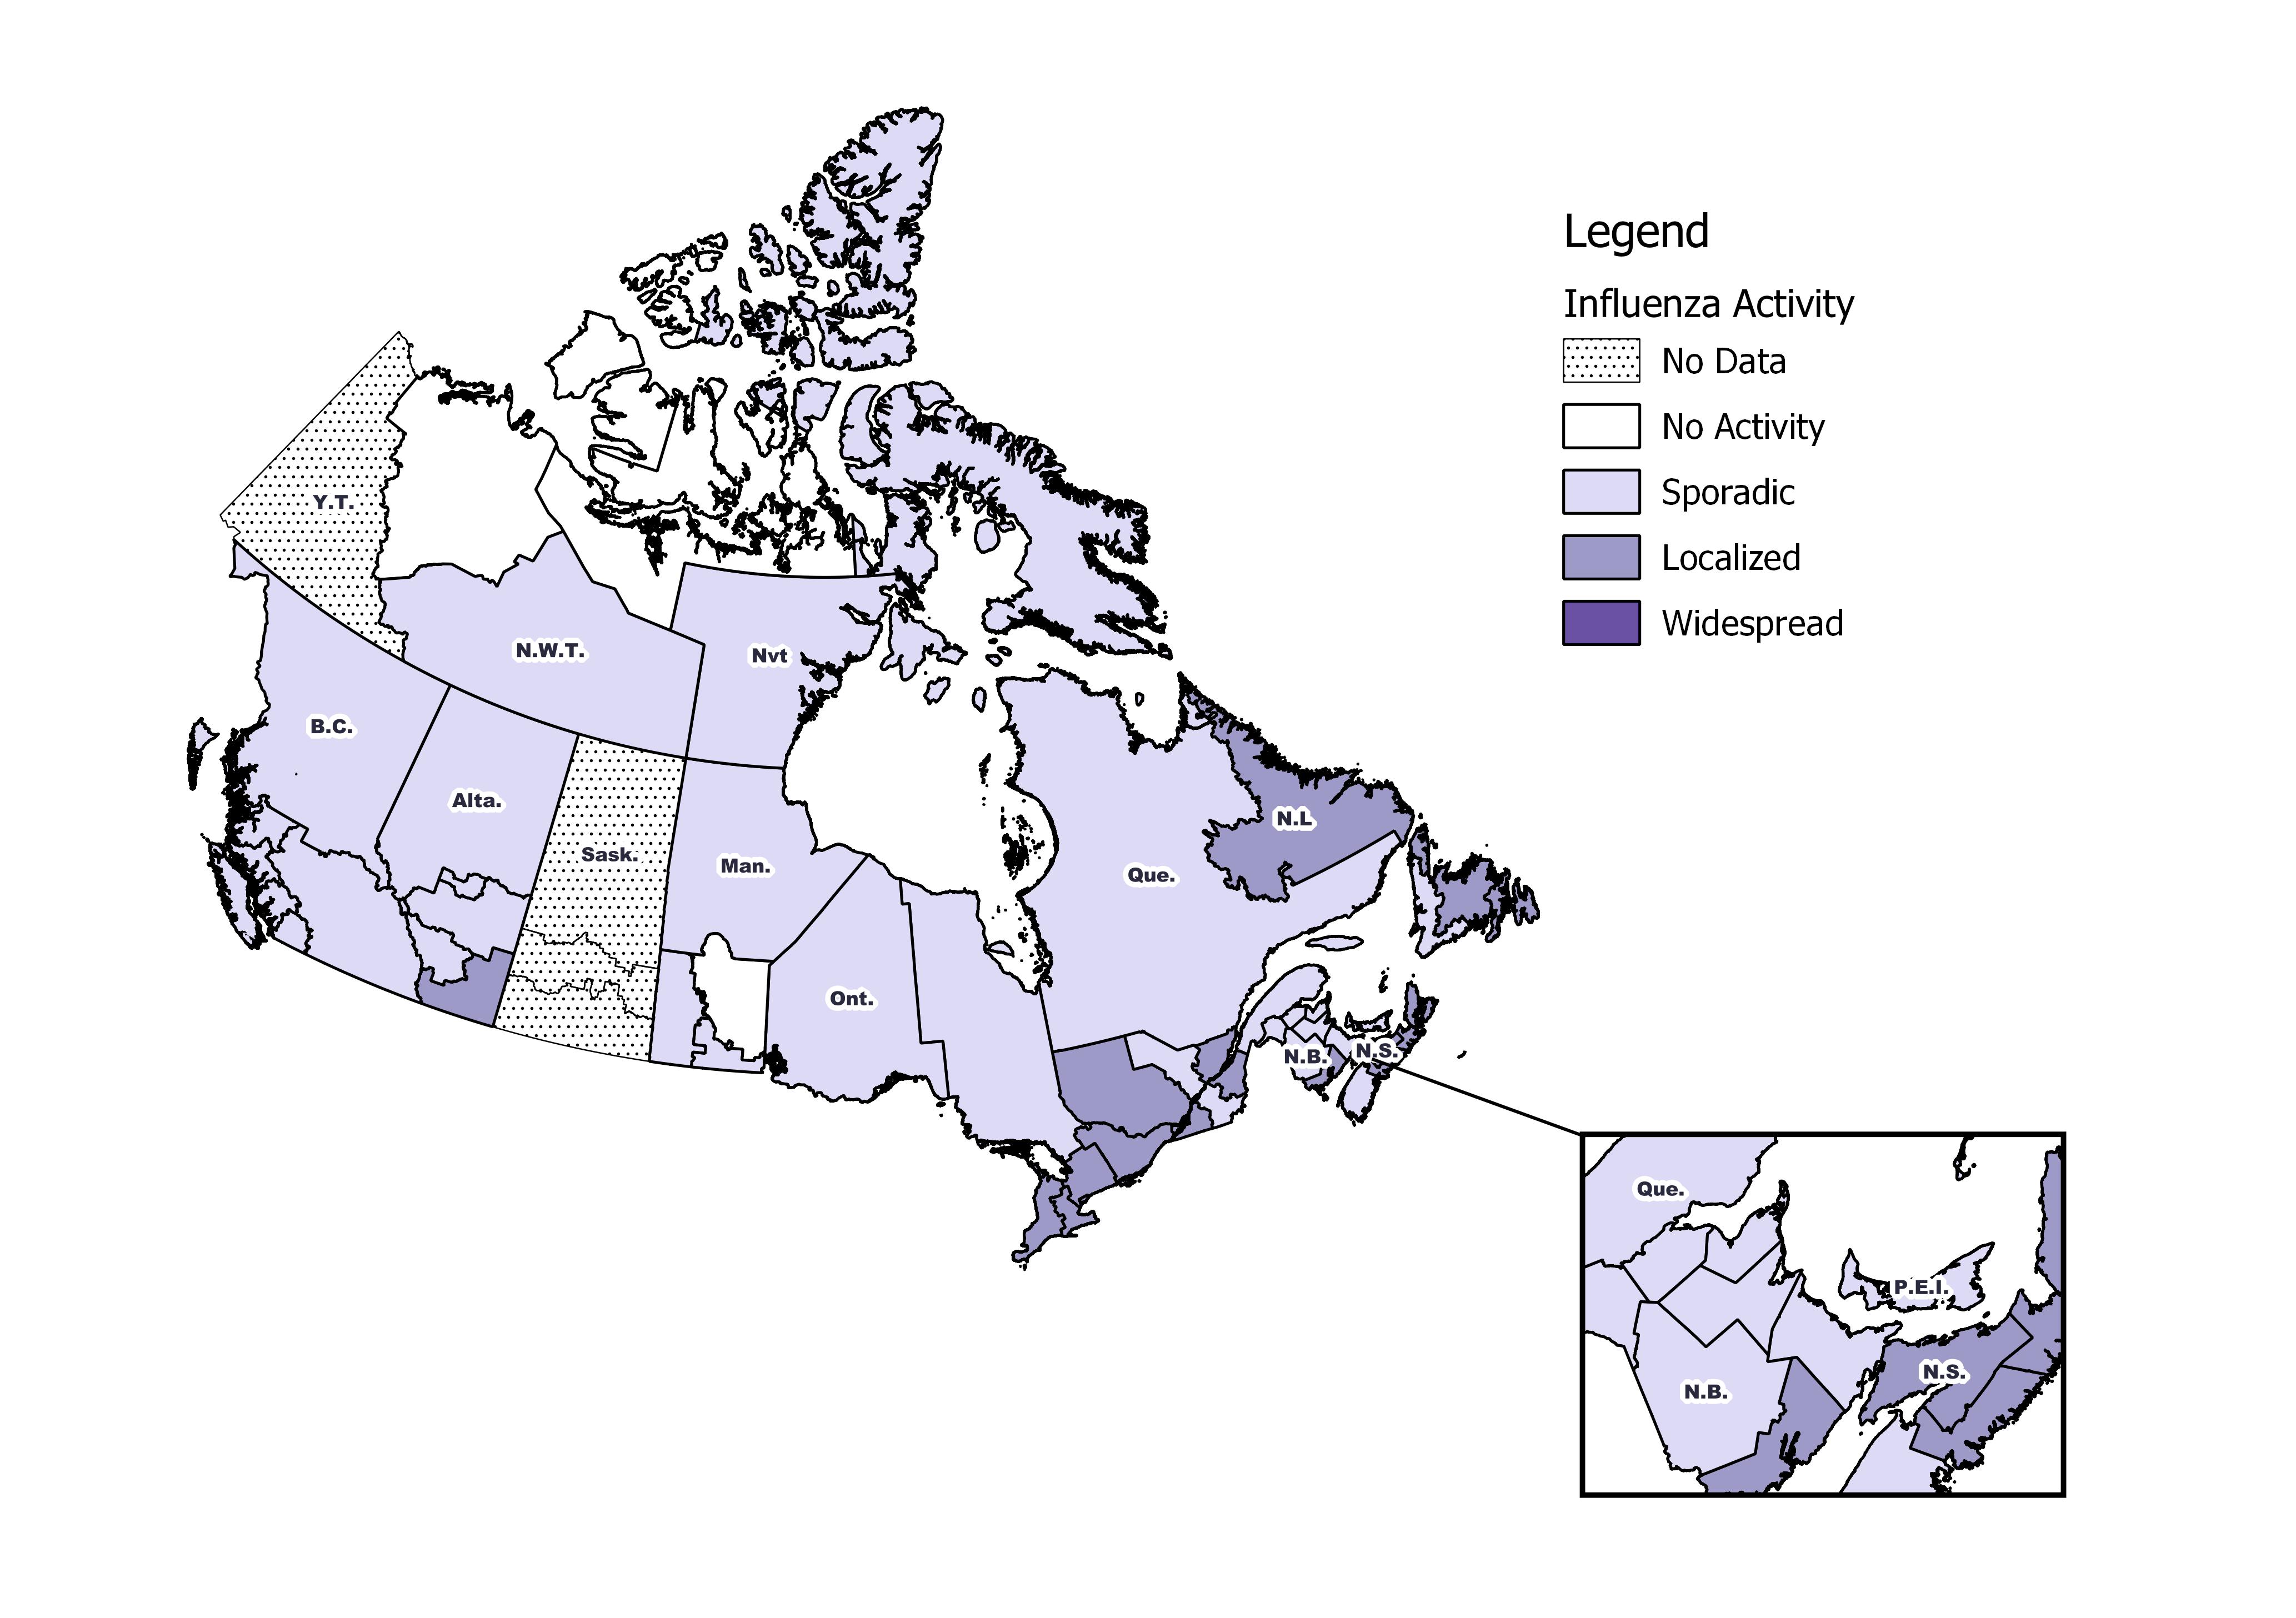
[h=2]Influenza/Influenza-like Illness Activity (geographic spread)[/h] During week 01, all regions reported some level of influenza activity (Figure 1):
1 region reported widespread activity: in Que.(1)
15 regions reported localized activity: in Alta.(2), Sask.(1), Ont.(6), Que.(2), N.L.(1) and N.B.(3)
31 regions reported sporadic activity: in B.C.(5), Alta.(3), Sask.(2), Man.(5), Ont.(1), Que.(3), N.B.(4), N.S.(4), N.L.(3), P.E.I.(1), Nvt.(3), N.W.T.(2) and Yt.(1).
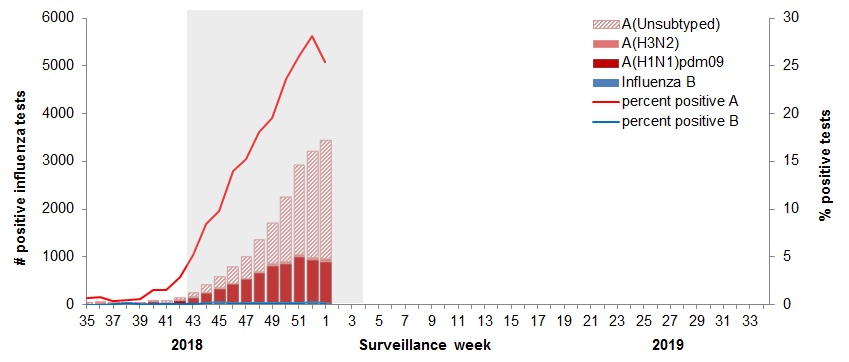
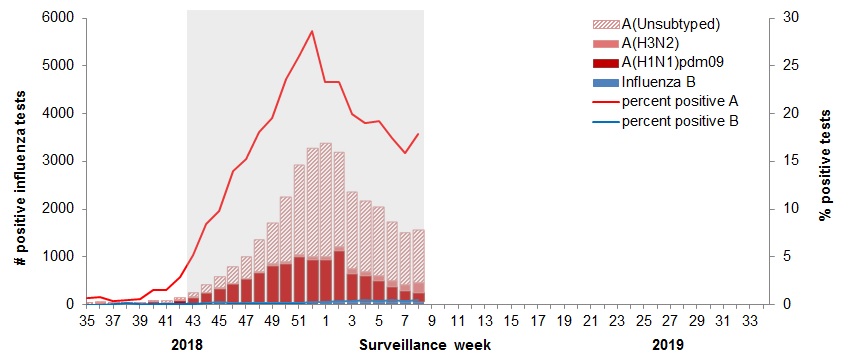
[h=3]Figure 1 ? Map of overall influenza/ILI activity by province and territory, Canada, week 2019-01[/h] Figure 1 - Text description [h=2]Laboratory Confirmed Influenza Detections[/h] In week 01, the following results were reported from sentinel laboratories across Canada (Figure 2):
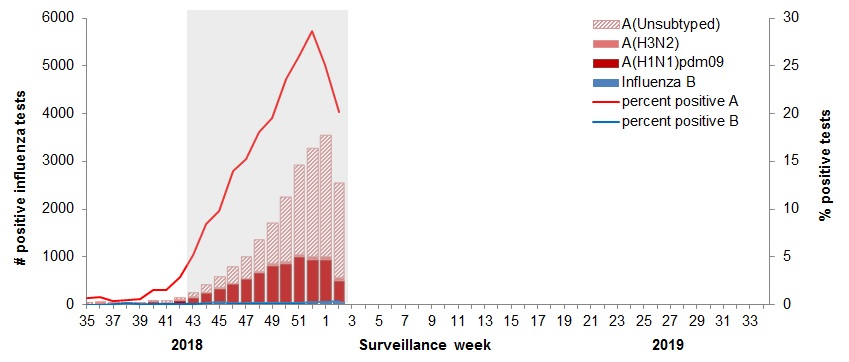
The percentage of tests positive for influenza decreased to 25.6% in week 01.
A total 3,153 laboratory detections of influenza were reported, of which 99% were influenza A.
To date this season 17,743 laboratory-confirmed influenza detections have been reported:
99% have been influenza A.
Among the 6,775 influenza A viruses subtyped, 94% have been A(H1N1)pdm09.
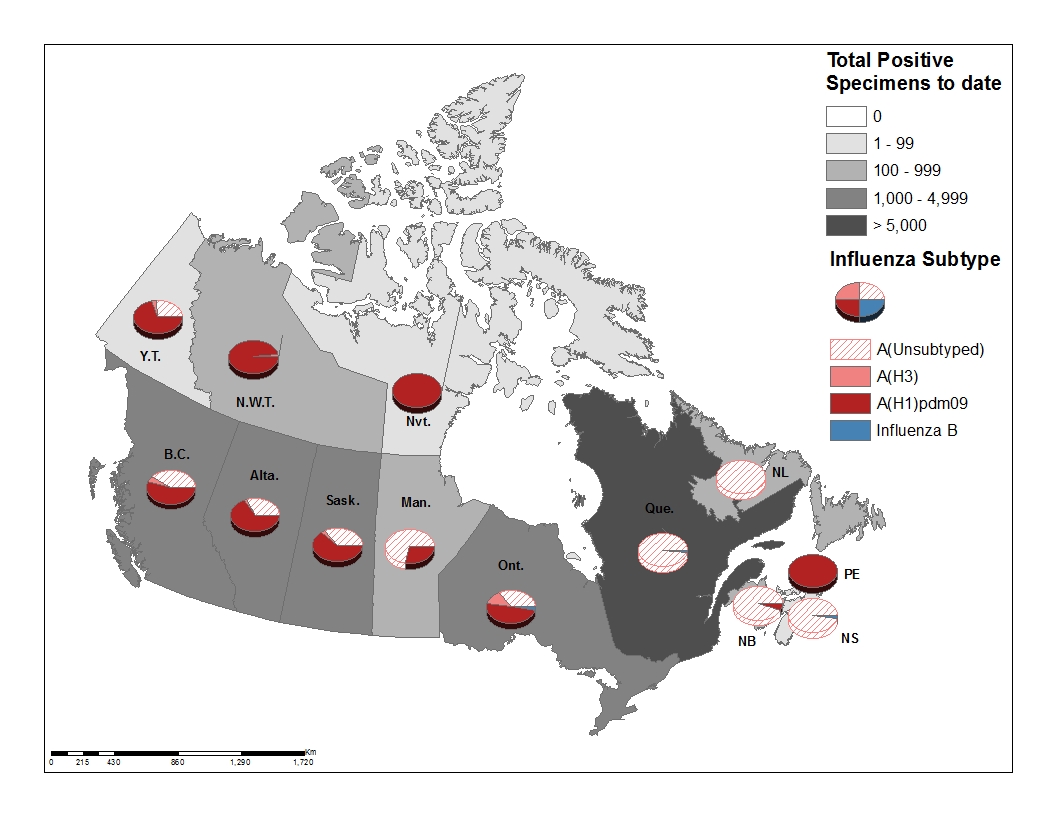
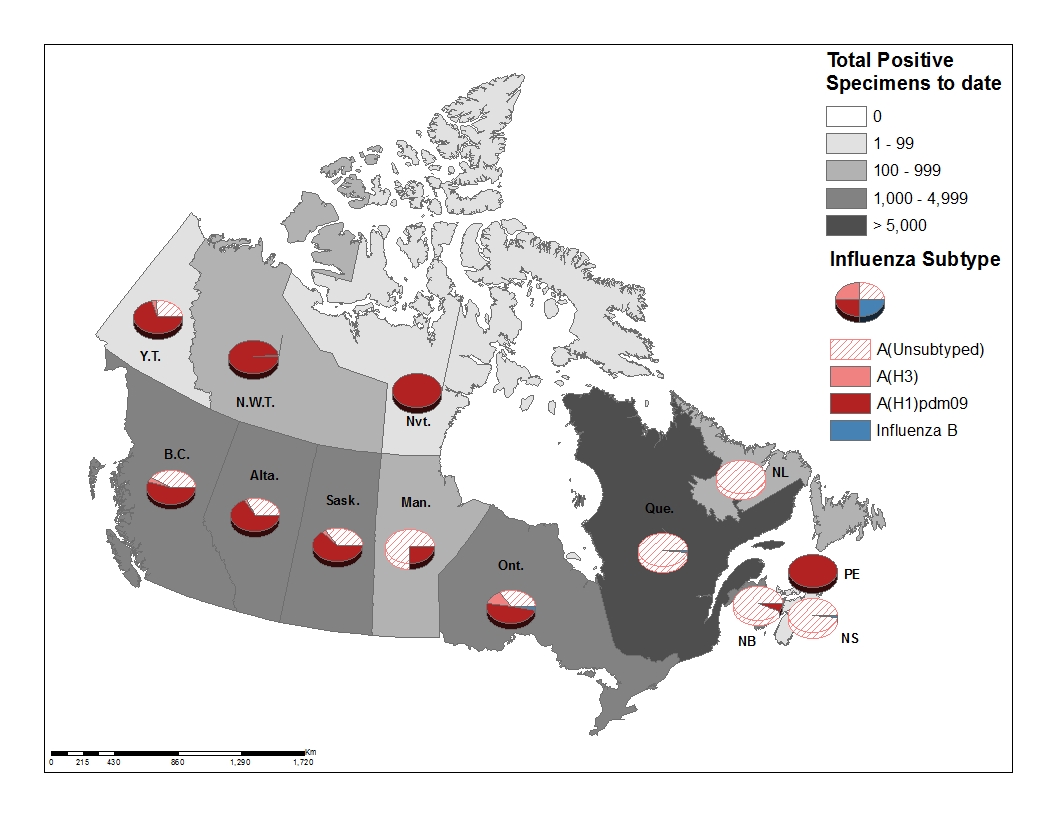
Provincial and territorial differences in influenza type/subtype distribution are observed (Figure 3).
To date this season, detailed information on age and type/subtype has been received for 14,897 laboratory-confirmed influenza cases (Table 1):
68% of all influenza A(H1N1)pdm09 detections have been reported in individuals younger than 45 years of age.
61% of all influenza A(H3N2) detections have been reported in adults 65 years of age and older.
For more detailed weekly and cumulative influenza data, see the text descriptions for Figures 2 and 3 or the Respiratory Virus Detections in Canada Report.
[h=3]Figure 2 ? Number of positive influenza tests and percentage of tests positive, by type, subtype and report week, Canada, weeks 2018-35 to 2019-01[/h]
The shaded area indicates weeks where the positivity rate was at least 5% and a minimum of 15 positive tests were observed, signalling the period of seasonal influenza activity.
Figure 2 - Text description [h=3]Figure 3 ? Cumulative numbers of positive influenza specimens by type/subtype and province/territory, Canada, weeks 2018-35 to 2019-01[/h]
Figure 3 - Text description [TABLE="class: table table-striped table-bordered table-hover table-condensed, width: 1140"]
Table 1 ? Cumulative numbers of positive influenza specimens by type, subtype and age-group reported through case-based laboratory reporting, Canada, weeks 2018-35 to 2019-01 [TR="class: bg-primary, bgcolor: #2572B4"]
Age groups (years) Cumulative (August 26, 2018 to January 5, 2019) [/TR]
[TR="class: bg-primary, bgcolor: #2572B4"]
Influenza A B Influenza A and B [/TR]
[TR="class: bg-primary, bgcolor: #2572B4"]
A Total A(H1) pdm09 A(H3) A (UnS)Footnote1 Total # % [/TR]
[TR="bgcolor: #F5F5F5"]
[TD]0-4[/TD]
[TD]3175[/TD]
[TD]1239[/TD]
[TD]15[/TD]
[TD]1921[/TD]
[TD]24[/TD]
[TD]3199[/TD]
[TD]21%[/TD]
[/TR]
[TR]
[TD]5-19[/TD]
[TD]2498[/TD]
[TD]1108[/TD]
[TD]15[/TD]
[TD]1375[/TD]
[TD]26[/TD]
[TD]2524[/TD]
[TD]17%[/TD]
[/TR]
[TR="bgcolor: #F5F5F5"]
[TD]20-44[/TD]
[TD]3277[/TD]
[TD]1294[/TD]
[TD]55[/TD]
[TD]1928[/TD]
[TD]20[/TD]
[TD]3297[/TD]
[TD]22%[/TD]
[/TR]
[TR]
[TD]45-64[/TD]
[TD]3020[/TD]
[TD]1077[/TD]
[TD]70[/TD]
[TD]1873[/TD]
[TD]22[/TD]
[TD]3042[/TD]
[TD]20%[/TD]
[/TR]
[TR="bgcolor: #F5F5F5"]
[TD]65+[/TD]
[TD]2792[/TD]
[TD]673[/TD]
[TD]246[/TD]
[TD]1873[/TD]
[TD]43[/TD]
[TD]2835[/TD]
[TD]19%[/TD]
[/TR]
[TR]
[TD]Total[/TD]
[TD]14762[/TD]
[TD]5391[/TD]
[TD]401[/TD]
[TD]8970[/TD]
[TD]135[/TD]
[TD]14897[/TD]
[TD]100%[/TD]
[/TR]
[TR]
[TD="colspan: 8"] Table 1 - Note 1 UnS: unsubtyped: The specimen was typed as influenza A, but no result for subtyping was available; Return to Table 1 - Note1
[/TD]
[/TR]
[/TABLE]
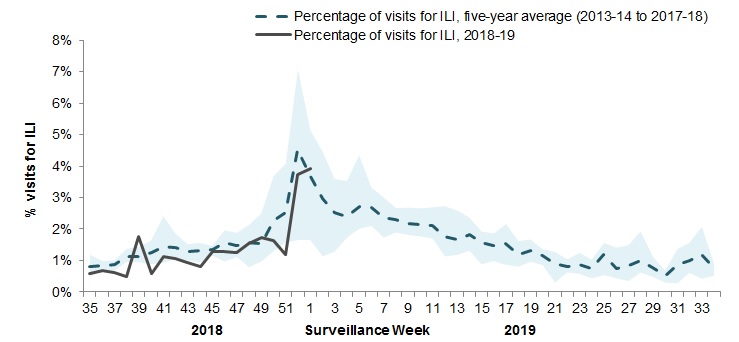
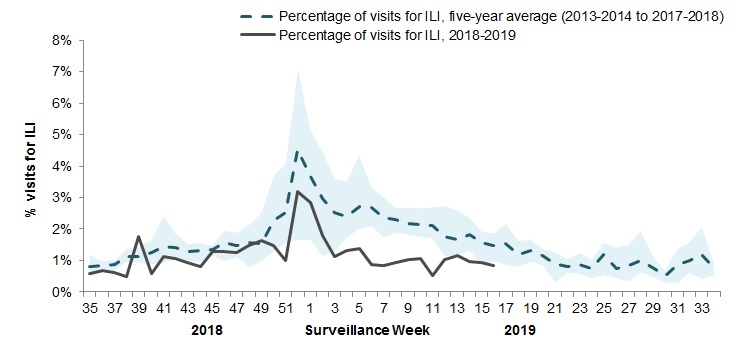
[h=2]Syndromic/Influenza-like Illness Surveillance[/h] [h=3]Healthcare Professionals Sentinel Syndromic Surveillance[/h] In week 1, 3.9% of visits to healthcare professionals were due to influenza-like illness (ILI) (Figure 4). The percentage of visits for ILI is within expected levels.
[h=3]Figure 4 ? Percentage of visits for ILI reported by sentinels by report week, Canada, weeks 2018-35 to 2019-01[/h] Number of Sentinels Reporting in Week 01: 77
The shaded area represents the maximum and minimum percentage of visits for ILI reported by week from seasons 2013-14 to 2017-18
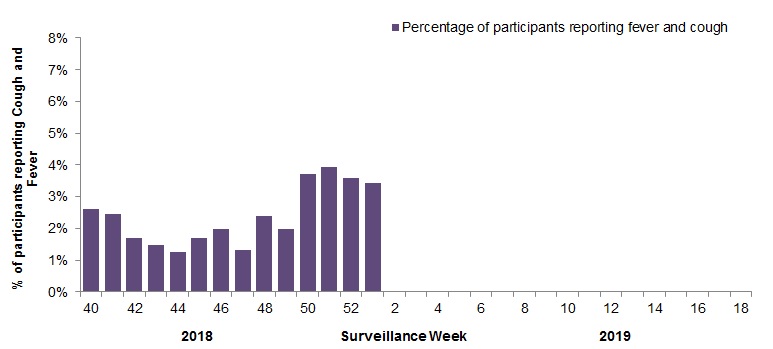
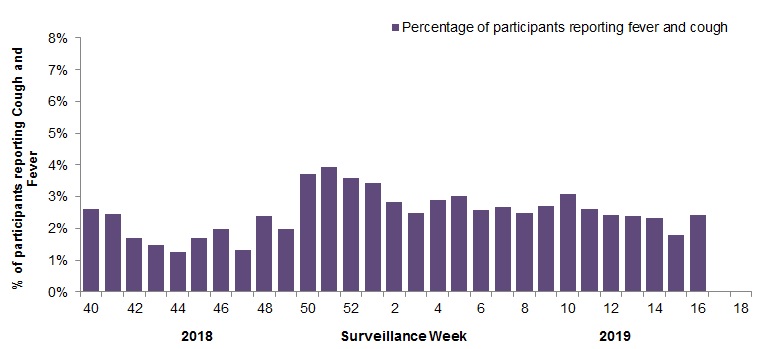
Figure 4 - Text description [h=2]Participatory Syndromic Surveillance[/h] In week 01, 2,240 participants reported to FluWatchers, of which 77 (3.4%) reported symptoms of cough and fever (Figure 5).
Among the 77 participants who reported fever and cough:
13% consulted a healthcare professional;
77% reported days missed from work or school, resulting in a combined total of 159 missed days of work or school.
[h=3]Figure 5 ? Percentage of participants reporting cough and fever, Canada, weeks 2018-40 to 2019-01[/h] Number of Participants Reporting in Week 01: 2,240
Figure 5 - Text description [h=2]Influenza Outbreak Surveillance[/h] In week 01, 37 new laboratory-confirmed influenza outbreaks were reported: long-term care facilities (LTCF) (24), acute care facilities (4), and other settings (9). One new ILI outbreak in a LTCF was also reported reported in week 01.
To date this season, 152 laboratory-confirmed influenza outbreaks have been reported (Figure 6):
79 outbreaks were in LTCF, 22 were in schools, 21 in acute care facilities, and 30 were in other settings.
All of the 119 outbreaks for which the influenza type was available were associated with influenza A.
Among the 76 outbreaks for which the influenza A subtype was available:
86% (65) were associated with influenza A(H1N1)pdm09;
14% (11) were associated with A(H3N2),
To date this season, 39 ILI outbreaks have been reported; 29 occurred in LTCF, seven in schools, and three in acute care facilities.
[h=3]Figure 6 ? Number of new outbreaks of laboratory-confirmed influenza by report week, Canada, weeks 2018-35 to 2019-01[/h]
Figure 6 - Text description [h=2]Severe Outcomes Influenza Surveillance[/h] [h=3]Provincial/Territorial Influenza Hospitalizations and Deaths[/h] To date this season, 1348 influenza-associated hospitalizations have been reported by participating provinces and territoriesFootnote1. Hospitalizations (Table 2):
99.6% (1342) were associated with influenza A
The highest estimated rate of hospitalization is among children under 5 years of age.
Intensive Care Unit (ICU) cases and deaths:
To date this season 196 ICU admissions and 37 deaths have been reported.
41% (80) of reported ICU admissions were in adults aged 45-64 years.
All reported deaths were associated with influenza A.
[TABLE="class: table table-striped table-bordered table-hover table-condensed, width: 1140"]
Table 2 ? Cumulative number and estimated rate of hospitalizations by age-group reported by participating provinces and territoriesFootnote1, Canada, weeks 2018-35 to 2019-01 [TR="class: bg-primary, bgcolor: #2572B4"]
Age Groups Cumulative (August 26, 2018 to January 5, 2018) [/TR]
[TR="class: bg-primary, bgcolor: #2572B4"]
Influenza A Influenza B Rate per 100,000 population [/TR]
[TR="bgcolor: #F5F5F5"]
[TD]0-4[/TD]
[TD]225[/TD]
[TD]2[/TD]
[TD]47.69[/TD]
[/TR]
[TR]
[TD]5-19[/TD]
[TD]139[/TD]
[TD]0[/TD]
[TD]10.02[/TD]
[/TR]
[TR="bgcolor: #F5F5F5"]
[TD]20-44[/TD]
[TD]194[/TD]
[TD]0[/TD]
[TD]6.82[/TD]
[/TR]
[TR]
[TD]45-64[/TD]
[TD]360[/TD]
[TD]0[/TD]
[TD]16.54[/TD]
[/TR]
[TR="bgcolor: #F5F5F5"]
[TD]65+[/TD]
[TD]424[/TD]
[TD]4[/TD]
[TD]35.18[/TD]
[/TR]
[TR]
[TD]Total[/TD]
[TD]1342[/TD]
[TD]6[/TD]
[TD]-[/TD]
[/TR]
[TR="bgcolor: #F5F5F5"]
[TD]%[/TD]
[TD]94.6%[/TD]
[TD]0.4%[/TD]
[TD]-[/TD]
[/TR]
[TR]
[TD="colspan: 4"] Table 2 - Footnote 1 Influenza-associated hospitalizations are reported by Alberta, Manitoba, New Brunswick, Newfoundland and Labrador, Northwest Territories, Nova Scotia, Prince Edward Island and Yukon. Only hospitalizations that require intensive medical care are reported by Saskatchewan. The cumulative rate of hospitalizations is calculated using the total population by age-group in participating provinces and territories. Return to Table 2 - Footnote1referrer
[/TD]
[/TR]
[/TABLE]
[h=3]Pediatric Influenza Hospitalizations and Deaths[/h] In week 01, 87 pediatric (≤16 years of age) hospitalizations with influenza have been reported by the Immunization Monitoring Program Active (IMPACT) network (Figure 7).
To date this season, 540 pediatric hospitalizations have been reported (Figure 8):
99% (535) of cases have been associated with influenza A.
Among the 228 cases for which the influenza subtype was available, 222 (97%) were associated with A(H1N1)pdm09.
To date this season, 95 ICU admissions, and six deaths have been reported.
88% (83) of ICU admissions were in children under the age of 10
99% (93) of ICU admissions have been associated with influenza A.
All deaths occurred in children under the age of 10
[h=3]Figure 7 ? Number of pediatric (≤16 years of age) hospitalizations reported by the IMPACT network, by week, Canada, weeks 2018-35 to 2019-01[/h]
Figure 7 - Text description [h=3]Figure 8 - Cumulative numbers of pediatric hospitalizations (≤16 years of age) with influenza by age-group reported by the IMPACT network, Canada, weeks 2018-35 to 2019-01[/h]
Figure 8 - Text description [h=3]Adult Influenza Hospitalizations and Deaths[/h] Surveillance of laboratory-confirmed influenza-associated adult (≥16 years of age) hospitalizations by the Canadian Immunization Research Network (CIRN) Serious Outcomes Surveillance (SOS) network began on November 1st for the 2018-19 season.
To date this season, 223 hospitalizations have been reported (Figure 9):
212 (95%) were associated with influenza A.
The distribution of cases among adults <65 years of age is similar to adults ≥65 years of age
The most commonly reported comorbidity among hospitalized cases was endocrine disorders, which were reported in 70% of hospitalized cases.
[h=3]Figure 9 - Cumulative numbers of adult hospitalizations (>20 years of age) with influenza by age-group reported by CIRN, Canada, 2018-19, weeks 2018-44 to 2019-01[/h]
Figure 9 - Text description [h=2]Influenza Strain Characterizations[/h] Since September 1, 2018, the National Microbiology Laboratory (NML) has characterized 481 influenza viruses (45 A(H3N2), 420 A(H1N1) and 16 B) that were received from Canadian laboratories.
[h=3]Genetic Characterization of Influenza A(H3N2):[/h] 33 influenza A(H3N2) viruses did not grow to sufficient hemagglutination titer for antigenic characterization by hemagglutination inhibition (HI) assay. Therefore, NML has performed genetic characterization to determine the genetic group identity of these viruses.
Sequence analysis of the HA gene of the viruses showed that:
Five viruses belonged to genetic group 3C.2a.
27 viruses belonged to subclade 3C.2a1.
A/Singapore/INFIMH-16-0019/2016-like virus belongs to genetic group 3C.2a1 and is the influenza A(H3N2) component of the 2018-19 Northern Hemisphere influenza vaccine.
[h=3]Antigenic Characterization:[/h] Influenza A (H3N2):
12 influenza A(H3N2) virus was antigenically characterized as A/Singapore/INFIMH-16-0019/2016-like by HI testing using antiserum raised against egg-propagated A/Singapore/INFIMH-16-0019/2016.
A/Singapore/INFIMH-16-0019/2016-like virus is the influenza A(H3N2) component of the 2018-19 Northern Hemisphere influenza vaccine.
Four influenza A (H3N2) viruses characterized belonged to genetic group 3C.2a1. Sequencing is pending for the remaining three viruses.
Influenza A(H1N1):
415 A(H1N1) viruses characterized were antigenically similar to A/Michigan/45/2015, which is the influenza A(H1N1) component of the 2018-19 Northern Hemisphere influenza vaccine.
Five viruses showed reduced titer with ferret antisera raised against cell culture-propagated A/Michigan/45/2015
Influenza B:
Influenza B viruses can be divided into two antigenically distinct lineages represented by B/Yamagata/16/88 and B/Victoria/2/87 viruses. The recommended influenza B components for the 2018-19 Northern Hemisphere influenza vaccine are B/Colorado/06/2017 (Victoria lineage) and B/Phuket/3073/2013 (Yamagata lineage).
Two influenza B virus was characterized as B/Colorado/06/2017, which belongs to the Victoria lineage and is included as an influenza B component of the 2018-19 Northern Hemisphere influenza vaccine
14 influenza B viruses were characterized as B/Phuket/3073/2013-like, which belongs to the Yamagata lineage and is included as an influenza B component of the 2018-19 Northern Hemisphere quadrivalent influenza vaccine.
In week 02, laboratory detections continued to decline sharply from the previous week confirming that the influenza season reached peak levels in the last week of December (week 52).
Overall, the Central and Eastern regions are reporting higher levels of influenza activity than the rest of the country.
Influenza A is the most common influenza virus circulating in Canada, and the majority of these viruses are A(H1N1)pdm09.
The majority of lab confirmations and hospitalizations have been among individuals under the age of 65.
[h=2]Influenza/Influenza-like Illness Activity (geographic spread)[/h] During week 02, the following influenza activity levels were reported (Figure 1):
2 regions reported widespread activity: in Que.(2)
17 regions reported localized activity: in Ont.(6), Que.(2), N.L.(3) N.S.(2) and N.B.(4)
32 regions reported sporadic activity: in B.C.(5), Alta.(5), Sask.(3), Man.(5), Ont.(1), Que.(2), N.B.(3), N.S.(2), N.L.(1), P.E.I.(1), Nvt.(1), N.W.T.(2) and Yt.(1).
2 regions reported no activity: in Nvt.(2)
[h=3]Figure 1 ? Map of overall influenza/ILI activity by province and territory, Canada, week 2019-02[/h] Figure 1 - Text description [h=2]Laboratory Confirmed Influenza Detections[/h] In week 02, the following results were reported from sentinel laboratories across Canada (Figure 2):
The percentage of tests positive for influenza decreased to 20.5% in week 02.
A total 2,486 laboratory detections of influenza were reported, of which 98% were influenza A.
To date this season 20,494 laboratory-confirmed influenza detections have been reported:
99% have been influenza A.
Among the 7,523 influenza A viruses subtyped, 94% have been A(H1N1)pdm09.
Provincial and territorial differences in influenza type/subtype distribution are observed (Figure 3).
To date this season, detailed information on age and type/subtype has been received for 17,295 laboratory-confirmed influenza cases (Table 1):
86% of all influenza A(H1N1)pdm09 detections have been reported in individuals younger than 65 years of age.
63% of all influenza A(H3N2) detections have been reported in adults 65 years of age and older.
For more detailed weekly and cumulative influenza data, see the text descriptions for Figures 2 and 3 or the Respiratory Virus Detections in Canada Report.
[h=3]Figure 2 ? Number of positive influenza tests and percentage of tests positive, by type, subtype and report week, Canada, weeks 2018-35 to 2019-02[/h]
The shaded area indicates weeks where the positivity rate was at least 5% and a minimum of 15 positive tests were observed, signalling the period of seasonal influenza activity.
Figure 2 - Text description [h=3]Figure 3 ? Cumulative numbers of positive influenza specimens by type/subtype and province/territory, Canada, weeks 2018-35 to 2019-02[/h]
Figure 3 - Text description [TABLE="class: table table-striped table-bordered table-hover table-condensed, width: 1140"]
Table 1 ? Cumulative numbers of positive influenza specimens by type, subtype and age-group reported through case-based laboratory reporting, Canada, weeks 2018-35 to 2019-02 [TR="class: bg-primary, bgcolor: #2572B4"]
Age groups (years) Cumulative (August 26, 2018 to January 12, 2019) [/TR]
[TR="class: bg-primary, bgcolor: #2572B4"]
Influenza A B Influenza A and B [/TR]
[TR="class: bg-primary, bgcolor: #2572B4"]
A Total A(H1) pdm09 A(H3) A (UnS)Footnote1 Total # % [/TR]
[TR="bgcolor: #F5F5F5"]
[TD]0-4[/TD]
[TD]3679[/TD]
[TD]1351[/TD]
[TD]18[/TD]
[TD]2310[/TD]
[TD]28[/TD]
[TD]3707[/TD]
[TD]21%[/TD]
[/TR]
[TR]
[TD]5-19[/TD]
[TD]2698[/TD]
[TD]1168[/TD]
[TD]17[/TD]
[TD]1513[/TD]
[TD]29[/TD]
[TD]2727[/TD]
[TD]16%[/TD]
[/TR]
[TR="bgcolor: #F5F5F5"]
[TD]20-44[/TD]
[TD]3676[/TD]
[TD]1412[/TD]
[TD]62[/TD]
[TD]2202[/TD]
[TD]24[/TD]
[TD]3700[/TD]
[TD]21%[/TD]
[/TR]
[TR]
[TD]45-64[/TD]
[TD]3601[/TD]
[TD]1253[/TD]
[TD]76[/TD]
[TD]2272[/TD]
[TD]29[/TD]
[TD]3630[/TD]
[TD]21%[/TD]
[/TR]
[TR="bgcolor: #F5F5F5"]
[TD]65+[/TD]
[TD]3464[/TD]
[TD]816[/TD]
[TD]294[/TD]
[TD]2354[/TD]
[TD]67[/TD]
[TD]3531[/TD]
[TD]20%[/TD]
[/TR]
[TR]
[TD]Total[/TD]
[TD]17118[/TD]
[TD]6000[/TD]
[TD]467[/TD]
[TD]10651[/TD]
[TD]177[/TD]
[TD]17295[/TD]
[TD]100%[/TD]
[/TR]
[TR]
[TD="colspan: 8"] Table 1 - Note 1 UnS: unsubtyped: The specimen was typed as influenza A, but no result for subtyping was available; Return to Table 1 - Note1
[/TD]
[/TR]
[/TABLE]
[h=2]Syndromic/Influenza-like Illness Surveillance[/h] [h=3]Healthcare Professionals Sentinel Syndromic Surveillance[/h] In week 02, 2.5% of visits to healthcare professionals were due to influenza-like illness (ILI) (Figure 4). The percentage of visits for ILI is within expected levels.
[h=3]Figure 4 ? Percentage of visits for ILI reported by sentinels by report week, Canada, weeks 2018-35 to 2019-02[/h] Number of Sentinels Reporting in Week 02: 97
The shaded area represents the maximum and minimum percentage of visits for ILI reported by week from seasons 2013-14 to 2017-18
Figure 4 - Text description [h=2]Participatory Syndromic Surveillance[/h] In week 02, 2,259 participants reported to FluWatchers, of which 64 (2.8%) reported symptoms of cough and fever (Figure 5).
Among the 64 participants who reported fever and cough:
19% consulted a healthcare professional;
72% reported days missed from work or school, resulting in a combined total of 142 missed days of work or school.
[h=3]Figure 5 ? Percentage of participants reporting cough and fever, Canada, weeks 2018-40 to 2019-02[/h] Number of Participants Reporting in Week 02: 2,259
Figure 5 - Text description [h=2]Influenza Outbreak Surveillance[/h] In week 02, 33 new laboratory-confirmed influenza outbreaks were reported: long-term care facilities (LTCF) (21), acute care facilities (4), and other settings (8). Two new ILI outbreaks in schools were also reported in week 02.
To date this season, 206 laboratory-confirmed influenza outbreaks have been reported (Figure 6):
116 outbreaks were in LTCF, 22 were in schools, 26 in acute care facilities, and 42 were in other settings.
All of the 194 outbreaks for which the influenza type was available were associated with influenza A.
Among the 93 outbreaks for which the influenza A subtype was available:
80% (74) were associated with influenza A(H1N1)pdm09;
20% (19) were associated with A(H3N2),
To date this season, 44 ILI outbreaks have been reported; 32 occurred in LTCF, nine in schools, and three in acute care facilities.
[h=3]Figure 6 ? Number of new outbreaks of laboratory-confirmed influenza by report week, Canada, weeks 2018-35 to 2019-02[/h]
Figure 6 - Text description [h=2]Severe Outcomes Influenza Surveillance[/h] [h=3]Provincial/Territorial Influenza Hospitalizations and Deaths[/h] To date this season, 1,518 influenza-associated hospitalizations have been reported by participating provinces and territoriesFootnote1. Hospitalizations (Table 2):
99.6% (1,512) were associated with influenza A
The highest estimated rate of hospitalization is among children under 5 years of age.
Intensive Care Unit (ICU) cases and deaths:
To date this season 227 ICU admissions and 47 deaths have been reported.
42% (97) of reported ICU admissions were in adults aged 45-64 years.
All reported deaths were associated with influenza A.
[TABLE="class: table table-striped table-bordered table-hover table-condensed, width: 1140"]
Table 2 ? Cumulative number and estimated rate of hospitalizations by age-group reported by participating provinces and territoriesFootnote1, Canada, weeks 2018-35 to 2019-02 [TR="class: bg-primary, bgcolor: #2572B4"]
Age Groups Cumulative (August 26, 2018 to January 12, 2018) [/TR]
[TR="class: bg-primary, bgcolor: #2572B4"]
Influenza A Influenza B Rate per 100,000 population [/TR]
[TR="bgcolor: #F5F5F5"]
[TD]0-4[/TD]
[TD]252[/TD]
[TD]2[/TD]
[TD]53,36[/TD]
[/TR]
[TR]
[TD]5-19[/TD]
[TD]152[/TD]
[TD]0[/TD]
[TD]10,95[/TD]
[/TR]
[TR="bgcolor: #F5F5F5"]
[TD]20-44[/TD]
[TD]213[/TD]
[TD]0[/TD]
[TD]7,49[/TD]
[/TR]
[TR]
[TD]45-64[/TD]
[TD]413[/TD]
[TD]0[/TD]
[TD]18,98[/TD]
[/TR]
[TR="bgcolor: #F5F5F5"]
[TD]65+[/TD]
[TD]482[/TD]
[TD]4[/TD]
[TD]39,95[/TD]
[/TR]
[TR]
[TD]Total[/TD]
[TD]1512[/TD]
[TD]6[/TD]
[TD]-[/TD]
[/TR]
[TR="bgcolor: #F5F5F5"]
[TD] [/TD]
[TD]99.6%[/TD]
[TD]0.4%[/TD]
[TD]-[/TD]
[/TR]
[TR]
[TD="colspan: 4"] Table 2 - Footnote 1 Influenza-associated hospitalizations are reported by Alberta, Manitoba, New Brunswick, Newfoundland and Labrador, Northwest Territories, Nova Scotia, Prince Edward Island and Yukon. Only hospitalizations that require intensive medical care are reported by Saskatchewan. The cumulative rate of hospitalizations is calculated using the total population by age-group in participating provinces and territories. Return to Table 2 - Footnote1referrer
[/TD]
[/TR]
[/TABLE]
[h=3]Pediatric Influenza Hospitalizations and Deaths[/h] In week 02, 57 pediatric (≤16 years of age) hospitalizations with influenza have been reported by the Immunization Monitoring Program Active (IMPACT) network (Figure 7).
To date this season, 603 pediatric hospitalizations have been reported (Figure 8):
99% (598) of cases have been associated with influenza A.
Among the 240 cases for which the influenza subtype was available, 234 (98%) were associated with A(H1N1)pdm09.
To date this season, 98 ICU admissions, and seven deaths have been reported.
85% (84) of ICU admissions were in children 6 months to 9 years of age
99% (97) of ICU admissions have been associated with influenza A.
All deaths occurred in children under the age of 10
[h=3]Figure 7 ? Number of pediatric (≤16 years of age) hospitalizations reported by the IMPACT network, by week, Canada, weeks 2018-35 to 2019-02[/h]
Figure 7 - Text description [h=3]Figure 8 - Cumulative numbers of pediatric hospitalizations (≤16 years of age) with influenza by age-group reported by the IMPACT network, Canada, weeks 2018-35 to 2019-02[/h]
Figure 8 - Text description [h=3]Adult Influenza Hospitalizations and Deaths[/h] Surveillance of laboratory-confirmed influenza-associated adult (≥16 years of age) hospitalizations by the Canadian Immunization Research Network (CIRN) Serious Outcomes Surveillance (SOS) network began on November 1st for the 2018-19 season.
To date this season, 278 hospitalizations have been reported (Figure 9):
262 (94%) were associated with influenza A.
The distribution of cases among adults <65 years of age is similar to adults ≥65 years of age
The most commonly reported comorbidity among hospitalized cases was endocrine disorders, which were reported in 70% of hospitalized cases.
[h=3]Figure 9 - Cumulative numbers of adult hospitalizations (>20 years of age) with influenza by age-group reported by CIRN, Canada, 2018-19, weeks 2018-44 to 2019-02[/h]
Figure 9 - Text description [h=2]Influenza Strain Characterizations[/h] Since September 1, 2018, the National Microbiology Laboratory (NML) has characterized 571 influenza viruses (49 A(H3N2), 506 A(H1N1) and 16 B) that were received from Canadian laboratories.
[h=3]Genetic Characterization of Influenza A(H3N2):[/h] 39 influenza A(H3N2) viruses did not grow to sufficient hemagglutination titer for antigenic characterization by hemagglutination inhibition (HI) assay. Therefore, NML has performed genetic characterization to determine the genetic group identity of these viruses.
Sequence analysis of the HA gene of the viruses showed that:
Six viruses belonged to genetic group 3C.2a.
32 viruses belonged to subclade 3C.2a1.
One isolate could not be sequenced.
A/Singapore/INFIMH-16-0019/2016-like virus belongs to genetic group 3C.2a1 and is the influenza A(H3N2) component of the 2018-19 Northern Hemisphere influenza vaccine.
[h=3]Antigenic Characterization:[/h] Influenza A (H3N2):
17 influenza A(H3N2) viruses were antigenically characterized as A/Singapore/INFIMH-16-0019/2016-like by HI testing using antiserum raised against egg-propagated A/Singapore/INFIMH-16-0019/2016.
A/Singapore/INFIMH-16-0019/2016-like virus is the influenza A(H3N2) component of the 2018-19 Northern Hemisphere influenza vaccine.
13 influenza A (H3N2) viruses characterized belonged to genetic group 3C.2a1. Two viruses belonged to genetic group 3C.2a and two to 3C.3a.
Influenza A(H1N1):
495 A(H1N1) viruses characterized were antigenically similar to A/Michigan/45/2015, which is the influenza A(H1N1) component of the 2018-19 Northern Hemisphere influenza vaccine.
11 viruses showed reduced titer with ferret antisera raised against cell culture-propagated A/Michigan/45/2015
Influenza B:
Influenza B viruses can be divided into two antigenically distinct lineages represented by B/Yamagata/16/88 and B/Victoria/2/87 viruses. The recommended influenza B components for the 2018-19 Northern Hemisphere influenza vaccine are B/Colorado/06/2017 (Victoria lineage) and B/Phuket/3073/2013 (Yamagata lineage).
Two influenza B viruses were characterized as B/Colorado/06/2017, which belong to the Victoria lineage and are included as an influenza B component of the 2018-19 Northern Hemisphere influenza vaccine
14 influenza B viruses were characterized as B/Phuket/3073/2013-like, which belongs to the Yamagata lineage and is included as an influenza B component of the 2018-19 Northern Hemisphere quadrivalent influenza vaccine.
In week 03, laboratory detections continued to decline from the previous week.Overall, influenza continues to circulate across Canada but the Eastern region is reporting higher levels of influenza activity than the rest of the country.
Influenza A is the most common influenza virus circulating in Canada, and the majority of these viruses are A(H1N1)pdm09.
The majority of lab confirmations and hospitalizations have been among individuals under the age of 65.
Based on a recently published Canadian influenza vaccine effectiveness study, mid-season vaccine effectiveness estimates indicate that this year's flu shot is approximately 72% effective against the predominant circulating strain. The study confirmed that significant protection was observed in all age groups, especially young children who have been disproportionately affected by influenza this season.
[h=2]Influenza/Influenza-like Illness Activity (geographic spread)[/h] During week 03, the following influenza activity levels were reported (Figure 1):
23 regions reported localized activity: in Alta.(1), Ont.(6), Que.(4), N.L.(2) N.S.(4) P.E.I.(1) and N.B.(5).
26 regions reported sporadic activity: in B.C.(5), Alta.(4), Sask.(3), Man.(5), Que.(2), N.B.(2), N.L.(2), Nvt.(2), and N.W.T.(1).
Three regions reported no activity: in Ont.(1), N.W.T.(1) and Nvt.(1).
No data was reported by one region: in Y.T.(1).
[h=3]Figure 1 ? Map of overall influenza/ILI activity by province and territory, Canada, week 2019-03[/h] Figure 1 - Text description [h=2]Laboratory Confirmed Influenza Detections[/h] In week 03, the following results were reported from sentinel laboratories across Canada (Figure 2):
The percentage of tests positive for influenza decreased to 20.8% in week 03.
A total 2,313 laboratory detections of influenza were reported, of which 98% were influenza A.
To date this season 20,753 laboratory-confirmed influenza detections have been reported:
99% have been influenza A.
Among the 7,565 influenza A viruses subtyped, 94% have been A(H1N1)pdm09.
Provincial and territorial differences in influenza type/subtype distribution are observed (Figure 3).
To date this season, detailed information on age and type/subtype has been received for 18,923 laboratory-confirmed influenza cases (Table 1):
86% of all influenza A(H1N1)pdm09 detections have been reported in individuals younger than 65 years of age.
62% of all influenza A(H3N2) detections have been reported in adults 65 years of age and older.
For more detailed weekly and cumulative influenza data, see the text descriptions for Figures 2 and 3 or the Respiratory Virus Detections in Canada Report.
[h=3]Figure 2 ? Number of positive influenza tests and percentage of tests positive, by type, subtype and report week, Canada, weeks 2018-35 to 2019-03[/h]
The shaded area indicates weeks where the positivity rate was at least 5% and a minimum of 15 positive tests were observed, signalling the period of seasonal influenza activity.
Figure 2 - Text description [h=3]Figure 3 ? Cumulative numbers of positive influenza specimens by type/subtype and province/territory, Canada, weeks 2018-35 to 2019-03[/h]
Figure 3 - Text description [TABLE="class: table table-striped table-bordered table-hover table-condensed, width: 1140"] Table 1 - Cumulative numbers of positive influenza specimens by type, subtype and age-group reported through case-based laboratory reporting, Canada, weeks 2018-35 to 2019-03 [TR="class: bg-primary, bgcolor: #2572B4"]
Age groups (years) Cumulative (August 26, 2018 to January 19, 2019) [/TR]
[TR="class: bg-primary, bgcolor: #2572B4"]
Influenza A B Influenza A and B [/TR]
[TR="class: bg-primary, bgcolor: #2572B4"]
A Total A(H1) pdm09 A(H3) A (UnS)Footnote1 Total # % [/TR]
[TR="bgcolor: #F5F5F5"]
[TD]0-4[/TD]
[TD]4072[/TD]
[TD]1412[/TD]
[TD]22[/TD]
[TD]2638[/TD]
[TD]32[/TD]
[TD]4104[/TD]
[TD]22%[/TD]
[/TR]
[TR]
[TD]5-19[/TD]
[TD]2884[/TD]
[TD]1198[/TD]
[TD]21[/TD]
[TD]1665[/TD]
[TD]34[/TD]
[TD]2918[/TD]
[TD]15%[/TD]
[/TR]
[TR="bgcolor: #F5F5F5"]
[TD]20-44[/TD]
[TD]3975[/TD]
[TD]1482[/TD]
[TD]73[/TD]
[TD]2420[/TD]
[TD]26[/TD]
[TD]4001[/TD]
[TD]21%[/TD]
[/TR]
[TR]
[TD]45-64[/TD]
[TD]3887[/TD]
[TD]1325[/TD]
[TD]85[/TD]
[TD]2477[/TD]
[TD]33[/TD]
[TD]3920[/TD]
[TD]21%[/TD]
[/TR]
[TR="bgcolor: #F5F5F5"]
[TD]65+[/TD]
[TD]3896[/TD]
[TD]883[/TD]
[TD]334[/TD]
[TD]2679[/TD]
[TD]84[/TD]
[TD]3980[/TD]
[TD]21%[/TD]
[/TR]
[TR]
[TD]Total[/TD]
[TD]18714[/TD]
[TD]6300[/TD]
[TD]535[/TD]
[TD]11879[/TD]
[TD]209[/TD]
[TD]18923[/TD]
[TD]100%[/TD]
[/TR]
[TR]
[TD="colspan: 8"] Table 1 - Note 1 UnS: unsubtyped: The specimen was typed as influenza A, but no result for subtyping was available; Return to Table 1 - Note1
[/TD]
[/TR]
[/TABLE]
[h=2]Syndromic/Influenza-like Illness Surveillance[/h] [h=3]Healthcare Professionals Sentinel Syndromic Surveillance[/h] In week 03, 1.4% of visits to healthcare professionals were due to influenza-like illness (ILI) (Figure 4). The percentage of visits for ILI is within expected levels.
[h=3]Figure 4 ? Percentage of visits for ILI reported by sentinels by report week, Canada, weeks 2018-35 to 2018-19-03[/h] Number of Sentinels Reporting in Week 03: 99
The shaded area represents the maximum and minimum percentage of visits for ILI reported by week from seasons 2013-14 to 2017-18
Figure 4 - Text description [h=2]Participatory Syndromic Surveillance[/h] In week 03, 2,211 participants reported to FluWatchers, of which 55 (2.5%) reported symptoms of cough and fever (Figure 5).
Among the 55 participants who reported fever and cough:
13% consulted a healthcare professional;
73% reported days missed from work or school, resulting in a combined total of 108 missed days of work or school.
[h=3]Figure 5 - Percentage of participants reporting cough and fever, Canada, weeks 2018-40 to 2019-03[/h] Number of Participants Reporting in Week 03: 2,211
Figure 5 - Text description [h=2]Influenza Outbreak Surveillance[/h] In week 03, 31 new laboratory-confirmed influenza outbreaks were reported: long-term care facilities (LTCF) (19), acute care facilities (3), and other settings (9). Thirteen new ILI outbreaks in long-term care facilities (5) and schools (8) were also reported in week 03.
To date this season, 254 laboratory-confirmed influenza outbreaks have been reported (Figure 6):
148 outbreaks were in LTCF, 22 were in schools, 33 in acute care facilities, and 51 were in other settings.
Among the 239 outbreaks for which the influenza type was available 99% (236) were associated with influenza A.
Among the 115 outbreaks for which the influenza A subtype was available:
77% (89) were associated with influenza A(H1N1)pdm09;
23% (26) were associated with A(H3N2),
To date this season, 58 ILI outbreaks have been reported; 38 occurred in LTCF, 17 in schools, and three in acute care facilities.
[h=3]Figure 6 ? Number of new outbreaks of laboratory-confirmed influenza by report week, Canada, weeks 2018-35 to 2019-03[/h]
Figure 6 - Text description [h=2]Severe Outcomes Influenza Surveillance[/h] Provincial/Territorial Influenza Hospitalizations and Deaths
To date this season, 1,637 influenza-associated hospitalizations have been reported by participating provinces and territoriesFootnote1. Hospitalizations (Table 2):
99.6% (1,512) were associated with influenza A
The highest estimated rate of hospitalization is among children under 5 years of age.
Intensive Care Unit (ICU) cases and deaths:
To date this season 262 ICU admissions and 56 deaths have been reported.
43% (113) of reported ICU admissions were in adults aged 45-64 years
All reported deaths were associated with influenza A.
[TABLE="class: table table-striped table-bordered table-hover table-condensed, width: 1140"] Table 2 - Cumulative number of hospitalizations by age-group and influenza type, reported by participating provinces and territoriesFootnote1, Canada, weeks 2018-35 to 2019-03 [TR="class: bg-primary, bgcolor: #2572B4"]
Age Groups (years) Cumulative (August 26, 2018 to January 19, 2019) [/TR]
[TR="class: bg-primary, bgcolor: #2572B4"]
Influenza A Influenza B Rate per 100,000 population [/TR]
[TR]
[TD="colspan: 8"] Table 2 - Note 1 Influenza-associated hospitalizations are reported by Alberta, Manitoba, New Brunswick, Newfoundland and Labrador, Northwest Territories, Nova Scotia, Prince Edward Island and Yukon. Only hospitalizations that require intensive medical care are reported by Saskatchewan. The cumulative rate of hospitalizations is calculated using the total population by age-group in participating provinces and territories. Return to Table 2 - Note1
[/TD]
[/TR]
[TR="bgcolor: #F5F5F5"]
[TD]0-4 [/TD]
[TD]274[/TD]
[TD]3[/TD]
[TD]58.20[/TD]
[/TR]
[TR]
[TD]5-19[/TD]
[TD]156[/TD]
[TD]0[/TD]
[TD]11.24[/TD]
[/TR]
[TR="bgcolor: #F5F5F5"]
[TD]20-44 [/TD]
[TD]228[/TD]
[TD]0[/TD]
[TD]8.01[/TD]
[/TR]
[TR]
[TD]45-64 [/TD]
[TD]444[/TD]
[TD]0[/TD]
[TD]20.40[/TD]
[/TR]
[TR="bgcolor: #F5F5F5"]
[TD]65+ [/TD]
[TD]529[/TD]
[TD]3[/TD]
[TD]43.73[/TD]
[/TR]
[TR]
[TD]Total[/TD]
[TD]1631[/TD]
[TD]6[/TD]
[TD] [/TD]
[/TR]
[TR="bgcolor: #F5F5F5"]
[TD]%[/TD]
[TD]99.6%[/TD]
[TD]0.4%[/TD]
[TD] [/TD]
[/TR]
[/TABLE]
[h=3]Pediatric Influenza Hospitalizations and Deaths[/h] In week 03, 68 pediatric (≤16 years of age) hospitalizations with influenza have been reported by the Immunization Monitoring Program Active (IMPACT) network (Figure 7).
To date this season, 677 pediatric hospitalizations have been reported (Figure 8):
81% of cases were in children 6 months to 9 years of age.
99% (670) of cases have been associated with influenza A.
Among the 256 cases for which the influenza subtype was available, 250 (98%) were associated with A(H1N1)pdm09.
To date this season, 98 ICU admissions, and 10 deaths have been reported.
87% (100) of ICU admissions were in children 6 months to 9 years of age.
99% (114) of ICU admissions have been associated with influenza A.
80% (8) of deaths occurred in children 2 to 4 years of age.
All deaths have been associated with influenza A.
[h=3]Figure 7 ? Number of pediatric (≤16 years of age) hospitalizations reported by the IMPACT network, by week, Canada, weeks 2018-35 to 2019-03[/h]
The shaded area represents the maximum and minimum number of cases reported by week from seasons 2010-11 to 2017-18
Figure 7 - Text description [h=3]Figure 8 - Cumulative numbers of pediatric hospitalizations (≤16 years of age) with influenza by age-group reported by the IMPACT network, Canada, weeks 2018-35 to 2019-03[/h]
Figure 8 - Text description [h=3]Adult Influenza Hospitalizations and Deaths[/h] Surveillance of laboratory-confirmed influenza-associated adult (≥16 years of age) hospitalizations by the Canadian Immunization Research Network (CIRN) Serious Outcomes Surveillance (SOS) network began on November 1st for the 2018-19 season.
To date this season, 324 hospitalizations have been reported (Figure 9):
299 (92%) were associated with influenza A.
A similar proportion of hospitalizations are reported among adults <65 years of age and adults ≥65 years of age
The most commonly reported comorbidity among hospitalized cases was endocrine disorders, which were reported in 68% of hospitalized cases.
[h=3]Figure 9 - Cumulative numbers of adult hospitalizations (>20 years of age) with influenza by age-group reported by CIRN, Canada, 2018-19, weeks 2018-44 to 2019-03[/h]
Figure 9 - Text description [h=2]Influenza Strain Characterizations[/h] Since September 1, 2018, the National Microbiology Laboratory (NML) has characterized 728 influenza viruses (57 A(H3N2), 654 A(H1N1) and 17 B) that were received from Canadian laboratories.
[h=3]Genetic Characterization of Influenza A(H3N2):[/h] 40 influenza A(H3N2) viruses did not grow to sufficient hemagglutination titer for antigenic characterization by hemagglutination inhibition (HI) assay. Therefore, NML has performed genetic characterization to determine the genetic group identity of these viruses.
Sequence analysis of the HA gene of the viruses showed that:
Six viruses belonged to genetic group 3C.2a.
33 viruses belonged to subclade 3C.2a1.
One isolate could not be sequenced.
A/Singapore/INFIMH-16-0019/2016-like virus belongs to genetic group 3C.2a1 and is the influenza A(H3N2) component of the 2018-19 Northern Hemisphere influenza vaccine.
Influenza continues to circulate across Canada with eastern regions reporting higher levels of influenza activity compared to western regions.
At the national level, the influenza season appears to be past the peak of activity, with most indicators showing stable or downward trends in week 04.
Influenza A is the most common influenza virus circulating in Canada, and the majority of these viruses are A(H1N1)pdm09.
Based on a recently published Canadian influenza vaccine effectiveness study, mid-season vaccine effectiveness estimates indicate that this year?s flu shot is approximately 72% effective against the predominant circulating strain. Significant protection was observed in all age groups, especially young children who have been disproportionately affected by influenza this season.
[h=2]Influenza/Influenza-like Illness Activity (geographic spread)[/h] During week 04, the following influenza activity levels were reported (Figure 1):
2 regions reported widespread activity: in Que.(1) and P.E.I.(1).
19 regions reported localized activity: in Alta.(1), Ont.(6), Que.(3), N.L.(1) N.S.(4) and N.B.(4).
31 regions reported sporadic activity: in B.C.(5), Alta.(4), Sask.(3), Man.(5), Que.(3), N.B.(3), N.L.(3), Nvt.(3), N.W.T.(1) and Y.T.(1).
One region reported no activity: in N.W.T.(1).
[h=3]Figure 1 ? Map of overall influenza/ILI activity by province and territory, Canada, week 2019-04[/h] Figure 1 - Text description [h=2]Laboratory Confirmed Influenza Detections[/h] In week 04, the following results were reported from sentinel laboratories across Canada (Figure 2):
The percentage of tests positive for influenza was similar to the previous week at 20.7%.
A total 2,270 laboratory detections of influenza were reported, of which 98% were influenza A.
To date this season, 25,764 laboratory-confirmed influenza detections have been reported:
99% have been influenza A.
Among the 9,479 influenza A viruses subtyped, 93% have been A(H1N1)pdm09.
Provincial and territorial differences in influenza type/subtype distribution are observed (Figure 3).
To date this season, detailed information on age and type/subtype has been received for 20,254 laboratory-confirmed influenza cases (Table 1):
86% of all influenza A(H1N1)pdm09 detections have been reported in individuals younger than 65 years of age.
62% of all influenza A(H3N2) detections have been reported in adults 65 years of age and older.
For more detailed weekly and cumulative influenza data, see the text descriptions for Figures 2 and 3 or the Respiratory Virus Detections in Canada Report.
[h=3]Figure 2 ? Number of positive influenza tests and percentage of tests positive, by type, subtype and report week, Canada, weeks 2018-35 to 2019-04[/h]
The shaded area indicates weeks where the positivity rate was at least 5% and a minimum of 15 positive tests were observed, signalling the period of seasonal influenza activity.
Figure 2 - Text description [h=3]Figure 3 ? Cumulative numbers of positive influenza specimens by type/subtype and province/territory, Canada, weeks 2018-35 to 2019-04[/h]
Figure 3 - Text description [TABLE="class: table table-striped table-bordered table-hover table-condensed, width: 1140"] Table 1 - Cumulative numbers of positive influenza specimens by type, subtype and age-group reported through case-based laboratory reporting, Canada, weeks 2018-35 to 2019-04 [TR="class: bg-primary, bgcolor: #2572B4"]
Age groups (years) Cumulative (August 26, 2018 to January 26, 2019) [/TR]
[TR="class: bg-primary, bgcolor: #2572B4"]
Influenza A B Influenza A and B [/TR]
[TR="class: bg-primary, bgcolor: #2572B4"]
A Total A(H1) pdm09 A(H3) A (UnS)Footnote1 Total # % [/TR]
[TR="bgcolor: #F5F5F5"]
[TD]0-4[/TD]
[TD="class: text-right"]4446[/TD]
[TD="class: text-right"]1444[/TD]
[TD="class: text-right"]23[/TD]
[TD="class: text-right"]2979[/TD]
[TD="class: text-right"]34[/TD]
[TD="class: text-right"]4480[/TD]
[TD="class: text-right"]22%[/TD]
[/TR]
[TR]
[TD]5-19[/TD]
[TD="class: text-right"]3035[/TD]
[TD="class: text-right"]1220[/TD]
[TD="class: text-right"]21[/TD]
[TD="class: text-right"]1794[/TD]
[TD="class: text-right"]40[/TD]
[TD="class: text-right"]3075[/TD]
[TD="class: text-right"]15%[/TD]
[/TR]
[TR="bgcolor: #F5F5F5"]
[TD]20-44[/TD]
[TD="class: text-right"]4204[/TD]
[TD="class: text-right"]1512[/TD]
[TD="class: text-right"]77[/TD]
[TD="class: text-right"]2615[/TD]
[TD="class: text-right"]28[/TD]
[TD="class: text-right"]4232[/TD]
[TD="class: text-right"]21%[/TD]
[/TR]
[TR]
[TD]45-64[/TD]
[TD="class: text-right"]4110[/TD]
[TD="class: text-right"]1364[/TD]
[TD="class: text-right"]89[/TD]
[TD="class: text-right"]2657[/TD]
[TD="class: text-right"]39[/TD]
[TD="class: text-right"]4149[/TD]
[TD="class: text-right"]20%[/TD]
[/TR]
[TR="bgcolor: #F5F5F5"]
[TD]65+[/TD]
[TD="class: text-right"]4213[/TD]
[TD="class: text-right"]911[/TD]
[TD="class: text-right"]338[/TD]
[TD="class: text-right"]2964[/TD]
[TD="class: text-right"]105[/TD]
[TD="class: text-right"]4318[/TD]
[TD="class: text-right"]21%[/TD]
[/TR]
[TR]
[TD]Total[/TD]
[TD="class: text-right"]20008[/TD]
[TD="class: text-right"]6451[/TD]
[TD="class: text-right"]548[/TD]
[TD="class: text-right"]13009[/TD]
[TD="class: text-right"]246[/TD]
[TD="class: text-right"]20254[/TD]
[TD="class: text-right"]100%[/TD]
[/TR]
[TR]
[TD="colspan: 8"] Table 1 - Note 1 UnS: unsubtyped: The specimen was typed as influenza A, but no result for subtyping was available; Return to Table 1 - Note1
[/TD]
[/TR]
[/TABLE]
[h=2]Syndromic/Influenza-like Illness Surveillance[/h] [h=3]Healthcare Professionals Sentinel Syndromic Surveillance[/h] In week 04, 1.8% of visits to healthcare professionals were due to influenza-like illness (ILI) (Figure 4). The percentage of visits for ILI is within expected levels.
[h=3]Figure 4 ? Percentage of visits for ILI reported by sentinels by report week, Canada, weeks 2018-35 to 2018-19-04[/h] Number of Sentinels Reporting in Week 04: 93
The shaded area represents the maximum and minimum percentage of visits for ILI reported by week from seasons 2013-14 to 2017-18
Figure 4 - Text description [h=2]Participatory Syndromic Surveillance[/h] In week 04, 2,207 participants reported to FluWatchers, of which 64 (2.9%) reported symptoms of cough and fever (Figure 5).
Among the 64 participants who reported fever and cough:
25% consulted a healthcare professional;
75% reported days missed from work or school, resulting in a combined total of 147 missed days of work or school.
[h=3]Figure 5 - Percentage of participants reporting cough and fever, Canada, weeks 2018-40 to 2019-04[/h] Number of Participants Reporting in Week 04: 2,207
Figure 5 - Text description [h=2]Influenza Outbreak Surveillance[/h] In week 04, 27 new laboratory-confirmed influenza outbreaks were reported: long-term care facilities (LTCF) (12), acute care facilities (6), schools/daycares (1) and other settings (8). Fourteen new ILI outbreaks in long-term care facilities (3) and schools/daycares (11) were also reported in week 04.
To date this season, 296 laboratory-confirmed influenza outbreaks have been reported (Figure 6):
175 outbreaks were in LTCF, 23 were in schools, 39 in acute care facilities, and 59 were in other settings.
Among the 278 outbreaks for which the influenza type was available 99% (274) were associated with influenza A.
Among the 131 outbreaks for which the influenza A subtype was available:
76% (99) were associated with influenza A(H1N1)pdm09;
24% (32) were associated with A(H3N2),
To date this season, 72 ILI outbreaks have been reported; 41 occurred in LTCF, 28 in schools, and three in acute care facilities.
[h=3]Figure 6 ? Number of new outbreaks of laboratory-confirmed influenza by report week, Canada, weeks 2018-35 to 2019-04[/h]
Figure 6 - Text description [h=2]Severe Outcomes Influenza Surveillance[/h] Provincial/Territorial Influenza Hospitalizations and Deaths
To date this season, 1,761 influenza-associated hospitalizations have been reported by participating provinces and territoriesFootnote1. Hospitalizations (Table 2):
99.7% (1,755) were associated with influenza A
The highest estimated rate of hospitalization is among children under 5 years of age.
Intensive Care Unit (ICU) cases and deaths:
[TABLE="class: table table-striped table-bordered table-hover table-condensed, width: 1100"] Table 2 - Cumulative number of hospitalizations by age-group and influenza type, reported by participating provinces and territoriesFootnote1, Canada, weeks 2018-35 to 2019-04 [TR="class: bg-primary, bgcolor: #2572B4"]
Age Groups (years) Cumulative (August 26, 2018 to January 26, 2019) [/TR]
[TR="class: bg-primary, bgcolor: #2572B4"]
Influenza A Influenza B Rate per 100,000 population [/TR]
[TR]
[TD="colspan: 8"] Table 2 - Note 1 Influenza-associated hospitalizations are reported by Alberta, Manitoba, New Brunswick, Newfoundland and Labrador, Northwest Territories, Nova Scotia, Prince Edward Island and Yukon. Only hospitalizations that require intensive medical care are reported by Saskatchewan. The cumulative rate of hospitalizations is calculated using the total population by age-group in participating provinces and territories. Return to Table 2 - Note1
[/TD]
[/TR]
[TR="bgcolor: #F5F5F5"]
[TD]0-4 [/TD]
[TD="class: text-right"]290[/TD]
[TD="class: text-right"]2[/TD]
[TD="class: text-right"]61.35[/TD]
[/TR]
[TR]
[TD]5-19[/TD]
[TD="class: text-right"]161[/TD]
[TD="class: text-right"]0[/TD]
[TD="class: text-right"]11.60[/TD]
[/TR]
[TR="bgcolor: #F5F5F5"]
[TD]20-44 [/TD]
[TD="class: text-right"]243[/TD]
[TD="class: text-right"]0[/TD]
[TD="class: text-right"]8.54[/TD]
[/TR]
[TR]
[TD]45-64 [/TD]
[TD="class: text-right"]483[/TD]
[TD="class: text-right"]1[/TD]
[TD="class: text-right"]22.24[/TD]
[/TR]
[TR="bgcolor: #F5F5F5"]
[TD]65+ [/TD]
[TD="class: text-right"]578[/TD]
[TD="class: text-right"]3[/TD]
[TD="class: text-right"]47.75[/TD]
[/TR]
[TR]
[TD]Total[/TD]
[TD="class: text-right"]1755[/TD]
[TD="class: text-right"]6[/TD]
[TD="class: text-right"][/TD]
[/TR]
[TR="bgcolor: #F5F5F5"]
[TD]%[/TD]
[TD="class: text-right"]99.7%[/TD]
[TD="class: text-right"]0.3%[/TD]
[TD="class: text-right"] [/TD]
[/TR]
[/TABLE]
[h=3]Pediatric Influenza Hospitalizations and Deaths[/h] In week 04, 65 pediatric (≤16 years of age) hospitalizations with influenza have been reported by the Immunization Monitoring Program Active (IMPACT) network (Figure 7).
To date this season, 747 pediatric hospitalizations have been reported (Figure 8):
To date this season, 126 ICU admissions, and 10 deaths have been reported.
[h=3]Figure 7 ? Number of pediatric (≤16 years of age) hospitalizations reported by the IMPACT network, by week, Canada, weeks 2018-35 to 2019-04[/h]
The shaded area represents the maximum and minimum number of cases reported by week from seasons 2010-11 to 2017-18
Figure 7 - Text description [h=3]Figure 8 - Cumulative numbers of pediatric hospitalizations (≤16 years of age) with influenza by age-group reported by the IMPACT network, Canada, weeks 2018-35 to 2019-04[/h]
Figure 8 - Text description [h=3]Adult Influenza Hospitalizations and Deaths[/h] Surveillance of laboratory-confirmed influenza-associated adult (≥16 years of age) hospitalizations by the Canadian Immunization Research Network (CIRN) Serious Outcomes Surveillance (SOS) network began on November 1st for the 2018-19 season.
To date this season, 373 hospitalizations have been reported (Figure 9):
[h=3]Figure 9 - Cumulative numbers of adult hospitalizations (>20 years of age) with influenza by age-group reported by CIRN, Canada, 2018-19, weeks 2018-44 to 2019-04[/h]
Figure 9 - Text description [h=2]Influenza Strain Characterizations[/h] Since September 1, 2018, the National Microbiology Laboratory (NML) has characterized 785 influenza viruses (66 A(H3N2), 701 A(H1N1) and 18 B) that were received from Canadian laboratories.
[h=3]Genetic Characterization of Influenza A(H3N2):[/h] 42 influenza A(H3N2) viruses did not grow to sufficient hemagglutination titer for antigenic characterization by hemagglutination inhibition (HI) assay. Therefore, NML has performed genetic characterization to determine the genetic group identity of these viruses.
Sequence analysis of the HA gene of the viruses showed that:
A/Singapore/INFIMH-16-0019/2016-like virus belongs to genetic group 3C.2a1 and is the influenza A(H3N2) component of the 2018-19 Northern Hemisphere influenza vaccine.
[h=3]Antigenic Characterization:[/h] Influenza A (H3N2): Influenza A(H1N1): Influenza B:
Influenza B viruses can be divided into two antigenically distinct lineages represented by B/Yamagata/16/88 and B/Victoria/2/87 viruses. The recommended influenza B components for the 2018-19 Northern Hemisphere influenza vaccine are B/Colorado/06/2017 (Victoria lineage) and B/Phuket/3073/2013 (Yamagata lineage).
To date this season 319 ICU admissions and 75 deaths have been reported.
43% (137) of reported ICU admissions were in adults aged 45-64 years.
All but one of the reported deaths were associated with influenza A.
70% of cases were in children under 5 years of age.
99% (740) of cases have been associated with influenza A.
Among the 266 cases for which the influenza subtype was available, 259 (97%) were associated with A(H1N1)pdm09.
63% (80) of ICU admissions were in children under 5 years of age.
99% (125) of ICU admissions have been associated with influenza A.
80% (8) of deaths occurred in children 2 to 4 years of age.
All deaths have been associated with influenza A.
336 (90%) were associated with influenza A.
A similar proportion of hospitalizations are reported among adults <65 years of age (45.5%) and adults ≥65 years of age (55.5%).
The most commonly reported comorbidity among hospitalized cases was endocrine disorders, which were reported in 70% of hospitalized cases.
Seven viruses belonged to genetic group 3C.2a.
34 viruses belonged to subclade 3C.2a1.
One isolate could not be sequenced.
20 influenza A(H3N2) viruses were antigenically characterized as A/Singapore/INFIMH-16-0019/2016-like by HI testing using antiserum raised against egg-propagated A/Singapore/INFIMH-16-0019/2016.
Four viruses showed reduced titer with ferret antisera raised against egg-propagated A/Singapore/INFIMH-16-0019/2016.
A/Singapore/INFIMH-16-0019/2016-like virus is the influenza A(H3N2) component of the 2018-19 Northern Hemisphere influenza vaccine.
16 influenza A (H3N2) viruses characterized belonged to genetic group 3C.2a1. Two viruses belonged to genetic group 3C.2a and five to 3C.3a. Sequencing is pending for the remaining isolate.
686 A(H1N1) viruses characterized were antigenically similar to A/Michigan/45/2015, which is the influenza A(H1N1) component of the 2018-19 Northern Hemisphere influenza vaccine.
15 viruses showed reduced titer with ferret antisera raised against cell culture-propagated A/Michigan/45/2015
Three influenza B viruses were characterized as B/Colorado/06/2017, which belong to the Victoria lineage and are included as an influenza B component of the 2018-19 Northern Hemisphere influenza vaccine
15 influenza B viruses were characterized as B/Phuket/3073/2013-like, which belongs to the Yamagata lineage and is included as an influenza B component of the 2018-19 Northern Hemisphere quadrivalent influenza vaccine.
Influenza activity in Canada is declining but influenza continues to circulate with eastern regions continuing to report higher levels of influenza activity compared to western regions.
At the national level, the influenza season appears to be past the peak of activity, with most indicators showing stable or downward trends in week 05. Influenza A(H1N1)pdm09 continues to be the most common influenza virus circulating in Canada.
[h=2]Influenza/Influenza-like Illness Activity (geographic spread)[/h] During week 05, fewer regions reported high levels of activity compared to the previous week. The following influenza activity levels were reported (Figure 1):
17 regions reported localized activity: in Alta.(1), Ont.(6), Que.(3), N.L.(1), N.S.(3) and N.B.(3).
34 regions reported sporadic activity: in B.C.(5), Alta.(4), Sask.(3), Man.(5), Ont.(1), Que.(3), N.B.(4), N.S.(1), N.L.(3), P.E.I.(1), Nvt.(3) and Y.T.(1).
Two regions in N.W.T reported no activity.
[h=3]Figure 1 ? Map of overall influenza/ILI activity by province and territory, Canada, week 2019-05[/h] Figure 1 - Text equivalent [h=2]Laboratory-Confirmed Influenza Detections[/h] In week 05, the following results were reported from sentinel laboratories across Canada (Figures 2 and 3):
The percentage of tests positive for influenza was similar to the previous week at 19.7%.
A total 2,002 laboratory detections of influenza were reported, of which 98% were influenza A.
To date this season, 27,645 laboratory-confirmed influenza detections have been reported:
99% have been influenza A.
Among the 10,014 influenza A viruses subtyped, 92% have been A(H1N1)pdm09.
Influenza B often circulates later in the season in Canada (Feb-Apr). Fewer influenza B detections have been reported this season compared to recent seasons at this time of year.
To date this season, detailed information on age and type/subtype has been received for 21,728 laboratory-confirmed influenza cases (Table 1):
86% of all influenza A(H1N1)pdm09 detections have been reported in individuals younger than 65 years of age.
62% of all influenza A(H3N2) detections have been reported in adults 65 years of age and older.
For more detailed weekly and cumulative influenza data, see the text descriptions for Figures 2 and 3 or the Respiratory Virus Detections in Canada Report.
[h=3]Figure 2 ? Number of positive influenza tests and percentage of tests positive, by type, subtype and report week, Canada, weeks 2018-35 to 2019-05[/h]
The shaded area indicates weeks where the positivity rate was at least 5% and a minimum of 15 positive tests were observed, signalling the period of seasonal influenza activity.
Figure 2 - Text equivalent [h=3]Figure 3 ? Cumulative numbers of positive influenza specimens by type/subtype and province/territory, Canada, weeks 2018-35 to 2019-05[/h]
Figure 3 - Text equivalent [TABLE="class: table table-striped table-bordered table-hover table-condensed, width: 1140"] Table 1 - Cumulative numbers of positive influenza specimens by type, subtype and age-group reported through case-based laboratory reporting, Canada, weeks 2018-35 to 2019-05 [TR]
Age groups (years) Cumulative (August 26, 2018 to February 2, 2019) [/TR]
[TR]
Influenza A B Influenza A and B [/TR]
[TR]
A Total A(H1) pdm09 A(H3) A (UnS)Footnote1 Total # % [/TR]
[TR="bgcolor: #F5F5F5"]
[TD]0-4[/TD]
[TD]4775[/TD]
[TD]1493[/TD]
[TD]26[/TD]
[TD]3256[/TD]
[TD]42[/TD]
[TD]4817[/TD]
[TD]22%[/TD]
[/TR]
[TR]
[TD]5-19[/TD]
[TD]3242[/TD]
[TD]1251[/TD]
[TD]25[/TD]
[TD]1966[/TD]
[TD]46[/TD]
[TD]3288[/TD]
[TD]15%[/TD]
[/TR]
[TR="bgcolor: #F5F5F5"]
[TD]20-44[/TD]
[TD]4450[/TD]
[TD]1563[/TD]
[TD]87[/TD]
[TD]2800[/TD]
[TD]32[/TD]
[TD]4482[/TD]
[TD]21%[/TD]
[/TR]
[TR]
[TD]45-64[/TD]
[TD]4367[/TD]
[TD]1418[/TD]
[TD]98[/TD]
[TD]2851[/TD]
[TD]43[/TD]
[TD]4410[/TD]
[TD]20%[/TD]
[/TR]
[TR="bgcolor: #F5F5F5"]
[TD]65+[/TD]
[TD]4609[/TD]
[TD]966[/TD]
[TD]384[/TD]
[TD]3259[/TD]
[TD]122[/TD]
[TD]4731[/TD]
[TD]22%[/TD]
[/TR]
[TR]
[TD]Total[/TD]
[TD]21443[/TD]
[TD]6691[/TD]
[TD]620[/TD]
[TD]14132[/TD]
[TD]285[/TD]
[TD]21728[/TD]
[TD]100%[/TD]
[/TR]
[TR]
[TD="colspan: 8"] Table 1 - Note 1 UnS: unsubtyped: The specimen was typed as influenza A, but no result for subtyping was available. Return to Table 1 - Note1
[/TD]
[/TR]
[/TABLE]
[h=2]Syndromic/Influenza-like Illness Surveillance[/h] [h=3]Healthcare Professionals Sentinel Syndromic Surveillance[/h] In week 05, 1.5% of visits to healthcare professionals were due to influenza-like illness (ILI) (Figure 4). The percentage of visits for ILI is low compared to previous seasons.
[h=3]Figure 4 ? Percentage of visits for ILI reported by sentinels by report week, Canada, weeks 2018-35 to 2019-05[/h] Number of Sentinels Reporting in Week 05: 106
The shaded area represents the maximum and minimum percentage of visits for ILI reported by week from seasons 2013-14 to 2017-18
Figure 4 - Text equivalent [h=2]Participatory Syndromic Surveillance[/h] In week 05, 2,196 participants reported to FluWatchers, of which 66 (3.0%) reported symptoms of cough and fever (Figure 5).
Among the 66 participants who reported fever and cough:
27% consulted a healthcare professional;
83% reported days missed from work or school, resulting in a combined total of 190 missed days of work or school.
68% reported having been vaccinated for influenza this season.
[h=3]Figure 5 - Percentage of participants reporting cough and fever, Canada, weeks 2018-40 to 2019-05[/h] Number of Participants Reporting in Week 05: 2,196
Figure 5 - Text equivalent [h=2]Influenza Outbreak Surveillance[/h] In week 05, 24 new laboratory-confirmed influenza outbreaks were reported: long-term care facilities (LTCF) (16), acute care facilities (3), and other settings (5). Ten new ILI outbreaks in long-term care facilities (1) and schools/daycares (9) were also reported in week 05.
To date this season, 322 laboratory-confirmed influenza outbreaks have been reported (Figure 6):
193 (60%) outbreaks were in LTCF, 23 were in schools, 42 in acute care facilities, and 64 were in other settings.
Among the 301 outbreaks for which the influenza type was available 98% (296) were associated with influenza A.
Among the 140 outbreaks for which the influenza A subtype was available:
74% (104) were associated with influenza A(H1N1)pdm09;
26% (36) were associated with A(H3N2),
To date this season, 82 ILI outbreaks have been reported; 42 occurred in LTCF, 37 in schools, and three in acute care facilities.
[h=3]Figure 6 ? Number of new outbreaks of laboratory-confirmed influenza by report week, Canada, weeks 2018-35 to 2019-05[/h]
Figure 6 - Text equivalent [h=2]Severe Outcomes Influenza Surveillance[/h] Provincial/Territorial Influenza Hospitalizations and Deaths
To date this season, 1,833 influenza-associated hospitalizations have been reported by participating provinces and territoriesFootnote1. Hospitalizations (Table 2):
99.7% (1,828) were associated with influenza A
The highest estimated rate of hospitalization is among children under 5 years of age.
Intensive Care Unit (ICU) cases and deaths:
To date this season 336 ICU admissions and 77 deaths have been reported.
43% (145) of reported ICU admissions were in adults aged 45-64 years.
All but one of the reported deaths were associated with influenza A.
[TABLE="class: table table-striped table-bordered table-hover table-condensed, width: 1140"] Table 2 - Cumulative number of hospitalizations by age-group and influenza type, reported by participating provinces and territoriesFootnote1, Canada, weeks 2018-35 to 2019-05 [TR]
Age Groups (years) Cumulative (August 26, 2018 to February 2, 2019) [/TR]
[TR]
Influenza A Influenza B Rate per 100,000 population [/TR]
[TR="bgcolor: #F5F5F5"]
[TD]0-4[/TD]
[TD]297[/TD]
[TD]2[/TD]
[TD]62.82[/TD]
[/TR]
[TR]
[TD]5-19[/TD]
[TD]166[/TD]
[TD]0[/TD]
[TD]11.96[/TD]
[/TR]
[TR="bgcolor: #F5F5F5"]
[TD]20-44[/TD]
[TD]250[/TD]
[TD]0[/TD]
[TD]8.79[/TD]
[/TR]
[TR]
[TD]45-64[/TD]
[TD]503[/TD]
[TD]0[/TD]
[TD]23.11[/TD]
[/TR]
[TR="bgcolor: #F5F5F5"]
[TD]65+[/TD]
[TD]612[/TD]
[TD]3[/TD]
[TD]50.55[/TD]
[/TR]
[TR]
[TD]Total[/TD]
[TD]1828[/TD]
[TD]5[/TD]
[TD][/TD]
[/TR]
[TR="bgcolor: #F5F5F5"]
[TD]%[/TD]
[TD]99.7%[/TD]
[TD]0.3%[/TD]
[TD] [/TD]
[/TR]
[TR]
[TD="colspan: 8"] Table 2 - Note 1 Influenza-associated hospitalizations are reported by Alberta, Manitoba, New Brunswick, Newfoundland and Labrador, Northwest Territories, Nova Scotia, Prince Edward Island and Yukon. Only hospitalizations that require intensive medical care are reported by Saskatchewan. The cumulative rate of hospitalizations is calculated using the total population by age-group in participating provinces and territories. Return to Table 2 - Note1
[/TD]
[/TR]
[/TABLE]
[h=3]Pediatric Influenza Hospitalizations and Deaths[/h] In week 05, 56 pediatric (≤16 years of age) hospitalizations with influenza have been reported by the Immunization Monitoring Program Active (IMPACT) network (Figure 7).
To date this season, 802 pediatric hospitalizations have been reported (Figure 8):
69.5% of cases were in children under 5 years of age.
99% (795) of cases have been associated with influenza A.
Among the 279 cases for which the influenza subtype was available, 270 (97%) were associated with A(H1N1)pdm09.
To date this season, 135 ICU admissions, and 10 deaths have been reported.
63% (85) of ICU admissions were in children under 5 years of age.
All but one of the ICU admissions have been associated with influenza A.
80% (8) of deaths occurred in children 2 to 4 years of age.
All deaths have been associated with influenza A.
[h=3]Figure 7 ? Number of pediatric (≤16 years of age) hospitalizations reported by the IMPACT network, by week, Canada, weeks 2018-35 to 2019-05[/h]
The shaded area represents the maximum and minimum number of cases reported by week from seasons 2010-11 to 2017-18
Figure 7 - Text equivalent [h=3]Figure 8 - Cumulative numbers of pediatric hospitalizations (≤16 years of age) with influenza by age-group reported by the IMPACT network, Canada, weeks 2018-35 to 2019-05[/h]
Figure 8 - Text equivalent [h=3]Adult Influenza Hospitalizations and Deaths[/h] Surveillance of laboratory-confirmed influenza-associated adult (≥16 years of age) hospitalizations by the Canadian Immunization Research Network (CIRN) Serious Outcomes Surveillance (SOS) network began on November 1st for the 2018-19 season.
To date this season, 430 hospitalizations, 47 ICU admissions and 16 deaths have been reported (Figure 9):
388 (90%) hospitalizations were associated with influenza A.
A similar proportion of hospitalizations are reported among adults <65 years of age (43.3%) and adults ≥65 years of age (56.7%).
Similar to other indicators this season, hospitalizations among adults peaked in week 01, but has been stable over the past three weeks.
Among hospitalized cases with available information (367), the most commonly reported comorbidity was endocrine disorders, which were reported in 88% of hospitalized cases. However, 84% of cases reported more than one type of comorbid condition.
[h=3]Figure 9 - Cumulative numbers of adult hospitalizations (>20 years of age) with influenza by age-group reported by CIRN, Canada, 2018-19, weeks 2018-44 to 2019-05[/h]
Figure 9 - Text equivalent [h=2]Influenza Strain Characterizations[/h] Since September 1, 2018, the National Microbiology Laboratory (NML) has characterized 972 influenza viruses (69 A(H3N2), 882 A(H1N1) and 21 B) that were received from Canadian laboratories.
[h=3]Genetic Characterization of Influenza A(H3N2):[/h] 42 influenza A(H3N2) viruses did not grow to sufficient hemagglutination titer for antigenic characterization by hemagglutination inhibition (HI) assay. Therefore, NML has performed genetic characterization to determine the genetic group identity of these viruses.
Sequence analysis of the HA gene of the viruses showed that:
Seven viruses belonged to genetic group 3C.2a.
34 viruses belonged to subclade 3C.2a1.
One isolate could not be sequenced.
A/Singapore/INFIMH-16-0019/2016-like virus belongs to genetic group 3C.2a1 and is the influenza A(H3N2) component of the 2018-19 Northern Hemisphere influenza vaccine.
[h=3]Antigenic Characterization:[/h] Influenza A (H3N2):
23 influenza A(H3N2) viruses were antigenically characterized as A/Singapore/INFIMH-16-0019/2016-like by HI testing using antiserum raised against egg-propagated A/Singapore/INFIMH-16-0019/2016.
Four viruses showed reduced titer with ferret antisera raised against egg-propagated A/Singapore/INFIMH-16-0019/2016.
A/Singapore/INFIMH-16-0019/2016-like virus is the influenza A(H3N2) component of the 2018-19 Northern Hemisphere influenza vaccine.
17 influenza A (H3N2) viruses characterized belonged to genetic group 3C.2a1. Three viruses belonged to genetic group 3C.2a and five to 3C.3a. Sequencing is pending for the remaining isolates.
Influenza A(H1N1):
861 A(H1N1) viruses characterized were antigenically similar to A/Michigan/45/2015, which is the influenza A(H1N1) component of the 2018-19 Northern Hemisphere influenza vaccine.
21 viruses showed reduced titer with ferret antisera raised against cell culture-propagated A/Michigan/45/2015
Influenza B:
Influenza B viruses can be divided into two antigenically distinct lineages represented by B/Yamagata/16/88 and B/Victoria/2/87 viruses. The recommended influenza B components for the 2018-19 Northern Hemisphere influenza vaccine are B/Colorado/06/2017 (Victoria lineage) and B/Phuket/3073/2013 (Yamagata lineage).
Four influenza B viruses were characterized as B/Colorado/06/2017, which belong to the Victoria lineage and are included as an influenza B component of the 2018-19 Northern Hemisphere influenza vaccine
17 influenza B viruses were characterized as B/Phuket/3073/2013-like, which belongs to the Yamagata lineage and is included as an influenza B component of the 2018-19 Northern Hemisphere quadrivalent influenza vaccine.
[FONT="]Influenza activity in Canada continues to decline slowly. Influenza activity is past the peak in most regions in western Canada, but continues to circulate in eastern regions.[/FONT]
[FONT="]At the national level, most indicators of influenza activity declined in week 06.[/FONT]
[FONT="]Influenza A(H1N1)pdm09 continues to be the most common influenza virus circulating in Canada. There is currently very little influenza B circulation compared to previous seasons.[/FONT]
[FONT="]The higher proportion of laboratory detections, hospitalizations and outbreaks among people in younger age-groups reflects the increased impact of A(H1N1)pdm09 on people under 65 years of age compared to the past two seasons.[/FONT]
During week 06, fewer regions reported high levels of activity compared to the previous week. The following influenza activity levels were reported (Figure 1):[/FONT]
[FONT="]16 regions reported localized activity: in Alta.(2), Ont.(6), Que.(3), N.S.(3) and N.B.(2).[/FONT]
[FONT="]34 regions reported sporadic activity: in B.C.(5), Alta.(3), Sask.(3), Man.(4), Que.(4), N.B.(5), N.S.(1), N.L.(3), P.E.I.(1), Nvt.(3), N.W.T(1), and Y.T.(1).[/FONT]
[FONT="]Three regions: in Man.(1), N.L.(1), and N.W.T(1) reported no activity.[/FONT]
[FONT="]Figure 1 ? Map of overall influenza/ILI activity by province and territory, Canada, week 2019-06
Figure 1 - Text descriptionLaboratory Confirmed Influenza Detections
In week 06, the following results were reported from sentinel laboratories across Canada (Figure 2 and Figure 3):[/FONT]
[FONT="]The percentage of tests positive for influenza decreased slightly compared to the previous week at 18.1%.[/FONT]
[FONT="]A total 1,684 laboratory detections of influenza were reported, of which 98% were influenza A.[/FONT]
[FONT="]To date this season, 29,374 laboratory-confirmed influenza detections have been reported:[/FONT]
[FONT="]99% have been influenza A.[/FONT]
[FONT="]Among the 10,418 influenza A viruses subtyped, 91% have been A(H1N1)pdm09.[/FONT]
[FONT="]Influenza B often circulates later in the season in Canada (Feb-Apr). Fewer influenza B detections have been reported this season compared to recent seasons at this time of year.[/FONT]
[FONT="]To date this season, detailed information on age and type/subtype has been received for 22,979 laboratory-confirmed influenza cases (Table 1):[/FONT]
[FONT="]85% of all influenza A(H1N1)pdm09 detections have been reported in individuals younger than 65 years of age.[/FONT]
[FONT="]61% of all influenza A(H3N2) detections have been reported in adults 65 years of age and older.[/FONT]
[FONT="]For more detailed weekly and cumulative influenza data, see the text descriptions for Figures 2 and 3 or the Respiratory Virus Detections in Canada Report. Figure 2 ? Number of positive influenza tests and percentage of tests positive, by type, subtype and report week, Canada, weeks 2018-35 to 2019-06
The shaded area indicates weeks where the positivity rate was at least 5% and a minimum of 15 positive tests were observed, signalling the period of seasonal influenza activity.
Figure 2 - Text descriptionFigure 3 ? Cumulative numbers of positive influenza specimens by type/subtype and province/territory, Canada, weeks 2018-35 to 2019-06
In week 06, 1.1% of visits to healthcare professionals were due to influenza-like illness (ILI) (Figure 4). The percentage of visits for ILI is low compared to previous seasons. Figure 4 ? Percentage of visits for ILI reported by sentinels by report week, Canada, weeks 2018-35 to 2018-19-06
Number of Sentinels Reporting in Week 06: 98
The shaded area represents the maximum and minimum percentage of visits for ILI reported by week from seasons 2013-14 to 2017-18
Figure 4 - Text descriptionParticipatory Syndromic Surveillance
In week 06, 2,207 participants reported to FluWatchers, of which 57 (2.6%) reported symptoms of cough and fever (Figure 5).
Among the 57 participants who reported fever and cough:[/FONT]
[FONT="]11% consulted a healthcare professional;[/FONT]
[FONT="]82% reported days missed from work or school, resulting in a combined total of 114 missed days of work or school.[/FONT]
[FONT="]69% reported having been vaccinated for influenza this season.[/FONT]
[FONT="]Figure 5 - Percentage of participants reporting cough and fever, Canada, weeks 2018-40 to 2019-06
Number of Participants Reporting in Week 06: 2,207
Figure 5 - Text descriptionInfluenza Outbreak Surveillance
In week 06, 27 new laboratory-confirmed influenza outbreaks were reported: long-term care facilities (LTCF) (17), acute care facilities (5), and other settings (5). Six new ILI outbreaks in schools/daycares were also reported in week 06. The number of new outbreaks reported each week continues to decline from the peak in week 01.
To date this season, 357 laboratory-confirmed influenza outbreaks have been reported (Figure 6):[/FONT]
[FONT="]215 (60%) outbreaks were in LTCF, 23 were in schools, 48 in acute care facilities, and 71 were in other settings.[/FONT]
[FONT="]Among the 332 outbreaks for which the influenza type was available 98% (327) were associated with influenza A.[/FONT]
[FONT="]Among the 149 outbreaks for which the influenza A subtype was available, 71% (106) were associated with influenza A(H1N1)pdm09;[/FONT]
[FONT="]To date this season, 89 ILI outbreaks have been reported; 43 occurred in LTCF, 43 in schools, and three in acute care facilities. Figure 6 ? Number of new outbreaks of laboratory-confirmed influenza by report week, Canada, weeks 2018-35 to 2019-06
Figure 6 - Text descriptionSevere Outcomes Influenza Surveillance
Provincial/Territorial Influenza Hospitalizations and Deaths
To date this season, 1,933 influenza-associated hospitalizations have been reported by participating provinces and territoriesFootnote1. Hospitalizations (Table 2):[/FONT]
[FONT="]99.7% (1,927) were associated with influenza A[/FONT]
[FONT="]The highest estimated rate of hospitalization is among children under 5 years of age.[/FONT]
[FONT="]Intensive Care Unit (ICU) cases and deaths:[/FONT]
[FONT="]To date this season 356 ICU admissions and 82 deaths have been reported.[/FONT]
[FONT="]44% (156) of reported ICU admissions were in adults aged 45-64 years.[/FONT]
[FONT="]All the ICU admissions, and all but one of the deaths were associated with influenza A.[/FONT]
[FONT="] [/FONT]
[TABLE="class: table table-striped table-bordered table-hover table-condensed, width: 1140"]
[TR="class: bg-primary, bgcolor: #2572B4"]
[/TR]
[TR="class: bg-primary, bgcolor: #2572B4"]
[/TR]
[TR]
[TD="colspan: 8"][FONT="]Table 2 - Note 1Influenza-associated hospitalizations are reported by Alberta, Manitoba, New Brunswick, Newfoundland and Labrador, Northwest Territories, Nova Scotia, Prince Edward Island and Yukon. Only hospitalizations that require intensive medical care are reported by Saskatchewan. The cumulative rate of hospitalizations is calculated using the total population by age-group in participating provinces and territories. Return to Table 2 - Note1[/FONT][/TD]
[/TR]
[TR="bgcolor: #F5F5F5"]
[TD][FONT="]0-4[/FONT][/TD]
[TD="class: text-right"][FONT="]302[/FONT][/TD]
[TD="class: text-right"][FONT="]2[/FONT][/TD]
[TD="class: text-right"][FONT="]63.87[/FONT][/TD]
[/TR]
[TR]
[TD][FONT="]5-19[/FONT][/TD]
[TD="class: text-right"][FONT="]173[/FONT][/TD]
[TD="class: text-right"][FONT="]0[/FONT][/TD]
[TD="class: text-right"][FONT="]12.47[/FONT][/TD]
[/TR]
[TR="bgcolor: #F5F5F5"]
[TD][FONT="]20-44[/FONT][/TD]
[TD="class: text-right"][FONT="]269[/FONT][/TD]
[TD="class: text-right"][FONT="]0[/FONT][/TD]
[TD="class: text-right"][FONT="]9.45[/FONT][/TD]
[/TR]
[TR]
[TD][FONT="]45-64[/FONT][/TD]
[TD="class: text-right"][FONT="]526[/FONT][/TD]
[TD="class: text-right"][FONT="]0[/FONT][/TD]
[TD="class: text-right"][FONT="]24.17[/FONT][/TD]
[/TR]
[TR="bgcolor: #F5F5F5"]
[TD][FONT="]65+[/FONT][/TD]
[TD="class: text-right"][FONT="]657[/FONT][/TD]
[TD="class: text-right"][FONT="]4[/FONT][/TD]
[TD="class: text-right"][FONT="]54.33[/FONT][/TD]
[/TR]
[TR]
[TD][FONT="]Total[/FONT][/TD]
[TD="class: text-right"][FONT="]1927[/FONT][/TD]
[TD="class: text-right"][FONT="]6[/FONT][/TD]
[TD="class: text-right"] [/TD]
[/TR]
[TR="bgcolor: #F5F5F5"]
[TD][FONT="]%[/FONT][/TD]
[TD="class: text-right"][FONT="]99.7%[/FONT][/TD]
[TD="class: text-right"][FONT="]0.3%[/FONT][/TD]
[TD="class: text-right"] [/TD]
[/TR]
[/TABLE] [FONT="]Pediatric Influenza Hospitalizations and Deaths
In week 06, 36 pediatric (≤16 years of age) hospitalizations with influenza have been reported by the Immunization Monitoring Program Active (IMPACT) network (Figure 7).
To date this season, 845 pediatric hospitalizations have been reported (Figure 8):[/FONT]
[FONT="]69% of cases were in children under 5 years of age.[/FONT]
[FONT="]99% (836) of cases have been associated with influenza A.[/FONT]
[FONT="]Among the 285 cases for which the influenza subtype was available, 273 (96%) were associated with A(H1N1)pdm09.[/FONT]
[FONT="]To date this season, 140 ICU admissions, and 10 deaths have been reported.[/FONT]
[FONT="]63% (86) of ICU admissions were in children under 5 years of age.[/FONT]
[FONT="]All but one of the ICU admissions have been associated with influenza A.[/FONT]
[FONT="]80% (8) of deaths occurred in children 2 to 4 years of age.[/FONT]
[FONT="]All deaths have been associated with influenza A.[/FONT]
[FONT="]Figure 7 ? Number of pediatric (≤16 years of age) hospitalizations reported by the IMPACT network, by week, Canada, weeks 2018-35 to 2019-06
The shaded area represents the maximum and minimum number of cases reported by week from seasons 2010-11 to 2017-18
Figure 7 - Text descriptionFigure 8 - Cumulative numbers of pediatric hospitalizations (≤16 years of age) with influenza by age-group reported by the IMPACT network, Canada, weeks 2018-35 to 2019-06
Figure 8 - Text descriptionAdult Influenza Hospitalizations and Deaths
Surveillance of laboratory-confirmed influenza-associated adult (≥16 years of age) hospitalizations by the Canadian Immunization Research Network (CIRN) Serious Outcomes Surveillance (SOS) network began on November 1st for the 2018-19 season.
To date this season, 481 hospitalizations, 50 ICU admissions and 17 deaths have been reported (Figure 9):[/FONT]
[FONT="]436 (91%) hospitalizations were associated with influenza A.[/FONT]
[FONT="]A greater proportion of hospitalizations have been reported among adults ≥65 years of age (57.2%) compared to adults <65 years of age (42.8%).[/FONT]
[FONT="]Hospitalizations among adults peaked in week 01 then declined, followed by a plateau in week 03-05, and increased slightly in week 06.[/FONT]
[FONT="]Among hospitalized cases with available information (428), the most commonly reported comorbidity was endocrine disorders, which were reported in 87% of hospitalized cases. However, 83% of cases reported more than one type of comorbid condition.[/FONT]
[FONT="]Figure 9 - Cumulative numbers of adult hospitalizations (>20 years of age) with influenza by age-group reported by CIRN, Canada, 2018-19, weeks 2018-44 to 2019-06
Figure 9 - Text descriptionInfluenza Strain Characterizations
Since September 1, 2018, the National Microbiology Laboratory (NML) has characterized 1,103 influenza viruses (87 A(H3N2), 992 A(H1N1) and 24 B) that were received from Canadian laboratories. Genetic Characterization of Influenza A(H3N2):
45 influenza A(H3N2) viruses did not grow to sufficient hemagglutination titer for antigenic characterization by hemagglutination inhibition (HI) assay. Therefore, NML has performed genetic characterization to determine the genetic group identity of these viruses.
Sequence analysis of the HA gene of the viruses showed that:[/FONT]
[FONT="]Seven viruses belonged to genetic group 3C.2a.[/FONT]
[FONT="]37 viruses belonged to subclade 3C.2a1.[/FONT]
[FONT="]One isolate could not be sequenced.[/FONT]
[FONT="]A/Singapore/INFIMH-16-0019/2016-like virus belongs to genetic group 3C.2a1 and is the influenza A(H3N2) component of the 2018-19 Northern Hemisphere influenza vaccine. Antigenic Characterization:
Influenza A (H3N2):[/FONT]
[FONT="]33 influenza A(H3N2) viruses were antigenically characterized as A/Singapore/INFIMH-16-0019/2016-like by HI testing using antiserum raised against egg-propagated A/Singapore/INFIMH-16-0019/2016.[/FONT]
[FONT="]Nine viruses showed reduced titer with ferret antisera raised against egg-propagated A/Singapore/INFIMH-16-0019/2016.[/FONT]
[FONT="]A/Singapore/INFIMH-16-0019/2016-like virus is the influenza A(H3N2) component of the 2018-19 Northern Hemisphere influenza vaccine.[/FONT]
[FONT="]22 influenza A(H3N2) viruses characterized belonged to genetic group 3C.2a1. Seven viruses belonged to genetic group 3C.2a and seven to 3C.3a. Sequencing is pending for the remaining isolates.[/FONT]
[FONT="]Influenza A(H1N1):[/FONT]
[FONT="]966 A(H1N1) viruses characterized were antigenically similar to A/Michigan/45/2015, which is the influenza A(H1N1) component of the 2018-19 Northern Hemisphere influenza vaccine.[/FONT]
[FONT="]26 viruses showed reduced titer with ferret antisera raised against cell culture-propagated A/Michigan/45/2015[/FONT]
[FONT="]Influenza B:
Influenza B viruses can be divided into two antigenically distinct lineages represented by B/Yamagata/16/88 and B/Victoria/2/87 viruses. The recommended influenza B components for the 2018-19 Northern Hemisphere influenza vaccine are B/Colorado/06/2017 (Victoria lineage) and B/Phuket/3073/2013 (Yamagata lineage).[/FONT]
[FONT="]Seven influenza B viruses were characterized as B/Colorado/06/2017, which belong to the Victoria lineage and are included as an influenza B component of the 2018-19 Northern Hemisphere influenza vaccine[/FONT]
[FONT="]17 influenza B viruses were characterized as B/Phuket/3073/2013-like, which belongs to the Yamagata lineage and is included as an influenza B component of the 2018-19 Northern Hemisphere quadrivalent influenza vaccine.[/FONT]
[FONT="]Influenza activity in Canada continues to decline slowly. Influenza activity is past the peak in most regions in western Canada, but continues to circulate in eastern regions.[/FONT]
[FONT="]At the national level, most indicators of influenza activity declined in week 07.[/FONT]
[FONT="]Influenza A(H1N1)pdm09 continues to be the most common influenza virus circulating in Canada. There is currently very little influenza B circulation compared to previous seasons.[/FONT]
During week 07, levels of influenza activity were similar to the previous week. The following influenza activity levels were reported (Figure 1):[/FONT]
[FONT="]15 regions reported localized activity: in Alta.(1), Ont.(6), Que.(2), N.S.(4) and N.B.(2).[/FONT]
[FONT="]32 regions reported sporadic activity: in B.C.(5), Alta.(4), Man.(4), Ont.(1), Que.(4), N.B.(5), N.L.(4), P.E.I.(1), Nvt.(2), N.W.T(1), and Y.T.(1).[/FONT]
[FONT="]Three regions: in Man.(1), N.W.T(1), and Nvt.(1) reported no activity.[/FONT]
[FONT="]Figure 1 ? Map of overall influenza/ILI activity by province and territory, Canada, week 2019-07
Figure 1 - Text equivalentLaboratory-Confirmed Influenza Detections
In week 07, the following results were reported from sentinel laboratories across Canada (Figures 2 and 3):[/FONT]
[FONT="]The percentage of tests positive for influenza was similar to the previous week at 17.9%.[/FONT]
[FONT="]A total 1,565 laboratory detections of influenza were reported, of which 98% were influenza A.[/FONT]
[FONT="]To date this season, 30,981 laboratory-confirmed influenza detections have been reported:[/FONT]
[FONT="]99% have been influenza A.[/FONT]
[FONT="]Among the 10,778 influenza A viruses subtyped, 91% have been A(H1N1)pdm09.[/FONT]
[FONT="]Influenza B often circulates later in the season in Canada (Feb-Apr). Fewer influenza B detections have been reported this season compared to recent seasons at this time of year.[/FONT]
[FONT="]To date this season, detailed information on age and type/subtype has been received for 24,187 laboratory-confirmed influenza cases (Table 1):[/FONT]
[FONT="]85% of all influenza A(H1N1)pdm09 detections have been reported in individuals younger than 65 years of age.[/FONT]
[FONT="]62% of all influenza A(H3N2) detections have been reported in adults 65 years of age and older.[/FONT]
[FONT="]For more detailed weekly and cumulative influenza data, see the text descriptions for Figures 2 and 3 or the Respiratory Virus Detections in Canada Report. Figure 2 ? Number of positive influenza tests and percentage of tests positive, by type, subtype and report week, Canada, weeks 2018-35 to 2019-07
The shaded area indicates weeks where the positivity rate was at least 5% and a minimum of 15 positive tests were observed, signalling the period of seasonal influenza activity.
Figure 2 - Text equivalentFigure 3 ? Cumulative numbers of positive influenza specimens by type/subtype and province/territory, Canada, weeks 2018-35 to 2019-07
In week 07, 1.1% of visits to healthcare professionals were due to influenza-like illness (ILI) (Figure 4). The percentage of visits for ILI is low compared to previous seasons. Figure 4 ? Percentage of visits for ILI reported by sentinels by report week, Canada, weeks 2018-35 to 2019-07
Number of Sentinels Reporting in Week 07: 81
The shaded area represents the maximum and minimum percentage of visits for ILI reported by week from seasons 2013-14 to 2017-18
Figure 4 - Text equivalentParticipatory Syndromic Surveillance
In week 07, 2,131 participants reported to FluWatchers, of which 57 (2.7%) reported symptoms of cough and fever (Figure 5).
Among the 57 participants who reported fever and cough:[/FONT]
[FONT="]19% consulted a healthcare professional;[/FONT]
[FONT="]68% reported days missed from work or school, resulting in a combined total of 102 missed days of work or school.[/FONT]
[FONT="]69% reported having been vaccinated for influenza this season.[/FONT]
[FONT="]Figure 5 - Percentage of participants reporting cough and fever, Canada, weeks 2018-40 to 2019-07
Number of Participants Reporting in Week 07: 2,131
Figure 5 - Text equivalentInfluenza Outbreak Surveillance
In week 07, 21 new laboratory-confirmed influenza outbreaks were reported: long-term care facilities (LTCF) (13), acute care facilities (4), and other settings (4). Four new ILI outbreaks in schools/daycares were also reported in week 07. The number of new outbreaks reported each week continues to decline from the peak in week 01.
To date this season, 398 laboratory-confirmed influenza outbreaks have been reported (Figure 6):[/FONT]
[FONT="]244 (61%) outbreaks were in LTCF, 23 were in schools, 52 in acute care facilities, and 79 were in other settings.[/FONT]
[FONT="]Among the 369 outbreaks for which the influenza type was available 98% (363) were associated with influenza A.[/FONT]
[FONT="]Among the 163 outbreaks for which the influenza A subtype was available, 67% (110) were associated with influenza A(H1N1)pdm09;[/FONT]
[FONT="]To date this season, 94 ILI outbreaks have been reported; 44 occurred in LTCF, 47 in schools, and three in acute care facilities. Figure 6 ? Number of new outbreaks of laboratory-confirmed influenza by report week, Canada, weeks 2018-35 to 2019-07
Figure 6 - Text equivalentSevere Outcomes Influenza Surveillance
Provincial/Territorial Influenza Hospitalizations and Deaths
To date this season, 2,004 influenza-associated hospitalizations have been reported by participating provinces and territoriesFootnote1. Hospitalizations (Table 2):[/FONT]
[FONT="]99.7% (1,997) were associated with influenza A[/FONT]
[FONT="]The highest estimated rate of hospitalization is among children under 5 years of age.[/FONT]
[FONT="]Intensive Care Unit (ICU) cases and deaths:[/FONT]
[FONT="]To date this season 368 ICU admissions and 87 deaths have been reported.[/FONT]
[FONT="]43% (157) of reported ICU admissions were in adults aged 45-64 years.[/FONT]
[FONT="]All the ICU admissions, and all but one of the deaths were associated with influenza A.[/FONT]
[FONT="] [/FONT]
[TABLE="class: table table-striped table-bordered table-hover table-condensed, width: 1140"]
[TR]
[/TR]
[TR]
[/TR]
[TR="bgcolor: #F5F5F5"]
[TD][FONT="]0-4[/FONT][/TD]
[TD][FONT="]307[/FONT][/TD]
[TD][FONT="]2[/FONT][/TD]
[TD][FONT="]64.92[/FONT][/TD]
[/TR]
[TR]
[TD][FONT="]5-19[/FONT][/TD]
[TD][FONT="]177[/FONT][/TD]
[TD][FONT="]1[/FONT][/TD]
[TD][FONT="]12.83[/FONT][/TD]
[/TR]
[TR="bgcolor: #F5F5F5"]
[TD][FONT="]20-44[/FONT][/TD]
[TD][FONT="]274[/FONT][/TD]
[TD][FONT="]0[/FONT][/TD]
[TD][FONT="]9.63[/FONT][/TD]
[/TR]
[TR]
[TD][FONT="]45-64[/FONT][/TD]
[TD][FONT="]558[/FONT][/TD]
[TD][FONT="]1[/FONT][/TD]
[TD][FONT="]25.69[/FONT][/TD]
[/TR]
[TR="bgcolor: #F5F5F5"]
[TD][FONT="]65+[/FONT][/TD]
[TD][FONT="]681[/FONT][/TD]
[TD][FONT="]3[/FONT][/TD]
[TD][FONT="]56.22[/FONT][/TD]
[/TR]
[TR]
[TD][FONT="]Total[/FONT][/TD]
[TD][FONT="]1997[/FONT][/TD]
[TD][FONT="]7[/FONT][/TD]
[TD] [/TD]
[/TR]
[TR="bgcolor: #F5F5F5"]
[TD][FONT="]%[/FONT][/TD]
[TD][FONT="]99.7%[/FONT][/TD]
[TD][FONT="]0.3%[/FONT][/TD]
[TD] [/TD]
[/TR]
[TR]
[TD="colspan: 8"][FONT="]Table 2 - Note 1Influenza-associated hospitalizations are reported by Alberta, Manitoba, New Brunswick, Newfoundland and Labrador, Northwest Territories, Nova Scotia, Prince Edward Island and Yukon. Only hospitalizations that require intensive medical care are reported by Saskatchewan. The cumulative rate of hospitalizations is calculated using the total population by age-group in participating provinces and territories. Return to Table 2 - Note1[/FONT][/TD]
[/TR]
[/TABLE] [FONT="]Pediatric Influenza Hospitalizations and Deaths
In week 07, 44 pediatric (≤16 years of age) hospitalizations with influenza have been reported by the Immunization Monitoring Program Active (IMPACT) network (Figure 7).
To date this season, 884 pediatric hospitalizations have been reported (Figure 8):[/FONT]
[FONT="]69% of cases were in children under 5 years of age.[/FONT]
[FONT="]99% (874) of cases have been associated with influenza A.[/FONT]
[FONT="]Among the 290 cases for which the influenza subtype was available, 276 (95%) were associated with A(H1N1)pdm09.[/FONT]
[FONT="]To date this season, 147 ICU admissions, and 10 deaths have been reported.[/FONT]
[FONT="]63% (93) of ICU admissions were in children under 5 years of age.[/FONT]
[FONT="]All but one of the ICU admissions have been associated with influenza A.[/FONT]
[FONT="]80% (8) of deaths occurred in children 2 to 4 years of age.[/FONT]
[FONT="]All deaths have been associated with influenza A.[/FONT]
[FONT="]Figure 7 ? Number of pediatric (≤16 years of age) hospitalizations reported by the IMPACT network, by week, Canada, weeks 2018-35 to 2019-07
The shaded area represents the maximum and minimum number of cases reported by week from seasons 2010-11 to 2017-18
Figure 7 - Text equivalentFigure 8 - Cumulative numbers of pediatric hospitalizations (≤16 years of age) with influenza by age-group reported by the IMPACT network, Canada, weeks 2018-35 to 2019-07
Figure 8 - Text equivalentAdult Influenza Hospitalizations and Deaths
Surveillance of laboratory-confirmed influenza-associated adult (≥16 years of age) hospitalizations by the Canadian Immunization Research Network (CIRN) Serious Outcomes Surveillance (SOS) network began on November 1st for the 2018-19 season.
To date this season, 538 hospitalizations, 59 ICU admissions and 18 deaths have been reported (Figure 9):[/FONT]
[FONT="]493 (92%) hospitalizations were associated with influenza A.[/FONT]
[FONT="]A greater proportion of hospitalizations have been reported among adults ≥65 years of age (57.3%) compared to adults <65 years of age (42.8%).[/FONT]
[FONT="]Hospitalizations among adults peaked in week 01 then declined to week 04, and have increased in weeks 05 to 07.[/FONT]
[FONT="]Among hospitalized cases with available information (481), the most commonly reported comorbidity was endocrine disorders, which were reported in 78% of hospitalized cases. However, 84% of cases reported more than one type of comorbid condition.[/FONT]
[FONT="]Figure 9 - Cumulative numbers of adult hospitalizations (>20 years of age) with influenza by age-group reported by CIRN, Canada, 2018-19, weeks 2018-44 to 2019-07
Figure 9 - Text equivalentInfluenza Strain Characterizations
Since September 1, 2018, the National Microbiology Laboratory (NML) has characterized 1,287 influenza viruses (119 A(H3N2), 1,142 A(H1N1) and 26 B) that were received from Canadian laboratories. Genetic Characterization of Influenza A(H3N2):
61 influenza A(H3N2) viruses did not grow to sufficient hemagglutination titer for antigenic characterization by hemagglutination inhibition (HI) assay. Therefore, NML has performed genetic characterization to determine the genetic group identity of these viruses.
Sequence analysis of the HA gene of the viruses showed that:[/FONT]
[FONT="]10 viruses belonged to genetic group 3C.2a.[/FONT]
[FONT="]50 viruses belonged to subclade 3C.2a1.[/FONT]
[FONT="]One isolate could not be sequenced.[/FONT]
[FONT="]A/Singapore/INFIMH-16-0019/2016-like virus belongs to genetic group 3C.2a1 and is the influenza A(H3N2) component of the 2018-19 Northern Hemisphere influenza vaccine. Antigenic Characterization:
Influenza A (H3N2):[/FONT]
[FONT="]43 influenza A(H3N2) viruses were antigenically characterized as A/Singapore/INFIMH-16-0019/2016-like by HI testing using antiserum raised against egg-propagated A/Singapore/INFIMH-16-0019/2016.[/FONT]
[FONT="]15 viruses showed reduced titer with ferret antisera raised against egg-propagated A/Singapore/INFIMH-16-0019/2016.[/FONT]
[FONT="]A/Singapore/INFIMH-16-0019/2016-like virus is the influenza A(H3N2) component of the 2018-19 Northern Hemisphere influenza vaccine.[/FONT]
[FONT="]27 influenza A(H3N2) viruses characterized belonged to genetic group 3C.2a1. Nine viruses belonged to genetic group 3C.2a and nine to 3C.3a. Sequencing is pending for the remaining isolates.[/FONT]
[FONT="]Influenza A(H1N1):[/FONT]
[FONT="]1,112 A(H1N1) viruses characterized were antigenically similar to A/Michigan/45/2015, which is the influenza A(H1N1) component of the 2018-19 Northern Hemisphere influenza vaccine.[/FONT]
[FONT="]30 viruses showed reduced titer with ferret antisera raised against cell culture-propagated A/Michigan/45/2015[/FONT]
[FONT="]Influenza B:
Influenza B viruses can be divided into two antigenically distinct lineages represented by B/Yamagata/16/88 and B/Victoria/2/87 viruses. The recommended influenza B components for the 2018-19 Northern Hemisphere influenza vaccine are B/Colorado/06/2017 (Victoria lineage) and B/Phuket/3073/2013 (Yamagata lineage).[/FONT]
[FONT="]Eight influenza B viruses were characterized as B/Colorado/06/2017, which belong to the Victoria lineage and are included as an influenza B component of the 2018-19 Northern Hemisphere influenza vaccine.[/FONT]
[FONT="]One virus showed reduced titer with ferret antisera raised against cell culture-propagated B/Colorado/06/2017.[/FONT]
[FONT="]17 influenza B viruses were characterized as B/Phuket/3073/2013-like, which belongs to the Yamagata lineage and is included as an influenza B component of the 2018-19 Northern Hemisphere quadrivalent influenza vaccine.[/FONT]
Influenza activity is past the peak in most regions in western Canada, but continues to circulate at higher levels in eastern regions.
At the national level, most indicators of influenza activity remained similar, or increased slightly, compared to the previous week.
Influenza A(H1N1)pdm09 continues to be the most common influenza virus circulating in Canada. There is currently very little influenza B circulation compared to previous seasons.
The World Health Organization (WHO) has released the recommended composition of the influenza vaccine for use in the 2019-2020 northern hemisphere influenza season. The recommended strain was changed for the A(H1N1)pdm09 component.The recommendation for the A(H3N2) component has been postponed.
[h=2]Influenza/Influenza-like Illness Activity (geographic spread)[/h] During week 08, the following influenza activity levels were reported (Figure 1):
17 regions reported localized activity: in Alta.(1), Ont.(5), Que.(4), N.S.(3), N.L.(3) and N.B.(1).
29 regions reported sporadic activity: in B.C.(5), Alta.(4), Man.(4), Ont.(2), Que.(2), N.B.(6), N.L.(1), P.E.I.(1), N.S.(1), Nvt.(2), and N.W.T(1)
Three regions: in Man.(1), N.W.T(1), and Nvt.(1) reported no activity.
[h=3]Figure 1 ? Map of overall influenza/ILI activity by province and territory, Canada, week 2019-08[/h] Figure 1 - Text equivalent [h=2]Laboratory-Confirmed Influenza Detections[/h] In week 08, the following results were reported from sentinel laboratories across Canada (Figures 2 and 3):
The percentage of tests positive for influenza was 17.9%.
A total 1,535 laboratory detections of influenza were reported, of which 98% were influenza A.
Influenza A(H1N1)pdm09 and A(H3N2) accounted for equal proportions of subtyped influenza A detections.
Detections of influenza A(H3N2) have been steadily increasing, from 93 detections in week 4 (mid-January) to 199 this week.
To date this season, 32,429 laboratory-confirmed influenza detections have been reported:
99% have been influenza A.
Among the 11,210 influenza A viruses subtyped, 89% have been A(H1N1)pdm09.
Influenza B often circulates later in the season in Canada (Feb-Apr). Fewer influenza B detections have been reported this season compared to recent seasons at this time of year.
To date this season, detailed information on age and type/subtype has been received for 25,393 laboratory-confirmed influenza cases (Table 1):
85% of all influenza A(H1N1)pdm09 detections have been reported in individuals younger than 65 years of age.
61% of all influenza A(H3N2) detections have been reported in adults 65 years of age and older.
For more detailed weekly and cumulative influenza data, see the text descriptions for Figures 2 and 3 or the Respiratory Virus Detections in Canada Report.
[h=3]Figure 2 ? Number of positive influenza tests and percentage of tests positive, by type, subtype and report week, Canada, weeks 2018-35 to 2019-08[/h]
The shaded area indicates weeks where the positivity rate was at least 5% and a minimum of 15 positive tests were observed, signalling the period of seasonal influenza activity.
Figure 2 - Text equivalent [h=3]Figure 3 ? Cumulative numbers of positive influenza specimens by type/subtype and province/territory, Canada, weeks 2018-35 to 2019-08[/h]
Figure 3 - Text equivalent [TABLE="class: table table-striped table-bordered table-hover table-condensed, width: 1140"] Table 1 - Cumulative numbers of positive influenza specimens by type, subtype and age-group reported through case-based laboratory reporting, Canada, weeks 2018-35 to 2019-08 [TR]
Age groups (years) Cumulative (August 26, 2018 to February 23, 2019) [/TR]
[TR]
Influenza A B Influenza A and B [/TR]
[TR]
A Total A(H1) pdm09 A(H3) A (UnS)Footnote1 Total # % [/TR]
[TR="bgcolor: #F5F5F5"]
[TD]0-4[/TD]
[TD="class: text-right"]5452[/TD]
[TD="class: text-right"]1570[/TD]
[TD="class: text-right"]42[/TD]
[TD="class: text-right"]3840[/TD]
[TD="class: text-right"]62[/TD]
[TD="class: text-right"]5514[/TD]
[TD="class: text-right"]22%[/TD]
[/TR]
[TR]
[TD]5-19[/TD]
[TD="class: text-right"]3724[/TD]
[TD="class: text-right"]1300[/TD]
[TD="class: text-right"]58[/TD]
[TD="class: text-right"]2366[/TD]
[TD="class: text-right"]70[/TD]
[TD="class: text-right"]3794[/TD]
[TD="class: text-right"]15%[/TD]
[/TR]
[TR="bgcolor: #F5F5F5"]
[TD]20-44[/TD]
[TD="class: text-right"]5064[/TD]
[TD="class: text-right"]1699[/TD]
[TD="class: text-right"]139[/TD]
[TD="class: text-right"]3226[/TD]
[TD="class: text-right"]55[/TD]
[TD="class: text-right"]5119[/TD]
[TD="class: text-right"]20%[/TD]
[/TR]
[TR]
[TD]45-64[/TD]
[TD="class: text-right"]5018[/TD]
[TD="class: text-right"]1597[/TD]
[TD="class: text-right"]139[/TD]
[TD="class: text-right"]3282[/TD]
[TD="class: text-right"]49[/TD]
[TD="class: text-right"]5067[/TD]
[TD="class: text-right"]20%[/TD]
[/TR]
[TR="bgcolor: #F5F5F5"]
[TD]65+[/TD]
[TD="class: text-right"]5755[/TD]
[TD="class: text-right"]1110[/TD]
[TD="class: text-right"]596[/TD]
[TD="class: text-right"]4049[/TD]
[TD="class: text-right"]144[/TD]
[TD="class: text-right"]5899[/TD]
[TD="class: text-right"]23%[/TD]
[/TR]
[TR]
[TD]Total[/TD]
[TD="class: text-right"]25013[/TD]
[TD="class: text-right"]7276[/TD]
[TD="class: text-right"]974[/TD]
[TD="class: text-right"]16763[/TD]
[TD="class: text-right"]380[/TD]
[TD="class: text-right"]25393[/TD]
[TD="class: text-right"]100%[/TD]
[/TR]
[TR]
[TD="colspan: 8"] Table 1 - Note 1 UnS: unsubtyped: The specimen was typed as influenza A, but no result for subtyping was available. Return to Table 1 - Note1
[/TD]
[/TR]
[/TABLE]
[h=2]Syndromic/Influenza-like Illness Surveillance[/h] [h=3]Healthcare Professionals Sentinel Syndromic Surveillance[/h] In week 08, 1.2% of visits to healthcare professionals were due to influenza-like illness (ILI) (Figure 4). The percentage of visits for ILI is low compared to previous seasons.
[h=3]Figure 4 ? Percentage of visits for ILI reported by sentinels by report week, Canada, weeks 2018-35 to 2019-08[/h] Number of Sentinels Reporting in Week 08: 117
The shaded area represents the maximum and minimum percentage of visits for ILI reported by week from seasons 2013-14 to 2017-18
Figure 4 - Text equivalent [h=2]Participatory Syndromic Surveillance[/h] In week 08, 2,131 participants reported to FluWatchers, of which 53 (2.5%) reported symptoms of cough and fever (Figure 5).
Among the 53 participants who reported fever and cough:
9% consulted a healthcare professional;
74% reported days missed from work or school, resulting in a combined total of 102 missed days of work or school.
[h=3]Figure 5 - Percentage of participants reporting cough and fever, Canada, weeks 2018-40 to 2019-08[/h] Number of Participants Reporting in Week 08: 2,131
Figure 5 - Text equivalent [h=2]Influenza Outbreak Surveillance[/h] In week 08, 37 new laboratory-confirmed influenza outbreaks were reported: long-term care facilities (LTCF) (20), acute care facilities (4), schools and daycares (4) and other settings (9). Two new ILI outbreaks in long-term care facilities were also reported in week 08.
To date this season, 446 laboratory-confirmed influenza outbreaks have been reported (Figure 6):
269 (60%) outbreaks were in LTCF, 27 were in schools, 61 in acute care facilities, and 89 were in other settings.
Among the 408 outbreaks for which the influenza type was available, 99% (402) were associated with influenza A.
Among the 177 outbreaks for which the influenza A subtype was available, 63% (112) were associated with influenza A(H1N1)pdm09;
To date this season, 107 ILI outbreaks have been reported; 56 occurred in LTCF, 47 in schools, and four in acute care facilities.
[h=3]Figure 6 ? Number of new outbreaks of laboratory-confirmed influenza by report week, Canada, weeks 2018-35 to 2019-08[/h]
Figure 6 - Text equivalent [h=2]Severe Outcomes Influenza Surveillance[/h] Provincial/Territorial Influenza Hospitalizations and Deaths
To date this season, 2,093 influenza-associated hospitalizations have been reported by participating provinces and territoriesFootnote1. Hospitalizations (Table 2):
99.6% (2,085) were associated with influenza A
The highest estimated rate of hospitalization is among children under 5 years of age.
Intensive Care Unit (ICU) cases and deaths:
To date this season 384 ICU admissions and 93 deaths have been reported.
42% (163) of reported ICU admissions were in adults aged 45-64 years.
All the ICU admissions, and all but one of the deaths were associated with influenza A.
[TABLE="class: table table-striped table-bordered table-hover table-condensed, width: 1140"] Table 2 - Cumulative number of hospitalizations by age-group and influenza type, reported by participating provinces and territoriesFootnote1, Canada, weeks 2018-35 to 2019-08 [TR]
Age Groups (years) Cumulative (August 26, 2018 to February 23, 2019) [/TR]
[TR]
Influenza A Influenza B Rate per 100,000 population [/TR]
[TR="bgcolor: #F5F5F5"]
[TD]0-4[/TD]
[TD="class: text-right"]316[/TD]
[TD="class: text-right"]2[/TD]
[TD="class: text-right"]66.81[/TD]
[/TR]
[TR]
[TD]5-19[/TD]
[TD="class: text-right"]179[/TD]
[TD="class: text-right"]2[/TD]
[TD="class: text-right"]13.04[/TD]
[/TR]
[TR="bgcolor: #F5F5F5"]
[TD]20-44[/TD]
[TD="class: text-right"]287[/TD]
[TD="class: text-right"]0[/TD]
[TD="class: text-right"]10.09[/TD]
[/TR]
[TR]
[TD]45-64[/TD]
[TD="class: text-right"]581[/TD]
[TD="class: text-right"]1[/TD]
[TD="class: text-right"]26.74[/TD]
[/TR]
[TR="bgcolor: #F5F5F5"]
[TD]65+[/TD]
[TD="class: text-right"]722[/TD]
[TD="class: text-right"]3[/TD]
[TD="class: text-right"]59.59[/TD]
[/TR]
[TR]
[TD]Total[/TD]
[TD="class: text-right"]2085[/TD]
[TD="class: text-right"]8[/TD]
[TD="class: text-right"] [/TD]
[/TR]
[TR="bgcolor: #F5F5F5"]
[TD]%[/TD]
[TD="class: text-right"]99.6%[/TD]
[TD="class: text-right"]0.4%[/TD]
[TD="class: text-right"] [/TD]
[/TR]
[TR]
[TD="colspan: 8"] Table 2 - Note 1 Influenza-associated hospitalizations are reported by Alberta, Manitoba, New Brunswick, Newfoundland and Labrador, Northwest Territories, Nova Scotia, Prince Edward Island and Yukon. Only hospitalizations that require intensive medical care are reported by Saskatchewan. The cumulative rate of hospitalizations is calculated using the total population by age-group in participating provinces and territories. Return to Table 2 - Note1
[/TD]
[/TR]
[/TABLE]
[h=3]Pediatric Influenza Hospitalizations and Deaths[/h] In week 08, 43 pediatric (≤16 years of age) hospitalizations with influenza have been reported by the Immunization Monitoring Program Active (IMPACT) network (Figure 7).
To date this season, 928 pediatric hospitalizations have been reported (Figure 8):
69% of cases were in children under 5 years of age.
98% (914) of cases have been associated with influenza A.
Among the 295 cases for which the influenza subtype was available, 280 (95%) were associated with A(H1N1)pdm09.
To date this season, 159 ICU admissions, and 10 deaths have been reported.
63% (101) of ICU admissions were in children under 5 years of age.
All but two of the ICU admissions have been associated with influenza A.
80% (8) of deaths occurred in children 2 to 4 years of age.
All deaths have been associated with influenza A.
[h=3]Figure 7 ? Number of pediatric (≤16 years of age) hospitalizations reported by the IMPACT network, by week, Canada, weeks 2018-35 to 2019-08[/h]
The shaded area represents the maximum and minimum number of cases reported by week from seasons 2010-11 to 2017-18
Figure 7 - Text equivalent [h=3]Figure 8 - Cumulative numbers of pediatric hospitalizations (≤16 years of age) with influenza by age-group reported by the IMPACT network, Canada, weeks 2018-35 to 2019-08[/h]
Figure 8 - Text equivalent [h=3]Adult Influenza Hospitalizations and Deaths[/h] Surveillance of laboratory-confirmed influenza-associated adult (≥16 years of age) hospitalizations by the Canadian Immunization Research Network (CIRN) Serious Outcomes Surveillance (SOS) network began on November 1st for the 2018-19 season.
To date this season, 590 hospitalizations, 65 ICU admissions and 22 deaths have been reported (Figure 9):
543 (92%) hospitalizations were associated with influenza A.
A greater proportion of hospitalizations have been reported among adults ≥65 years of age (58%) compared to adults <65 years of age (42%).
84% of hospitalized cases reported more than one type of comorbid condition.
The most commonly reported comorbidity was endocrine disorders, which were reported in 80% of hospitalized cases.
[h=3]Figure 9 - Cumulative numbers of adult hospitalizations (>20 years of age) with influenza by age-group reported by CIRN, Canada, 2018-19, weeks 2018-44 to 2019-08[/h]
Figure 9 - Text equivalent [h=2]Influenza Strain Characterizations[/h] Since September 1, 2018, the National Microbiology Laboratory (NML) has characterized 1,412 influenza viruses (150 A(H3N2), 1,234 A(H1N1) and 28 B) that were received from Canadian laboratories.
[h=3]Genetic Characterization of Influenza A(H3N2):[/h] 79 influenza A(H3N2) viruses did not grow to sufficient hemagglutination titer for antigenic characterization by hemagglutination inhibition (HI) assay. Therefore, NML has performed genetic characterization to determine the genetic group identity of these viruses.
Sequence analysis of the HA gene of the viruses showed that:
15 viruses belonged to genetic group 3C.2a.
63 viruses belonged to subclade 3C.2a1.
One isolate could not be sequenced.
A/Singapore/INFIMH-16-0019/2016-like virus belongs to genetic group 3C.2a1 and is the influenza A(H3N2) component of the 2018-19 Northern Hemisphere influenza vaccine.
[h=3]Antigenic Characterization:[/h] Influenza A (H3N2):
55 influenza A(H3N2) viruses were antigenically characterized as A/Singapore/INFIMH-16-0019/2016-like by HI testing using antiserum raised against egg-propagated A/Singapore/INFIMH-16-0019/2016.
16 viruses showed reduced titer with ferret antisera raised against egg-propagated A/Singapore/INFIMH-16-0019/2016.
A/Singapore/INFIMH-16-0019/2016-like virus is the influenza A(H3N2) component of the 2018-19 Northern Hemisphere influenza vaccine.
33 influenza A(H3N2) viruses characterized belonged to genetic group 3C.2a1. 15 viruses belonged to genetic group 3C.2a and 11 to 3C.3a. Sequencing is pending for the remaining isolates.
Influenza A(H1N1):
1,201 A(H1N1) viruses characterized were antigenically similar to A/Michigan/45/2015, which is the influenza A(H1N1) component of the 2018-19 Northern Hemisphere influenza vaccine.
33 viruses showed reduced titer with ferret antisera raised against cell culture-propagated A/Michigan/45/2015
Influenza B:
Influenza B viruses can be divided into two antigenically distinct lineages represented by B/Yamagata/16/88 and B/Victoria/2/87 viruses. The recommended influenza B components for the 2018-19 Northern Hemisphere influenza vaccine are B/Colorado/06/2017 (Victoria lineage) and B/Phuket/3073/2013 (Yamagata lineage).
Nine influenza B viruses were characterized as B/Colorado/06/2017, which belong to the Victoria lineage and are included as an influenza B component of the 2018-19 Northern Hemisphere influenza vaccine.
Two viruses showed reduced titer with ferret antisera raised against cell culture-propagated B/Colorado/06/2017.
17 influenza B viruses were characterized as B/Phuket/3073/2013-like, which belongs to the Yamagata lineage and is included as an influenza B component of the 2018-19 Northern Hemisphere quadrivalent influenza vaccine.
[h=2]Influenza/Influenza-like Illness Activity (geographic spread)[/h] During week 09, the following influenza activity levels were reported (Figure 1):
16 regions reported localized activity: in Alta.(1), Ont.(6), Que.(2), N.S.(3), N.L.(2) and N.B.(2).
30 regions reported sporadic activity: in B.C.(5), Alta.(4), Sask.(2), Ont.(1), Que.(4), N.B.(5), N.L.(1), P.E.I.(1), N.S.(1), Nvt.(3), Y.T.(1) and N.W.T.(2)
Two regions: in N.L.(1) and Sask.(1) reported no activity.
[h=3]Figure 1 ? Map of overall influenza/ILI activity by province and territory, Canada, week 2019-09[/h] Figure 1 - Text equivalent [h=2]Laboratory-Confirmed Influenza Detections[/h] In week 09, the following results were reported from sentinel laboratories across Canada (Figures 2 and 3):
The percentage of tests positive for influenza continued to increase slightly to 20.1%.
A total 1,692 laboratory detections of influenza were reported, of which 96% were influenza A.
Influenza A(H3N2) accounted for 58% of subtyped influenza A detections.
Detections of influenza A(H3N2) have been steadily increasing, from 93 detections in week 4 (mid-January) to 271 this week.
To date this season, 34,267 laboratory-confirmed influenza detections have been reported:
98% have been influenza A.
Among the 11,749 influenza A viruses subtyped, 87% have been A(H1N1)pdm09.
Influenza B often circulates later in the season in Canada (Feb-Apr). Fewer influenza B detections have been reported this season compared to recent seasons at this time of year.
To date this season, detailed information on age and type/subtype has been received for 26,890 laboratory-confirmed influenza cases (Table 1):
84% of all influenza A(H1N1)pdm09 detections have been reported in individuals younger than 65 years of age.
61% of all influenza A(H3N2) detections have been reported in adults 65 years of age and older.
For more detailed weekly and cumulative influenza data, see the text descriptions for Figures 2 and 3 or the Respiratory Virus Detections in Canada Report.
[h=3]Figure 2 ? Number of positive influenza tests and percentage of tests positive, by type, subtype and report week, Canada, weeks 2018-35 to 2019-09[/h]
The shaded area indicates weeks where the positivity rate was at least 5% and a minimum of 15 positive tests were observed, signalling the period of seasonal influenza activity.
Figure 2 - Text equivalent [h=3]Figure 3 ? Cumulative numbers of positive influenza specimens by type/subtype and province/territory, Canada, weeks 2018-35 to 2019-09[/h]
Figure 3 - Text equivalent [TABLE="class: table table-striped table-bordered table-hover table-condensed, width: 1140"]
Table 1 - Cumulative numbers of positive influenza specimens by type, subtype and age-group reported through case-based laboratory reporting, Canada, weeks 2018-35 to 2019-09 [TR]
Age groups (years) Cumulative (August 26, 2018 to March 2, 2019) [/TR]
[TR]
Influenza A B Influenza A and B [/TR]
[TR]
A Total A(H1) pdm09 A(H3) A (UnS)Footnote1 Total # % [/TR]
[TR="bgcolor: #F5F5F5"]
[TD]0-4[/TD]
[TD="class: text-right"]5671[/TD]
[TD="class: text-right"]1594[/TD]
[TD="class: text-right"]58[/TD]
[TD="class: text-right"]4019[/TD]
[TD="class: text-right"]72[/TD]
[TD="class: text-right"]5743[/TD]
[TD="class: text-right"]21%[/TD]
[/TR]
[TR]
[TD]5-19[/TD]
[TD="class: text-right"]3892[/TD]
[TD="class: text-right"]1321[/TD]
[TD="class: text-right"]79[/TD]
[TD="class: text-right"]2492[/TD]
[TD="class: text-right"]90[/TD]
[TD="class: text-right"]3982[/TD]
[TD="class: text-right"]15%[/TD]
[/TR]
[TR="bgcolor: #F5F5F5"]
[TD]20-44[/TD]
[TD="class: text-right"]5286[/TD]
[TD="class: text-right"]1743[/TD]
[TD="class: text-right"]174[/TD]
[TD="class: text-right"]3369[/TD]
[TD="class: text-right"]69[/TD]
[TD="class: text-right"]5355[/TD]
[TD="class: text-right"]20%[/TD]
[/TR]
[TR]
[TD]45-64[/TD]
[TD="class: text-right"]5307[/TD]
[TD="class: text-right"]1653[/TD]
[TD="class: text-right"]168[/TD]
[TD="class: text-right"]3486[/TD]
[TD="class: text-right"]54[/TD]
[TD="class: text-right"]5361[/TD]
[TD="class: text-right"]20%[/TD]
[/TR]
[TR="bgcolor: #F5F5F5"]
[TD]65+[/TD]
[TD="class: text-right"]6292[/TD]
[TD="class: text-right"]1173[/TD]
[TD="class: text-right"]752[/TD]
[TD="class: text-right"]4367[/TD]
[TD="class: text-right"]157[/TD]
[TD="class: text-right"]6449[/TD]
[TD="class: text-right"]24%[/TD]
[/TR]
[TR]
[TD]Total[/TD]
[TD="class: text-right"]26448[/TD]
[TD="class: text-right"]7484[/TD]
[TD="class: text-right"]1231[/TD]
[TD="class: text-right"]17733[/TD]
[TD="class: text-right"]442[/TD]
[TD="class: text-right"]26890[/TD]
[TD="class: text-right"]100%[/TD]
[/TR]
[TR]
[TD="colspan: 8"] Table 1 - Note 1 UnS: unsubtyped: The specimen was typed as influenza A, but no result for subtyping was available. Return to Table 1 - Note1
[/TD]
[/TR]
[/TABLE]
[h=2]Syndromic/Influenza-like Illness Surveillance[/h] [h=3]Healthcare Professionals Sentinel Syndromic Surveillance[/h] In week 09, 1.6% of visits to healthcare professionals were due to influenza-like illness (ILI) (Figure 4). The percentage of visits for ILI is low compared to previous seasons.
[h=3]Figure 4 ? Percentage of visits for ILI reported by sentinels by report week, Canada, weeks 2018-35 to 2019-09[/h] Number of Sentinels Reporting in Week 09: 84
The shaded area represents the maximum and minimum percentage of visits for ILI reported by week from seasons 2013-14 to 2017-18
Figure 4 - Text equivalent [h=2]Participatory Syndromic Surveillance[/h] In week 09, 2,101 participants reported to FluWatchers, of which 57 (Figure 5).
Among the 57 participants who reported fever and cough:
16% consulted a healthcare professional;
74% reported days missed from work or school, resulting in a combined total of 118 missed days of work or school.
[h=3]Figure 5 - Percentage of participants reporting cough and fever, Canada, weeks 2018-40 to 2019-09[/h] Number of Participants Reporting in Week 09: 2,101
Figure 5 - Text equivalent [h=2]Influenza Outbreak Surveillance[/h] In week 09, 37 new laboratory-confirmed influenza outbreaks were reported: long-term care facilities (LTCF) (18), acute care facilities (8), schools and daycares (1) and other settings (10). Among the outbreaks with available subtype information (12), 92% (11) were associated with influenza A(H3N2).
To date this season, 491 laboratory-confirmed influenza outbreaks have been reported (Figure 6):
292 (59%) outbreaks were in LTCF, 28 were in schools, 71 in acute care facilities, and 100 were in other settings.
Among the 444 outbreaks for which the influenza type was available, 98% (436) were associated with influenza A.
Among the 194 outbreaks for which the influenza A subtype was available, 59% (114) were associated with influenza A(H1N1)pdm09;
To date this season, 107 ILI outbreaks have been reported; 56 occurred in LTCF, 47 in schools, and four in acute care facilities.
[h=3]Figure 6 ? Number of new outbreaks of laboratory-confirmed influenza by report week, Canada, weeks 2018-35 to 2019-09[/h]
Figure 6 - Text equivalent [h=2]Severe Outcomes Influenza Surveillance[/h] Provincial/Territorial Influenza Hospitalizations and Deaths
To date this season, 2,214 influenza-associated hospitalizations have been reported by participating provinces and territoriesFootnote1.
Hospitalizations (Table 2):
99.5% (2,202) were associated with influenza A
The highest estimated rate of hospitalization is among children under 5 years of age.
Intensive Care Unit (ICU) cases and deaths:
To date this season 403 ICU admissions and 93 deaths have been reported.
42% (163) of reported ICU admissions were in adults aged 45-64 years.
All but two ICU admissions were associated with influenza A.
All but one of the deaths were associated with influenza A.
[TABLE="class: table table-striped table-bordered table-hover table-condensed, width: 1140"]
Table 2 - Cumulative number of hospitalizations by age-group and influenza type, reported by participating provinces and territoriesFootnote1, Canada, weeks 2018-35 to 2019-09 [TR]
Age Groups (years) Cumulative (August 26, 2018 to March 2, 2019) [/TR]
[TR]
Influenza A Influenza B Rate per 100,000 population [/TR]
[TR="bgcolor: #F5F5F5"]
[TD]0-4[/TD]
[TD="class: text-right"]323[/TD]
[TD="class: text-right"]4[/TD]
[TD="class: text-right"]68.70[/TD]
[/TR]
[TR]
[TD]5-19[/TD]
[TD="class: text-right"]189[/TD]
[TD="class: text-right"]2[/TD]
[TD="class: text-right"]13.76[/TD]
[/TR]
[TR="bgcolor: #F5F5F5"]
[TD]20-44[/TD]
[TD="class: text-right"]294[/TD]
[TD="class: text-right"]0[/TD]
[TD="class: text-right"]10.33[/TD]
[/TR]
[TR]
[TD]45-64[/TD]
[TD="class: text-right"]610[/TD]
[TD="class: text-right"]2[/TD]
[TD="class: text-right"]28.12[/TD]
[/TR]
[TR="bgcolor: #F5F5F5"]
[TD]65+[/TD]
[TD="class: text-right"]786[/TD]
[TD="class: text-right"]4[/TD]
[TD="class: text-right"]64.93[/TD]
[/TR]
[TR]
[TD]Total[/TD]
[TD="class: text-right"]2202[/TD]
[TD="class: text-right"]12[/TD]
[TD="class: text-right"] [/TD]
[/TR]
[TR="bgcolor: #F5F5F5"]
[TD]%[/TD]
[TD="class: text-right"]99.5%[/TD]
[TD="class: text-right"]0.5%[/TD]
[TD="class: text-right"] [/TD]
[/TR]
[TR]
[TD="colspan: 8"] Table 2 - Note 1 Influenza-associated hospitalizations are reported by Alberta, Manitoba, New Brunswick, Newfoundland and Labrador, Northwest Territories, Nova Scotia, Prince Edward Island and Yukon. Only hospitalizations that require intensive medical care are reported by Saskatchewan. The cumulative rate of hospitalizations is calculated using the total population by age-group in participating provinces and territories. Return to Table 2 - Note1
[/TD]
[/TR]
[/TABLE]
[h=3]Pediatric Influenza Hospitalizations and Deaths[/h] In week 09, 30 pediatric (≤16 years of age) hospitalizations with influenza have been reported by the Immunization Monitoring Program Active (IMPACT) network (Figure 7).
To date this season, 964 pediatric hospitalizations have been reported (Figure 8):
69% of cases were in children under 5 years of age.
98% (947) of cases have been associated with influenza A.
Among the 301 cases for which the influenza subtype was available, 283 (94%) were associated with A(H1N1)pdm09.
To date this season, 167 ICU admissions, and 10 deaths have been reported.
63% (106) of ICU admissions were in children under 5 years of age.
All but two of the ICU admissions have been associated with influenza A.
80% (8) of deaths occurred in children 2 to 4 years of age.
All deaths have been associated with influenza A.
[h=3]Figure 7 ? Number of pediatric (≤16 years of age) hospitalizations reported by the IMPACT network, by week, Canada, weeks 2018-35 to 2019-09[/h]
The shaded area represents the maximum and minimum number of cases reported by week from seasons 2010-11 to 2017-18
Figure 7 - Text equivalent [h=3]Figure 8 - Cumulative numbers of pediatric hospitalizations (≤16 years of age) with influenza by age-group reported by the IMPACT network, Canada, weeks 2018-35 to 2019-09[/h]
Figure 8 - Text equivalent [h=3]Adult Influenza Hospitalizations and Deaths[/h] Surveillance of laboratory-confirmed influenza-associated adult (≥16 years of age) hospitalizations by the Canadian Immunization Research Network (CIRN) Serious Outcomes Surveillance (SOS) network began on November 1st for the 2018-19 season.
To date this season, 641 hospitalizations, 71 ICU admissions and 25 deaths have been reported (Figure 9):
594 (93%) hospitalizations were associated with influenza A.
A greater proportion of hospitalizations have been reported among adults ≥65 years of age (58%) compared to adults <65 years of age (42%).
85% of hospitalized cases reported more than one type of comorbid condition.
The most commonly reported comorbidity was endocrine disorders, which were reported in 81% of hospitalized cases.
[h=3]Figure 9 - Cumulative numbers of adult hospitalizations (>20 years of age) with influenza by age-group reported by CIRN, Canada, 2018-19, weeks 2018-44 to 2019-09[/h]
Figure 9 - Text equivalent [h=2]Influenza Strain Characterizations[/h] Since September 1, 2018, the National Microbiology Laboratory (NML) has characterized 1,495 influenza viruses (174 A(H3N2), 1,289 A(H1N1) and 32 B) that were received from Canadian laboratories.
[h=3]Genetic Characterization of Influenza A(H3N2):[/h] 87 influenza A(H3N2) viruses did not grow to sufficient hemagglutination titer for antigenic characterization by hemagglutination inhibition (HI) assay. Therefore, NML has performed genetic characterization to determine the genetic group identity of these viruses.
Sequence analysis of the HA gene of the viruses showed that:
16 viruses belonged to genetic group 3C.2a.
68 viruses belonged to subclade 3C.2a1.
Two viruses belonged to 3C.3a.
One isolate could not be sequenced.
A/Singapore/INFIMH-16-0019/2016-like virus belongs to genetic group 3C.2a1 and is the influenza A(H3N2) component of the 2018-19 Northern Hemisphere influenza vaccine.
[h=3]Antigenic Characterization:[/h] Influenza A (H3N2):
65 influenza A(H3N2) viruses were antigenically characterized as A/Singapore/INFIMH-16-0019/2016-like by HI testing using antiserum raised against egg-propagated A/Singapore/INFIMH-16-0019/2016.
22 viruses showed reduced titer with ferret antisera raised against egg-propagated A/Singapore/INFIMH-16-0019/2016.
A/Singapore/INFIMH-16-0019/2016-like virus is the influenza A(H3N2) component of the 2018-19 Northern Hemisphere influenza vaccine.
44 influenza A(H3N2) viruses characterized belonged to genetic group 3C.2a1. 15 viruses belonged to genetic group 3C.2a and 11 to 3C.3a. Sequencing is pending for the remaining isolates.
Influenza A(H1N1):
1,253 A(H1N1) viruses characterized were antigenically similar to A/Michigan/45/2015, which is the influenza A(H1N1) component of the 2018-19 Northern Hemisphere influenza vaccine.
36 viruses showed reduced titer with ferret antisera raised against cell culture-propagated A/Michigan/45/2015
Influenza B:
Influenza B viruses can be divided into two antigenically distinct lineages represented by B/Yamagata/16/88 and B/Victoria/2/87 viruses. The recommended influenza B components for the 2018-19 Northern Hemisphere influenza vaccine are B/Colorado/06/2017 (Victoria lineage) and B/Phuket/3073/2013 (Yamagata lineage).
Nine influenza B viruses were characterized as B/Colorado/06/2017, which belong to the Victoria lineage and are included as an influenza B component of the 2018-19 Northern Hemisphere influenza vaccine.
Four viruses showed reduced titer with ferret antisera raised against cell culture-propagated B/Colorado/06/2017.
19 influenza B viruses were characterized as B/Phuket/3073/2013-like, which belongs to the Yamagata lineage and is included as an influenza B component of the 2018-19 Northern Hemisphere quadrivalent influenza vaccine.
[h=2]Influenza/Influenza-like Illness Activity (geographic spread)[/h] During week 10, the following influenza activity levels were reported (Figure 1):
17 regions reported localized activity: in Alta.(1), Ont.(5), Que.(2), N.S.(4), N.B.(3), and N.L.(2).
30 regions reported sporadic activity: in B.C.(5), Alta.(4), Man.(4), Ont.(2), Que.(4), N.B.(3), N.L.(2), P.E.I.(1), Nvt.(3), Y.T.(1) and N.W.T.(1)
Three regions: in Man.(1), N.B.(1) and N.W.T.(1) reported no activity.
[h=3]Figure 1 ? Map of overall influenza/ILI activity by province and territory, Canada, week 2019-10[/h] Figure 1 - Text equivalent [h=2]Laboratory-Confirmed Influenza Detections[/h] In week 10, the following results were reported from sentinel laboratories across Canada (Figures 2 and 3):
The percentage of tests positive for influenza continued to increase slightly to 21.3%.
A total 1,803 laboratory detections of influenza were reported, of which 96% were influenza A.
Influenza A(H3N2) accounted for 56% of subtyped influenza A detections.
Detections of influenza A(H3N2) have been steadily increasing, from 93 detections in week 4 (mid-January) to 308 this week.
To date this season, 36,124 laboratory-confirmed influenza detections have been reported:
98% have been influenza A.
Among the 12,329 influenza A viruses subtyped, 85% have been A(H1N1)pdm09.
Influenza B often circulates later in the season in Canada (Feb-Apr). Fewer influenza B detections have been reported this season compared to recent seasons at this time of year.
To date this season, detailed information on age and type/subtype has been received for 28,283 laboratory-confirmed influenza cases (Table 1):
84% of all influenza A(H1N1)pdm09 detections have been reported in individuals younger than 65 years of age.
60% of all influenza A(H3N2) detections have been reported in adults 65 years of age and older.
For more detailed weekly and cumulative influenza data, see the text descriptions for Figures 2 and 3 or the Respiratory Virus Detections in Canada Report.
[h=3]Figure 2 ? Number of positive influenza tests and percentage of tests positive, by type, subtype and report week, Canada, weeks 2018-35 to 2019-10[/h]
The shaded area indicates weeks where the positivity rate was at least 5% and a minimum of 15 positive tests were observed, signalling the period of seasonal influenza activity.
Figure 2 - Text equivalent [h=3]Figure 3 ? Cumulative numbers of positive influenza specimens by type/subtype and province/territory, Canada, weeks 2018-35 to 2019-10[/h]
Figure 3 - Text equivalent [TABLE="class: table table-striped table-bordered table-hover table-condensed, width: 1140"]
Table 1 - Cumulative numbers of positive influenza specimens by type, subtype and age-group reported through case-based laboratory reporting, Canada, weeks 2018-35 to 2019-10 [TR="class: bg-primary, bgcolor: #2572B4"]
Age groups (years) Cumulative (August 26, 2018 to March 9, 2019) [/TR]
[TR="class: bg-primary, bgcolor: #2572B4"]
Influenza A B Influenza A and B [/TR]
[TR="class: bg-primary, bgcolor: #2572B4"]
A Total A(H1) pdm09 A(H3) A (UnS)Footnote1 Total # % [/TR]
[TR="bgcolor: #F5F5F5"]
[TD]0-4[/TD]
[TD]5829[/TD]
[TD]1617[/TD]
[TD]69[/TD]
[TD]4143[/TD]
[TD]83[/TD]
[TD]5912[/TD]
[TD]21%[/TD]
[/TR]
[TR]
[TD]5-19[/TD]
[TD]4104[/TD]
[TD]1337[/TD]
[TD]131[/TD]
[TD]2636[/TD]
[TD]113[/TD]
[TD]4217[/TD]
[TD]15%[/TD]
[/TR]
[TR="bgcolor: #F5F5F5"]
[TD]20-44[/TD]
[TD]5506[/TD]
[TD]1802[/TD]
[TD]220[/TD]
[TD]3484[/TD]
[TD]81[/TD]
[TD]5587[/TD]
[TD]20%[/TD]
[/TR]
[TR]
[TD]45-64[/TD]
[TD]5531[/TD]
[TD]1723[/TD]
[TD]203[/TD]
[TD]3605[/TD]
[TD]59[/TD]
[TD]5590[/TD]
[TD]20%[/TD]
[/TR]
[TR="bgcolor: #F5F5F5"]
[TD]65+[/TD]
[TD]6816[/TD]
[TD]1241[/TD]
[TD]905[/TD]
[TD]4670[/TD]
[TD]161[/TD]
[TD]6977[/TD]
[TD]25%[/TD]
[/TR]
[TR]
[TD]Total[/TD]
[TD]27786[/TD]
[TD]7720[/TD]
[TD]1528[/TD]
[TD]18538[/TD]
[TD]497[/TD]
[TD]28283[/TD]
[TD]100%[/TD]
[/TR]
[TR]
[TD="colspan: 8"] Table 1 - Note 1 UnS: unsubtyped: The specimen was typed as influenza A, but no result for subtyping was available. Return to Table 1 - Note1
[/TD]
[/TR]
[/TABLE]
[h=2]Syndromic/Influenza-like Illness Surveillance[/h] [h=3]Healthcare Professionals Sentinel Syndromic Surveillance[/h] In week 10, 1.3% of visits to healthcare professionals were due to influenza-like illness (ILI) (Figure 4). The percentage of visits for ILI is low compared to previous seasons.
[h=3]Figure 4 ? Percentage of visits for ILI reported by sentinels by report week, Canada, weeks 2018-35 to 2019-10[/h] Number of Sentinels Reporting in Week 10: 95
The shaded area represents the maximum and minimum percentage of visits for ILI reported by week from seasons 2013-14 to 2017-18
Figure 4 - Text equivalent [h=2]Participatory Syndromic Surveillance[/h] In week 10, 2,112 participants reported to FluWatchers, of which 65 (3.1%) reported symptoms of cough and fever (Figure 5).
Among the 65 participants who reported fever and cough:
20% consulted a healthcare professional;
78% reported days missed from work or school, resulting in a combined total of 134 missed days of work or school.
[h=3]Figure 5 - Percentage of participants reporting cough and fever, Canada, weeks 2018-40 to 2019-10[/h] Number of Participants Reporting in Week 10: 2,112
Figure 5 - Text equivalent [h=2]Influenza Outbreak Surveillance[/h] In week 10, 30 new laboratory-confirmed influenza outbreaks were reported: long-term care facilities (LTCF) (12), acute care facilities (11) and other settings (7).
To date this season, 540 laboratory-confirmed influenza outbreaks have been reported (Figure 6):
314 (58%) outbreaks were in LTCF, 29 were in schools, 83 in acute care facilities, and 114 were in other settings.
Among the 481 outbreaks for which the influenza type was available, 98% (473) were associated with influenza A.
Among the 206 outbreaks for which the influenza A subtype was available, 56% (116) were associated with influenza A(H1N1)pdm09;
To date this season, 119 ILI outbreaks have been reported; 64 occurred in LTCF, 51 in schools, and four in acute care facilities.
[h=3]Figure 6 ? Number of new outbreaks of laboratory-confirmed influenza by report week, Canada, weeks 2018-35 to 2019-10[/h]
Figure 6 - Text equivalent [h=2]Severe Outcomes Influenza Surveillance[/h] Provincial/Territorial Influenza Hospitalizations and Deaths
To date this season, 2,351 influenza-associated hospitalizations have been reported by participating provinces and territoriesFootnote1.
Hospitalizations (Table 2):
99.1% (2,329) were associated with influenza A
The highest estimated rate of hospitalization is among children under 5 years of age.
Intensive Care Unit (ICU) cases and deaths:
To date this season 429 ICU admissions and 109 deaths have been reported.
43% (185) of reported ICU admissions were in adults aged 45-64 years.
All but three ICU admissions were associated with influenza A.
All but one of the deaths were associated with influenza A.
[TABLE="class: table table-striped table-bordered table-hover table-condensed, width: 1140"]
Table 2 - Cumulative number of hospitalizations by age-group and influenza type, reported by participating provinces and territoriesFootnote1, Canada, weeks 2018-35 to 2019-10 [TR="class: bg-primary, bgcolor: #2572B4"]
Age Groups (years) Cumulative (August 26, 2018 to March 9, 2019) [/TR]
[TR="class: bg-primary, bgcolor: #2572B4"]
Influenza A Influenza B Rate per 100,000 population [/TR]
[TR="bgcolor: #F5F5F5"]
[TD]0-4[/TD]
[TD]333[/TD]
[TD]8[/TD]
[TD]71.64[/TD]
[/TR]
[TR]
[TD]5-19[/TD]
[TD]199[/TD]
[TD]6[/TD]
[TD]14.77[/TD]
[/TR]
[TR="bgcolor: #F5F5F5"]
[TD]20-44[/TD]
[TD]306[/TD]
[TD]1[/TD]
[TD]10.79[/TD]
[/TR]
[TR]
[TD]45-64[/TD]
[TD]635[/TD]
[TD]2[/TD]
[TD]29.27[/TD]
[/TR]
[TR="bgcolor: #F5F5F5"]
[TD]65+[/TD]
[TD]856[/TD]
[TD]5[/TD]
[TD]70.77[/TD]
[/TR]
[TR]
[TD]Total[/TD]
[TD]2329[/TD]
[TD]22[/TD]
[TD] [/TD]
[/TR]
[TR="bgcolor: #F5F5F5"]
[TD]%[/TD]
[TD]99.1%[/TD]
[TD]0.9%[/TD]
[TD] [/TD]
[/TR]
[TR]
[TD="colspan: 8"] Table 2 - Note 1 Influenza-associated hospitalizations are reported by Alberta, Manitoba, New Brunswick, Newfoundland and Labrador, Northwest Territories, Nova Scotia, Prince Edward Island and Yukon. Only hospitalizations that require intensive medical care are reported by Saskatchewan. The cumulative rate of hospitalizations is calculated using the total population by age-group in participating provinces and territories. Return to Table 2 - Note1
[/TD]
[/TR]
[/TABLE]
[h=3]Pediatric Influenza Hospitalizations and Deaths[/h] In week 10, 45 pediatric (≤16 years of age) hospitalizations with influenza have been reported by the Immunization Monitoring Program Active (IMPACT) network (Figure 7).
To date this season, 1,015 pediatric hospitalizations have been reported (Figure 8):
68% of cases were in children under 5 years of age.
98% (992) of cases have been associated with influenza A.
Among the 311 cases for which the influenza subtype was available, 286 (92%) were associated with A(H1N1)pdm09.
To date this season, 172 ICU admissions, and 10 deaths have been reported.
63% (108) of ICU admissions were in children under 5 years of age.
All but two of the ICU admissions have been associated with influenza A.
80% (8) of deaths occurred in children 2 to 4 years of age.
All deaths have been associated with influenza A.
[h=3]Figure 7 ? Number of pediatric (≤16 years of age) hospitalizations reported by the IMPACT network, by week, Canada, weeks 2018-35 to 2019-10[/h]
The shaded area represents the maximum and minimum number of cases reported by week from seasons 2010-11 to 2017-18
Figure 7 - Text equivalent [h=3]Figure 8 - Cumulative numbers of pediatric hospitalizations (≤16 years of age) with influenza by age-group reported by the IMPACT network, Canada, weeks 2018-35 to 2019-10[/h]
Figure 8 - Text equivalent [h=3]Adult Influenza Hospitalizations and Deaths[/h] Surveillance of laboratory-confirmed influenza-associated adult (≥16 years of age) hospitalizations by the Canadian Immunization Research Network (CIRN) Serious Outcomes Surveillance (SOS) network began on November 1st for the 2018-19 season.
To date this season, 694 hospitalizations, 80 ICU admissions and 32 deaths have been reported (Figure 9):
645 (93%) hospitalizations were associated with influenza A.
A greater proportion of hospitalizations have been reported among adults ≥65 years of age (58%) compared to adults <65 years of age (42%).
86% of hospitalized cases reported more than one type of comorbid condition.
The most commonly reported comorbidity was endocrine disorders, which were reported in 82% of hospitalized cases [h=3]Figure 9 - Cumulative numbers of adult hospitalizations (>20 years of age) with influenza by age-group reported by CIRN, Canada, 2018-19, weeks 2018-44 to 2019-10[/h]
Figure 9 - Text equivalent [h=2]Influenza Strain Characterizations[/h] Since September 1, 2018, the National Microbiology Laboratory (NML) has characterized 1,570 influenza viruses (195 A(H3N2), 1,340 A(H1N1) and 35 B) that were received from Canadian laboratories.
[h=3]Genetic Characterization of Influenza A(H3N2):[/h] 102 influenza A(H3N2) viruses did not grow to sufficient hemagglutination titer for antigenic characterization by hemagglutination inhibition (HI) assay. Therefore, NML has performed genetic characterization to determine the genetic group identity of these viruses.
Sequence analysis of the HA gene of the viruses showed that:
17 viruses belonged to genetic group 3C.2a.
82 viruses belonged to subclade 3C.2a1.
Two viruses belonged to 3C.3a.
One isolate could not be sequenced.
A/Singapore/INFIMH-16-0019/2016-like virus belongs to genetic group 3C.2a1 and is the influenza A(H3N2) component of the 2018-19 Northern Hemisphere influenza vaccine./p>
[h=3]Antigenic Characterization:[/h] Influenza A (H3N2):
68 influenza A(H3N2) viruses were antigenically characterized as A/Singapore/INFIMH-16-0019/2016-like by HI testing using antiserum raised against egg-propagated A/Singapore/INFIMH-16-0019/2016.
25 viruses showed reduced titer with ferret antisera raised against egg-propagated A/Singapore/INFIMH-16-0019/2016.
A/Singapore/INFIMH-16-0019/2016-like virus is the influenza A(H3N2) component of the 2018-19 Northern Hemisphere influenza vaccine.
53 influenza A(H3N2) viruses characterized belonged to genetic group 3C.2a1. 16 viruses belonged to genetic group 3C.2a and 21 to 3C.3a. Sequencing is pending for the remaining isolates.
Influenza A(H1N1):
1,302 A(H1N1) viruses characterized were antigenically similar to A/Michigan/45/2015, which is the influenza A(H1N1) component of the 2018-19 Northern Hemisphere influenza vaccine.
38 viruses showed reduced titer with ferret antisera raised against cell culture-propagated A/Michigan/45/2015
Influenza B:
Influenza B viruses can be divided into two antigenically distinct lineages represented by B/Yamagata/16/88 and B/Victoria/2/87 viruses. The recommended influenza B components for the 2018-19 Northern Hemisphere influenza vaccine are B/Colorado/06/2017 (Victoria lineage) and B/Phuket/3073/2013 (Yamagata lineage).
Nine influenza B viruses were characterized as B/Colorado/06/2017, which belong to the Victoria lineage and are included as an influenza B component of the 2018-19 Northern Hemisphere influenza vaccine.
Seven viruses showed reduced titer with ferret antisera raised against cell culture-propagated B/Colorado/06/2017.
19 influenza B viruses were characterized as B/Phuket/3073/2013-like, which belongs to the Yamagata lineage and is included as an influenza B component of the 2018-19 Northern Hemisphere quadrivalent influenza vaccine.
Influenza activity continues to be reported in almost all regions in Canada but is circulating at higher levels in eastern regions.
Detections of influenza A(H3N2) have been steadily increasing since mid-January and accounted for 64% of subtyped influenza A detections this week; however, influenza A(H1N1)pdm09 remains the predominant subtype to date this season.
There is currently very little influenza B circulation compared to previous seasons.
The World Health Organization (WHO) has released the recommended composition of the influenza vaccine for use in the 2019-2020 northern hemisphere influenza season. The recommended strain was changed for each of the A(H1N1)pdm09 and A(H3N2) components compared to this year's vaccine.
[h=2]Influenza/ILI Activity (geographic spread)[/h] During week 11, the following influenza activity levels were reported (Figure 1):
19 regions reported localized activity: in Alta.(2), Man.(1), Ont.(6), Que.(3), N.S.(4), N.B.(1), and N.L.(2).
29 regions reported sporadic activity: in B.C.(5), Alta.(3), Man.(2), Ont.(1), Que.(3), N.B.(6), N.L.(2), P.E.I.(1), Nvt.(1), Y.T.(1) and N.W.T.(1)
Five regions: in Man.(2), Nvt.(2) and N.W.T.(1) reported no activity.
[h=3]Figure 1 ? Map of overall influenza/ILI activity by province and territory, Canada, week 2019-11[/h]
Figure 1 - Text equivalent [h=2]Laboratory-Confirmed Influenza Detections[/h] In week 11, the following results were reported from sentinel laboratories across Canada (Figures 2 and 3):
The percentage of tests positive for influenza continued to increase slightly to 21.4%.
A total 1,721 laboratory detections of influenza were reported, of which 95% were influenza A.
Influenza A(H3N2) accounted for 64% of subtyped influenza A detections.
Detections of influenza A(H3N2) have been steadily increasing, from 93 detections in week 4 (mid-January) to 339 this week.
To date this season, 37,610 laboratory-confirmed influenza detections have been reported:
98% have been influenza A.
Among the 12,926 influenza A viruses subtyped, 83% have been A(H1N1)pdm09.
Influenza B often circulates later in the season in Canada (Feb-Apr). Fewer influenza B detections have been reported this season compared to recent seasons at this time of year.
To date this season, detailed information on age and type/subtype has been received for 29,558 laboratory-confirmed influenza cases (Table 1):
84% of all influenza A(H1N1)pdm09 detections have been reported in individuals younger than 65 years of age.
59% of all influenza A(H3N2) detections have been reported in adults 65 years of age and older.
For more detailed weekly and cumulative influenza data, see the text descriptions for Figures 2 and 3 or the Respiratory Virus Detections in Canada Report.
[h=3]Figure 2 ? Number of positive influenza tests and percentage of tests positive, by type, subtype and report week, Canada, weeks 2018-35 to 2019-11[/h]
The shaded area indicates weeks where the positivity rate was at least 5% and a minimum of 15 positive tests were observed, signalling the period of seasonal influenza activity.
Figure 2 - Text equivalent [h=3]Figure 3 ? Cumulative numbers of positive influenza specimens by type/subtype and province/territory, Canada, weeks 2018-35 to 2019-11[/h]
Figure 3 - Text equivalent [TABLE="class: table table-striped table-bordered table-hover table-condensed, width: 1140"]
Table 1 - Cumulative numbers of positive influenza specimens by type, subtype and age-group reported through case-based laboratory reporting, Canada, weeks 2018-35 to 2019-11 [TR="class: bg-primary, bgcolor: #2572B4"]
Age groups (years) Cumulative (August 26, 2018 to March 16, 2019) [/TR]
[TR="class: bg-primary, bgcolor: #2572B4"]
Influenza A B Influenza A and B [/TR]
[TR="class: bg-primary, bgcolor: #2572B4"]
A Total A(H1) pdm09 A(H3) A (UnS)Footnote1 Total # % [/TR]
[TR="bgcolor: #F5F5F5"]
[TD]0-4[/TD]
[TD]5965[/TD]
[TD]1632[/TD]
[TD]91[/TD]
[TD]4242[/TD]
[TD]95[/TD]
[TD]6060[/TD]
[TD]21%[/TD]
[/TR]
[TR]
[TD]5-19[/TD]
[TD]4255[/TD]
[TD]1348[/TD]
[TD]175[/TD]
[TD]2732[/TD]
[TD]134[/TD]
[TD]4389[/TD]
[TD]15%[/TD]
[/TR]
[TR="bgcolor: #F5F5F5"]
[TD]20-44[/TD]
[TD]5709[/TD]
[TD]1845[/TD]
[TD]268[/TD]
[TD]3596[/TD]
[TD]98[/TD]
[TD]5807[/TD]
[TD]20%[/TD]
[/TR]
[TR]
[TD]45-64[/TD]
[TD]5722[/TD]
[TD]1774[/TD]
[TD]236[/TD]
[TD]3712[/TD]
[TD]67[/TD]
[TD]5789[/TD]
[TD]20%[/TD]
[/TR]
[TR="bgcolor: #F5F5F5"]
[TD]65+[/TD]
[TD]7344[/TD]
[TD]1288[/TD]
[TD]1097[/TD]
[TD]4959[/TD]
[TD]169[/TD]
[TD]7513[/TD]
[TD]25%[/TD]
[/TR]
[TR]
[TD]Total[/TD]
[TD]28995[/TD]
[TD]7887[/TD]
[TD]1867[/TD]
[TD]19241[/TD]
[TD]563[/TD]
[TD]29558[/TD]
[TD]100%[/TD]
[/TR]
[TR]
[TD="colspan: 8"] Table 1 - Note 1 UnS: unsubtyped: The specimen was typed as influenza A, but no result for subtyping was available. Return to Table 1 - Note1
[/TD]
[/TR]
[/TABLE]
[h=2]Syndromic/Influenza-like Illness Surveillance[/h] [h=3]Healthcare Professionals Sentinel Syndromic Surveillance[/h] In week 11, 0.7% of visits to healthcare professionals were due to influenza-like illness (ILI) (Figure 4). The percentage of visits for ILI is low compared to previous seasons.
[h=3]Figure 4 ? Percentage of visits for ILI reported by sentinels by report week, Canada, weeks 2018-35 to 2019-11[/h] Number of Sentinels Reporting in Week 11: 75
The shaded area represents the maximum and minimum percentage of visits for ILI reported by week from seasons 2013-14 to 2017-18
Figure 4 - Text equivalent [h=2]Participatory Syndromic Surveillance[/h] In week 11, 2,066 participants reported to FluWatchers, of which 54 (2.7%) reported symptoms of cough and fever (Figure 5).
Among the 54 participants who reported fever and cough:
13% consulted a healthcare professional;
75% reported days missed from work or school, resulting in a combined total of 124 missed days of work or school.
[h=3]Figure 5 - Percentage of participants reporting cough and fever, Canada, weeks 2018-40 to 2019-11[/h] Number of Participants Reporting in Week 11: 2,066
Figure 5 - Text equivalent [h=2]Influenza Outbreak Surveillance[/h] In week 11, 29 new laboratory-confirmed influenza outbreaks were reported: long-term care facilities (LTCF) (16), acute care facilities (2) and other settings (11). Two new ILI outbreaks (one in a school and one in a LTCF) were also reported in week 11.
To date this season, 586 laboratory-confirmed influenza outbreaks have been reported (Figure 6):
346 (59%) outbreaks were in LTCF, 29 were in schools, 86 in acute care facilities, and 125 were in other settings.
Among the 523 outbreaks for which the influenza type was available, 98% (512) were associated with influenza A.
Among the 221 outbreaks for which the influenza A subtype was available, 55% (121) were associated with influenza A(H1N1)pdm09;
To date this season, 121 ILI outbreaks have been reported; 65 occurred in LTCF, 52 in schools, and four in acute care facilities.
[h=3]Figure 6 ? Number of new outbreaks of laboratory-confirmed influenza by report week, Canada, weeks 2018-35 to 2019-11[/h]
Figure 6 - Text equivalent [h=2]Severe Outcomes Influenza Surveillance[/h] Provincial/Territorial Influenza Hospitalizations and Deaths
To date this season, 2,474 influenza-associated hospitalizations have been reported by participating provinces and territoriesFootnote1.
Hospitalizations (Table 2):
99.0% (2,449) were associated with influenza A
The highest estimated rate of hospitalization is among adults over 65 years of age.
Intensive Care Unit (ICU) cases and deaths:
To date this season 446 ICU admissions and 109 deaths have been reported.
42% (189) of reported ICU admissions were in adults aged 45-64 years.
All but four ICU admissions were associated with influenza A.
All but one of the deaths were associated with influenza A.
[TABLE="class: table table-striped table-bordered table-hover table-condensed, width: 1140"]
Table 2 - Cumulative number of hospitalizations by age-group and influenza type, reported by participating provinces and territoriesFootnote1, Canada, weeks 2018-35 to 2019-11 [TR="class: bg-primary, bgcolor: #2572B4"]
Age Groups (years) Cumulative (August 26, 2018 to March 16, 2019) [/TR]
[TR="class: bg-primary, bgcolor: #2572B4"]
Influenza A Influenza B Rate per 100,000 population [/TR]
[TR="bgcolor: #F5F5F5"]
[TD]0-4[/TD]
[TD]343[/TD]
[TD]9[/TD]
[TD]73.95[/TD]
[/TR]
[TR]
[TD]5-19[/TD]
[TD]204[/TD]
[TD]8[/TD]
[TD]15.28[/TD]
[/TR]
[TR="bgcolor: #F5F5F5"]
[TD]20-44[/TD]
[TD]311[/TD]
[TD]1[/TD]
[TD]10.97[/TD]
[/TR]
[TR]
[TD]45-64[/TD]
[TD]670[/TD]
[TD]2[/TD]
[TD]30.88[/TD]
[/TR]
[TR="bgcolor: #F5F5F5"]
[TD]65+[/TD]
[TD]921[/TD]
[TD]5[/TD]
[TD]76.11[/TD]
[/TR]
[TR]
[TD]Total[/TD]
[TD]2449[/TD]
[TD]25[/TD]
[TD] [/TD]
[/TR]
[TR="bgcolor: #F5F5F5"]
[TD]%[/TD]
[TD]99.0%[/TD]
[TD]1.0%[/TD]
[TD] [/TD]
[/TR]
[TR]
[TD="colspan: 8"] Table 2 - Note 1 Influenza-associated hospitalizations are reported by Alberta, Manitoba, New Brunswick, Newfoundland and Labrador, Northwest Territories, Nova Scotia, Prince Edward Island and Yukon. Only hospitalizations that require intensive medical care are reported by Saskatchewan. The cumulative rate of hospitalizations is calculated using the total population by age-group in participating provinces and territories. Return to Table 2 - Note1
[/TD]
[/TR]
[/TABLE]
[h=3]Pediatric Influenza Hospitalizations and Deaths[/h] In week 11, 37 pediatric (≤16 years of age) hospitalizations with influenza have been reported by the Immunization Monitoring Program Active (IMPACT) network (Figure 7).
To date this season, 1,046 pediatric hospitalizations have been reported (Figure 8):
67% of cases were in children under 5 years of age.
97% (1,017) of cases have been associated with influenza A.
Among the 316 cases for which the influenza subtype was available, 286 (91%) were associated with A(H1N1)pdm09.
To date this season, 188 ICU admissions, and 10 deaths have been reported.
61% (114) of ICU admissions were in children under 5 years of age.
All but two of the ICU admissions have been associated with influenza A.
80% (8) of deaths occurred in children 2 to 4 years of age.
All deaths have been associated with influenza A.
[h=3]Figure 7 ? Number of pediatric (≤16 years of age) hospitalizations reported by the IMPACT network, by week, Canada, weeks 2018-35 to 2019-11[/h]
The shaded area represents the maximum and minimum number of cases reported by week from seasons 2010-11 to 2017-18
Figure 7 - Text equivalent [h=3]Figure 8 - Cumulative numbers of pediatric hospitalizations (≤16 years of age) with influenza by age-group reported by the IMPACT network, Canada, weeks 2018-35 to 2019-11[/h]
Figure 8 - Text equivalent [h=3]Adult Influenza Hospitalizations and Deaths[/h] Surveillance of laboratory-confirmed influenza-associated adult (≥16 years of age) hospitalizations by the Canadian Immunization Research Network (CIRN) Serious Outcomes Surveillance (SOS) network began on November 1st for the 2018-19 season.
To date this season, 729 hospitalizations, 88 ICU admissions and 32 deaths have been reported (Figure 9):
676 (93%) hospitalizations were associated with influenza A.
A greater proportion of hospitalizations have been reported among adults ≥65 years of age (59%) compared to adults <65 years of age (41%).
86% of hospitalized cases reported more than one type of comorbid condition.
The most commonly reported comorbidity was endocrine disorders, which were reported in 82% of hospitalized cases.
[h=3]Figure 9 - Cumulative numbers of adult hospitalizations (>20 years of age) with influenza by age-group reported by CIRN, Canada, 2018-19, weeks 2018-44 to 2019-11[/h]
Figure 9 - Text equivalent [h=2]Influenza Strain Characterizations[/h] Since September 1, 2018, the National Microbiology Laboratory (NML) has characterized 1,622 influenza viruses (212 A(H3N2), 1,375 A(H1N1) and 35 B) that were received from Canadian laboratories.
[h=3]Genetic Characterization of Influenza A(H3N2):[/h] 102 influenza A(H3N2) viruses did not grow to sufficient hemagglutination titer for antigenic characterization by hemagglutination inhibition (HI) assay. Therefore, NML has performed genetic characterization to determine the genetic group identity of these viruses.
Sequence analysis of the HA gene of the viruses showed that:
17 viruses belonged to genetic group 3C.2a.
82 viruses belonged to subclade 3C.2a1.
Two viruses belonged to 3C.3a.
One isolate could not be sequenced.
A/Singapore/INFIMH-16-0019/2016-like virus belongs to genetic group 3C.2a1 and is the influenza A(H3N2) component of the 2018-19 Northern Hemisphere influenza vaccine.
[h=3]Antigenic Characterization:[/h] Influenza A (H3N2):
74 influenza A(H3N2) viruses were antigenically characterized as A/Singapore/INFIMH-16-0019/2016-like by HI testing using antiserum raised against egg-propagated A/Singapore/INFIMH-16-0019/2016.
27 viruses showed reduced titer with ferret antisera raised against egg-propagated A/Singapore/INFIMH-16-0019/2016.
A/Singapore/INFIMH-16-0019/2016-like virus is the influenza A(H3N2) component of the 2018-19 Northern Hemisphere influenza vaccine.
53 influenza A(H3N2) viruses characterized belonged to genetic group 3C.2a1. 16 viruses belonged to genetic group 3C.2a and 21 to 3C.3a. Sequencing is pending for the remaining isolates.
Influenza A(H1N1):
1,336 A(H1N1) viruses characterized were antigenically similar to A/Michigan/45/2015, which is the influenza A(H1N1) component of the 2018-19 Northern Hemisphere influenza vaccine.
39 viruses showed reduced titer with ferret antisera raised against cell culture-propagated A/Michigan/45/2015
Influenza B:
Influenza B viruses can be divided into two antigenically distinct lineages represented by B/Yamagata/16/88 and B/Victoria/2/87 viruses. The recommended influenza B components for the 2018-19 Northern Hemisphere influenza vaccine are B/Colorado/06/2017 (Victoria lineage) and B/Phuket/3073/2013 (Yamagata lineage).
Nine influenza B viruses were characterized as B/Colorado/06/2017, which belong to the Victoria lineage and are included as an influenza B component of the 2018-19 Northern Hemisphere influenza vaccine.
Seven viruses showed reduced titer with ferret antisera raised against cell culture-propagated B/Colorado/06/2017.
19 influenza B viruses were characterized as B/Phuket/3073/2013-like, which belongs to the Yamagata lineage and is included as an influenza B component of the 2018-19 Northern Hemisphere quadrivalent influenza vaccine.
Influenza activity continues to be reported in almost all regions in Canada but is circulating at higher levels in some eastern regions.
Though A(H1N1) peaked at end of December, over the past four weeks a second smaller wave, dominated by A(H3N2), is being observed in most regions of the country.
Detections of influenza A(H3N2) have been steadily increasing since mid-January and accounted for 72% of subtyped influenza A detections this week; however, influenza A(H1N1)pdm09 remains the predominant subtype to date this season.
Detections of influenza A continue to be greater than those of influenza B. There is currently very little influenza B circulation compared to previous seasons.
[h=2]Influenza/Influenza-like Illness Activity (geographic spread)[/h] During week 12, the following influenza activity levels were reported (Figure 1):
15 regions reported localized activity: in Alta.(1), Ont.(6), N.S.(3), N.B.(2), P.E.I.(1) and N.L.(2).
33 regions reported sporadic activity: in B.C.(5), Alta.(4), Sask.(3), Man.(4), Ont.(1), Que.(6), N.B.(5), N.L.(2), N.S.(1), Y.T.(1) and Nvt.(1)
Three regions: in Man.(1) and Nvt.(2) reported no activity.
[h=3]Figure 1 ? Map of overall influenza/ILI activity by province and territory, Canada, week 2019-12[/h] Figure 1 - Text equivalent [h=2]Laboratory-Confirmed Influenza Detections[/h] In week 12, the following results were reported from sentinel laboratories across Canada (Figures 2 and 3):
The percentage of tests positive for influenza continued to increase slightly to 21.8%.
A total 1,735 laboratory detections of influenza were reported, of which 93% were influenza A.
Influenza A(H3N2) accounted for 72% of subtyped influenza A detections.
Detections of influenza A(H3N2) have been steadily increasing, from 93 detections in week 4 (mid-January) to 342 this week.
To date this season, 39,297 laboratory-confirmed influenza detections have been reported:
98% have been influenza A.
Among the 13,414 influenza A viruses subtyped, 81% have been A(H1N1)pdm09.
Influenza B often circulates later in the season in Canada (Feb-Apr). Fewer influenza B detections have been reported this season compared to recent seasons at this time of year.
To date this season, detailed information on age and type/subtype has been received for 30,844 laboratory-confirmed influenza cases (Table 1):
84% of all influenza A(H1N1)pdm09 detections have been reported in individuals younger than 65 years of age.
57% of all influenza A(H3N2) detections have been reported in adults 65 years of age and older.
For more detailed weekly and cumulative influenza data, see the text descriptions for Figures 2 and 3 or the Respiratory Virus Detections in Canada Report.
[h=3]Figure 2 ? Number of positive influenza tests and percentage of tests positive, by type, subtype and report week, Canada, weeks 2018-35 to 2019-12[/h]
The shaded area indicates weeks where the positivity rate was at least 5% and a minimum of 15 positive tests were observed, signalling the period of seasonal influenza activity.
Figure 2 - Text equivalent [h=3]Figure 3 ? Cumulative numbers of positive influenza specimens by type/subtype and province/territory, Canada, weeks 2018-35 to 2019-12[/h]
Figure 3 - Text equivalent [TABLE="class: table table-striped table-bordered table-hover table-condensed, width: 1140"]
Table 1 - Cumulative numbers of positive influenza specimens by type, subtype and age-group reported through case-based laboratory reporting, Canada, weeks 2018-35 to 2019-12 [TR]
Age groups (years) Cumulative (August 26, 2018 to March 23, 2019) [/TR]
[TR]
Influenza A B Influenza A and B [/TR]
[TR]
A Total A(H1N1) pdm09 A(H3N2) A (UnS)Table 1 - Note1 Total # % [/TR]
[TR="bgcolor: #F5F5F5"]
[TD]0-4[/TD]
[TD]6093[/TD]
[TD]1639[/TD]
[TD]106[/TD]
[TD]4348[/TD]
[TD]115[/TD]
[TD]6208[/TD]
[TD]20%[/TD]
[/TR]
[TR]
[TD]5-19[/TD]
[TD]4425[/TD]
[TD]1359[/TD]
[TD]240[/TD]
[TD]2826[/TD]
[TD]176[/TD]
[TD]4601[/TD]
[TD]15%[/TD]
[/TR]
[TR="bgcolor: #F5F5F5"]
[TD]20-44[/TD]
[TD]5905[/TD]
[TD]1882[/TD]
[TD]298[/TD]
[TD]3725[/TD]
[TD]117[/TD]
[TD]6022[/TD]
[TD]20%[/TD]
[/TR]
[TR]
[TD]45-64[/TD]
[TD]5915[/TD]
[TD]1800[/TD]
[TD]292[/TD]
[TD]3823[/TD]
[TD]70[/TD]
[TD]5985[/TD]
[TD]19%[/TD]
[/TR]
[TR="bgcolor: #F5F5F5"]
[TD]65+[/TD]
[TD]7852[/TD]
[TD]1320[/TD]
[TD]1265[/TD]
[TD]5267[/TD]
[TD]176[/TD]
[TD]8028[/TD]
[TD]26%[/TD]
[/TR]
[TR]
[TD]Total[/TD]
[TD]30190[/TD]
[TD]8000[/TD]
[TD]2201[/TD]
[TD]19989[/TD]
[TD]654[/TD]
[TD]30844[/TD]
[TD]100%[/TD]
[/TR]
[TR]
[TD="colspan: 8"] Table 1 - Note 1 UnS: unsubtyped: The specimen was typed as influenza A, but no result for subtyping was available. Return to Table 1 - Note1 referrer.
[/TD]
[/TR]
[/TABLE]
[h=2]Syndromic / Influenza-like Illness Surveillance[/h] [h=3]Healthcare Professionals Sentinel Syndromic Surveillance[/h] In week 12, 1.6% of visits to healthcare professionals were due to influenza-like illness (ILI) (Figure 4).
[h=3]Figure 4 ? Percentage of visits for ILI reported by sentinels by report week, Canada, weeks 2018-35 to 2019-12[/h] Number of Sentinels Reporting in Week 12: 86
The shaded area represents the maximum and minimum percentage of visits for ILI reported by week from seasons 2013-14 to 2017-18
Figure 4 - Text equivalent [h=2]Participatory Syndromic Surveillance[/h] In week 12, 2,056 participants reported to FluWatchers, of which 50 (2.4%) reported symptoms of cough and fever (Figure 5).
Among the 50 participants who reported fever and cough:
30% consulted a healthcare professional;
92% reported days missed from work or school, resulting in a combined total of 136 missed days of work or school.
[h=3]Figure 5 - Percentage of participants reporting cough and fever, Canada, weeks 2018-40 to 2019-12[/h] Number of Participants Reporting in Week 12: 2,056
Figure 5 - Text equivalent [h=2]Influenza Outbreak Surveillance[/h] In week 12, 38 new laboratory-confirmed influenza outbreaks were reported: long-term care facilities (LTCF) (19), acute care facilities (8) and other settings (11). Eleven new ILI outbreaks (LTCF (8) and schools and daycares (3)) were also reported in week 12. Among the outbreaks with available subtype information (12), 92% (11) were associated with influenza A(H3N2).
To date this season, 633 laboratory-confirmed influenza outbreaks have been reported (Figure 6):
371 (59%) outbreaks were in LTCF, 30 were in schools and daycares, 94 in acute care facilities, and 138 were in other settings.
Among the 563 outbreaks for which the influenza type was available, 98% (550) were associated with influenza A.
Among the 243 outbreaks for which the influenza A subtype was available, 55% (125) were associated with influenza A(H1N1)pdm09;
To date this season, 134 ILI outbreaks have been reported; 75 occurred in LTCF, 55 in schools, and four in acute care facilities.
[h=3]Figure 6 ? Number of new outbreaks of laboratory-confirmed influenza by report week, Canada, weeks 2018-35 to 2019-12[/h]
Figure 6 - Text equivalent [h=2]Severe Outcomes Influenza Surveillance[/h] Provincial/Territorial Influenza Hospitalizations and Deaths
To date this season, 2,592 influenza-associated hospitalizations have been reported by participating provinces and territoriesFootnote1.
Hospitalizations (Table 2):
98.7% (2,558) were associated with influenza A
Among the 1,555 cases for which the influenza subtype was available, 1,366 (88%) were associated with A(H1N1)pdm09.
The highest estimated rate of hospitalization is among adults over 65 years of age.
Intensive Care Unit (ICU) cases and deaths:
To date this season 464 ICU admissions and 127 deaths have been reported.
43% (199) of reported ICU admissions were in adults aged 45-64 years.
All but four ICU admissions were associated with influenza A.
All but one of the deaths were associated with influenza A.
[TABLE="class: table table-striped table-bordered table-hover table-condensed, width: 1140"]
Table 2 - Cumulative number and estimated rate of hospitalizations by age-group reported by participating provinces and territoriesFootnote1, Canada, weeks 2018-35 to 2019-12 [TR]
Age Groups (years) Cumulative (August 26, 2018 to March 23, 2019) [/TR]
[TR]
Influenza A Influenza B Rate per 100,000 population [/TR]
[TR="bgcolor: #F5F5F5"]
[TD]0-4[/TD]
[TD]354[/TD]
[TD]12[/TD]
[TD]76.89[/TD]
[/TR]
[TR]
[TD]5-19[/TD]
[TD]210[/TD]
[TD]10[/TD]
[TD]15.85[/TD]
[/TR]
[TR="bgcolor: #F5F5F5"]
[TD]20-44[/TD]
[TD]317[/TD]
[TD]4[/TD]
[TD]11.28[/TD]
[/TR]
[TR]
[TD]45-64[/TD]
[TD]688[/TD]
[TD]3[/TD]
[TD]31.75[/TD]
[/TR]
[TR="bgcolor: #F5F5F5"]
[TD]65+[/TD]
[TD]989[/TD]
[TD]5[/TD]
[TD]81.70[/TD]
[/TR]
[TR]
[TD]Total[/TD]
[TD]2558[/TD]
[TD]34[/TD]
[TD] [/TD]
[/TR]
[TR="bgcolor: #F5F5F5"]
[TD]%[/TD]
[TD]98.7%[/TD]
[TD]1.3%[/TD]
[TD] [/TD]
[/TR]
[TR]
[TD="colspan: 8"] Table 2 - Note 1 Influenza-associated hospitalizations are reported by Alberta, Manitoba, New Brunswick, Newfoundland and Labrador, Northwest Territories, Nova Scotia, Prince Edward Island and Yukon. Only hospitalizations that require intensive medical care are reported by Saskatchewan. The cumulative rate of hospitalizations is calculated using the total population by age-group in participating provinces and territories. Return to Table 2 - Note1
[/TD]
[/TR]
[/TABLE]
[h=3]Pediatric Influenza Hospitalizations and Deaths[/h] In week 12, 41 pediatric (≤16 years of age) hospitalizations with influenza have been reported by the Immunization Monitoring Program Active (IMPACT) network (Figure 7). Of the 41 hospitalizations, 34 (83%) were due to influenza A.
To date this season, 1,089 pediatric hospitalizations have been reported (Figure 8):
67% of cases were in children under 5 years of age.
97% (1,054) of cases have been associated with influenza A.
Among the 324 cases for which the influenza subtype was available, 289 (89%) were associated with A(H1N1)pdm09.
To date this season, 194 ICU admissions, and 10 deaths have been reported.
60% (117) of ICU admissions were in children under 5 years of age.
All but two of the ICU admissions have been associated with influenza A.
80% (8) of deaths occurred in children 2 to 4 years of age.
All deaths have been associated with influenza A.
[h=3]Figure 7 ? Number of pediatric (≤16 years of age) hospitalizations reported by the IMPACT network, by week, Canada, weeks 2018-35 to 2019-12[/h]
The shaded area represents the maximum and minimum number of cases reported by week from seasons 2010-11 to 2017-18
Figure 7 - Text equivalent [h=3]Figure 8 - Cumulative numbers of pediatric hospitalizations (≤16 years of age) with influenza by age-group reported by the IMPACT network, Canada, weeks 2018-35 to 2019-12[/h]
Figure 8 - Text equivalent [h=3]Adult Influenza Hospitalizations and Deaths[/h] Surveillance of laboratory-confirmed influenza-associated adult (≥16 years of age) hospitalizations by the Canadian Immunization Research Network (CIRN) Serious Outcomes Surveillance (SOS) network began on November 1st for the 2018-19 season.
To date this season, 773 hospitalizations, 90 ICU admissions and 40 deaths have been reported (Figure 9):
718 (93%) hospitalizations were associated with influenza A.
A greater proportion of hospitalizations have been reported among adults ≥65 years of age (59%) compared to adults <65 years of age (41%).
Among the 167 cases for which the influenza subtype was available, 103 (62%) were associated with A(H1N1)pdm09.
88% of hospitalized cases reported more than one type of comorbid condition.
The most commonly reported comorbidity was endocrine disorders, which were reported in 83% of hospitalized cases.
[h=3]Figure 9 - Cumulative numbers of adult hospitalizations (>20 years of age) with influenza by age-group reported by CIRN, Canada, 2018-19, weeks 2018-44 to 2019-12[/h]
Figure 9 - Text equivalent [h=2]Influenza Strain Characterizations[/h] Since September 1, 2018, the National Microbiology Laboratory (NML) has characterized 1,700 influenza viruses (233 A(H3N2), 1,415 A(H1N1) and 52 B) that were received from Canadian laboratories.
[h=3]Genetic Characterization of Influenza A(H3N2):[/h] 124 influenza A(H3N2) viruses did not grow to sufficient hemagglutination titer for antigenic characterization by hemagglutination inhibition (HI) assay. Therefore, NML has performed genetic characterization to determine the genetic group identity of these viruses.
Sequence analysis of the HA gene of the viruses showed that:
18 viruses belonged to genetic group 3C.2a.
102 viruses belonged to subclade 3C.2a1.
Three viruses belonged to 3C.3a.
One isolate could not be sequenced.
A/Singapore/INFIMH-16-0019/2016-like virus belongs to genetic group 3C.2a1 and is the influenza A(H3N2) component of the 2018-19 Northern Hemisphere influenza vaccine.
[h=3]Antigenic Characterization:[/h] Influenza A (H3N2):
82 influenza A(H3N2) viruses were antigenically characterized as A/Singapore/INFIMH-16-0019/2016-like by HI testing using antiserum raised against egg-propagated A/Singapore/INFIMH-16-0019/2016.
27 viruses showed reduced titer with ferret antisera raised against egg-propagated A/Singapore/INFIMH-16-0019/2016.
A/Singapore/INFIMH-16-0019/2016-like virus is the influenza A(H3N2) component of the 2018-19 Northern Hemisphere influenza vaccine.
63 influenza A(H3N2) viruses characterized belonged to genetic group 3C.2a1. 17 viruses belonged to genetic group 3C.2a and 29 to 3C.3a. Sequencing is pending for the remaining isolates.
Influenza A(H1N1):
1,375 A(H1N1) viruses characterized were antigenically similar to A/Michigan/45/2015, which is the influenza A(H1N1) component of the 2018-19 Northern Hemisphere influenza vaccine.
40 viruses showed reduced titer with ferret antisera raised against cell culture-propagated A/Michigan/45/2015
Influenza B:
Influenza B viruses can be divided into two antigenically distinct lineages represented by B/Yamagata/16/88 and B/Victoria/2/87 viruses. The recommended influenza B components for the 2018-19 Northern Hemisphere influenza vaccine are B/Colorado/06/2017 (Victoria lineage) and B/Phuket/3073/2013 (Yamagata lineage).
18 influenza B viruses were characterized as B/Colorado/06/2017, which belong to the Victoria lineage and are included as an influenza B component of the 2018-19 Northern Hemisphere influenza vaccine.
12 viruses showed reduced titer with ferret antisera raised against cell culture-propagated B/Colorado/06/2017.
22 influenza B viruses were characterized as B/Phuket/3073/2013-like, which belongs to the Yamagata lineage and is included as an influenza B component of the 2018-19 Northern Hemisphere quadrivalent influenza vaccine.
Influenza activity continues to be reported in almost all regions in Canada.
Though A(H1N1) peaked at end of December, over the past five weeks a second smaller wave, dominated by A(H3N2), is being observed in most regions of the country.
Detections of influenza A(H3N2) have been steadily increasing since mid-January and accounted for 76% of subtyped influenza A detections this week; however, influenza A(H1N1)pdm09 remains the predominant subtype to date this season.
Detections of influenza A continue to be greater than those of influenza B. There is currently very little influenza B circulation compared to previous seasons.
The 2018-19 Seasonal Influenza Immunization Coverage Survey showed that coverage was low among adults aged 18-64 years (34%) and highest among seniors aged 65 years and older (70%).
[h=2]Influenza/Influenza-like Illness Activity (geographic spread)[/h] During week 13, the following influenza activity levels were reported (Figure 1):
21 regions reported localized activity: in Alta.(2), Ont.(6), Que.(2), N.S.(3), N.B.(3), P.E.I.(1), Y.T.(1) and N.L.(3).
26 regions reported sporadic activity: in B.C.(5), Alta.(3), Sask.(3), Man.(3), Ont.(1), Que.(4), N.B.(4), N.L.(1) and N.W.T.(2)
Six regions: in Man.(2), N.S.(1) and Nvt.(3) reported no activity.
[h=3]Figure 1 ? Map of overall influenza/ILI activity by province and territory, Canada, week 2019-13[/h] Figure 1 - Text equivalent [h=2]Laboratory-Confirmed Influenza Detections[/h] In week 13, the following results were reported from sentinel laboratories across Canada (Figures 2 and 3):
The percentage of tests positive for influenza remained steady at 22%.
A total 1,579 laboratory detections of influenza were reported, of which 91% were influenza A.
Influenza A(H3N2) accounted for 76% of subtyped influenza A detections.
Detections of influenza A(H3N2) have been steadily increasing, from 93 detections in week 4 (mid-January) to 358 this week.
To date this season, 41,372 laboratory-confirmed influenza detections have been reported:
98% have been influenza A.
Among the 13,859 influenza A viruses subtyped, 79% have been A(H1N1)pdm09.
Influenza B often circulates later in the season in Canada (Feb-Apr). Fewer influenza B detections have been reported this season compared to recent seasons at this time of year.
To date this season, detailed information on age and type/subtype has been received for 31,770 laboratory-confirmed influenza cases (Table 1):
83% of all influenza A(H1N1)pdm09 detections have been reported in individuals younger than 65 years of age.
58% of all influenza A(H3N2) detections have been reported in adults 65 years of age and older.
For more detailed weekly and cumulative influenza data, see the text descriptions for Figures 2 and 3 or the Respiratory Virus Detections in Canada Report.
[h=3]Figure 2 ? Number of positive influenza tests and percentage of tests positive, by type, subtype and report week, Canada, weeks 2018-35 to 2019-13[/h]
The shaded area indicates weeks where the positivity rate was at least 5% and a minimum of 15 positive tests were observed, signalling the period of seasonal influenza activity.
Figure 2 - Text equivalent [h=3]Figure 3 ? Cumulative numbers of positive influenza specimens by type/subtype and province/territory, Canada, weeks 2018-35 to 2019-13[/h]
Figure 3 - Text equivalent [TABLE="class: table table-striped table-bordered table-hover table-condensed, width: 1140"]
Table 1 - Cumulative numbers of positive influenza specimens by type, subtype and age-group reported through case-based laboratory reporting, Canada, weeks 2018-35 to 2019-13 [TR]
Age groups (years) Cumulative (August 26, 2018 to March 30, 2019) [/TR]
[TR]
Influenza A B Influenza A and B [/TR]
[TR]
A Total A(H1N1) pdm09 A(H3N2) A (UnS)Table 1 - Note1 Total # % [/TR]
[TR="bgcolor: #F5F5F5"]
[TD]0-4[/TD]
[TD]6148[/TD]
[TD]1644[/TD]
[TD]127[/TD]
[TD]4377[/TD]
[TD]130[/TD]
[TD]6278[/TD]
[TD]20%[/TD]
[/TR]
[TR]
[TD]5-19[/TD]
[TD]4537[/TD]
[TD]1366[/TD]
[TD]281[/TD]
[TD]2890[/TD]
[TD]202[/TD]
[TD]4739[/TD]
[TD]15%[/TD]
[/TR]
[TR="bgcolor: #F5F5F5"]
[TD]20-44[/TD]
[TD]6059[/TD]
[TD]1910[/TD]
[TD]332[/TD]
[TD]3817[/TD]
[TD]137[/TD]
[TD]6196[/TD]
[TD]20%[/TD]
[/TR]
[TR]
[TD]45-64[/TD]
[TD]6079[/TD]
[TD]1832[/TD]
[TD]345[/TD]
[TD]3902[/TD]
[TD]76[/TD]
[TD]6155[/TD]
[TD]19%[/TD]
[/TR]
[TR="bgcolor: #F5F5F5"]
[TD]65+[/TD]
[TD]8224[/TD]
[TD]1360[/TD]
[TD]1479[/TD]
[TD]5385[/TD]
[TD]178[/TD]
[TD]8402[/TD]
[TD]26%[/TD]
[/TR]
[TR]
[TD]Total[/TD]
[TD]31047[/TD]
[TD]8112[/TD]
[TD]2564[/TD]
[TD]20371[/TD]
[TD]723[/TD]
[TD]31770[/TD]
[TD]100%[/TD]
[/TR]
[TR]
[TD="colspan: 8"] Table 1 - Note 1 UnS: unsubtyped: The specimen was typed as influenza A, but no result for subtyping was available. Return to Table 1 - Note1 referrer.
[/TD]
[/TR]
[/TABLE]
[h=2]Syndromic / Influenza-like Illness Surveillance[/h] [h=3]Healthcare Professionals Sentinel Syndromic Surveillance[/h] In week 13, 1.6% of visits to healthcare professionals were due to influenza-like illness (ILI) (Figure 4).
[h=3]Figure 4 ? Percentage of visits for ILI reported by sentinels by report week, Canada, weeks 2018-35 to 2019-13[/h] Number of Sentinels Reporting in Week 13: 79
The shaded area represents the maximum and minimum percentage of visits for ILI reported by week from seasons 2013-2014 to 2017-2018
Figure 4 - Text equivalent [h=2]Participatory Syndromic Surveillance[/h] In week 13, 2,041 participants reported to FluWatchers, of which 49 (2.4%) reported symptoms of cough and fever (Figure 5).
Among the 49 participants who reported fever and cough:
16% consulted a healthcare professional;
67% reported days missed from work or school, resulting in a combined total of 110 missed days of work or school.
[h=3]Figure 5 - Percentage of participants reporting cough and fever, Canada, weeks 2018-40 to 2019-13[/h] Number of Participants Reporting in Week 13: 2,041
Figure 5 - Text equivalent [h=2]Influenza Outbreak Surveillance[/h] In week 13, 31 new laboratory-confirmed influenza outbreaks were reported: long-term care facilities (LTCF) (13), acute care facilities (7) and other settings (11). Three new ILI outbreaks (LTCF (2) and schools and daycares (1)) were also reported in week 13. Among the outbreaks with available subtype information (8), all (8) were associated with influenza A(H3N2).
To date this season, 664 laboratory-confirmed influenza outbreaks have been reported (Figure 6):
385 (58%) outbreaks were in LTCF, 30 were in schools and daycares, 102 in acute care facilities, and 147 were in other settings.
Among the 603 outbreaks for which the influenza type was available, 98% (590) were associated with influenza A.
Among the 262 outbreaks for which the influenza A subtype was available, 51% (128) were associated with influenza A(H3N2);
To date this season, 137 ILI outbreaks have been reported; 77 occurred in LTCF, 56 in schools, and four in acute care facilities.
[h=3]Figure 6 ? Number of new outbreaks of laboratory-confirmed influenza by report week, Canada, weeks 2018-35 to 2019-13[/h]
Figure 6 - Text equivalent [h=2]Severe Outcomes Influenza Surveillance[/h] Provincial/Territorial Influenza Hospitalizations and Deaths
To date this season, 2,701 influenza-associated hospitalizations have been reported by participating provinces and territoriesFootnote1.
Hospitalizations (Table 2):
98.4% (2,659) were associated with influenza A
Among the 1,629 cases for which the influenza subtype was available, 1,380 (85%) were associated with A(H1N1)pdm09.
The highest estimated rate of hospitalization is among adults over 65 years of age.
Intensive Care Unit (ICU) cases and deaths:
To date this season 474 ICU admissions and 139 deaths have been reported.
43% (202) of reported ICU admissions were in adults aged 45-64 years.
All but four ICU admissions were associated with influenza A.
All but one of the deaths were associated with influenza A.
[TABLE="class: table table-striped table-bordered table-hover table-condensed, width: 1140"]
Table 2 - Cumulative number and estimated rate of hospitalizations by age-group reported by participating provinces and territoriesFootnote1, Canada, weeks 2018-35 to 2019-13 [TR]
Age Groups (years) Cumulative (August 26, 2018 to March 30, 2019) [/TR]
[TR]
Influenza A Influenza B Rate per 100,000 population [/TR]
[TR="bgcolor: #F5F5F5"]
[TD]0-4 [/TD]
[TD]361[/TD]
[TD]15[/TD]
[TD]79.00[/TD]
[/TR]
[TR]
[TD]5-19[/TD]
[TD]218[/TD]
[TD]13[/TD]
[TD]16.65[/TD]
[/TR]
[TR="bgcolor: #F5F5F5"]
[TD]20-44 [/TD]
[TD]327[/TD]
[TD]4[/TD]
[TD]11.63[/TD]
[/TR]
[TR]
[TD]45-64 [/TD]
[TD]704[/TD]
[TD]4[/TD]
[TD]32.53[/TD]
[/TR]
[TR="bgcolor: #F5F5F5"]
[TD]65+ [/TD]
[TD]1049[/TD]
[TD]6[/TD]
[TD]86.71[/TD]
[/TR]
[TR]
[TD]Total[/TD]
[TD]2659[/TD]
[TD]42[/TD]
[TD] [/TD]
[/TR]
[TR="bgcolor: #F5F5F5"]
[TD]%[/TD]
[TD]98.4%[/TD]
[TD]1.6%[/TD]
[TD] [/TD]
[/TR]
[TR]
[TD="colspan: 8"] Table 2 - Note 1 Influenza-associated hospitalizations are reported by Alberta, Manitoba, New Brunswick, Newfoundland and Labrador, Northwest Territories, Nova Scotia, Prince Edward Island and Yukon. Only hospitalizations that require intensive medical care are reported by Saskatchewan. The cumulative rate of hospitalizations is calculated using the total population by age-group in participating provinces and territories. Return to Table 2 - Note1
[/TD]
[/TR]
[/TABLE]
[h=3]Pediatric Influenza Hospitalizations and Deaths[/h] In week 13, 30 pediatric (≤16 years of age) hospitalizations with influenza have been reported by the Immunization Monitoring Program Active (IMPACT) network (Figure 7). Of the 30 hospitalizations, 27 (90%) were due to influenza A.
To date this season, 1,116 pediatric hospitalizations have been reported (Figure 8):
67% of cases were in children under 5 years of age.
96% (1,076) of cases have been associated with influenza A.
Among the 330 cases for which the influenza subtype was available, 289 (89%) were associated with A(H1N1)pdm09.
To date this season, 197 ICU admissions, and 10 deaths have been reported.
60% (119) of ICU admissions were in children under 5 years of age.
All but six of the ICU admissions have been associated with influenza A.
80% (8) of deaths occurred in children 2 to 4 years of age.
All deaths have been associated with influenza A.
[h=3]Figure 7 ? Number of pediatric (≤16 years of age) hospitalizations reported by the IMPACT network, by week, Canada, weeks 2018-35 to 2019-13[/h]
The shaded area represents the maximum and minimum number of cases reported by week from seasons 2010-11 to 2017-18
Figure 7 - Text equivalent [h=3]Figure 8 - Cumulative numbers of pediatric hospitalizations (≤16 years of age) with influenza by age-group reported by the IMPACT network, Canada, weeks 2018-35 to 2019-13[/h]
Figure 8 - Text equivalent [h=3]Adult Influenza Hospitalizations and Deaths[/h] Surveillance of laboratory-confirmed influenza-associated adult (≥16 years of age) hospitalizations by the Canadian Immunization Research Network (CIRN) Serious Outcomes Surveillance (SOS) network began on November 1st for the 2018-19 season.
To date this season, 812 hospitalizations, 98 ICU admissions and 43 deaths have been reported (Figure 9):
757 (93%) hospitalizations were associated with influenza A.
A greater proportion of hospitalizations have been reported among adults ≥65 years of age (59%) compared to adults <65 years of age (41%).
Among the 169 cases for which the influenza subtype was available, 105 (62%) were associated with A(H1N1)pdm09.
88% of hospitalized cases reported more than one type of comorbid condition.
The most commonly reported comorbidity was endocrine disorders, which were reported in 83% of hospitalized cases.
[h=3]Figure 9 - Cumulative numbers of adult hospitalizations (>20 years of age) with influenza by age-group reported by CIRN, Canada, 2018-19, weeks 2018-44 to 2019-13[/h]
Figure 9 - Text equivalent [h=2]Influenza Strain Characterizations[/h] Since September 1, 2018, the National Microbiology Laboratory (NML) has characterized 1,745 influenza viruses (244 A(H3N2), 1,445 A(H1N1) and 56 B) that were received from Canadian laboratories.
[h=3]Genetic Characterization of Influenza A(H3N2):[/h] 130 influenza A(H3N2) viruses did not grow to sufficient hemagglutination titer for antigenic characterization by hemagglutination inhibition (HI) assay. Therefore, NML has performed genetic characterization to determine the genetic group identity of these viruses.
Sequence analysis of the HA gene of the viruses showed that:
18 viruses belonged to genetic group 3C.2a.
108 viruses belonged to subclade 3C.2a1.
Three viruses belonged to 3C.3a.
One isolate could not be sequenced.
A/Singapore/INFIMH-16-0019/2016-like virus belongs to genetic group 3C.2a1 and is the influenza A(H3N2) component of the 2018-19 Northern Hemisphere influenza vaccine.
[h=3]Antigenic Characterization:[/h] Influenza A (H3N2):
85 influenza A(H3N2) viruses were antigenically characterized as A/Singapore/INFIMH-16-0019/2016-like by HI testing using antiserum raised against egg-propagated A/Singapore/INFIMH-16-0019/2016.
29 viruses showed reduced titer with ferret antisera raised against egg-propagated A/Singapore/INFIMH-16-0019/2016.
A/Singapore/INFIMH-16-0019/2016-like virus is the influenza A(H3N2) component of the 2018-19 Northern Hemisphere influenza vaccine.
64 influenza A(H3N2) viruses characterized belonged to genetic group 3C.2a1. 17 viruses belonged to genetic group 3C.2a and 29 to 3C.3a. Sequencing is pending for the remaining isolates.
Influenza A(H1N1):
1,404 A(H1N1) viruses characterized were antigenically similar to A/Michigan/45/2015, which is the influenza A(H1N1) component of the 2018-19 Northern Hemisphere influenza vaccine.
41 viruses showed reduced titer with ferret antisera raised against cell culture-propagated A/Michigan/45/2015
Influenza B:
Influenza B viruses can be divided into two antigenically distinct lineages represented by B/Yamagata/16/88 and B/Victoria/2/87 viruses. The recommended influenza B components for the 2018-19 Northern Hemisphere influenza vaccine are B/Colorado/06/2017 (Victoria lineage) and B/Phuket/3073/2013 (Yamagata lineage).
15 influenza B viruses were characterized as B/Colorado/06/2017, which belong to the Victoria lineage and are included as an influenza B component of the 2018-19 Northern Hemisphere influenza vaccine.
19 viruses showed reduced titer with ferret antisera raised against cell culture-propagated B/Colorado/06/2017.
22 influenza B viruses were characterized as B/Phuket/3073/2013-like, which belongs to the Yamagata lineage and is included as an influenza B component of the 2018-19 Northern Hemisphere quadrivalent influenza vaccine.
Influenza continues to circulate in many regions across the country.
The second smaller wave of influenza activity, dominated by A(H3N2), decreased this week.
Detections of influenza A(H3N2) have been steadily increasing since mid-January and account for 89% of subtyped influenza A detections this week; however, influenza A(H1N1)pdm09 remains the predominant subtype to date this season.
Detections of influenza A continue to be greater than those of influenza B. There is currently very little influenza B circulation compared to previous seasons.
[h=2]Influenza/Influenza-like Illness Activity (geographic spread)[/h] During week 16, the following influenza activity levels were reported (Figure 1):
14 regions reported localized activity: in Man.(1), Ont.(7), Que.(2), N.B.(1), N.S.(2), and Y.T.(1).
22 regions reported sporadic activity: in B.C.(5), Man.(3), Que.(4), N.S.(2), N.B.(6), P.E.I (1) and N.W.T.(1)
Two regions: in Man.(1) and N.W.T.(1) reported no activity.
[h=3]Figure 1 ? Map of overall influenza/ILI activity by province and territory, Canada, week 2019-16[/h] Figure 1 - Text equivalent [h=2]Laboratory-Confirmed Influenza Detections[/h] In week 16, the following results were reported from sentinel laboratories across Canada (Figures 2 and 3):
The percentage of tests positive for influenza decreased to 17% in week 16.
A total of 1,024 laboratory detections of influenza were reported, of which 85% were influenza A.
Influenza A(H3N2) accounted for 89% of subtyped influenza A detections.
To date this season, 44,970 laboratory-confirmed influenza detections have been reported:
97% have been influenza A.
Among the 15,235 influenza A viruses subtyped, 73% have been A(H1N1)pdm09.
Influenza B often circulates later in the season in Canada (Feb-Apr). Fewer influenza B detections have been reported this season compared to recent seasons at this time of year.
To date this season, detailed information on age and type/subtype has been received for 36,036 laboratory-confirmed influenza cases (Table 1):
83% of all influenza A(H1N1)pdm09 detections have been reported in individuals younger than 65 years of age.
58% of all influenza A(H3N2) detections have been reported in adults 65 years of age and older.
For more detailed weekly and cumulative influenza data, see the text descriptions for Figures 2 and 3 or the Respiratory Virus Detections in Canada Report.
[h=3]Figure 2 ? Number of positive influenza tests and percentage of tests positive, by type, subtype and report week, Canada, weeks 2018-35 to 2019-16[/h]
The shaded area indicates weeks where the positivity rate was at least 5% and a minimum of 15 positive tests were observed, signalling the period of seasonal influenza activity.
Data for week 14 excludes subtyping results from one jurisdiction due to batch reporting of subtype information. The results for week 14 should be interpreted with caution.
Figure 2 - Text equivalent [h=3]Figure 3 ? Cumulative numbers of positive influenza specimens by type/subtype and province/territory, Canada, weeks 2018-35 to 2019-16[/h]
Figure 3 - Text equivalent [TABLE="class: table table-striped table-bordered table-hover table-condensed, width: 1140"]
Table 1 ? Cumulative numbers of positive influenza specimens by type, subtype and age-group reported through case-based laboratory reporting, Canada, weeks 2018-35 to 2019-16 [TR]
Age groups (years) Cumulative (August 26, 2018 to April 20, 2019) [/TR]
[TR]
Influenza A B Influenza A and B [/TR]
[TR]
A Total A(H1N1) pdm09 A(H3N2) A (UnS)Table 1 ? Note1 Total # % [/TR]
[TR="bgcolor: #F5F5F5"]
[TD]0-4[/TD]
[TD]6566[/TD]
[TD]1679[/TD]
[TD]213[/TD]
[TD]4674[/TD]
[TD]195[/TD]
[TD]6761[/TD]
[TD]19%[/TD]
[/TR]
[TR]
[TD]5-19[/TD]
[TD]4967[/TD]
[TD]1387[/TD]
[TD]416[/TD]
[TD]3164[/TD]
[TD]330[/TD]
[TD]5297[/TD]
[TD]15%[/TD]
[/TR]
[TR="bgcolor: #F5F5F5"]
[TD]20-44[/TD]
[TD]6661[/TD]
[TD]1990[/TD]
[TD]536[/TD]
[TD]4135[/TD]
[TD]230[/TD]
[TD]6891[/TD]
[TD]19%[/TD]
[/TR]
[TR]
[TD]45-64[/TD]
[TD]6757[/TD]
[TD]1950[/TD]
[TD]549[/TD]
[TD]4258[/TD]
[TD]92[/TD]
[TD]6849[/TD]
[TD]19%[/TD]
[/TR]
[TR="bgcolor: #F5F5F5"]
[TD]65+[/TD]
[TD]10027[/TD]
[TD]1452[/TD]
[TD]2341[/TD]
[TD]6234[/TD]
[TD]211[/TD]
[TD]10238[/TD]
[TD]28%[/TD]
[/TR]
[TR]
[TD]Total[/TD]
[TD]34978[/TD]
[TD]8458[/TD]
[TD]4055[/TD]
[TD]22465[/TD]
[TD]1058[/TD]
[TD]36036[/TD]
[TD]100%[/TD]
[/TR]
[TR]
[TD="colspan: 8"] Table 1 ? Note 1 UnS: unsubtyped: The specimen was typed as influenza A, but no result for subtyping was available. Return to Table 1 ? Note1 referrer.
[/TD]
[/TR]
[/TABLE]
[h=2]Syndromic / Influenza-like Illness Surveillance[/h] [h=3]Healthcare Professionals Sentinel Syndromic Surveillance[/h] In week 16, 0.8% of visits to healthcare professionals were due to influenza-like illness (ILI) (Figure 4).
[h=3]Figure 4 ? Percentage of visits for ILI reported by sentinels by report week, Canada, weeks 2018-35 to 2019-16[/h] Number of Sentinels Reporting in Week 16: 91
The shaded area represents the maximum and minimum percentage of visits for ILI reported by week from seasons 2013-2014 to 2017-2018
Figure 4 - Text equivalent [h=2]Participatory Syndromic Surveillance[/h] In week 16, 1,904 participants reported to FluWatchers, of which 46 (2.4%) reported symptoms of cough and fever (Figure 5).
Among the 46 participants who reported fever and cough:
13% consulted a healthcare professional;
65% reported days missed from work or school, resulting in a combined total of 92 missed days of work or school.
[h=3]Figure 5 - Percentage of participants reporting cough and fever, Canada, weeks 2018-40 to 2019-16[/h] Number of Participants Reporting in Week 16: 1,904
Figure 5 - Text equivalent [h=2]Influenza Outbreak Surveillance[/h] In week 16, 21 new laboratory-confirmed influenza outbreaks were reported: long-term care facilities (LTCF) (12) and other settings (9). Three new ILI outbreaks were reported: LTCF (2) and schools (1). Among the outbreaks with available subtype information (7), all were associated with influenza A(H3N2).
To date this season, 753 laboratory-confirmed influenza outbreaks have been reported (Figure 6):
441 (59%) outbreaks were in LTCF, 30 were in schools and daycares, 113 in acute care facilities, and 169 were in other settings.
Among the 662 outbreaks for which the influenza type was available, 98% (648) were associated with influenza A.
Among the 281 outbreaks for which the influenza A subtype was available, 54% (151) were associated with influenza A(H3N2);
To date this season, 151 ILI outbreaks have been reported; 85 occurred in LTCF, 61 in schools, one in other settings and four in acute care facilities.
[h=3]Figure 6 ? Number of new outbreaks of laboratory-confirmed influenza by report week, Canada, weeks 2018-35 to 2019-16[/h]
Figure 6 - Text equivalent [h=2]Severe Outcomes Influenza Surveillance[/h] Provincial/Territorial Influenza Hospitalizations and Deaths
To date this season, 2,932 influenza-associated hospitalizations have been reported by participating provinces and territoriesFootnote1.
Hospitalizations (Table 2):
98.4% (2,886) were associated with influenza A
Among the 1,670 cases for which the influenza subtype was available, 1,404 (84%) were associated with A(H1N1)pdm09.
The highest estimated rate of hospitalization is among adults over 65 years of age.
Intensive Care Unit (ICU) cases and deaths:
To date this season 536 ICU admissions and 165 deaths have been reported.
41% (221) of reported ICU admissions were in adults aged 45-64 years.
All but seven ICU admissions were associated with influenza A.
All but one of the deaths were associated with influenza A.
[TABLE="class: table table-striped table-bordered table-hover table-condensed, width: 1140"]
Table 2 ? Cumulative number and estimated rate of hospitalizations by age-group reported by participating provinces and territoriesFootnote1, Canada, weeks 2018-35 to 2019-16 [TR]
Age Groups (years) Cumulative (August 26, 2018 to April 20, 2019) [/TR]
[TR]
Influenza A Influenza B Rate per 100,000 population [/TR]
[TR="bgcolor: #F5F5F5"]
[TD]0-4[/TD]
[TD]383[/TD]
[TD]17[/TD]
[TD]84.04[/TD]
[/TR]
[TR]
[TD]5-19[/TD]
[TD]231[/TD]
[TD]15[/TD]
[TD]17.73[/TD]
[/TR]
[TR="bgcolor: #F5F5F5"]
[TD]20-44[/TD]
[TD]345[/TD]
[TD]4[/TD]
[TD]12.27[/TD]
[/TR]
[TR]
[TD]45-64[/TD]
[TD]748[/TD]
[TD]3[/TD]
[TD]34.51[/TD]
[/TR]
[TR="bgcolor: #F5F5F5"]
[TD]65+[/TD]
[TD]1179[/TD]
[TD]7[/TD]
[TD]97.48[/TD]
[/TR]
[TR]
[TD]Total[/TD]
[TD]2886[/TD]
[TD]46[/TD]
[TD] [/TD]
[/TR]
[TR="bgcolor: #F5F5F5"]
[TD]%[/TD]
[TD]98.4%[/TD]
[TD]1.6%[/TD]
[TD] [/TD]
[/TR]
[TR]
[TD="colspan: 8"] Table 2 ? Note 1 Influenza-associated hospitalizations are reported by Alberta, Manitoba, New Brunswick, Newfoundland and Labrador, Northwest Territories, Nova Scotia, Prince Edward Island and Yukon. Only hospitalizations that require intensive medical care are reported by Saskatchewan. The cumulative rate of hospitalizations is calculated using the total population by age-group in participating provinces and territories. Return to Table 2 ? Note1
[/TD]
[/TR]
[/TABLE]
[h=3]Pediatric Influenza Hospitalizations and Deaths[/h] To date this season, 1,217 pediatric hospitalizations have been reported (Figure 7 & 8):
66% of cases were in children under 5 years of age.
95% (1,152) of cases have been associated with influenza A.
Among the 358 cases for which the influenza subtype was available, 299 (84%) were associated with A(H1N1)pdm09.
To date this season, 229 ICU admissions, and 10 deaths have been reported.
59% (135) of ICU admissions were in children under 5 years of age.
All but nine of the ICU admissions have been associated with influenza A.
80% (8) of deaths occurred in children 2 to 4 years of age.
All deaths have been associated with influenza A.
[h=3]Figure 7 ? Number of pediatric (≤16 years of age) hospitalizations reported by the IMPACT network, by week, Canada, weeks 2018-35 to 2019-16[/h]
The shaded area represents the maximum and minimum number of cases reported by week from seasons 2010-11 to 2017-18
Figure 7 - Text equivalent [h=3]Figure 8 - Cumulative numbers of pediatric hospitalizations (≤16 years of age) with influenza by age-group reported by the IMPACT network, Canada, weeks 2018-35 to 2019-16[/h]
Figure 8 - Text equivalent [h=3]Adult Influenza Hospitalizations and Deaths[/h] Surveillance of laboratory-confirmed influenza-associated adult (≥16 years of age) hospitalizations by the Canadian Immunization Research Network (CIRN) Serious Outcomes Surveillance (SOS) network began on November 1st for the 2018-19 season.
To date this season, 901 hospitalizations, 105 ICU admissions and 50 deaths have been reported (Figure 9):
840 (93%) hospitalizations were associated with influenza A.
A greater proportion of hospitalizations have been reported among adults ≥65 years of age (60%) compared to adults <65 years of age (40%).
Among the 194 cases for which the influenza subtype was available, 106 (55%) were associated with A(H1N1)pdm09.
89% of hospitalized cases reported more than one type of comorbid condition.
The most commonly reported comorbidity was endocrine disorders, which were reported in 95% of hospitalized cases.
[h=3]Figure 9 - Cumulative numbers of adult hospitalizations (>20 years of age) with influenza by age-group reported by CIRN, Canada, 2018-19, weeks 2018-44 to 2019-16[/h]
Figure 9 - Text equivalent [h=2]Influenza Strain Characterizations[/h] Since September 1, 2018, the National Microbiology Laboratory (NML) has characterized 2,006 influenza viruses (353 A(H3N2), 1,553 A(H1N1) and 100 B) that were received from Canadian laboratories.
[h=3]Genetic Characterization of Influenza A(H3N2):[/h] 164 influenza A(H3N2) viruses did not grow to sufficient hemagglutination titer for antigenic characterization by hemagglutination inhibition (HI) assay. Therefore, NML has performed genetic characterization to determine the genetic group identity of these viruses.
Sequence analysis of the HA gene of the viruses showed that:
20 viruses belonged to genetic group 3C.2a.
139 viruses belonged to subclade 3C.2a1.
Four viruses belonged to 3C.3a.
One isolate could not be sequenced.
A/Singapore/INFIMH-16-0019/2016-like virus belongs to genetic group 3C.2a1 and is the influenza A(H3N2) component of the 2018-19 Northern Hemisphere influenza vaccine.
[h=3]Antigenic Characterization:[/h] Influenza A (H3N2):
111 influenza A(H3N2) viruses were antigenically characterized as A/Singapore/INFIMH-16-0019/2016-like by HI testing using antiserum raised against egg-propagated A/Singapore/INFIMH-16-0019/2016.
78 viruses showed reduced titer with ferret antisera raised against egg-propagated A/Singapore/INFIMH-16-0019/2016.
A/Singapore/INFIMH-16-0019/2016-like virus is the influenza A(H3N2) component of the 2018-19 Northern Hemisphere influenza vaccine.
71 influenza A(H3N2) viruses characterized belonged to genetic group 3C.2a1. 18 viruses belonged to genetic group 3C.2a and 29 to 3C.3a. Sequencing is pending for the remaining isolates.
Influenza A(H1N1):
1,510 A(H1N1) viruses characterized were antigenically similar to A/Michigan/45/2015, which is the influenza A(H1N1) component of the 2018-19 Northern Hemisphere influenza vaccine.
43 viruses showed reduced titer with ferret antisera raised against cell culture-propagated A/Michigan/45/2015
Influenza B:
Influenza B viruses can be divided into two antigenically distinct lineages represented by B/Yamagata/16/88 and B/Victoria/2/87 viruses. The recommended influenza B components for the 2018-19 Northern Hemisphere influenza vaccine are B/Colorado/06/2017 (Victoria lineage) and B/Phuket/3073/2013 (Yamagata lineage).
16 influenza B viruses were characterized as B/Colorado/06/2017, which belong to the Victoria lineage and are included as an influenza B component of the 2018-19 Northern Hemisphere influenza vaccine.
61 viruses showed reduced titer with ferret antisera raised against cell culture-propagated B/Colorado/06/2017.
23 influenza B viruses were characterized as B/Phuket/3073/2013-like, which belongs to the Yamagata lineage and is included as an influenza B component of the 2018-19 Northern Hemisphere quadrivalent influenza vaccine.
[h=1]FluWatch report: April 28 to May 4, 2019 (Week 18)[/h] [FONT="] [h=2][/h] Overall Summary
Overall Summary
Overall Summary
Overall Summary
Influenza activity continues to decline overall despite ongoing circulation of influenza A(H3N2) and influenza B in many regions across the country.
Influenza A(H3N2) was the predominant subtype this week (84% of subtyped influenza A detections); however, influenza A(H1N1)pdm09 remains the predominant subtype to date this season (71% of subtyped influenza A detections).
Detections of influenza A continue to be greater than those of influenza B. There is currently very little influenza B circulation compared to previous seasons.
[h=2]Influenza/Influenza-like Illness Activity (geographic spread)[/h] During week 18, the following influenza activity levels were reported (Figure 1):
14 regions reported localized activity: in Ont.(6), Que.(3), N.B.(1), N.S.(1), and N.L.(3).
26 regions reported sporadic activity: in B.C.(5), Sask.(3), Man.(5), Que.(4), N.S.(1), N.B.(6), P.E.I (1), and N.W.T.(1)
Five regions in four different provinces reported no activity.
[h=3]Figure 1 ? Map of overall influenza/ILI activity by province and territory, Canada, week 2019-18[/h]
Figure 1 - Text equivalent [h=2]Laboratory-Confirmed Influenza Detections[/h] In week 18, the following results were reported from sentinel laboratories across (Figures 2 and 3):
The percentage of tests positive for influenza decreased from 14% to 11% in week 18.
A total of 609 laboratory detections of influenza were reported, of which 76% were influenza A.
Influenza A(H3N2) accounted for 84% of subtyped influenza A detections.
To date this season, 46,549 laboratory-confirmed influenza detections have been reported:
96% have been influenza A.
Among the 15,749 influenza A viruses subtyped, 71% have been A(H1N1)pdm09.
Influenza B often circulates later in the season in Canada (Feb-Apr). Fewer influenza B detections have been reported this season compared to recent seasons at this time of year. The percentage of tests positive for influenza B in week 18 was similar to the previous week.
To date this season, detailed information on age and type/subtype has been received for 37,331 laboratory-confirmed influenza cases (Table 1):
83% of all influenza A(H1N1)pdm09 detections have been reported in individuals younger than 65 years of age.
58% of all influenza A(H3N2) detections have been reported in adults 65 years of age and older.
For more detailed weekly and cumulative influenza data, see the text descriptions for Figures 2 and 3 or the Respiratory Virus Detections in Canada Report.
[h=3]Figure 2 ? Number of positive influenza tests and percentage of tests positive, by type, subtype and report week, Canada, weeks 2018-35 to 2019-18[/h]
The shaded area indicates weeks where the positivity rate was at least 5% and a minimum of 15 positive tests were observed, signalling the period of seasonal influenza activity.
Data for week 14 excludes subtyping results from one jurisdiction due to batch reporting of subtype information. The results for week 14 should be interpreted with caution.
Figure 2 - Text equivalent [h=3]Figure 3 ? Cumulative numbers of positive influenza specimens by type/subtype and province/territory, Canada, weeks 2018-35 to 2019-18[/h]
Figure 3 - Text equivalent [TABLE="class: table table-striped table-bordered table-hover table-condensed, width: 1140"]
Table 1 ? Cumulative numbers of positive influenza specimens by type, subtype and age-group reported through case-based laboratory reporting, Canada, weeks 2018-35 to 2019-18 [TR]
Age groups (years) Cumulative (August 26, 2018 to May 4, 2019) [/TR]
[TR]
Influenza A B Influenza A and B [/TR]
[TR]
A Total A(H1N1) pdm09 A(H3N2) A (UnS)Table 1 ? Note1 Total # % [/TR]
[TR="bgcolor: #F5F5F5"]
[TD]0-4[/TD]
[TD]6673[/TD]
[TD]1688[/TD]
[TD]238[/TD]
[TD]4747[/TD]
[TD]261[/TD]
[TD]6934[/TD]
[TD]19%[/TD]
[/TR]
[TR]
[TD]5-19[/TD]
[TD]5082[/TD]
[TD]1388[/TD]
[TD]458[/TD]
[TD]3236[/TD]
[TD]422[/TD]
[TD]5504[/TD]
[TD]15%[/TD]
[/TR]
[TR="bgcolor: #F5F5F5"]
[TD]20-44[/TD]
[TD]6796[/TD]
[TD]2005[/TD]
[TD]577[/TD]
[TD]4214[/TD]
[TD]291[/TD]
[TD]7087[/TD]
[TD]19%[/TD]
[/TR]
[TR]
[TD]45-64[/TD]
[TD]6899[/TD]
[TD]1954[/TD]
[TD]614[/TD]
[TD]4331[/TD]
[TD]108[/TD]
[TD]7007[/TD]
[TD]19%[/TD]
[/TR]
[TR="bgcolor: #F5F5F5"]
[TD]65+[/TD]
[TD]10560[/TD]
[TD]1474[/TD]
[TD]2579[/TD]
[TD]6507[/TD]
[TD]239[/TD]
[TD]10799[/TD]
[TD]29%[/TD]
[/TR]
[TR]
[TD]Total[/TD]
[TD]36010[/TD]
[TD]8509[/TD]
[TD]4466[/TD]
[TD]23035[/TD]
[TD]1321[/TD]
[TD]37331[/TD]
[TD]100%[/TD]
[/TR]
[TR]
[TD="colspan: 8"] Table 1 ? Note 1 UnS: unsubtyped: The specimen was typed as influenza A, but no result for subtyping was available. Return to Table 1 ? Note1 referrer.
[/TD]
[/TR]
[/TABLE]
[h=2]Syndromic / Influenza-like Illness Surveillance[/h] [h=3]Healthcare Professionals Sentinel Syndromic Surveillance[/h] In week 18, 0.7% of visits to healthcare professionals were due to influenza-like illness (ILI) (Figure 4).
[h=3]Figure 4 ? Percentage of visits for ILI reported by sentinels by report week, Canada, weeks 2018-35 to 2019-18[/h] Number of Sentinels Reporting in Week 18: 63
The shaded area represents the maximum and minimum percentage of visits for ILI reported by week from seasons 2013-2014 to 2017-2018
Figure 4 - Text equivalent [h=2]Participatory Syndromic Surveillance[/h] In week 18, 1,951 participants reported to FluWatchers, of which 38 (1.9%) reported symptoms of cough and fever (Figure 5).
Among the 38 participants who reported fever and cough:
26% consulted a healthcare professional;
79% reported days missed from work or school, resulting in a combined total of 81 missed days of work or school.
[h=3]Figure 5 - Percentage of participants reporting cough and fever, Canada, weeks 2018-40 to 2019-18[/h] Number of Participants Reporting in Week 18: 1,951
Figure 5 - Text equivalent [h=2]Influenza Outbreak Surveillance[/h] In week 18, 11 new laboratory-confirmed influenza outbreaks were reported: long-term care facilities (LTCF) (7) acute care facilities (1) and other settings (3). No new ILI outbreaks were reported. Among the outbreaks with available information (9), 8 were associated with influenza A (of which 3 were associated with A(H3N2)), and one outbreak was associated with influenza B.
To date this season, 819 laboratory-confirmed influenza outbreaks have been reported (Figure 6):
484 (59%) outbreaks were in LTCF, 30 were in schools and daycares, 118 in acute care facilities, and 187 were in other settings.
Among the 733 outbreaks for which the influenza type was available, 98% (716) were associated with influenza A.
Among the 315 outbreaks for which the influenza A subtype was available, 58% (184) were associated with influenza A(H3N2);
To date this season, 151 ILI outbreaks have been reported; 85 occurred in LTCF, 61 in schools, one in other settings and four in acute care facilities.
[h=3]Figure 6 ? Number of new outbreaks of laboratory-confirmed influenza by report week, Canada, weeks 2018-35 to 2019-18[/h]
Figure 6 - Text equivalent [h=2]Severe Outcomes Influenza Surveillance[/h] Provincial/Territorial Influenza Hospitalizations and Deaths
To date this season, 3,075 influenza-associated hospitalizations have been reported by participating provinces and territoriesFootnote1.
Hospitalizations (Table 2):
97.7% (3,005) were associated with influenza A
Among the 1,696 cases for which the influenza subtype was available, 1,414 (83%) were associated with A(H1N1)pdm09.
The highest estimated rate of hospitalization is among adults over 65 years of age.
Intensive Care Unit (ICU) cases and deaths:
To date this season 555 ICU admissions and 179 deaths have been reported.
41% (227) of reported ICU admissions were in adults aged 45-64 years.
All but eight ICU admissions were associated with influenza A.
All but one of the deaths were associated with influenza A.
[TABLE="class: table table-striped table-bordered table-hover table-condensed, width: 1140"]
Table 2 ? Cumulative number and estimated rate of hospitalizations by age-group reported by participating provinces and territoriesFootnote1, Canada, weeks 2018-35 to 2019-18 [TR]
Age Groups (years) Cumulative (August 26, 2018 to May 4, 2019) [/TR]
[TR]
Influenza A Influenza B Rate per 100,000 population [/TR]
[TR="bgcolor: #F5F5F5"]
[TD]0-4[/TD]
[TD]394[/TD]
[TD]21[/TD]
[TD]87.19[/TD]
[/TR]
[TR]
[TD]5-19[/TD]
[TD]235[/TD]
[TD]20[/TD]
[TD]18.38[/TD]
[/TR]
[TR="bgcolor: #F5F5F5"]
[TD]20-44[/TD]
[TD]351[/TD]
[TD]9[/TD]
[TD]12.65[/TD]
[/TR]
[TR]
[TD]45-64[/TD]
[TD]775[/TD]
[TD]6[/TD]
[TD]35.89[/TD]
[/TR]
[TR="bgcolor: #F5F5F5"]
[TD]65+[/TD]
[TD]1250[/TD]
[TD]14[/TD]
[TD]103.89[/TD]
[/TR]
[TR]
[TD]Total[/TD]
[TD]3005[/TD]
[TD]70[/TD]
[TD] [/TD]
[/TR]
[TR="bgcolor: #F5F5F5"]
[TD]%[/TD]
[TD]97.7%[/TD]
[TD]2.3%[/TD]
[TD] [/TD]
[/TR]
[TR]
[TD="colspan: 8"] Table 2 ? Note 1 Influenza-associated hospitalizations are reported by Alberta, Manitoba, New Brunswick, Newfoundland and Labrador, Northwest Territories, Nova Scotia, Prince Edward Island and Yukon. Only hospitalizations that require intensive medical care are reported by Saskatchewan. The cumulative rate of hospitalizations is calculated using the total population by age-group in participating provinces and territories. Return to Table 2 ? Note1
[/TD]
[/TR]
[/TABLE]
[h=3]Pediatric Influenza Hospitalizations and Deaths[/h] To date this season, 1,265 pediatric hospitalizations have been reported (Figure 7 & 8):
66% of cases were in children under 5 years of age.
94% (1,187) of cases have been associated with influenza A.
Among the 373 cases for which the influenza subtype was available, 305 (82%) were associated with A(H1N1)pdm09.
To date this season, 243 ICU admissions, and 10 deaths have been reported.
58% (142) of ICU admissions were in children under 5 years of age.
All but 12 of the ICU admissions have been associated with influenza A.
80% (8) of deaths occurred in children 2 to 4 years of age.
All deaths have been associated with influenza A.
[h=3]Figure 7 ? Number of pediatric (≤16 years of age) hospitalizations reported by the IMPACT network, by week, Canada, weeks 2018-35 to 2019-18[/h]
The shaded area represents the maximum and minimum number of cases reported by week from seasons 2010-11 to 2017-18
Figure 7 - Text equivalent [h=3]Figure 8 - Cumulative numbers of pediatric hospitalizations (≤16 years of age) with influenza by age-group reported by the IMPACT network, Canada, weeks 2018-35 to 2019-18[/h]
Figure 8 - Text equivalent [h=3]Adult Influenza Hospitalizations and Deaths[/h] Surveillance of laboratory-confirmed influenza-associated adult (≥16 years of age) hospitalizations by the Canadian Immunization Research Network (CIRN) Serious Outcomes Surveillance (SOS) network began on November 1st for the 2018-19 season.
To date this season, 936 hospitalizations, 111 ICU admissions and 51 deaths have been reported (Figure 9):
869 (93%) hospitalizations were associated with influenza A.
A greater proportion of hospitalizations have been reported among adults ≥65 years of age (60%) compared to adults <65 years of age (40%).
Among the 202 cases for which the influenza subtype was available, 106 (52%) were associated with A(H1N1)pdm09.
89% of hospitalized cases reported more than one type of comorbid condition.
The most commonly reported comorbidity was endocrine disorders, which were reported in 86% of hospitalized cases.
[h=3]Figure 9 - Cumulative numbers of adult hospitalizations (>20 years of age) with influenza by age-group reported by CIRN, Canada, 2018-19, weeks 2018-44 to 2019-18[/h]
Figure 9 - Text equivalent [h=2]Influenza Strain Characterizations[/h] Since September 1, 2018, the National Microbiology Laboratory (NML) has characterized 2,124 influenza viruses (418 A(H3N2), 1,575 A(H1N1) and 131 B) that were received from Canadian laboratories.
[h=3]Genetic Characterization of Influenza A(H3N2):[/h] 191 influenza A(H3N2) viruses did not grow to sufficient hemagglutination titer for antigenic characterization by hemagglutination inhibition (HI) assay. Therefore, NML has performed genetic characterization to determine the genetic group identity of these viruses.
Sequence analysis of the HA gene of the viruses showed that:
20 viruses belonged to genetic group 3C.2a.
166 viruses belonged to subclade 3C.2a1.
Four viruses belonged to 3C.3a.
One isolate could not be sequenced.
A/Singapore/INFIMH-16-0019/2016-like virus belongs to genetic group 3C.2a1 and is the influenza A(H3N2) component of the 2018-19 Northern Hemisphere influenza vaccine.
[h=3]Antigenic Characterization:[/h] Influenza A (H3N2):
141 influenza A(H3N2) viruses were antigenically characterized as A/Singapore/INFIMH-16-0019/2016-like by HI testing using antiserum raised against egg-propagated A/Singapore/INFIMH-16-0019/2016.
86 viruses showed reduced titer with ferret antisera raised against egg-propagated A/Singapore/INFIMH-16-0019/2016.
A/Singapore/INFIMH-16-0019/2016-like virus is the influenza A(H3N2) component of the 2018-19 Northern Hemisphere influenza vaccine.
97 influenza A(H3N2) viruses characterized belonged to genetic group 3C.2a1. 19 viruses belonged to genetic group 3C.2a and 107 to 3C.3a. Sequencing is pending for the remaining isolates.
Influenza A(H1N1):
1,532 A(H1N1) viruses characterized were antigenically similar to A/Michigan/45/2015, which is the influenza A(H1N1) component of the 2018-19 Northern Hemisphere influenza vaccine.
43 viruses showed reduced titer with ferret antisera raised against cell culture-propagated A/Michigan/45/2015
Influenza B:
Influenza B viruses can be divided into two antigenically distinct lineages represented by B/Yamagata/16/88 and B/Victoria/2/87 viruses. The recommended influenza B components for the 2018-19 Northern Hemisphere influenza vaccine are B/Colorado/06/2017 (Victoria lineage) and B/Phuket/3073/2013 (Yamagata lineage).
24 influenza B viruses were characterized as B/Colorado/06/2017, which belong to the Victoria lineage and are included as an influenza B component of the 2018-19 Northern Hemisphere influenza vaccine.
84 viruses showed reduced titer with ferret antisera raised against cell culture-propagated B/Colorado/06/2017. Sequence analysis showed that 83 viruses that showed reduced titer had a three amino acid deletion (162-164) in the HA gene.
23 influenza B viruses were characterized as B/Phuket/3073/2013-like, which belongs to the Yamagata lineage and is included as an influenza B component of the 2018-19 Northern Hemisphere quadrivalent influenza vaccine.


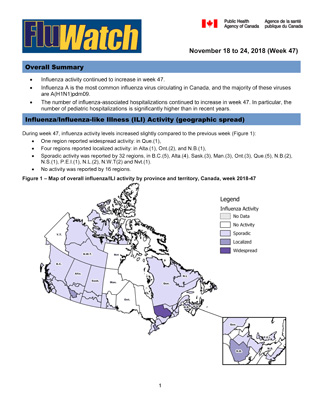
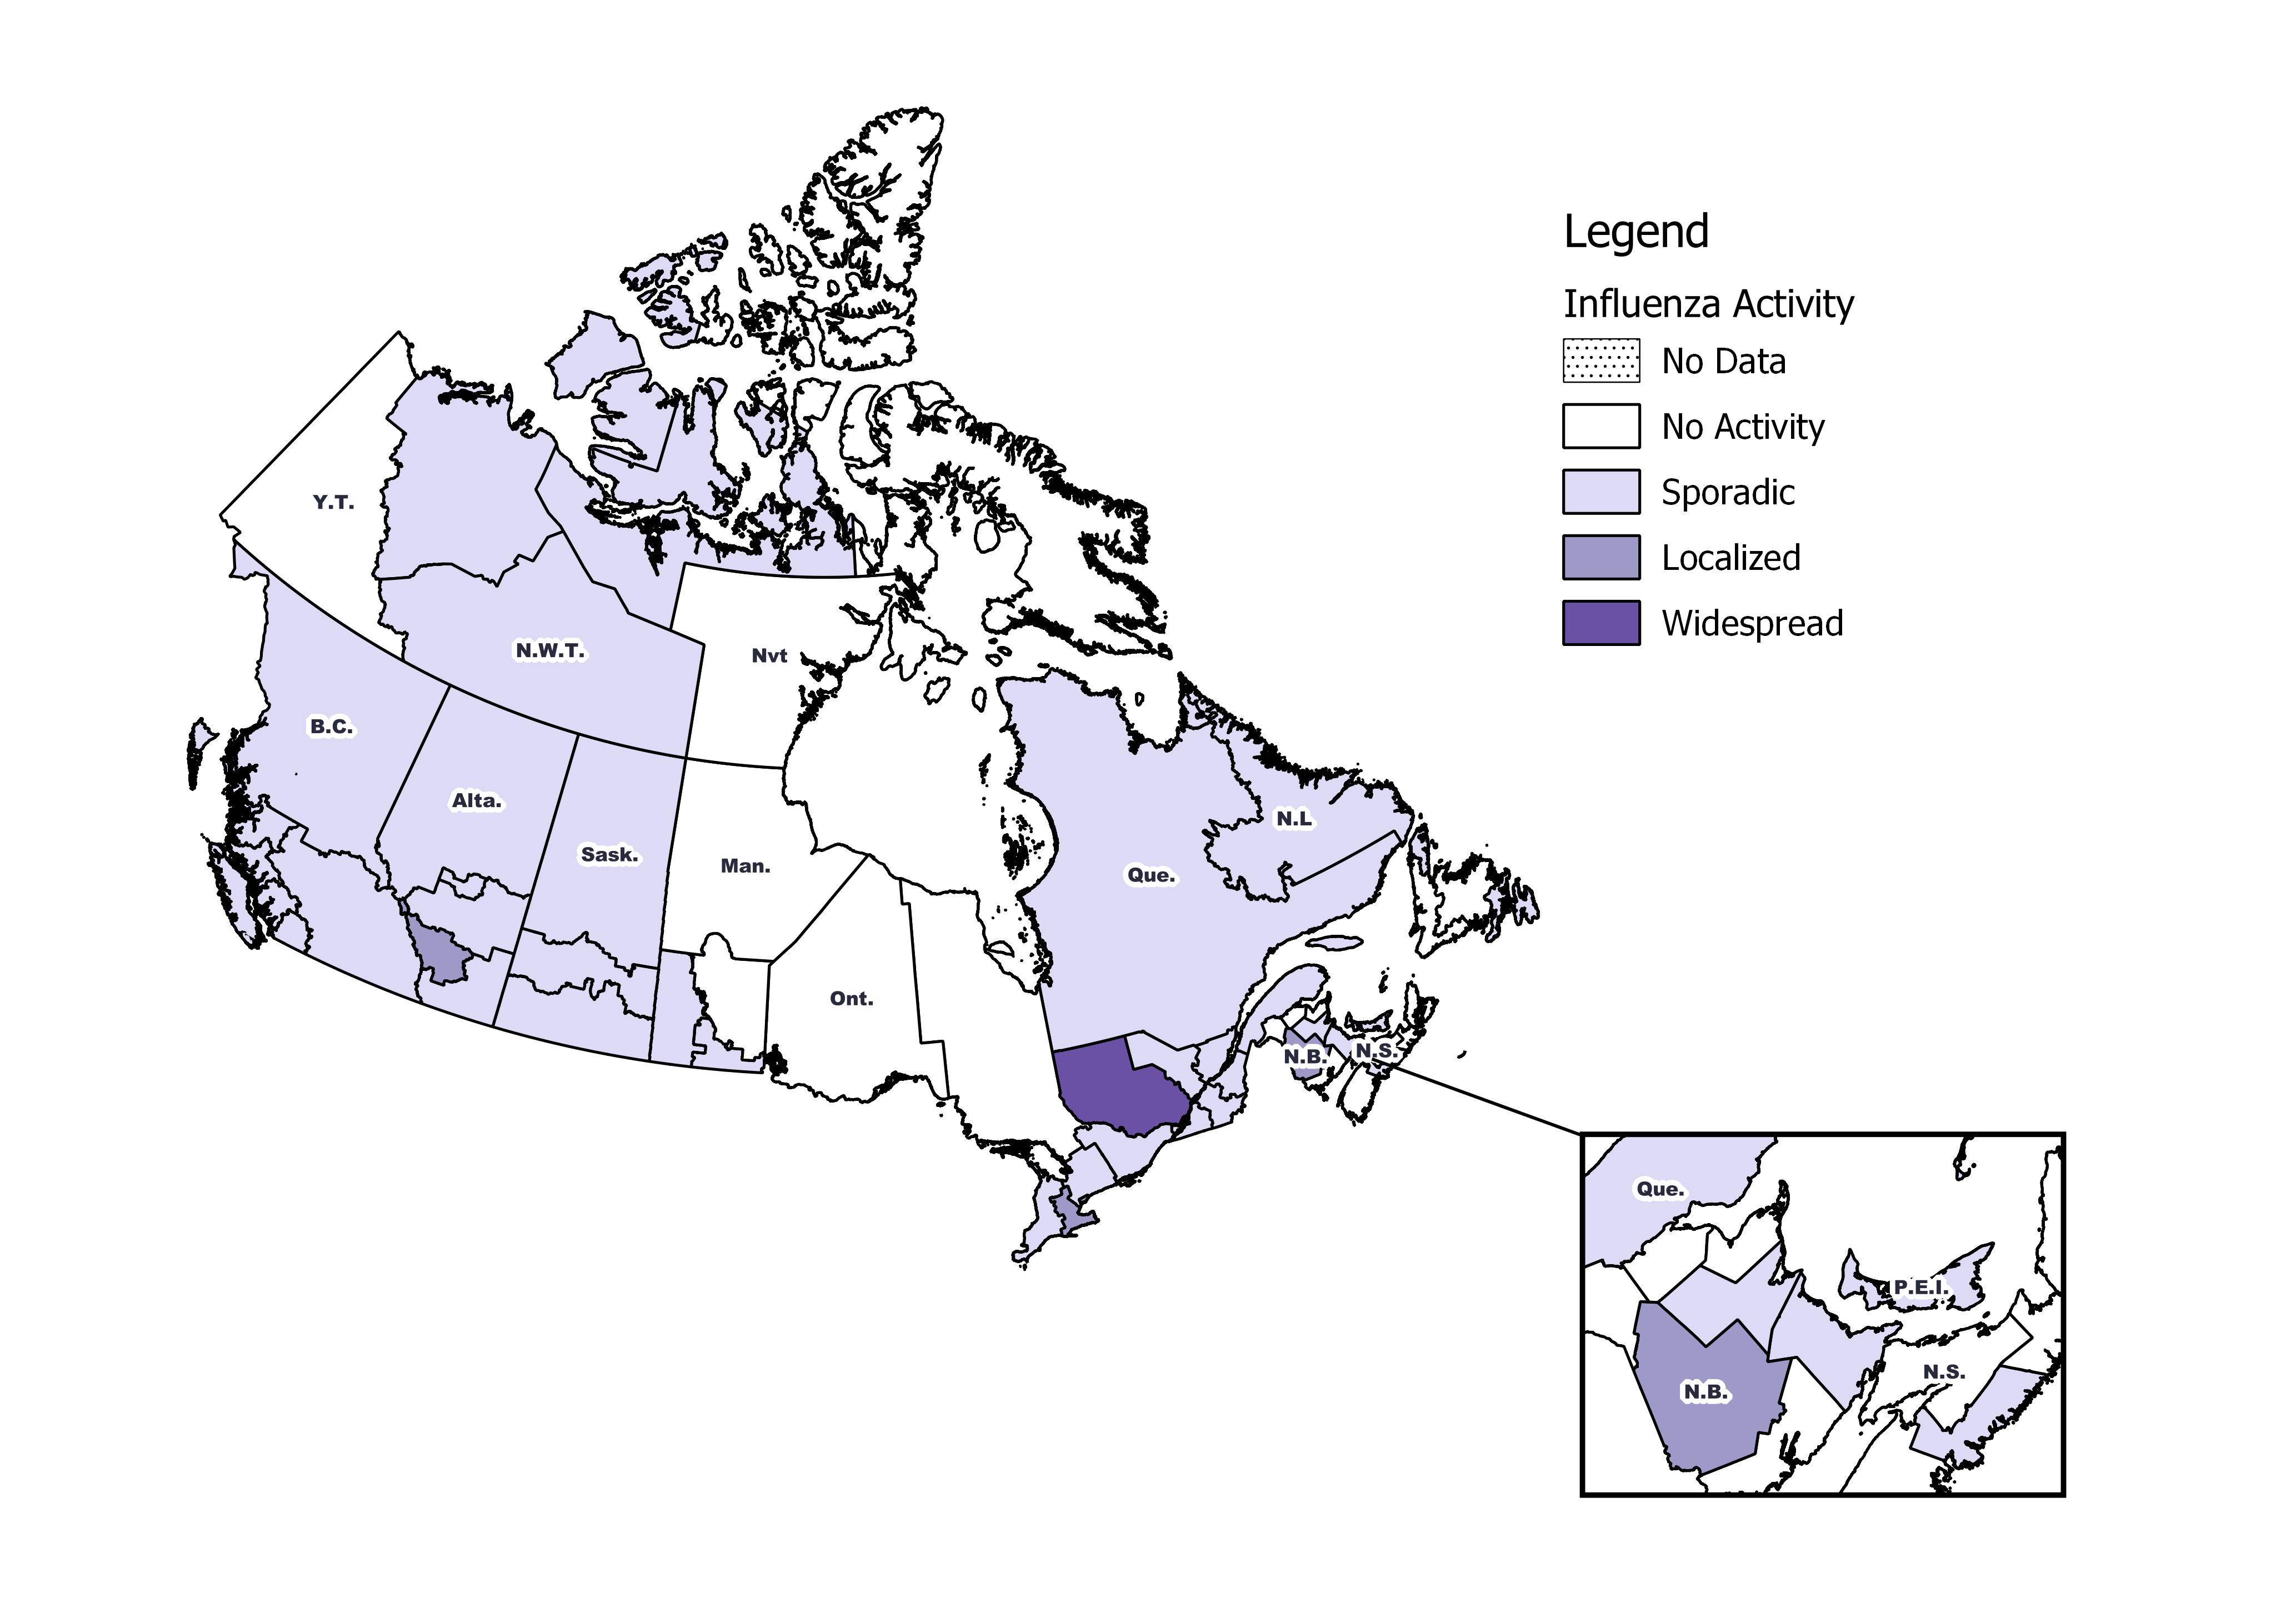 Figure 1 - Text description [h=2]Laboratory Confirmed Influenza Detections[/h] In week 47, the following results were reported from sentinel laboratories across Canada (Figure 2):
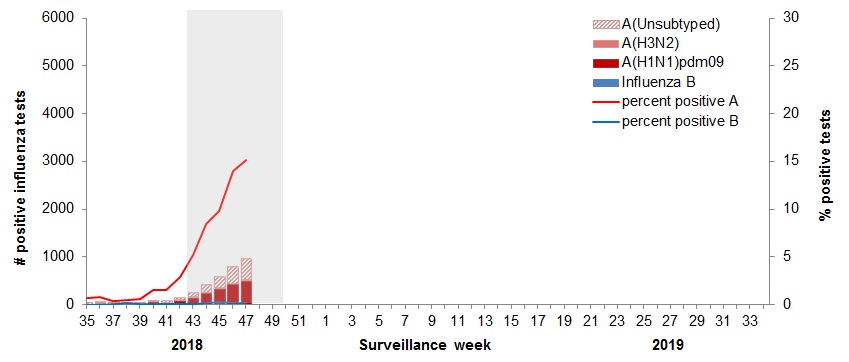 The shaded area indicates weeks where the positivity rate was at least 5% and a minimum of 15 positive tests were observed, signalling the period of seasonal influenza activity.
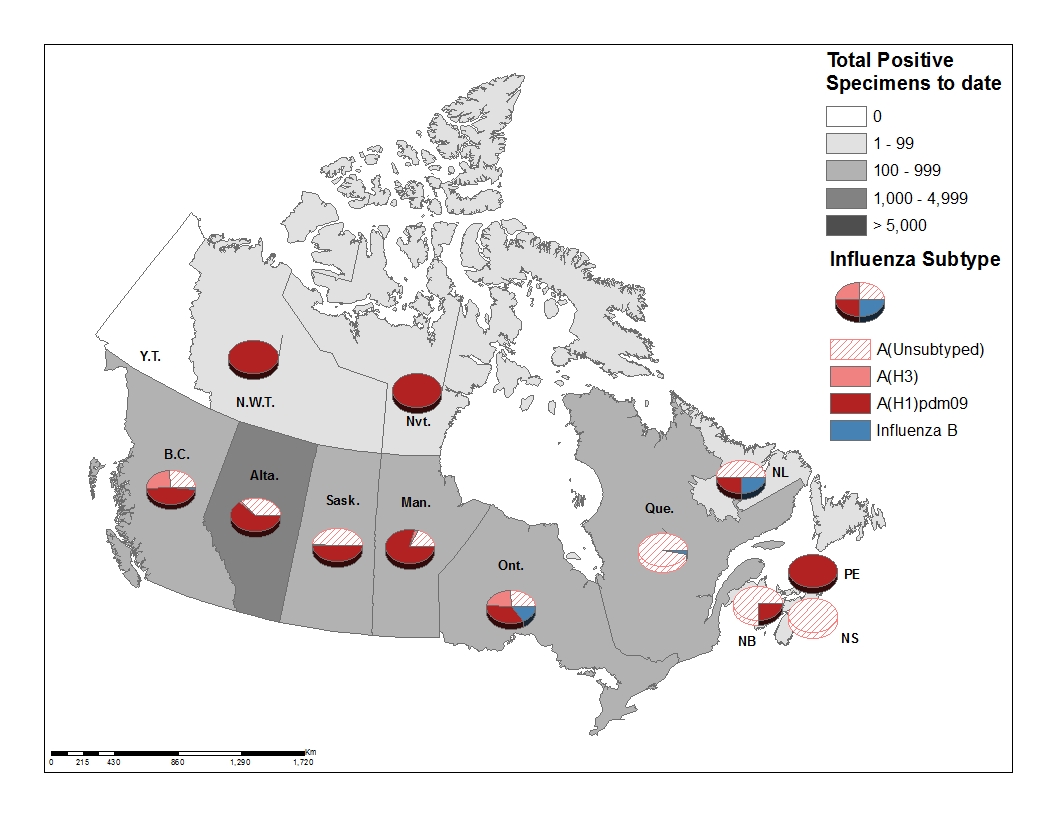 Figure 3 - Text description [TABLE="class: table table-striped table-bordered table-hover table-condensed, width: 1140"]
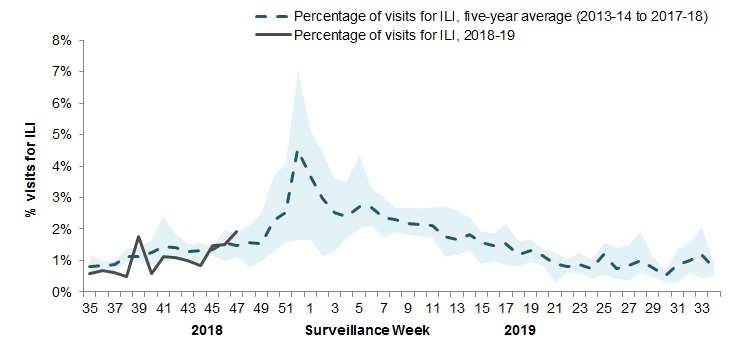 The shaded area represents the maximum and minimum percentage of visits for ILI reported by week from seasons 2013-14 to 2017-18
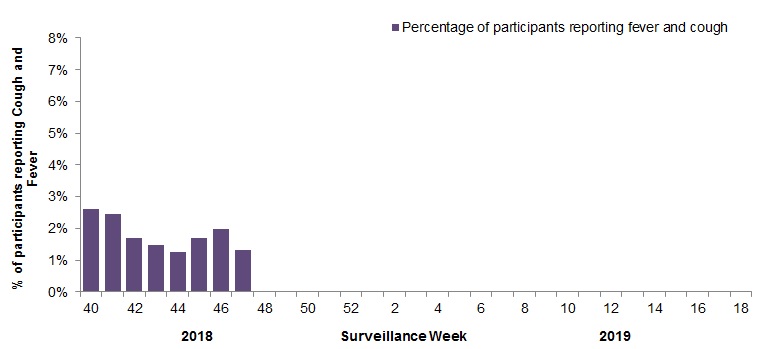 Figure 5 - Text description [h=2]Influenza Outbreak Surveillance[/h] In week 47, five new laboratory-confirmed influenza outbreaks were reported in long-term care (3) and acute care (2) facilities.
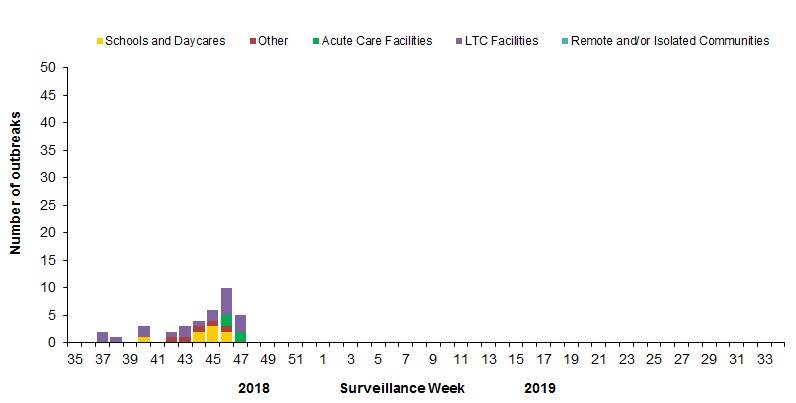 Figure 6 - Text description [h=2]Severe Outcomes Influenza Surveillance[/h] [h=3]Provincial/Territorial Influenza Hospitalizations and Deaths[/h] To date this season, more than 471 influenza-associated hospitalizations have been reported by participating provinces and territoriesFootnote1.
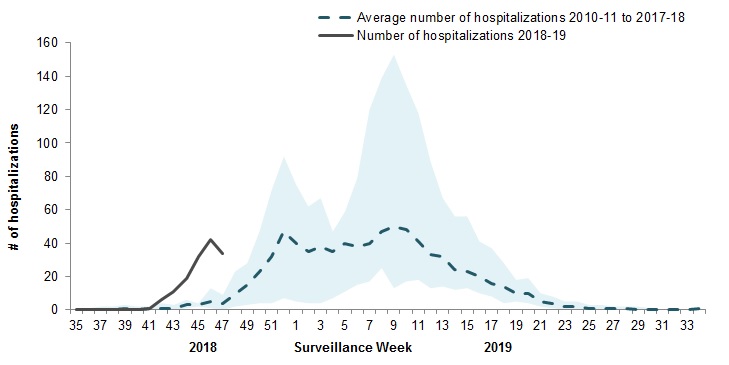 Figure 7 - Text description [h=3]Figure 8 - Cumulative numbers of pediatric hospitalizations (≤16 years of age) with influenza by age-group reported by the IMPACT network, Canada, weeks 2018-35 to 2018-47[/h]
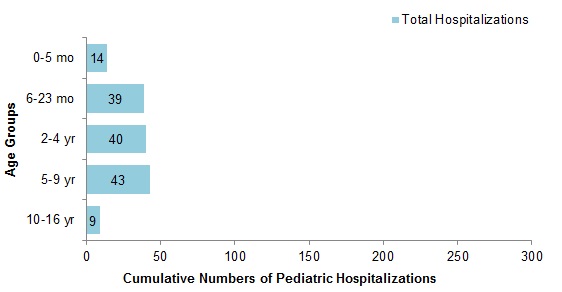 Figure 8 - Text description [h=3]Adult Influenza Hospitalizations and Deaths[/h] Surveillance of laboratory-confirmed influenza-associated adult (≥16 years of age) hospitalizations by the Canadian Immunization Research Network (CIRN) Serious Outcomes Surveillance (SOS) network began on November 1st for the 2018-19 season.