• FluTrackers.com Inc. does not provide medical advice. Information on this web site is collected from various internet resources, and the FluTrackers board of directors makes no warranty to the safety, efficacy, correctness or completeness of the information posted on this site by any author or poster. The information collated here is for instructional and/or discussion purposes only and is NOT intended to diagnose or treat any disease, illness, or other medical condition. Every individual reader or poster should seek advice from their personal physician/healthcare practitioner before considering or using any interventions that are discussed on this website. By continuing to access this website you agree to consult your personal physican before using any interventions posted on this website, and you agree to hold harmless FluTrackers.com Inc., the board of directors, the members, and all authors and posters for any effects from use of any medication, supplement, vitamin or other substance, device, intervention, etc. mentioned in posts on this website, or other internet venues referenced in posts on this website.
  • We are not asking for any donations. Do not donate to any entity who says they are raising funds for us.

Canada FluWatch Weekly Reports 2017-2018 Season Week 18

Pathfinder

Editor, Senior Moderator
[h=1]FluWatch report: December 17, 2017 to December 30, 2017 (weeks 51 & 52)[/h] [h=5]Overall Summary[/h]
  • Overall, influenza activity continues to increase across Canada. All indicators of influenza activity increased in weeks 51 and 52, but are within the range of expected levels for this time of year.
  • The majority of influenza detections continue to be A(H3N2), although the proportion of detections that are influenza B has been increasing steadily.
  • Influenza B is circulating much earlier than usual this season.The number of influenza B detections remains substantially greater this season compared to previous years.
  • To date this season, the majority of lab confirmations, hospitalizations and deaths have been among adults 65 years of age and older.
  • For more information on the flu, see our Flu(influenza) web page.
[h=2]On this page[/h]
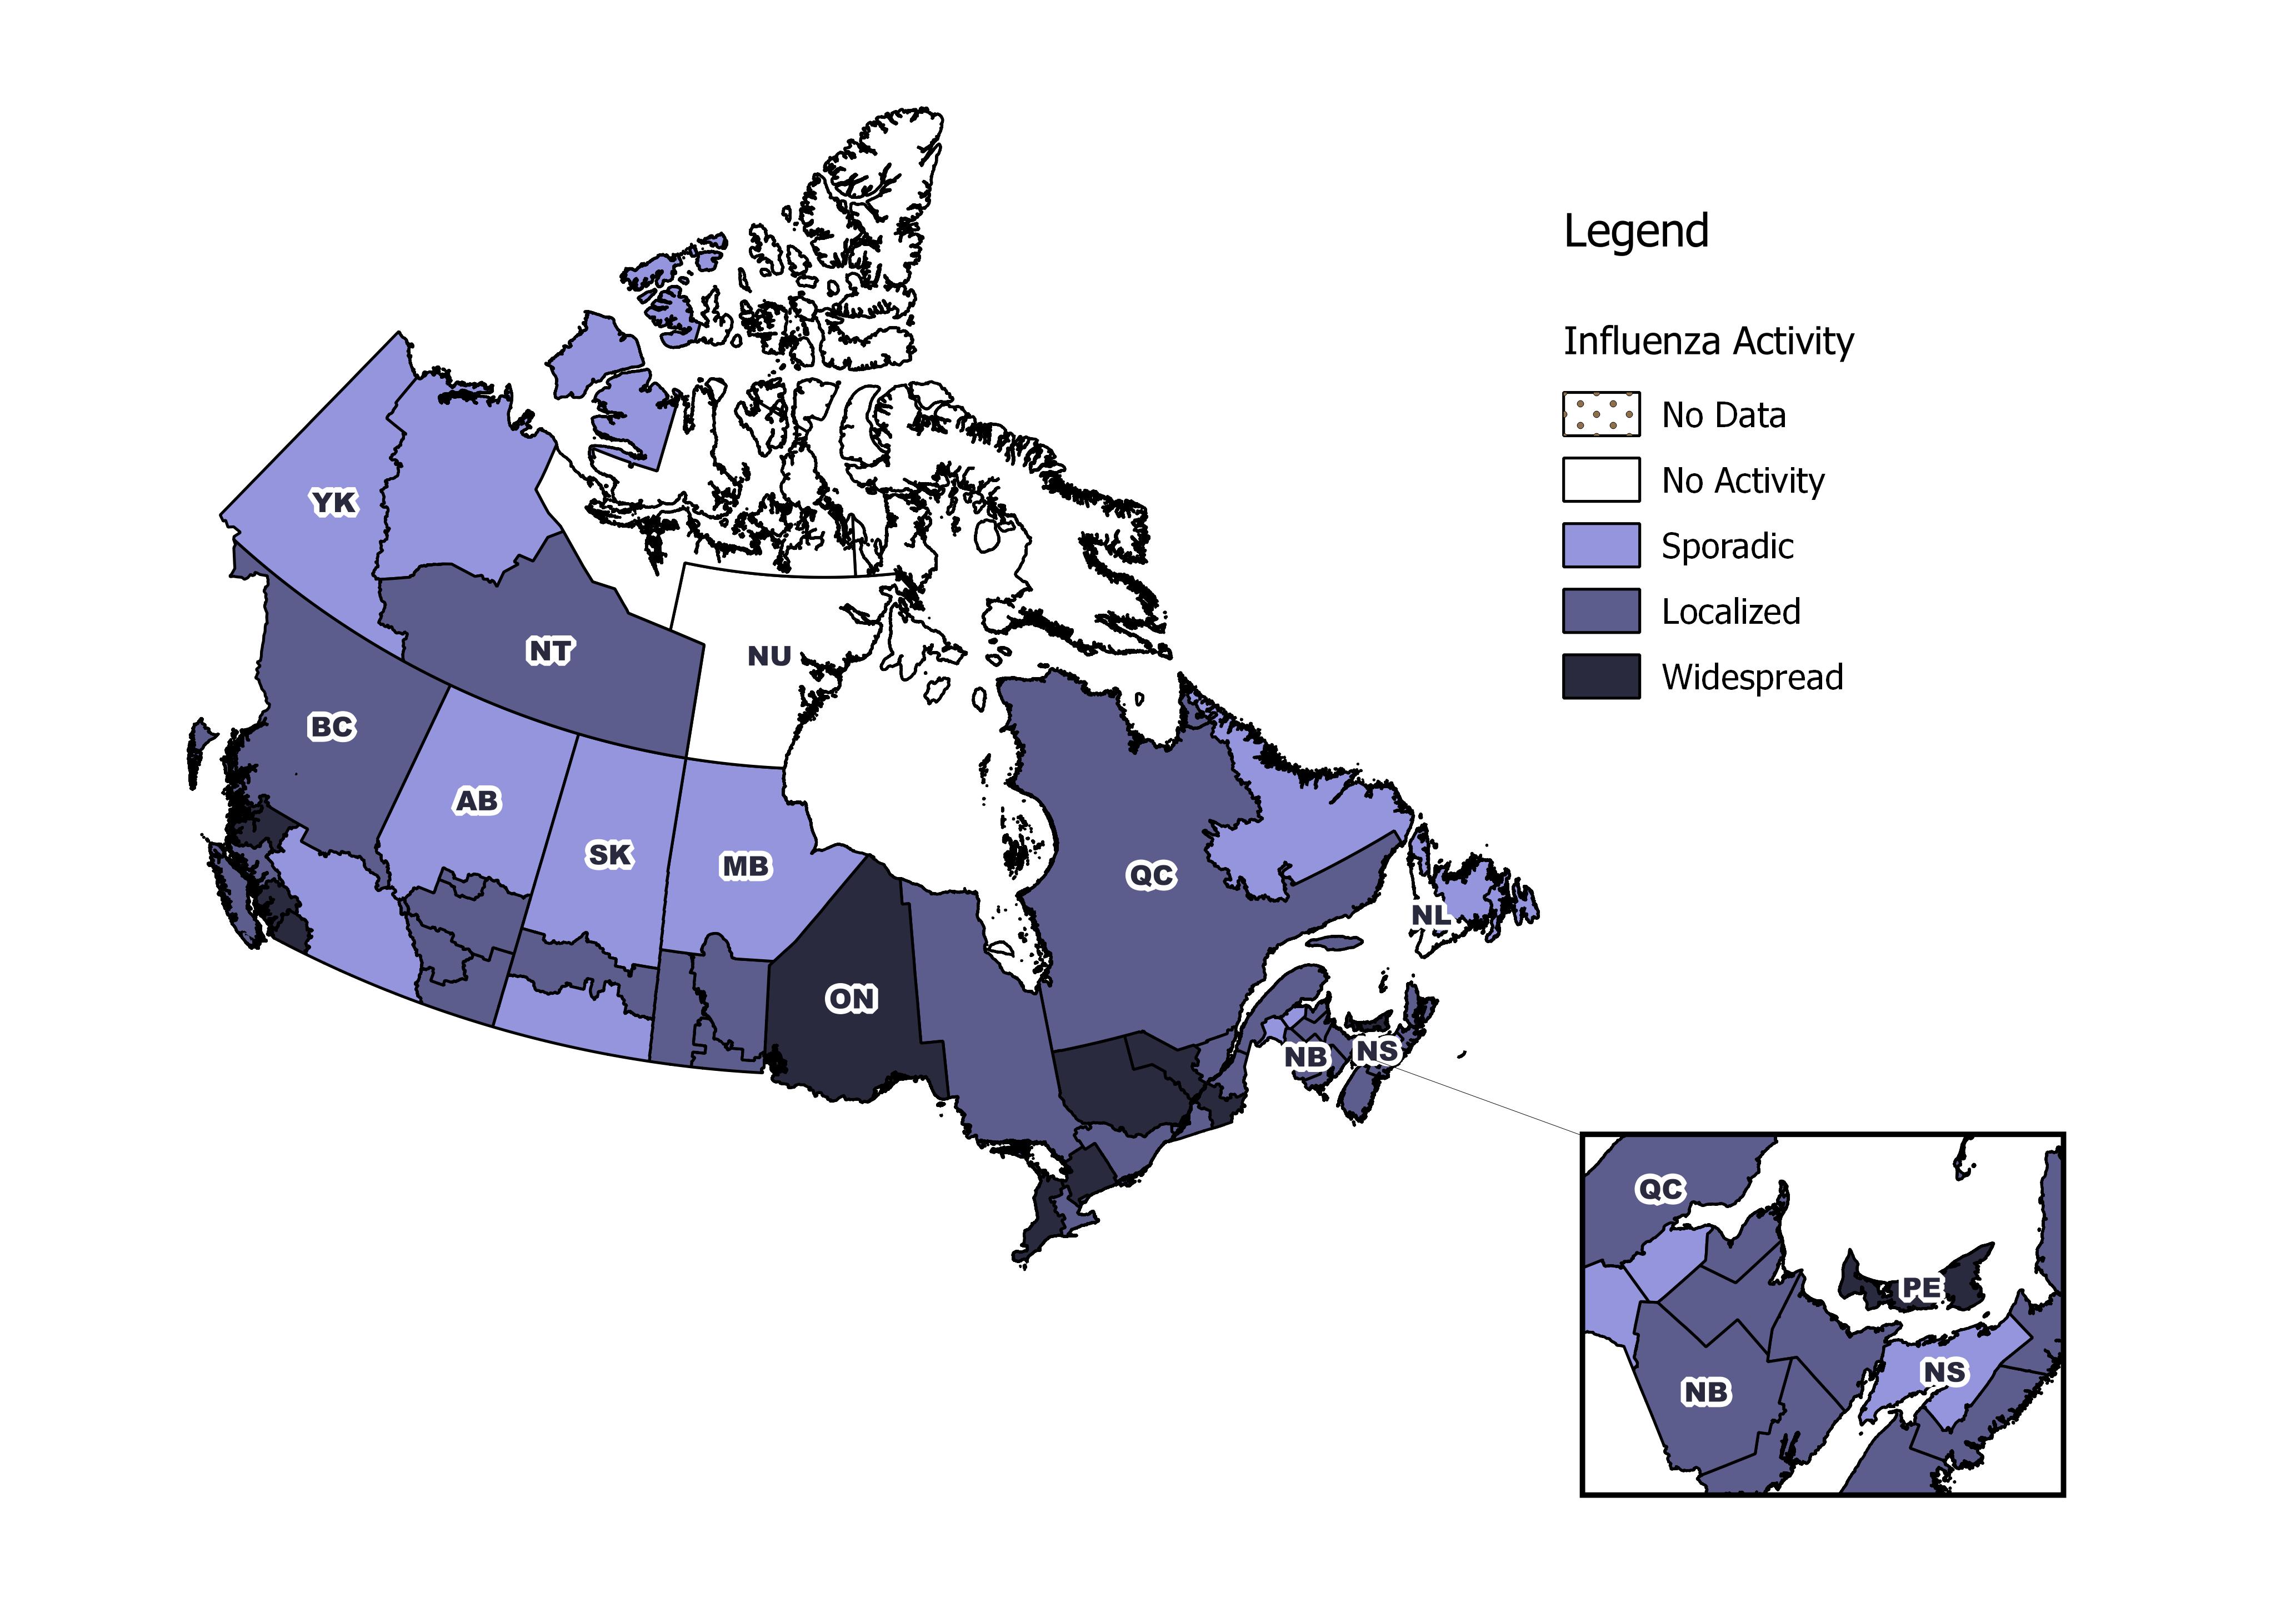
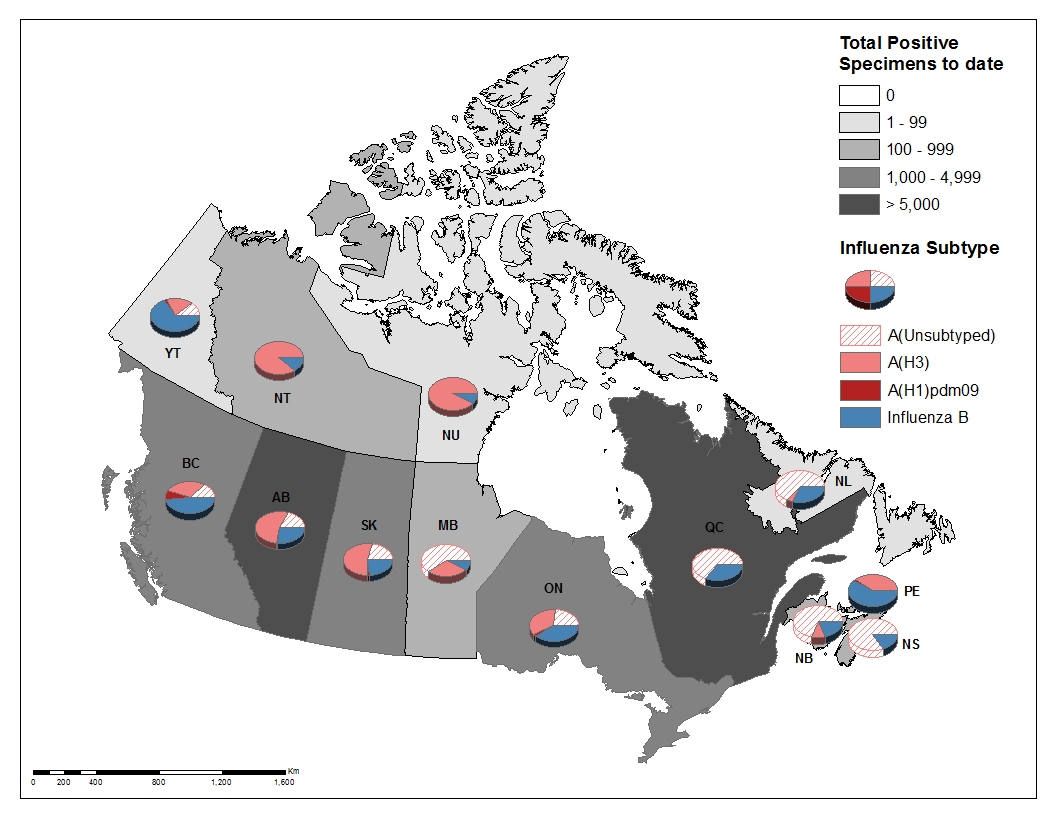
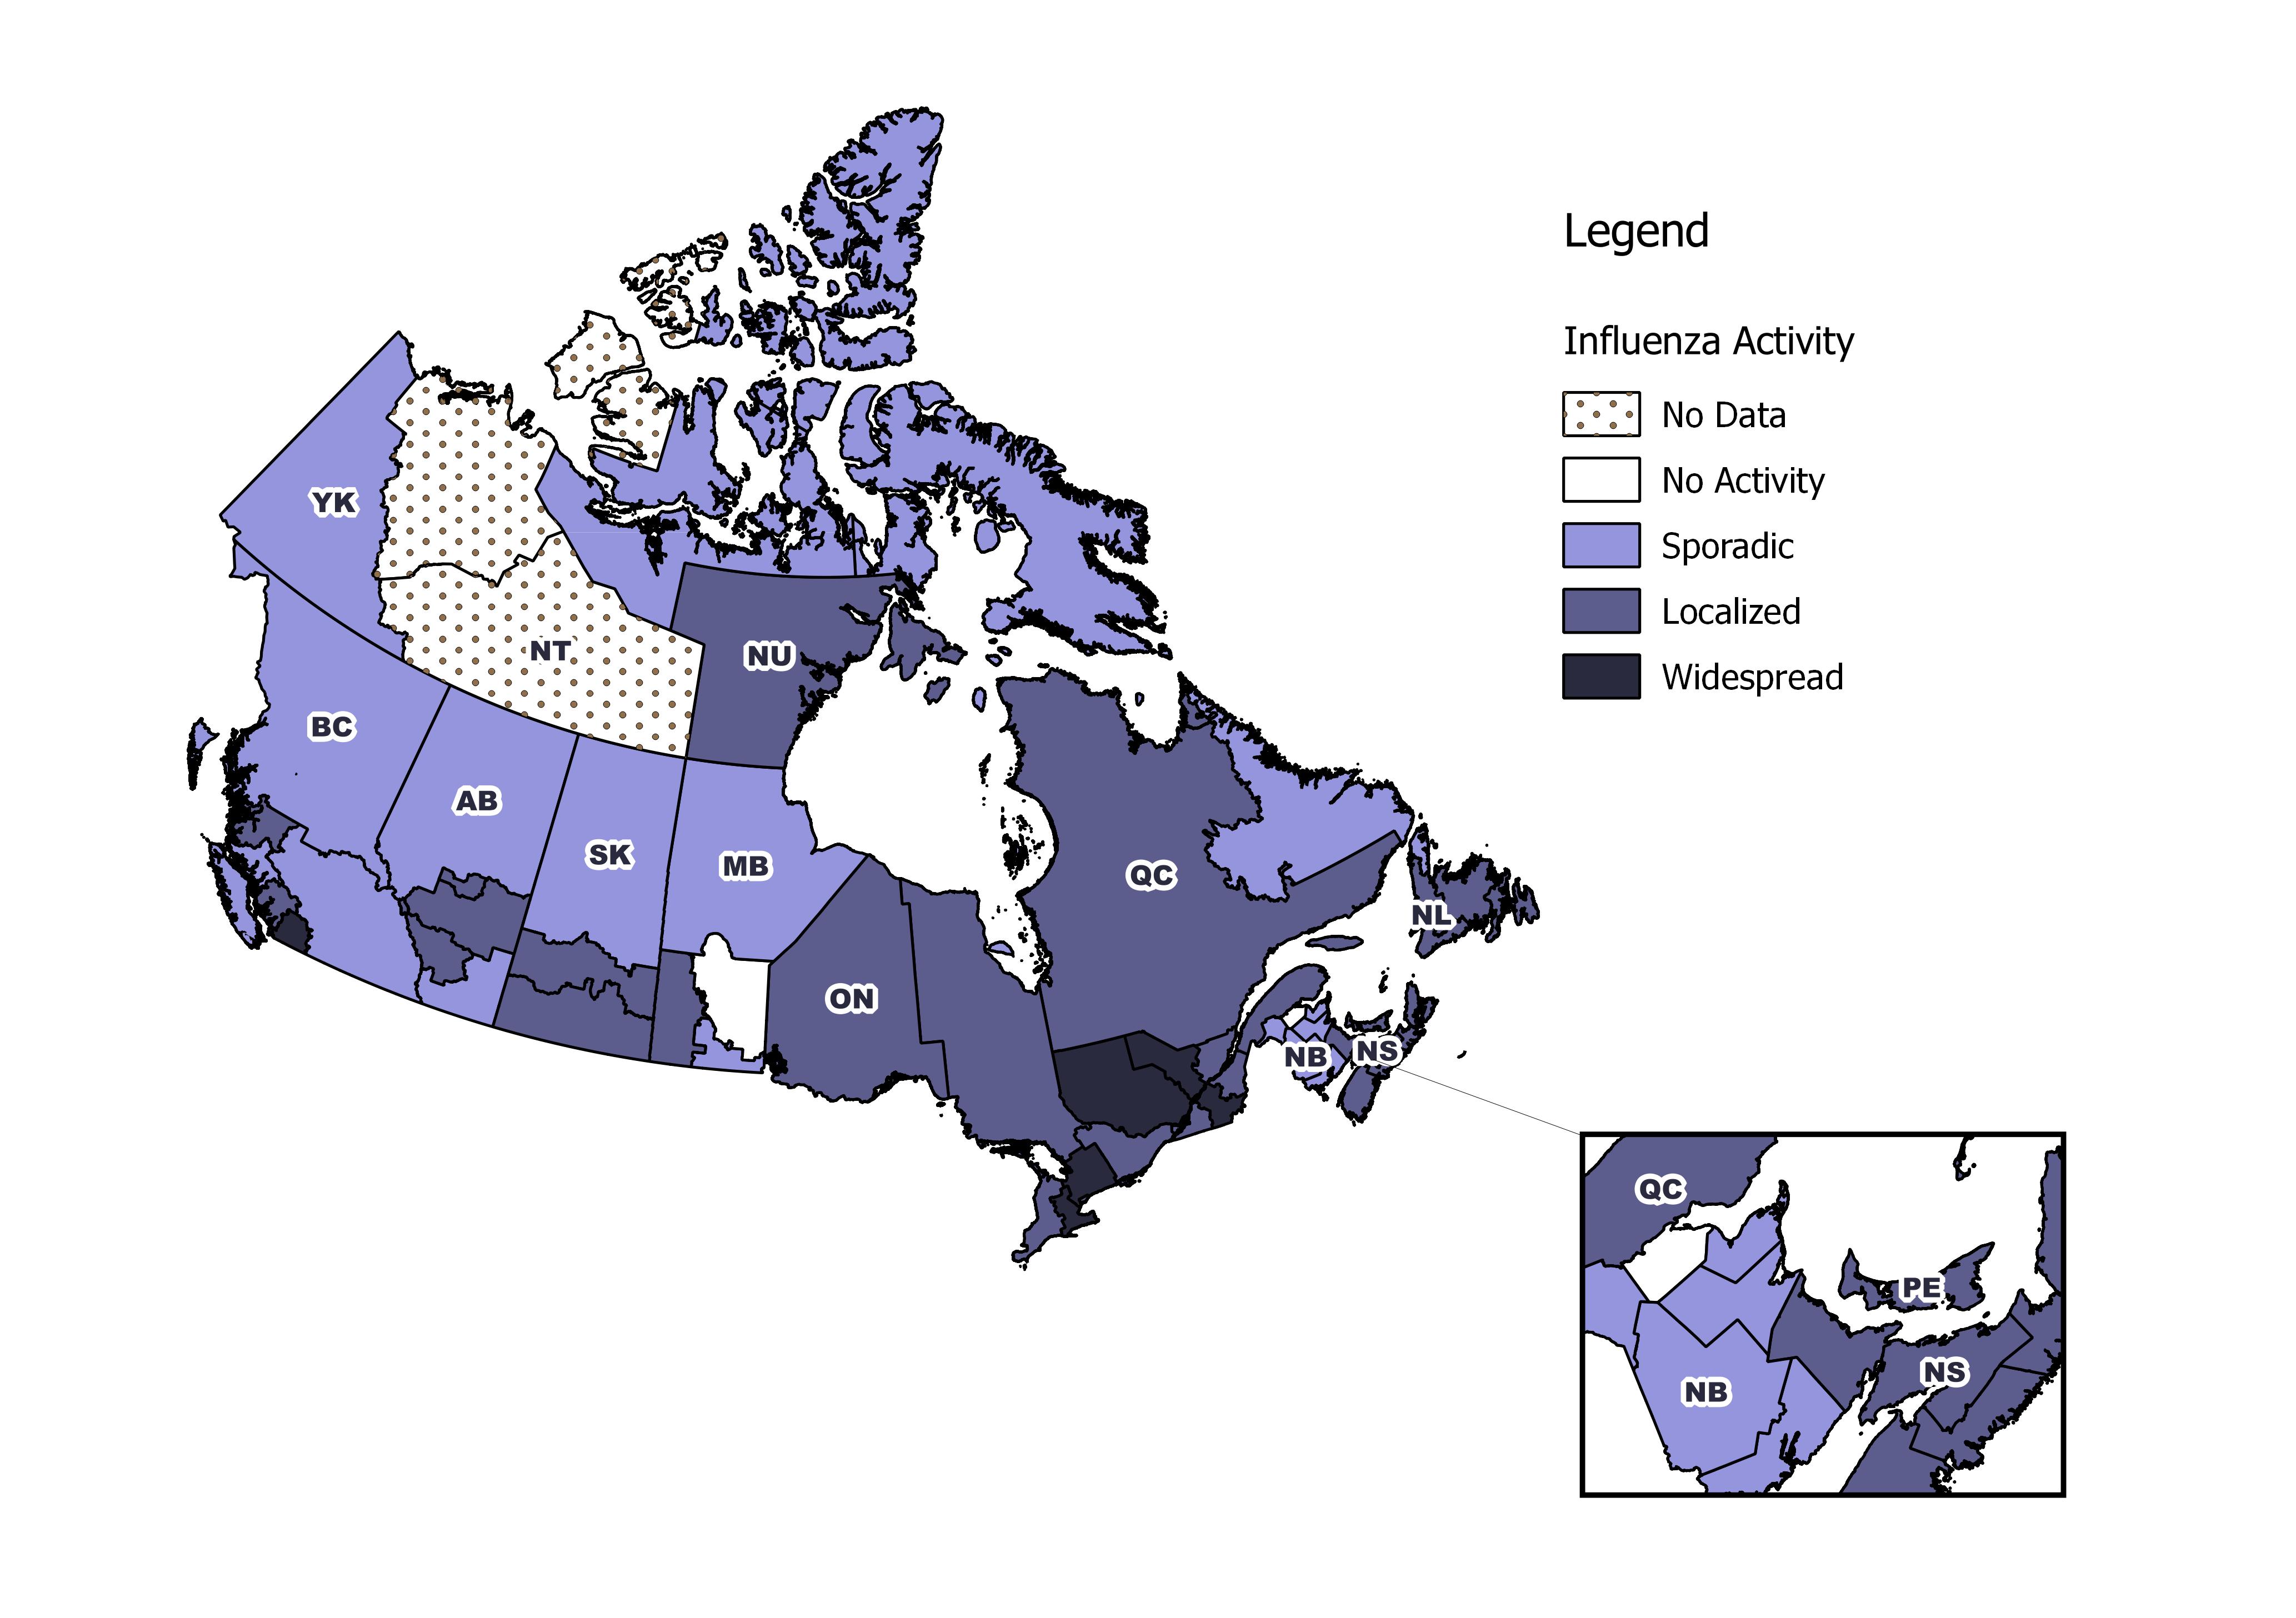
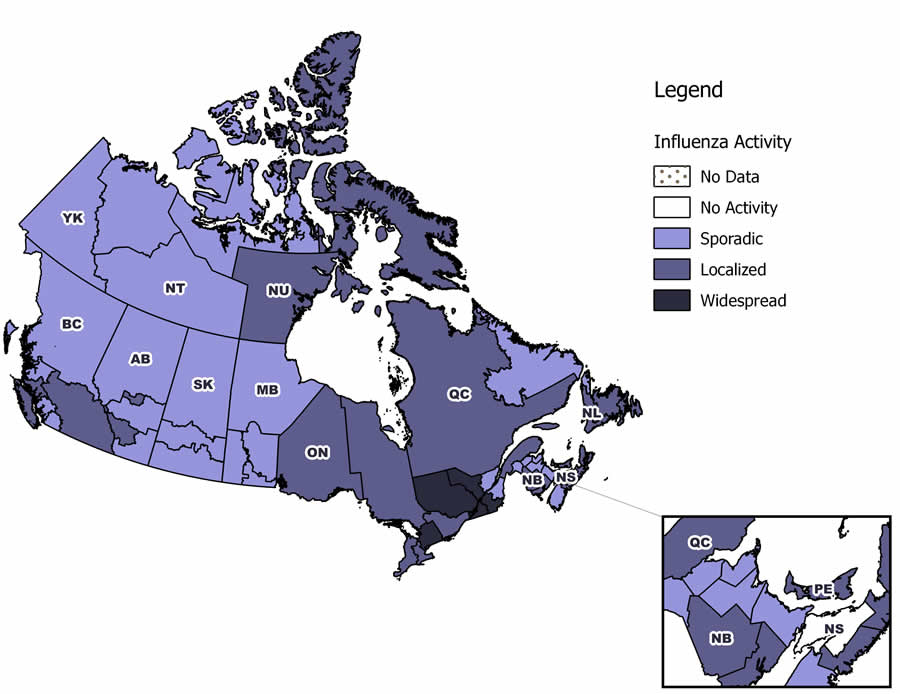
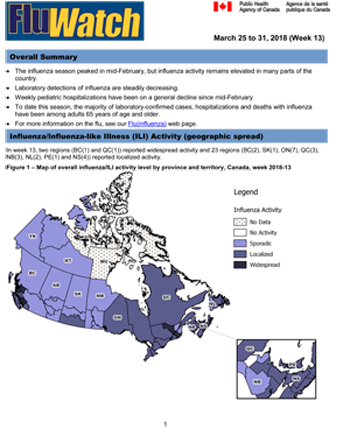
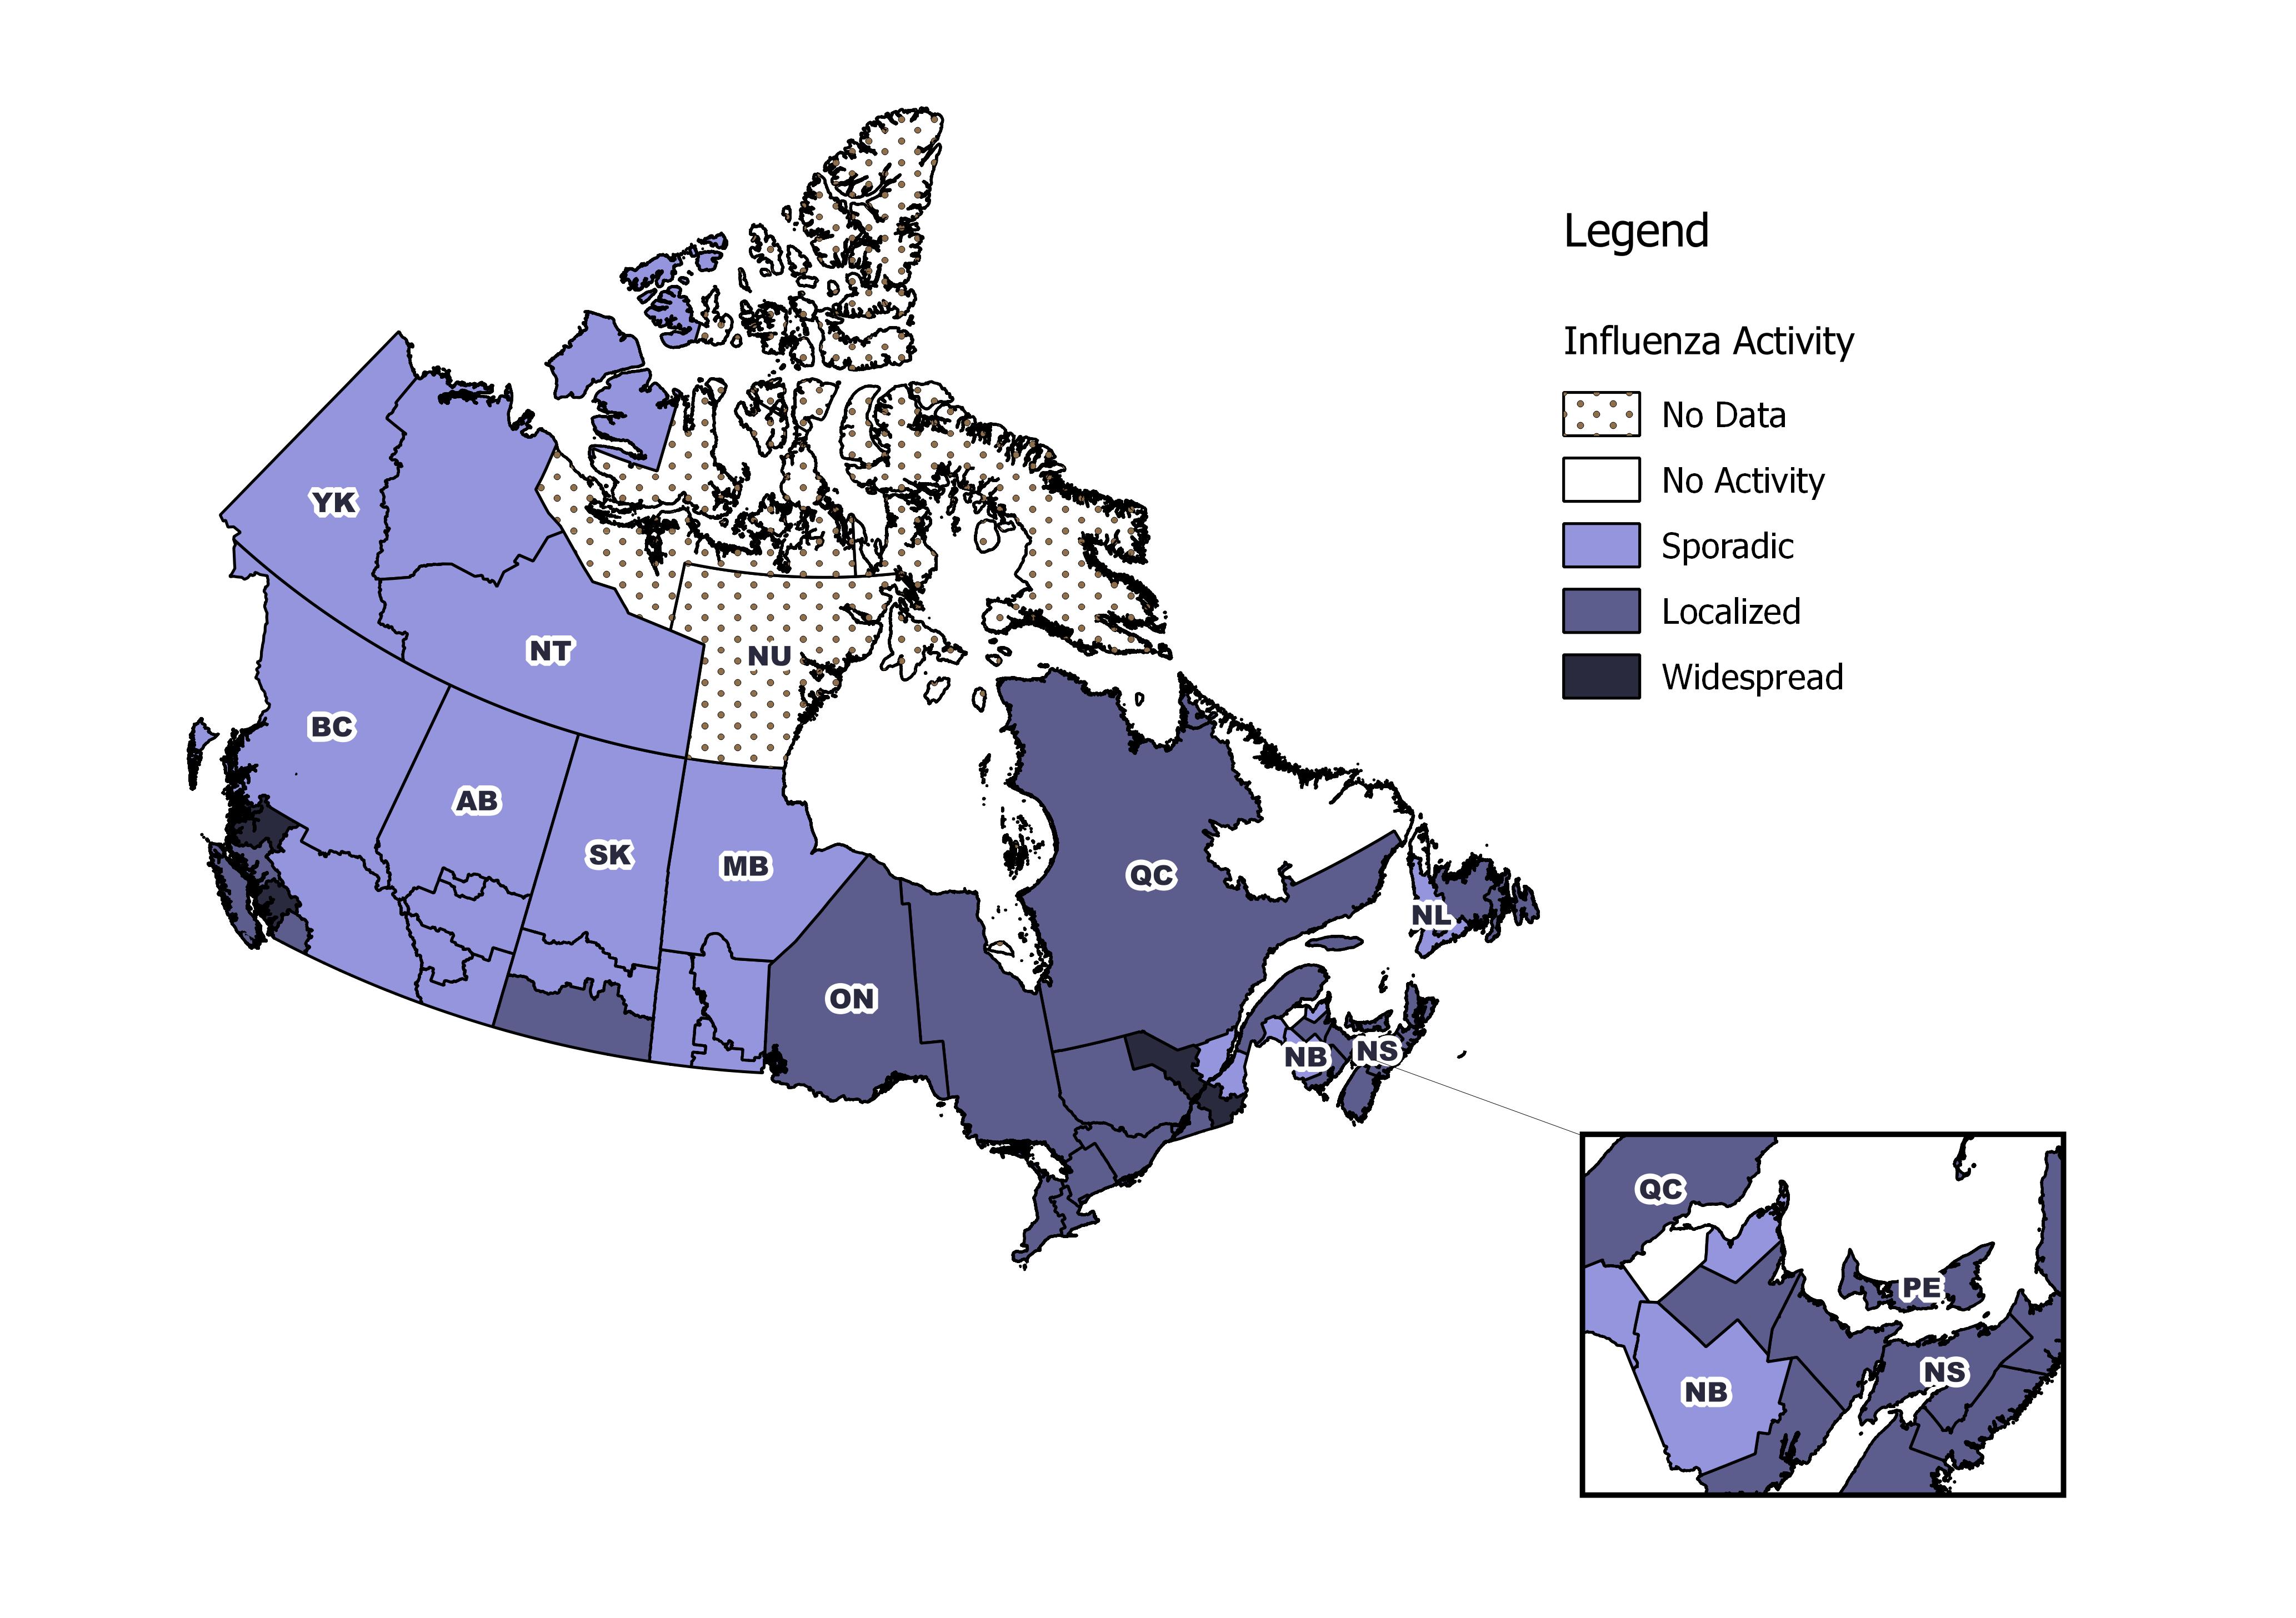
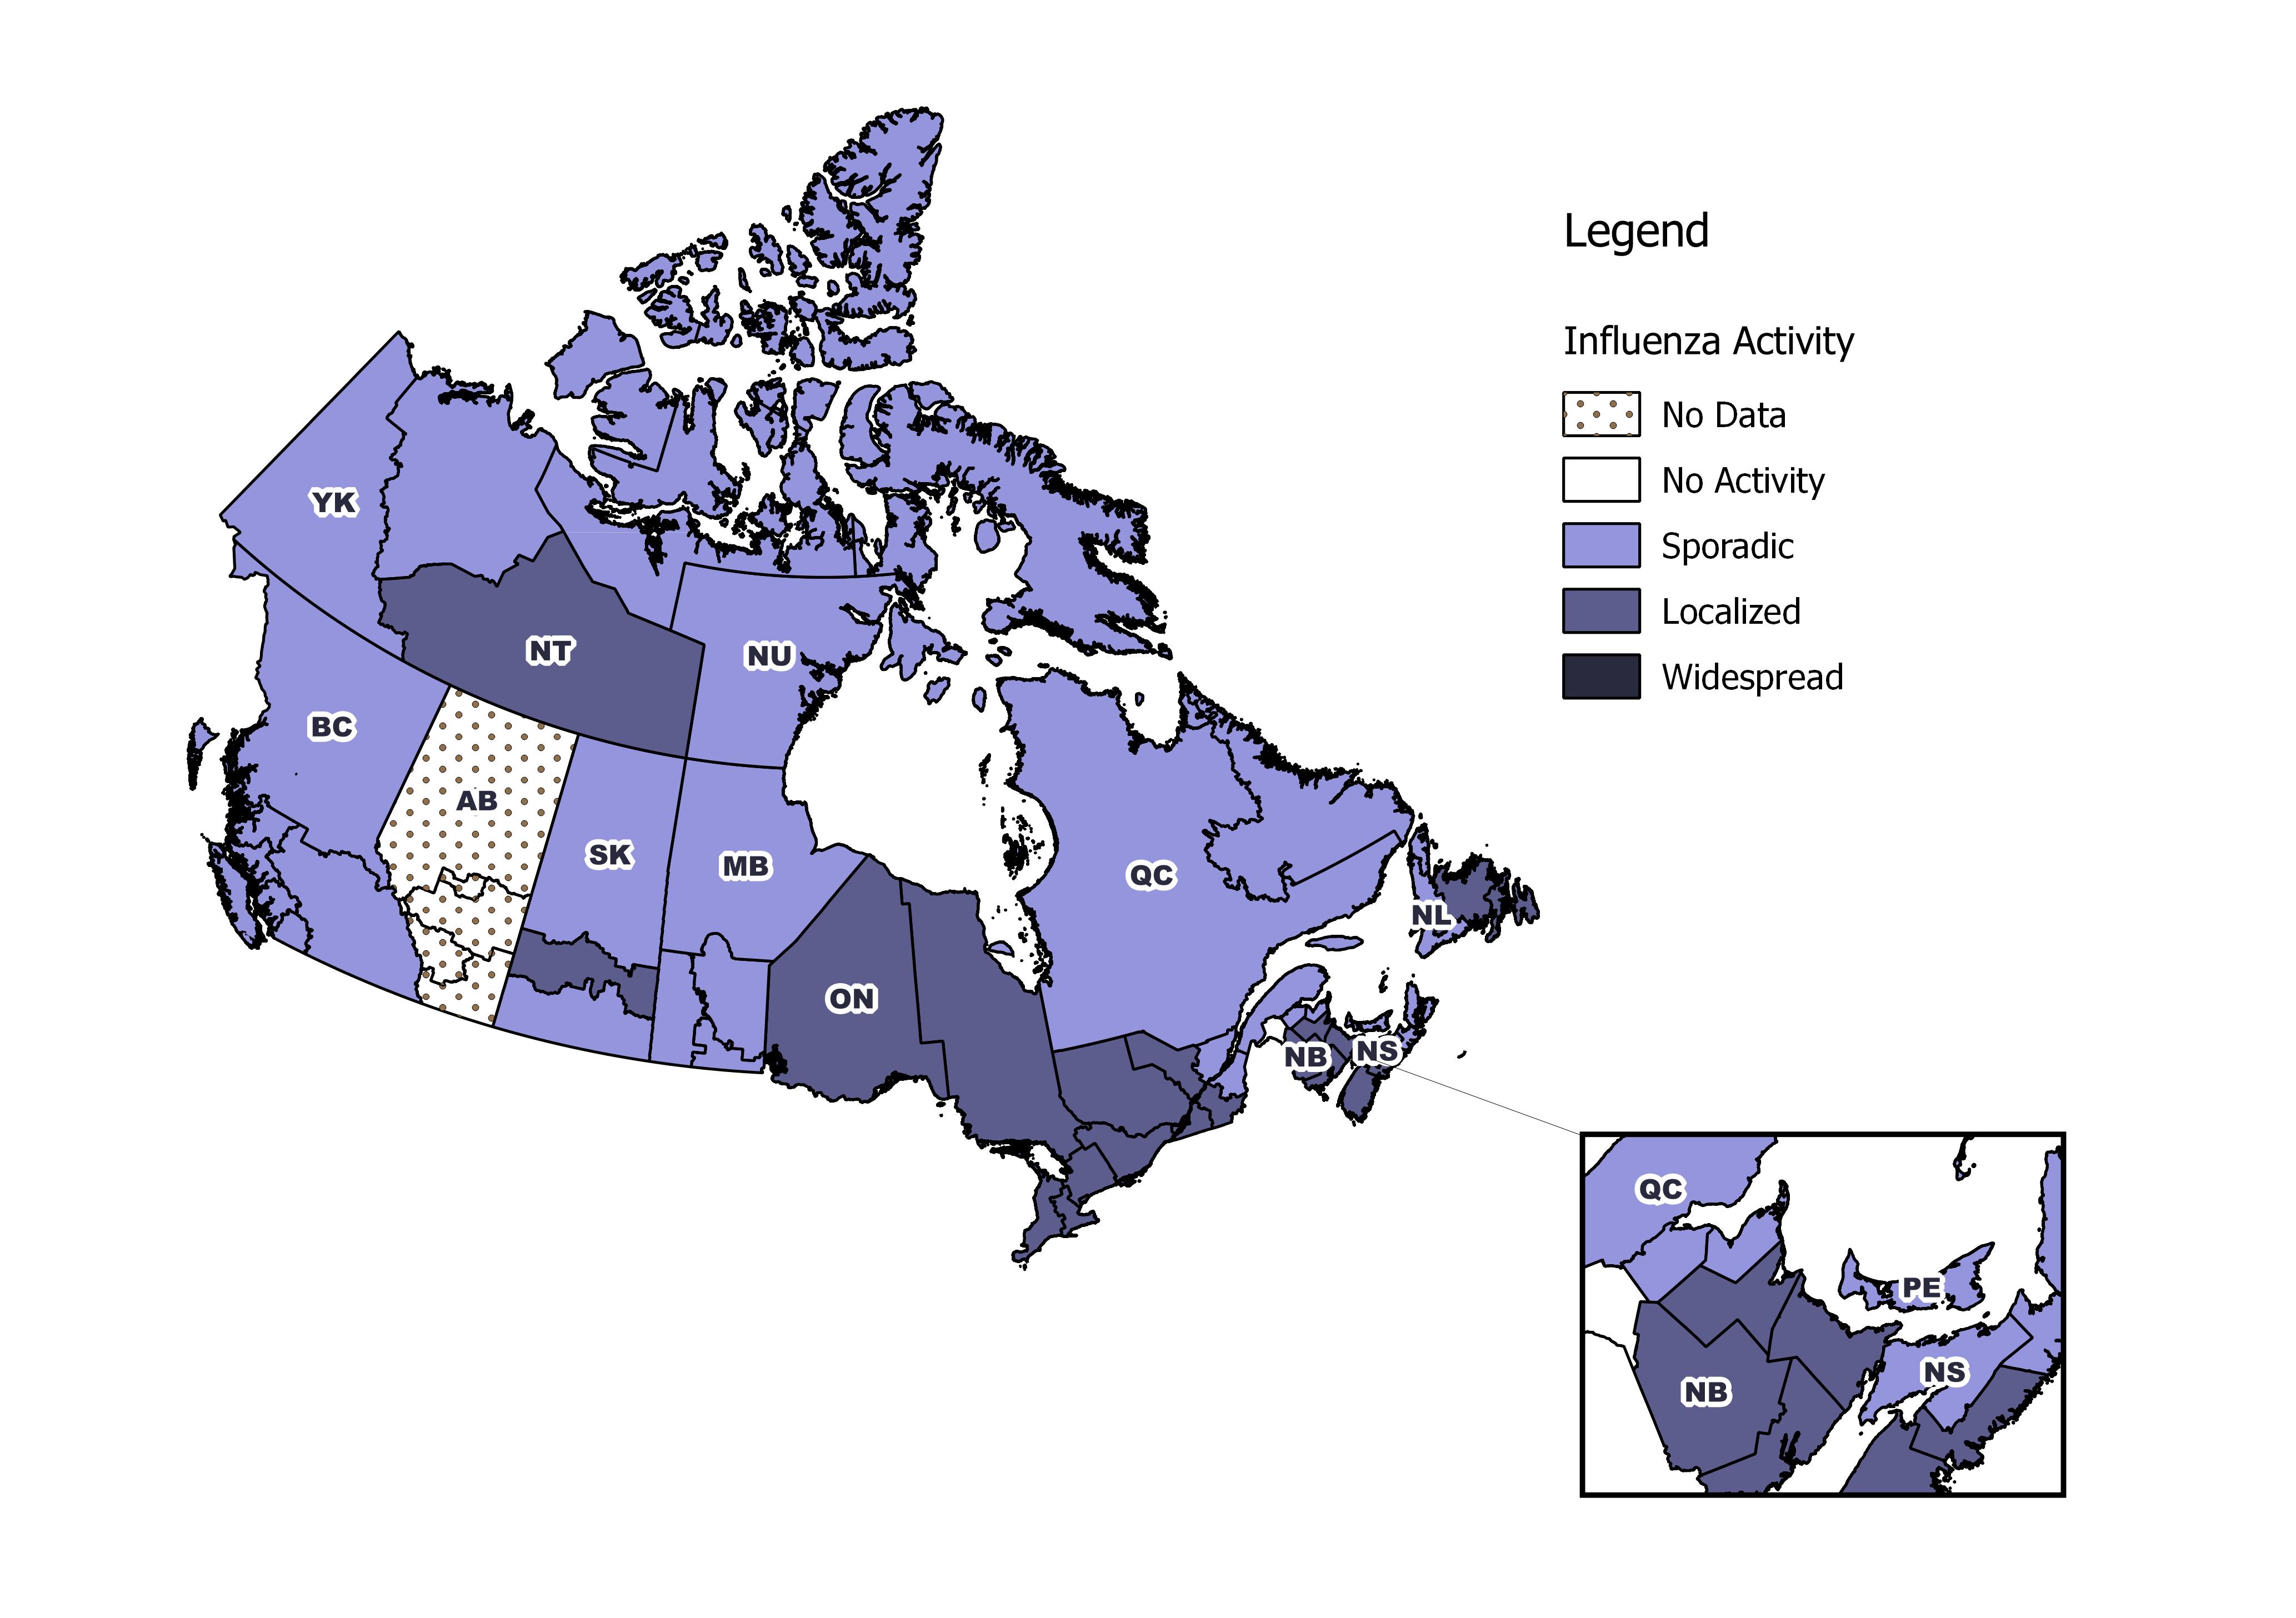
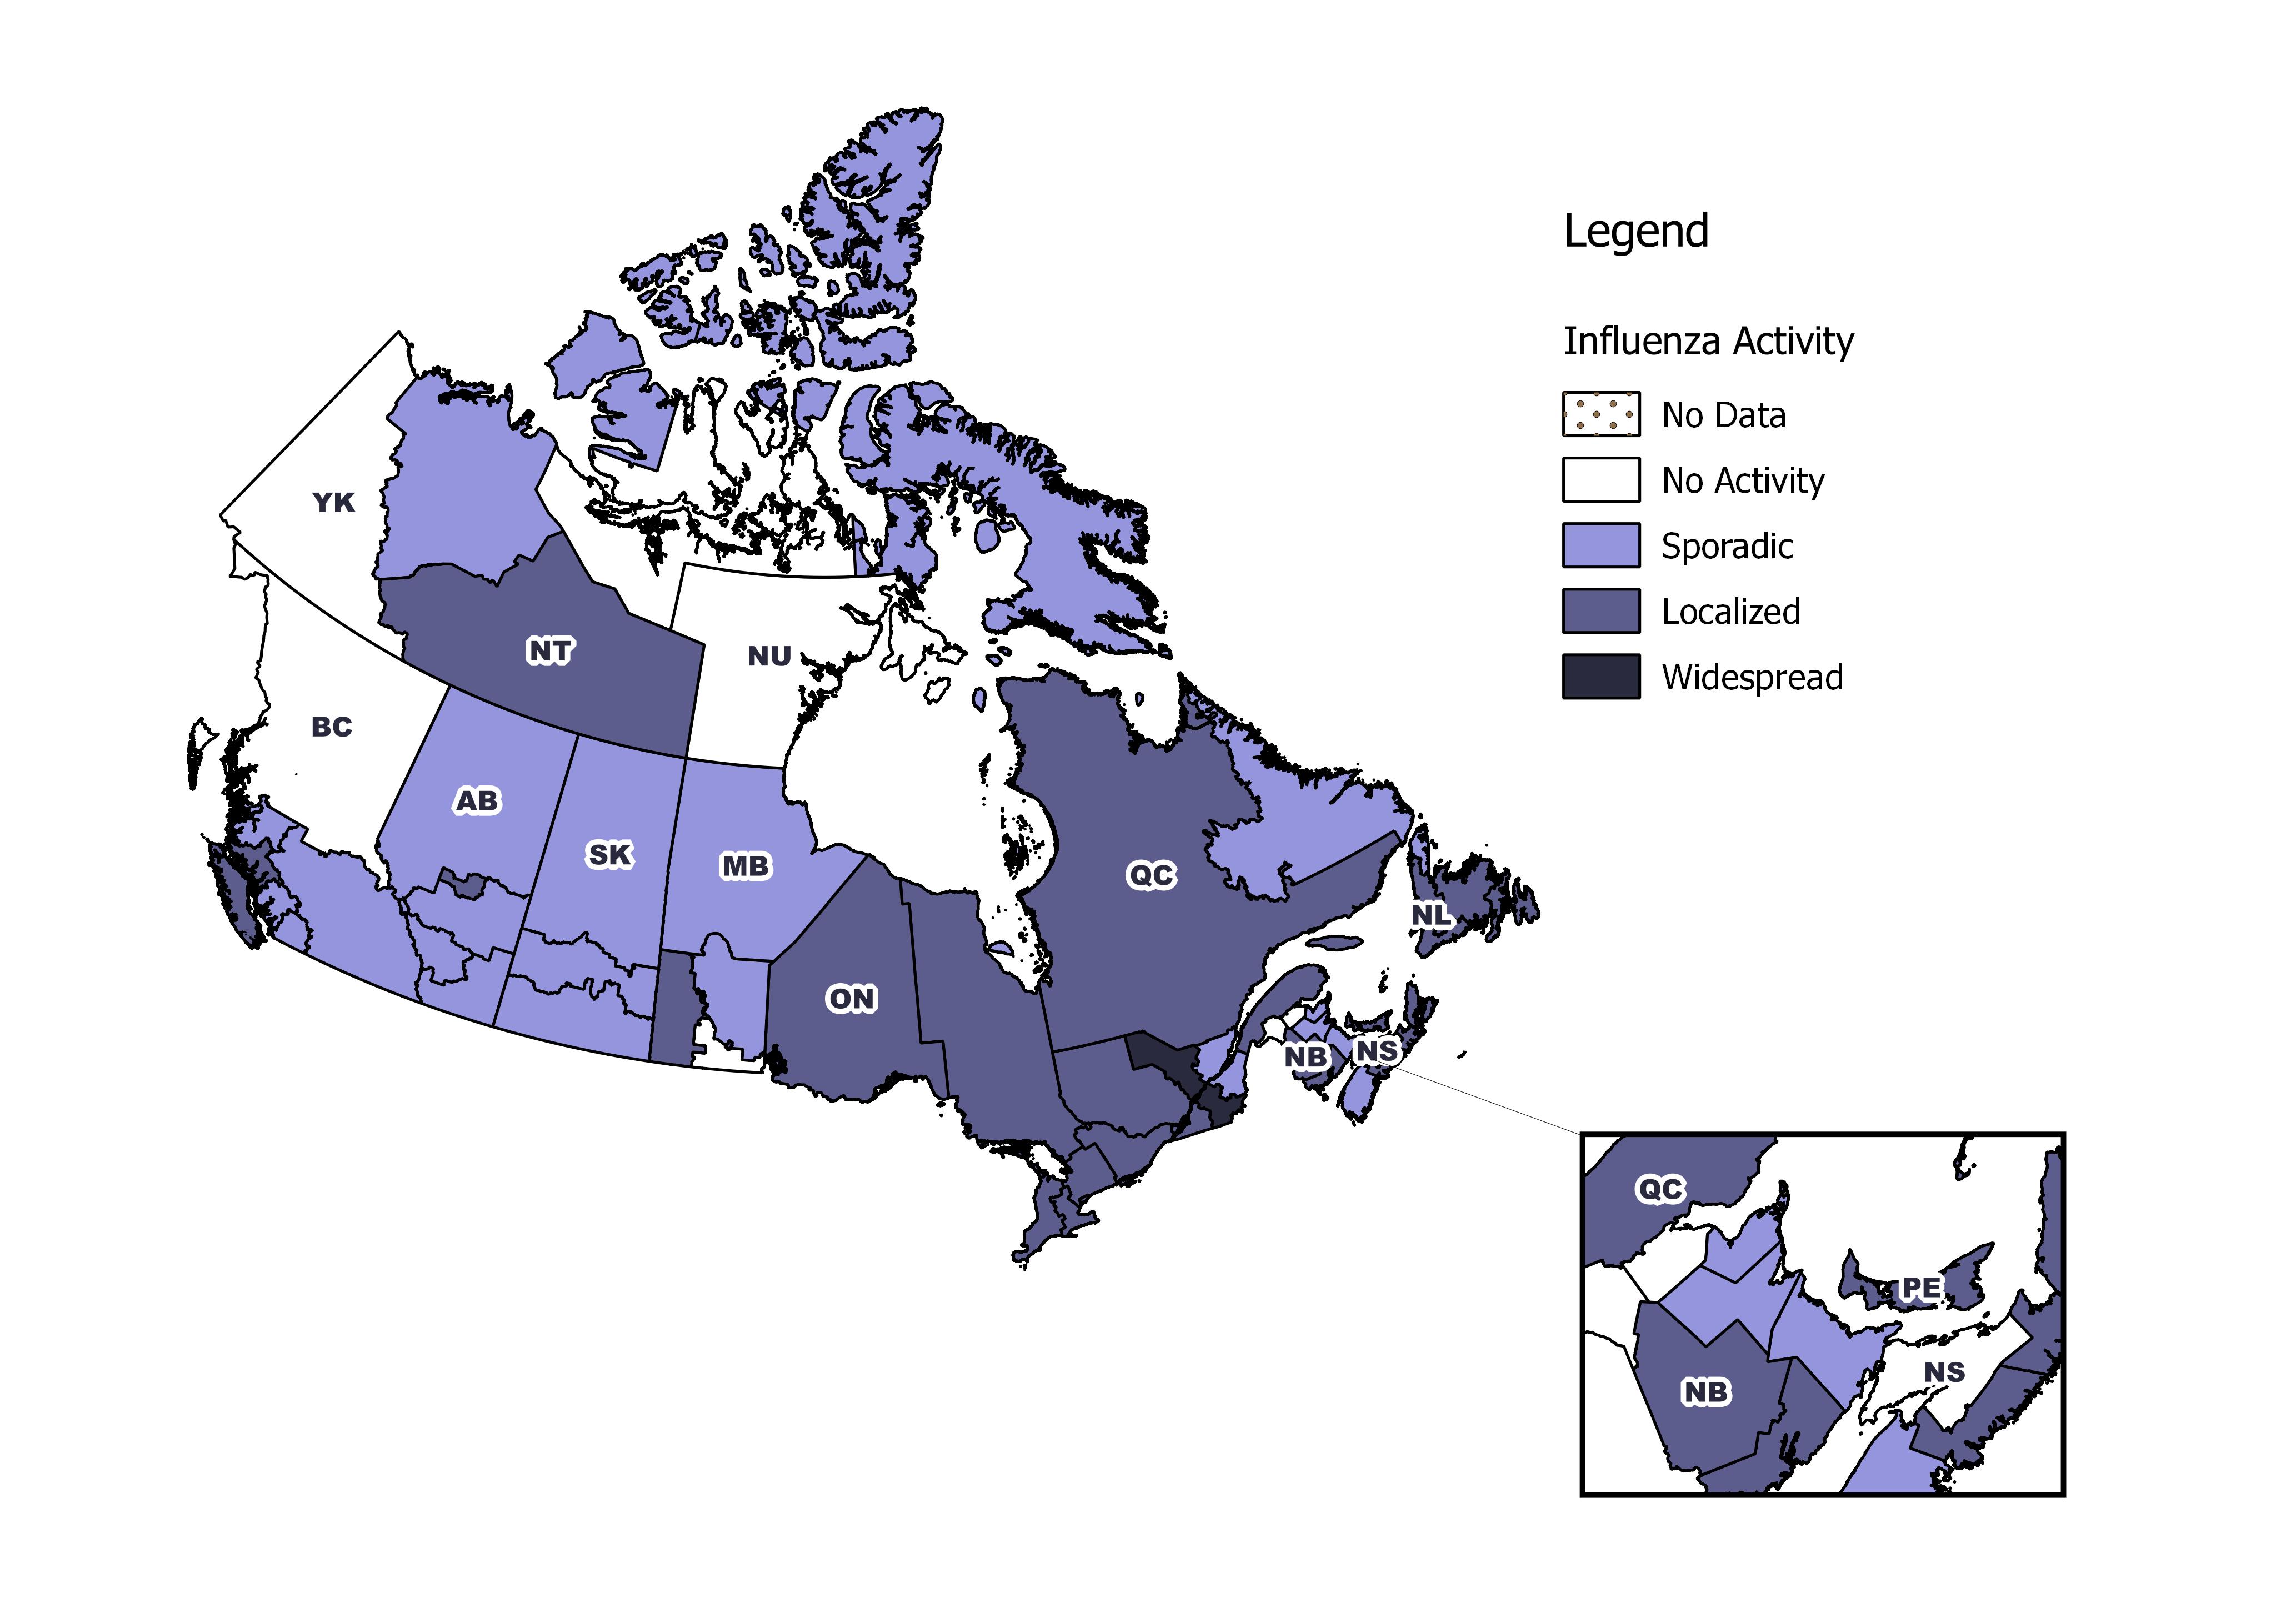
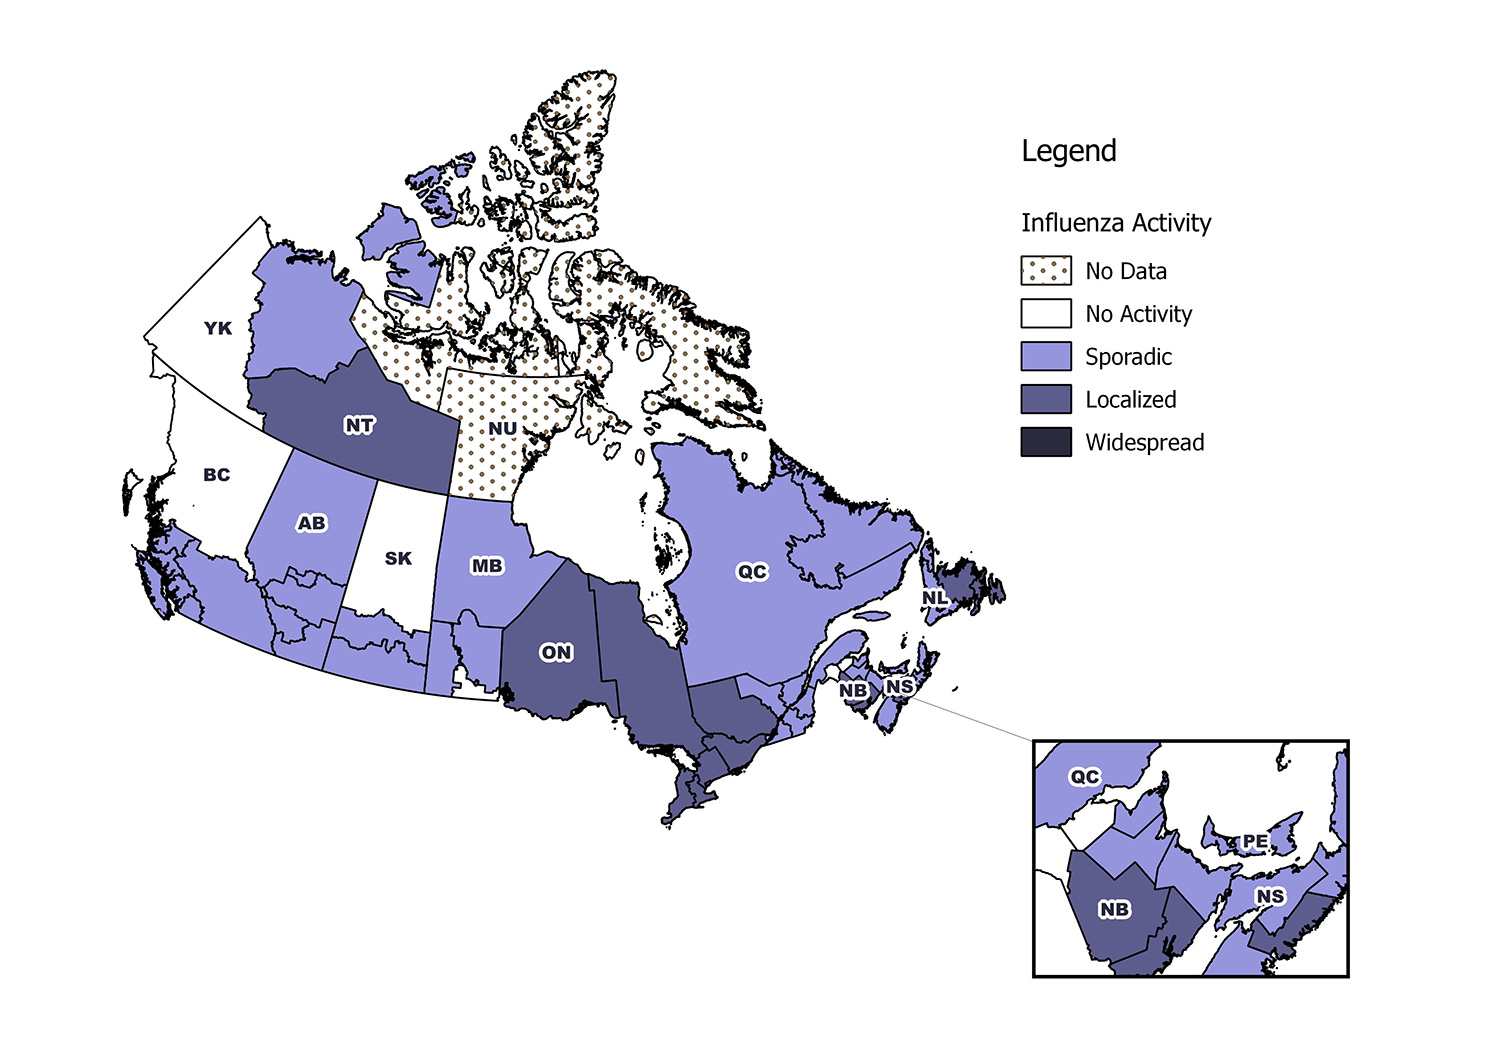
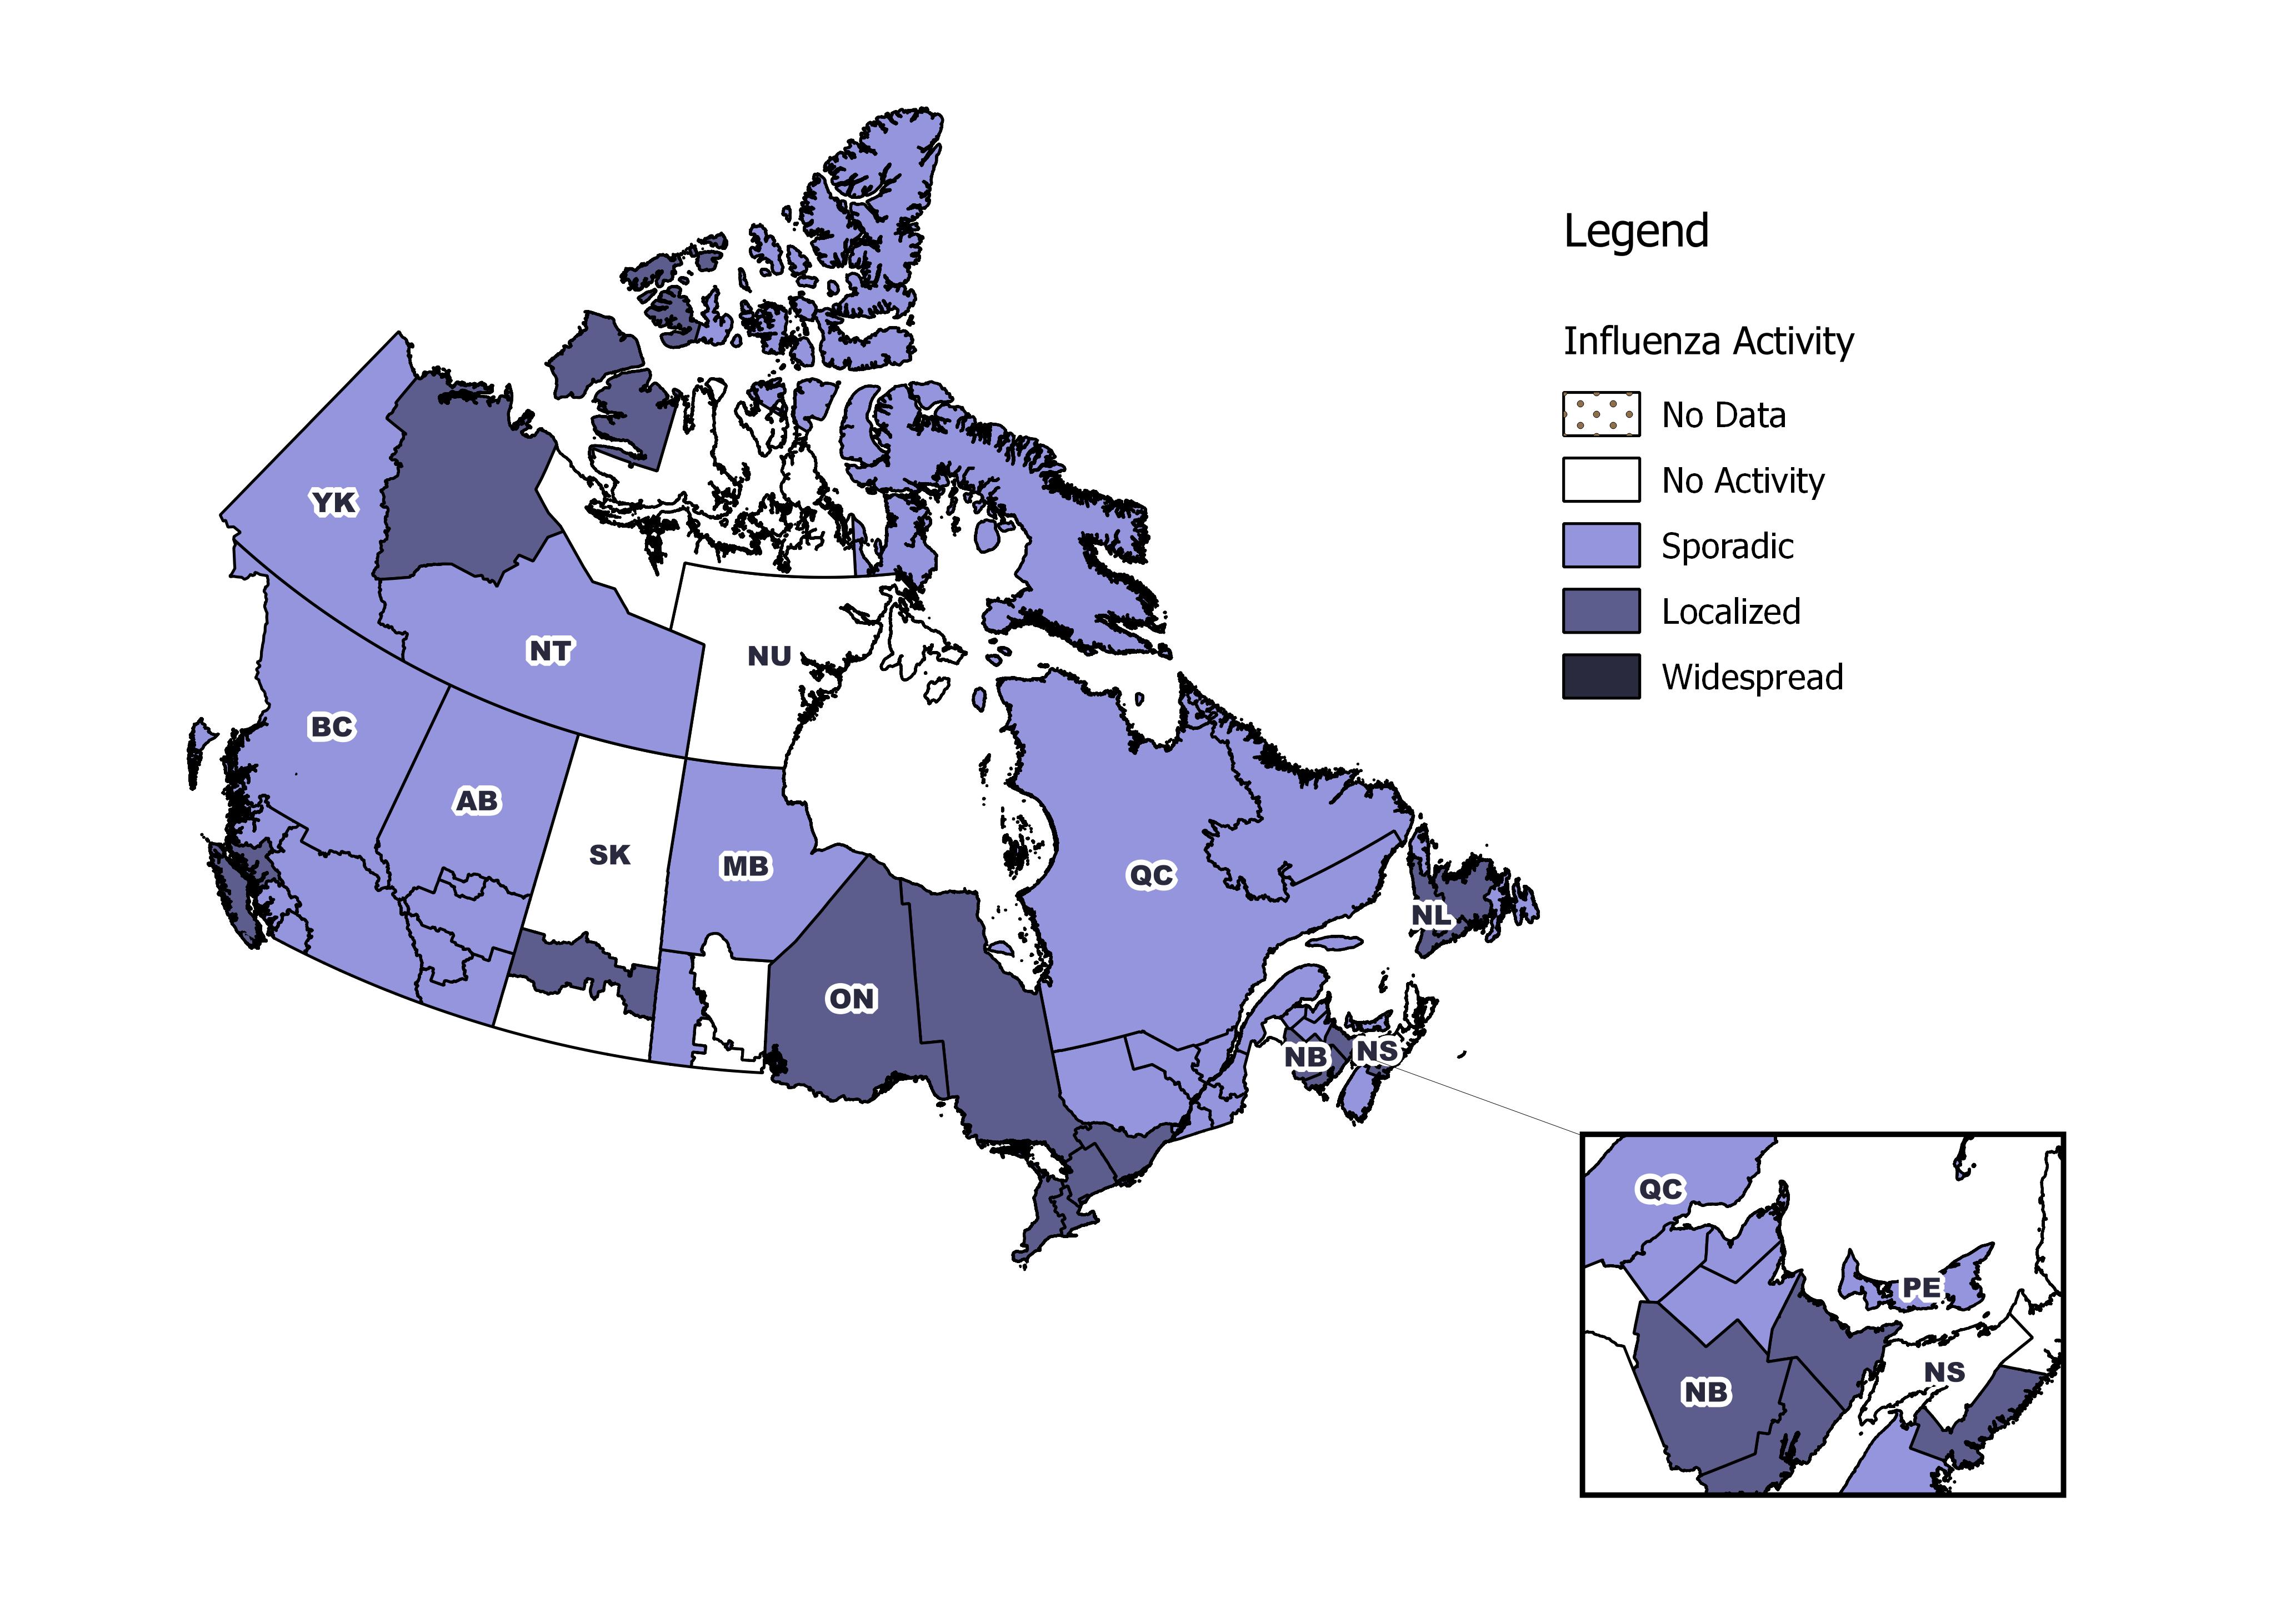
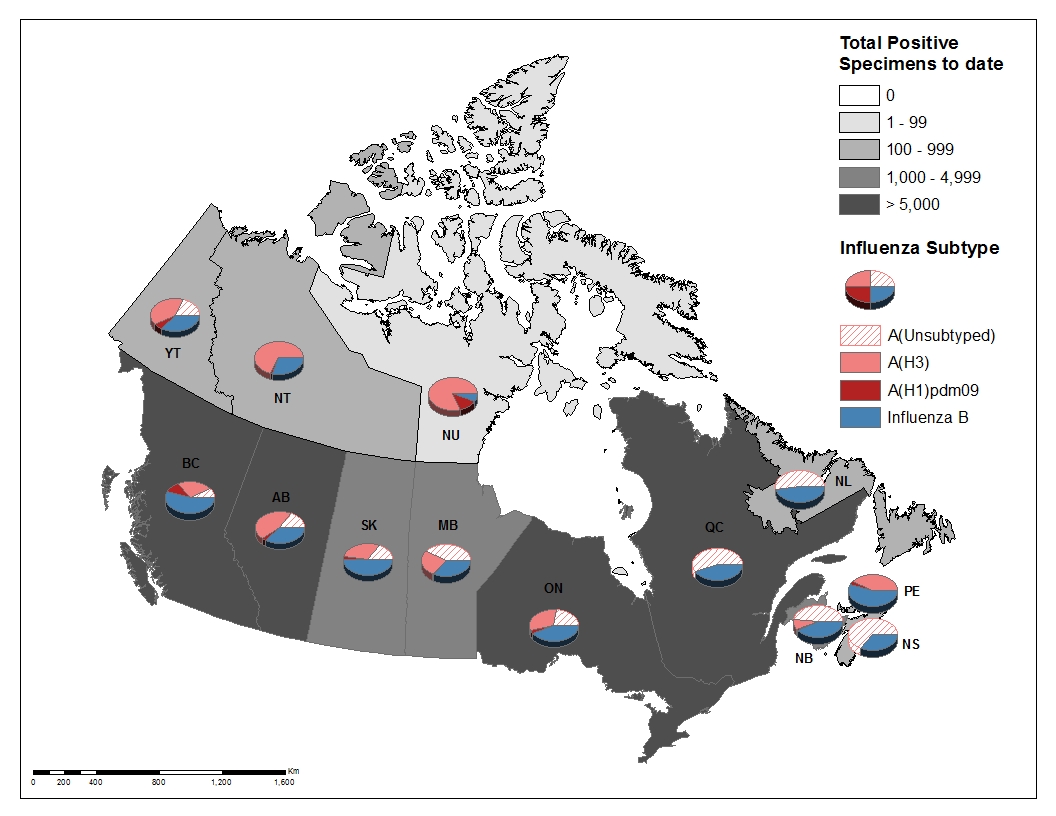
[h=2]Influenza/Influenza-like Illness Activity (geographic spread)[/h] In weeks 51 and 52, an increasing number of regions reported localized or widespread influenza activity. Among the 45 regions for which data was available in week 52, three regions (BC(1), QC(2)) reported widespread activity, and 22 regions (BC(2), SK(2), MB (4), ON(7), QC(2), NB(2), NS(2) and PE(1)) reported localized activity. Sporadic activity was reported across most of the country.


pub-eng.jpg

Download the alternative format
(PDF format, 867 KB, 10 pages)
Organization:
Public Health Agency of Canada
Date published: 2018-01-05

[h=5]Related Topics[/h]


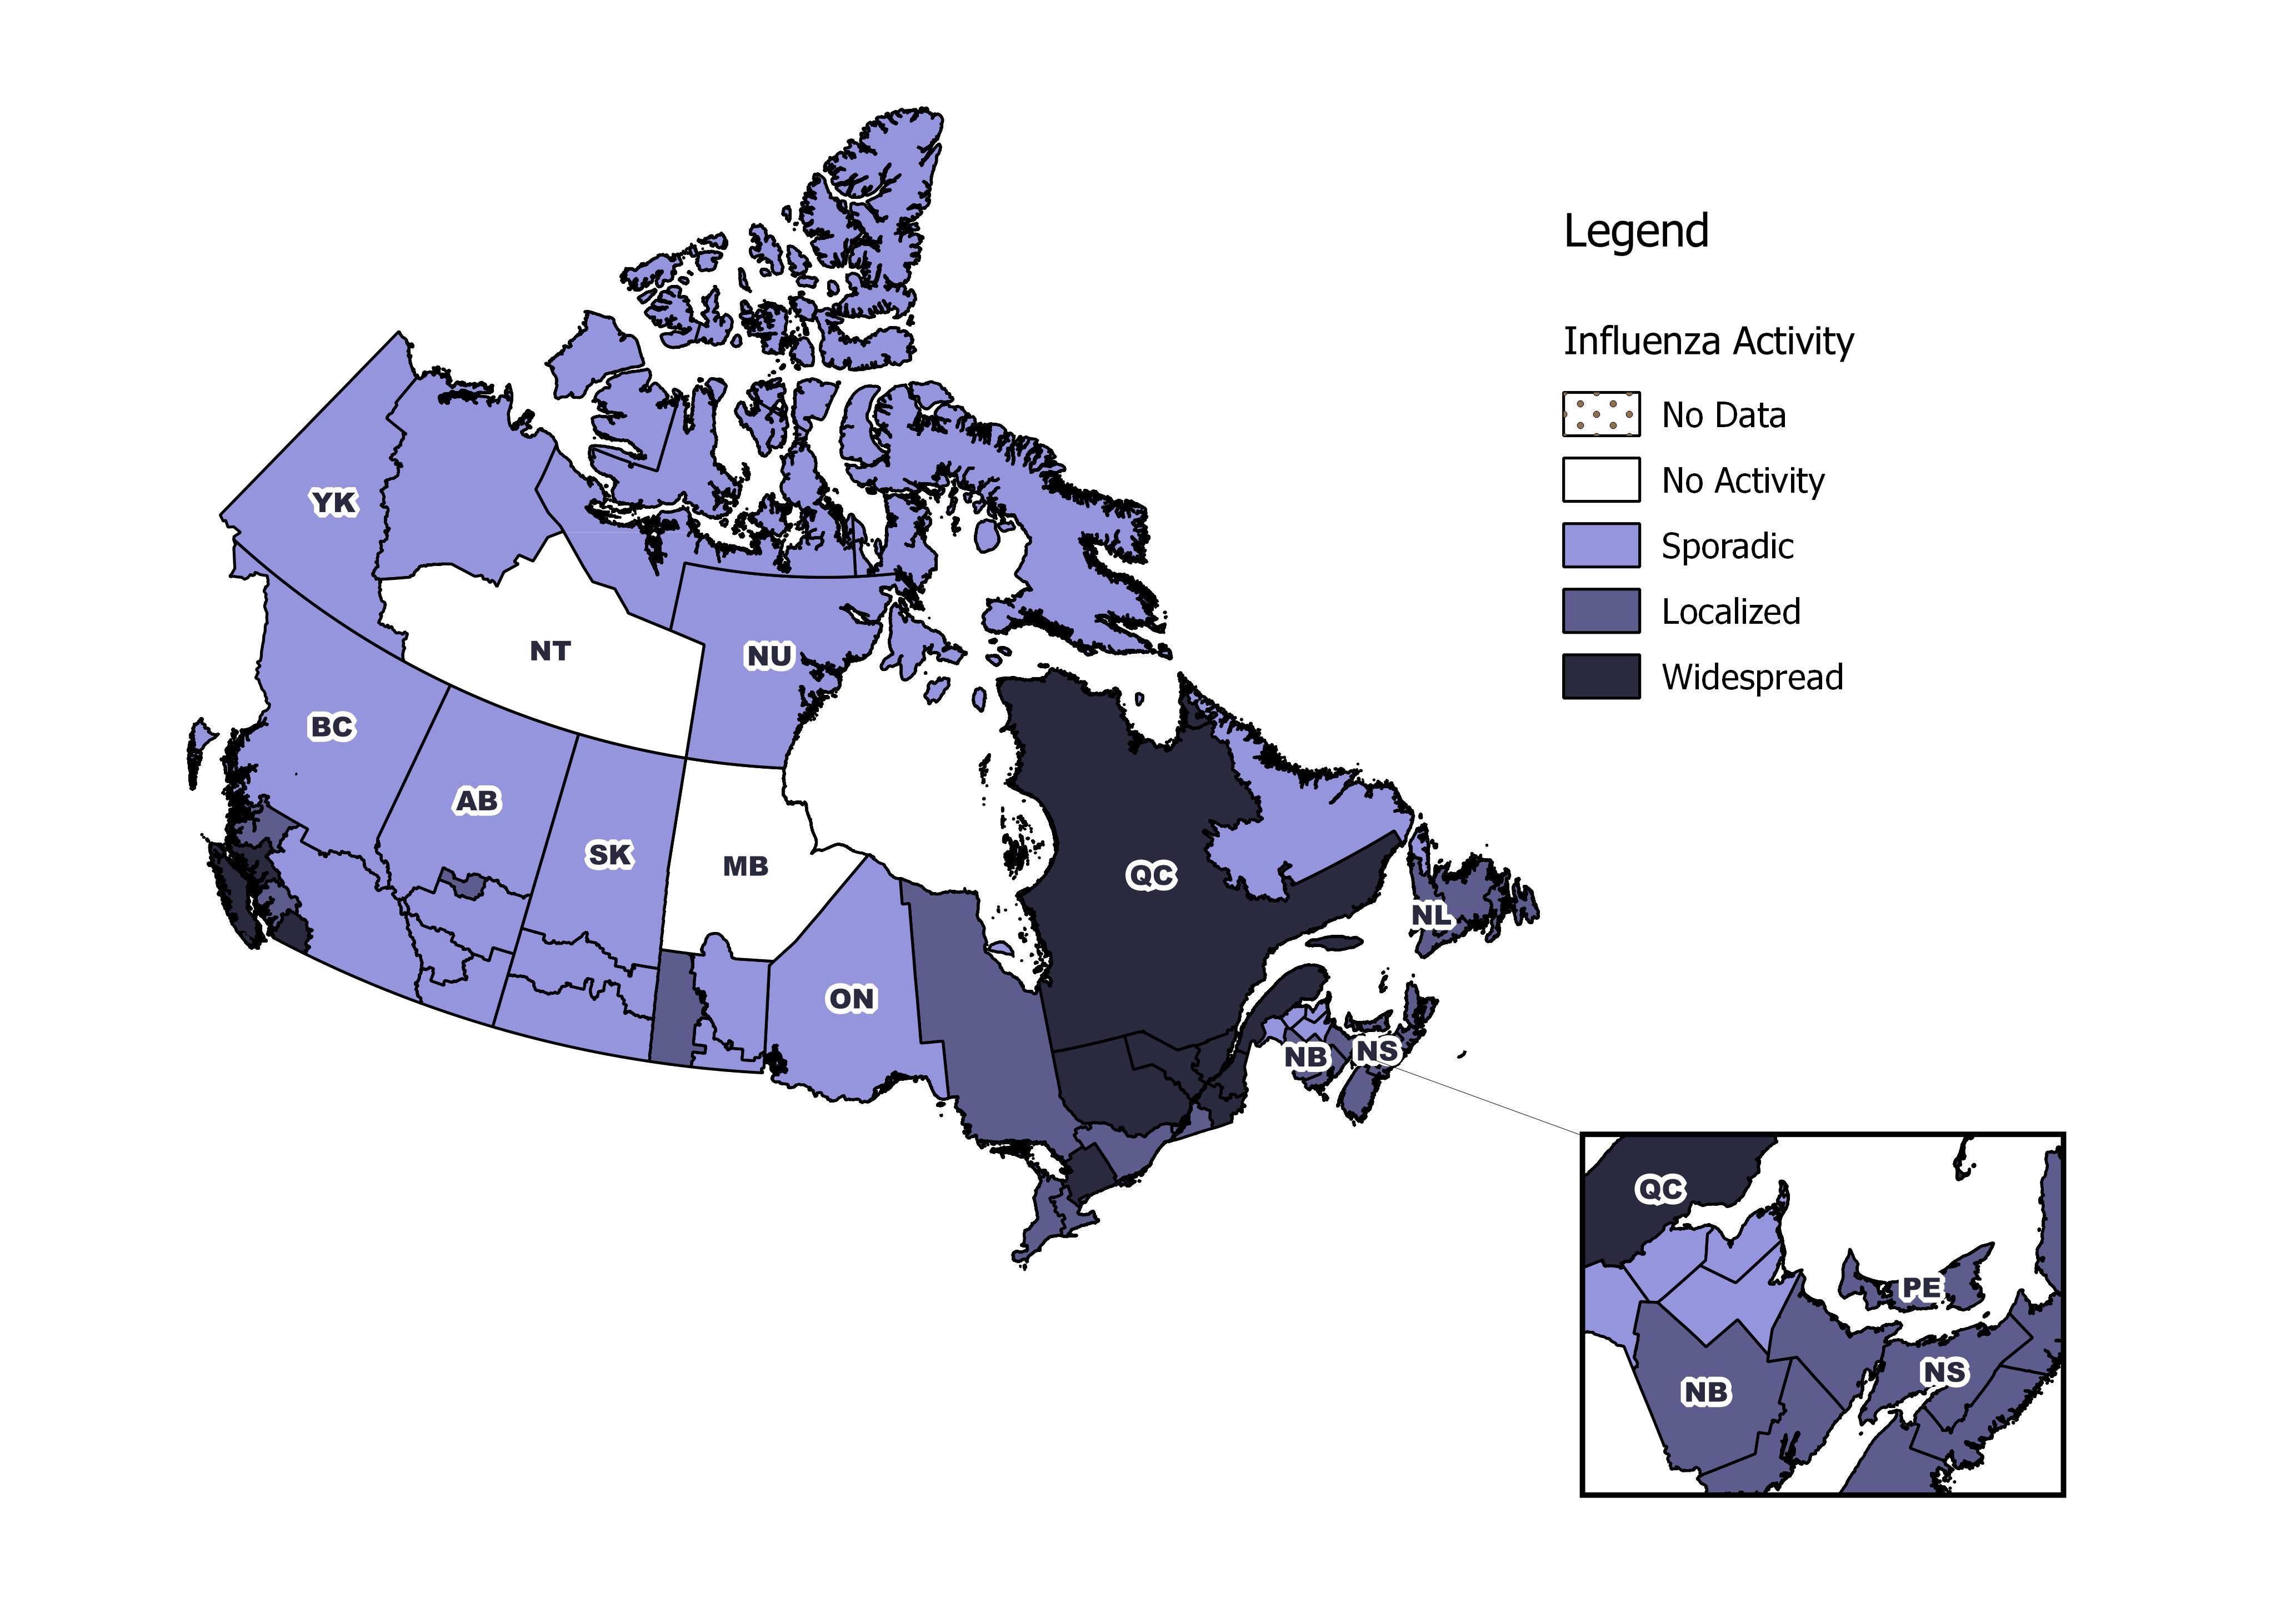
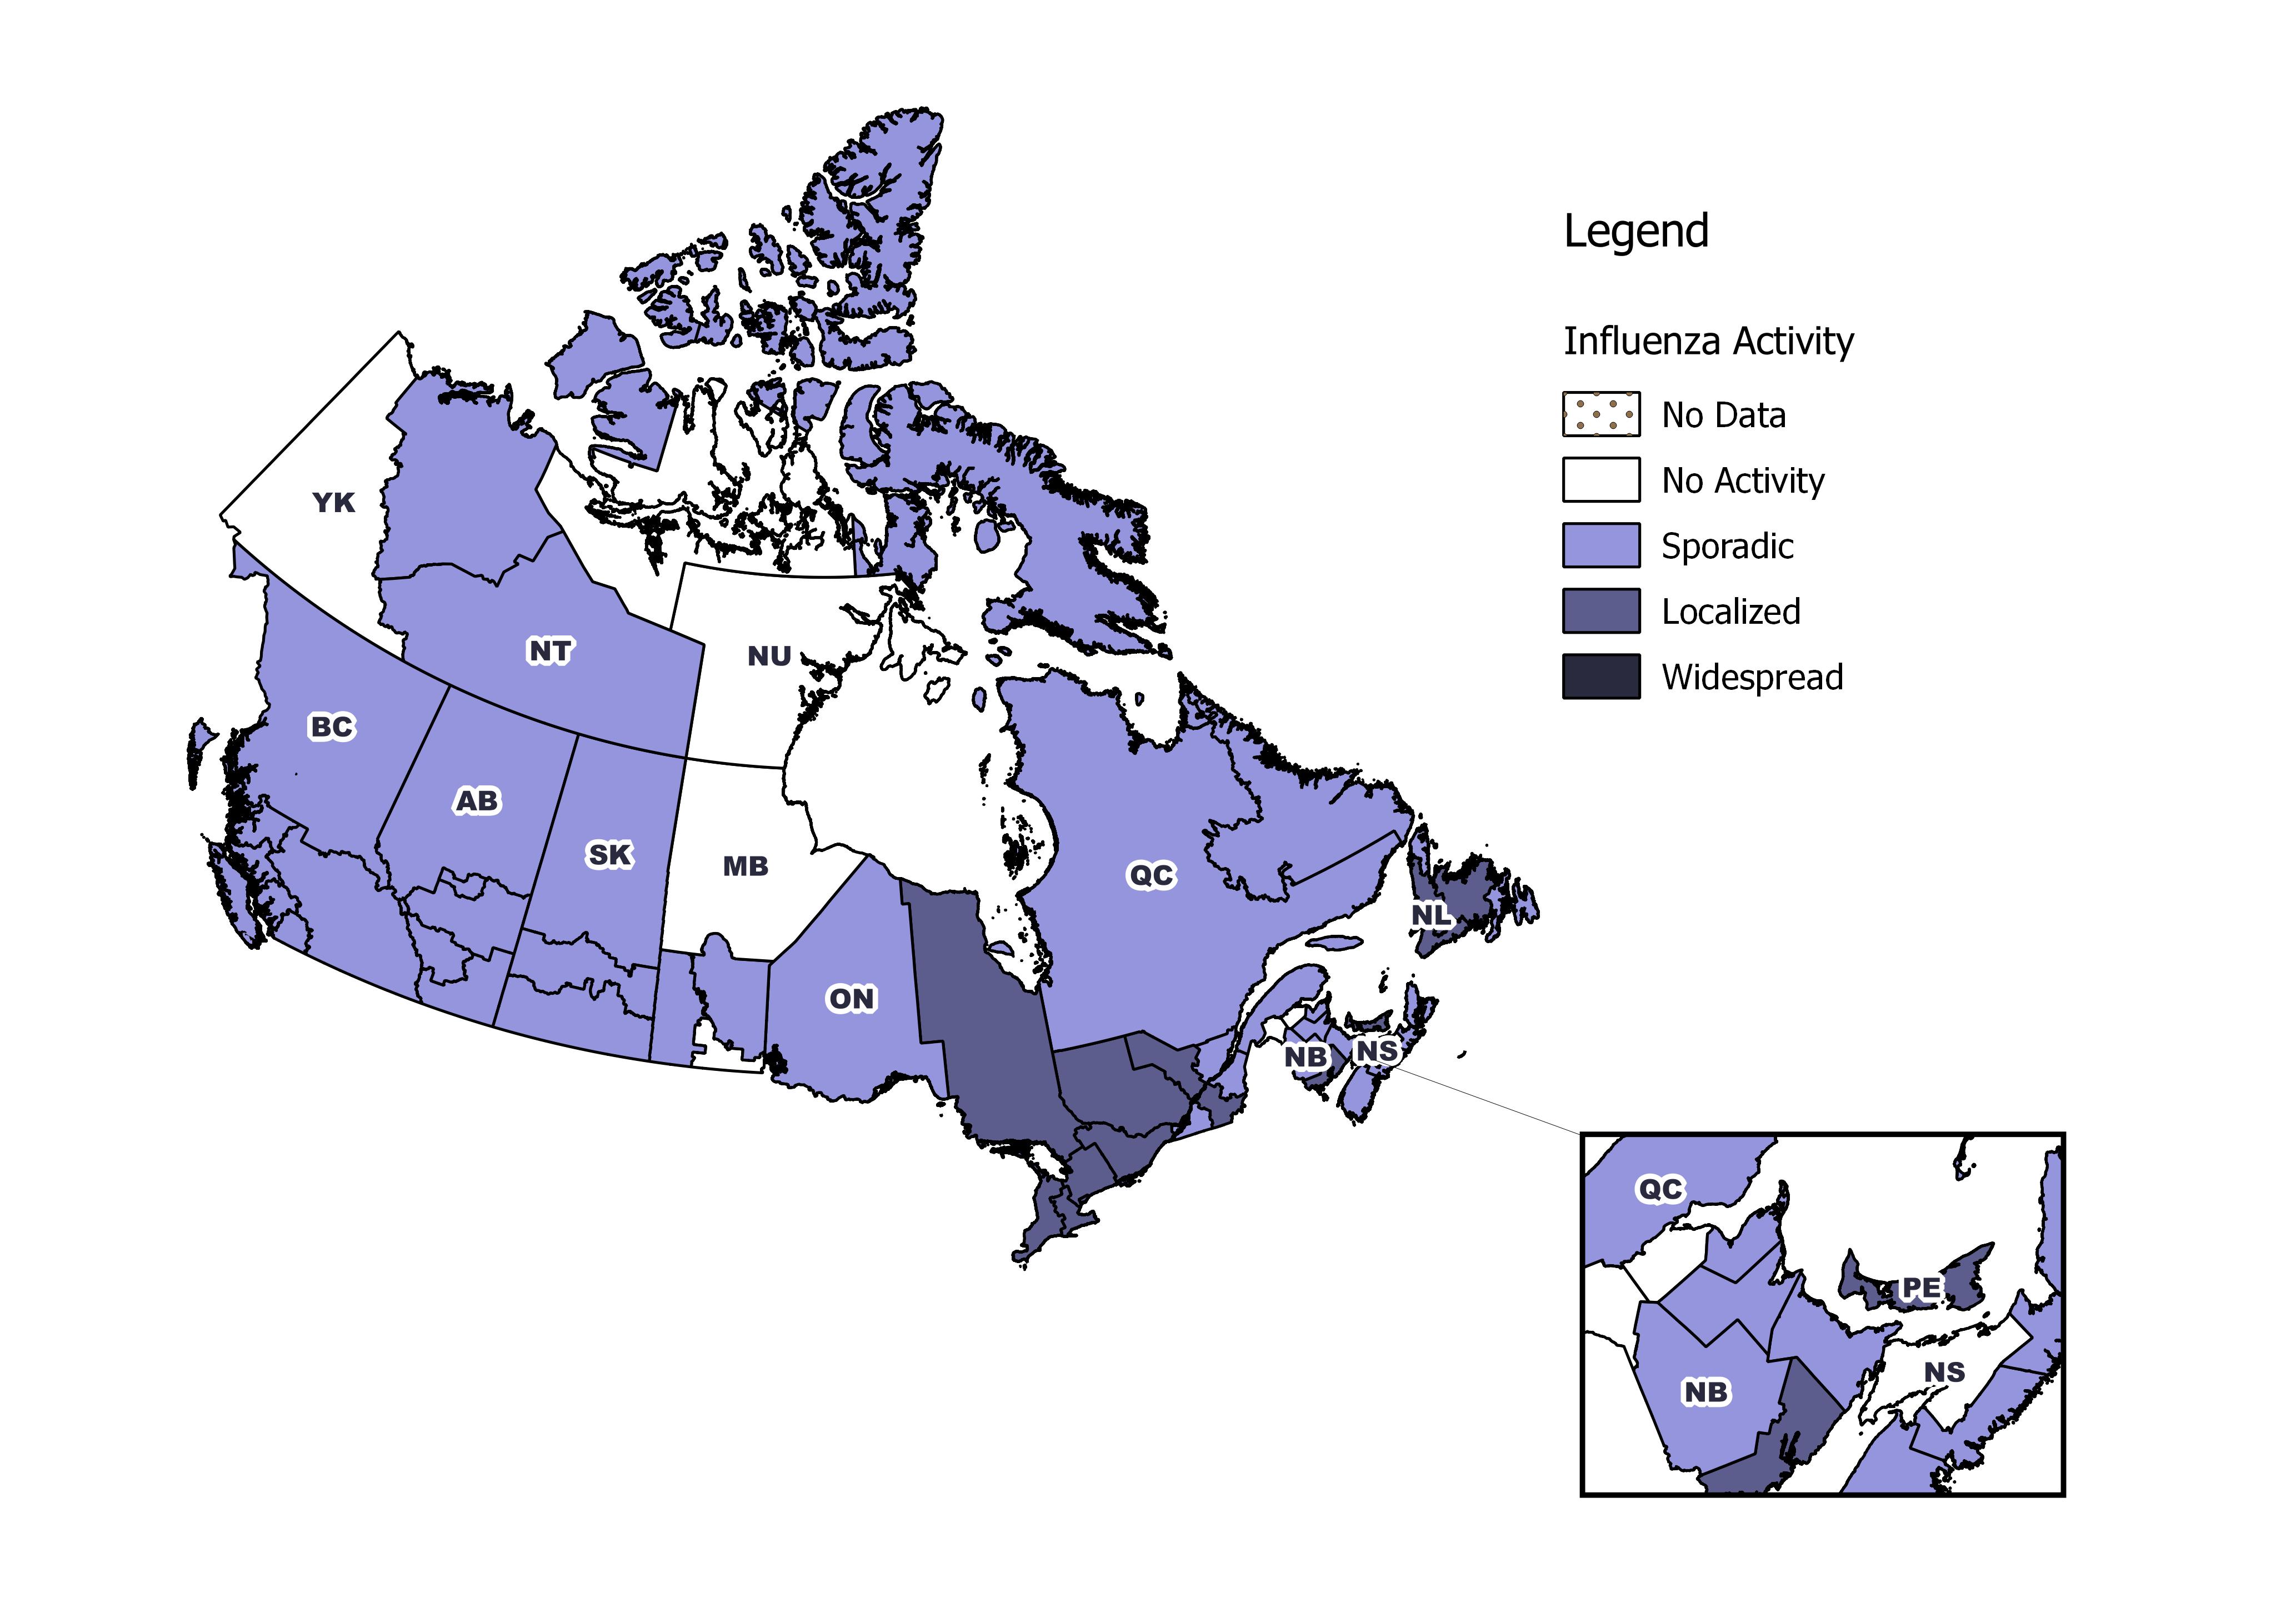
[h=3]Figure 1 - Map of overall influenza/ILI activity level by province and territory, Canada, week 2017-52[/h]
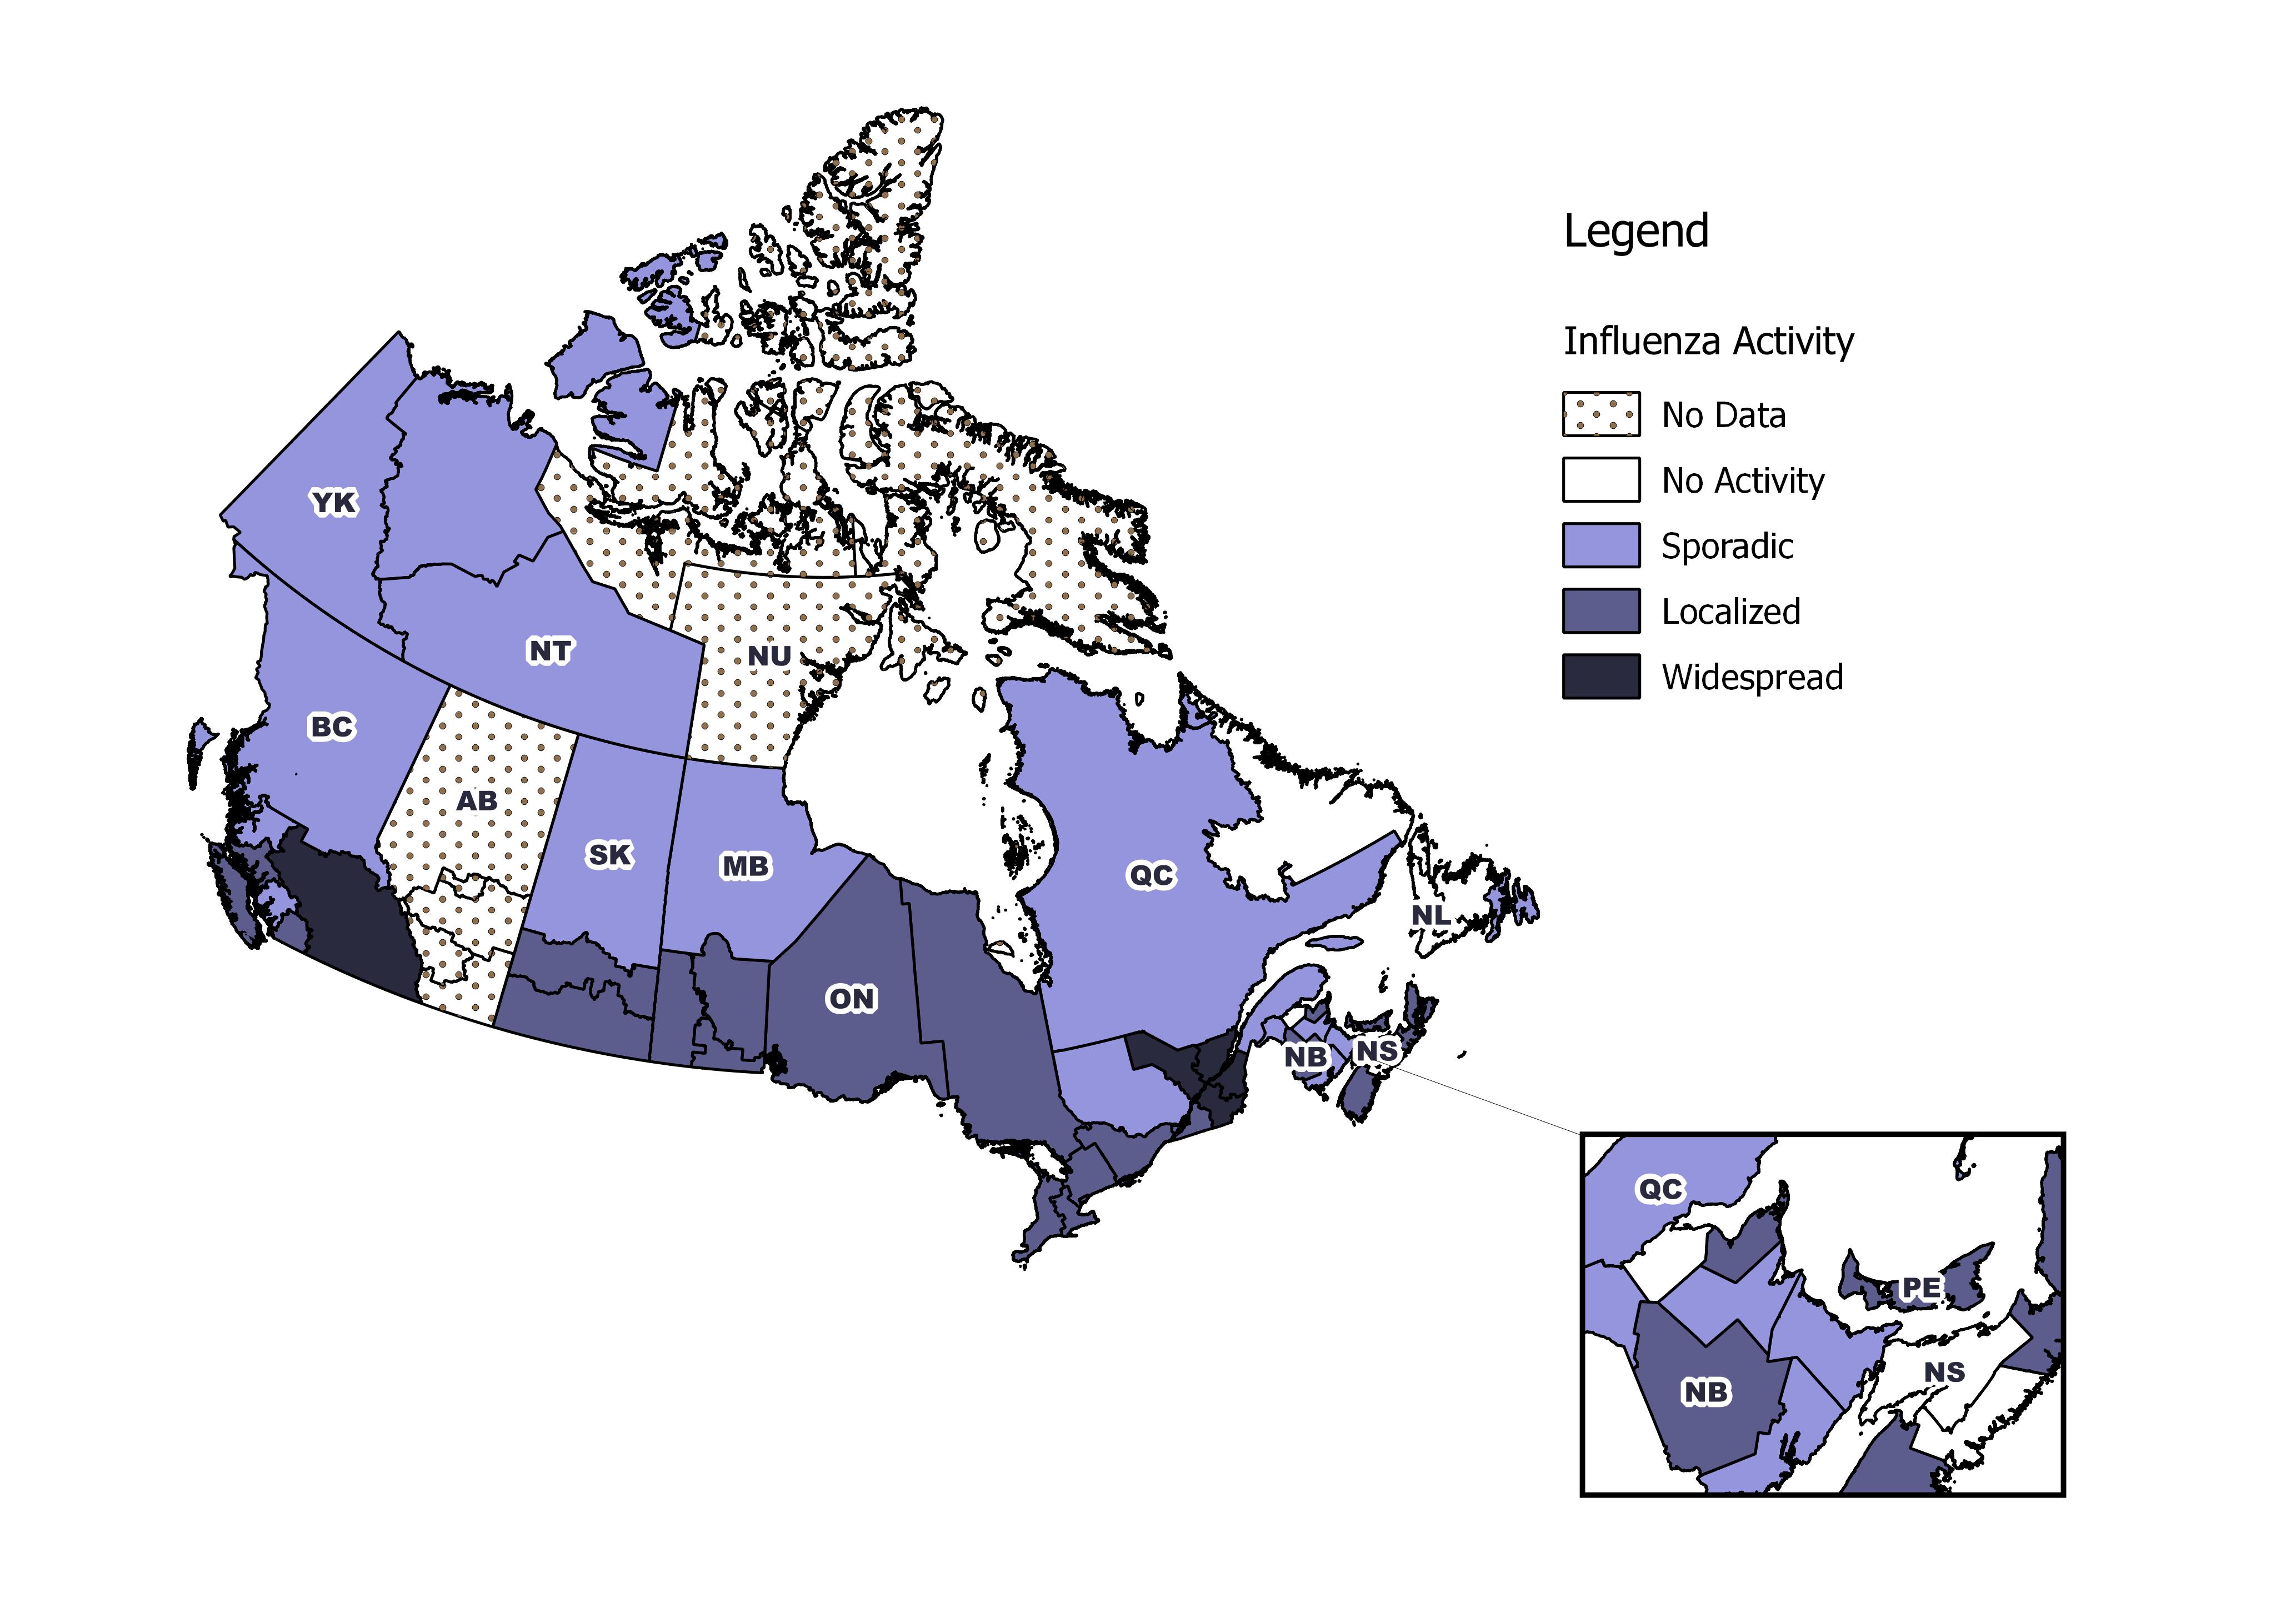
fig1-eng.jpg
Note: Influenza/ILI activity levels, as represented on this map, are assigned and reported by Provincial and Territorial Ministries of Health, based on laboratory confirmations, sentinel ILI rates and reported outbreaks. Please refer to detailed definitions at the end of the report. Maps from previous weeks, including any retrospective updates, are available in the mapping feature found in the Weekly Influenza Reports.
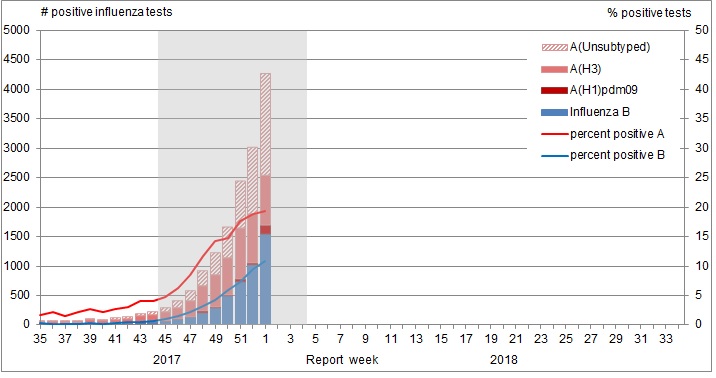
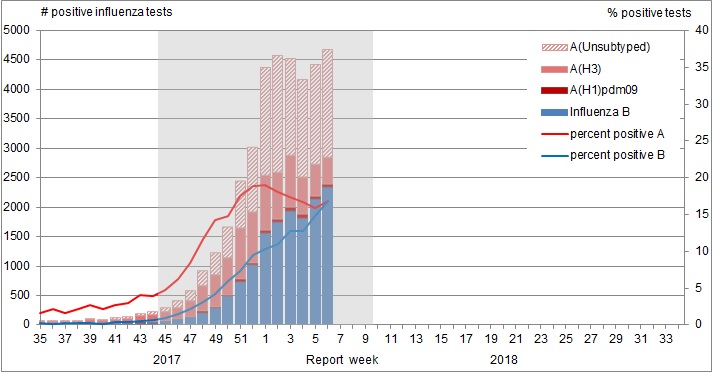
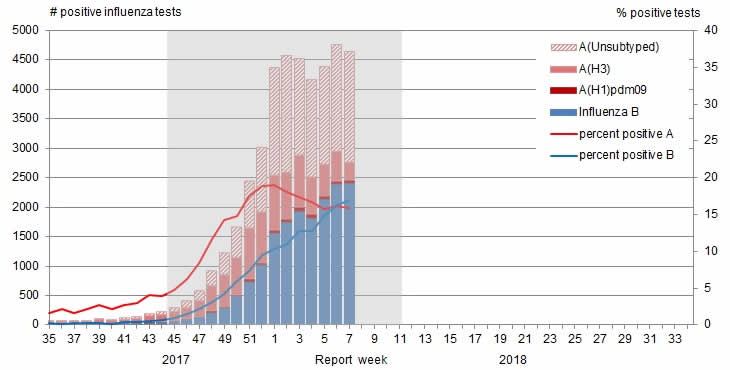
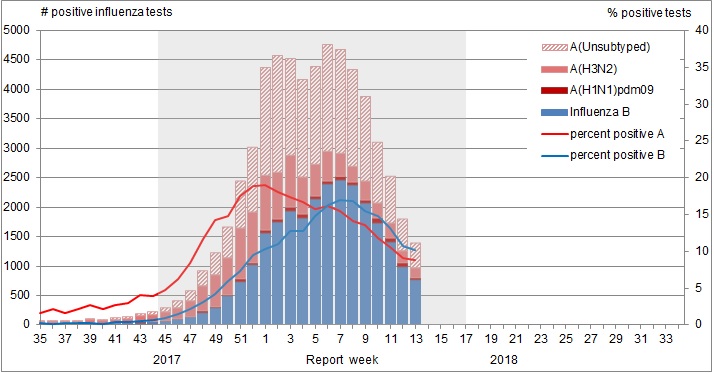
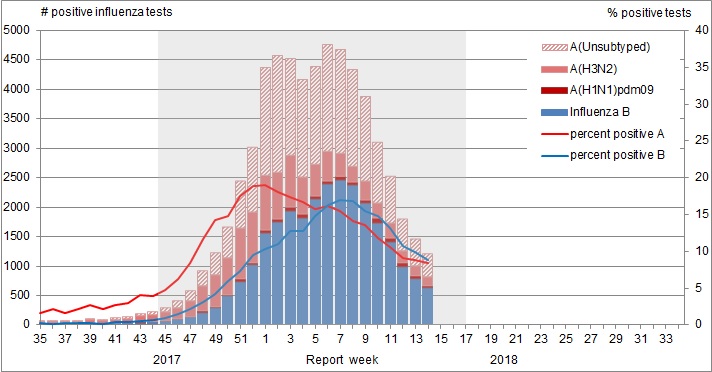
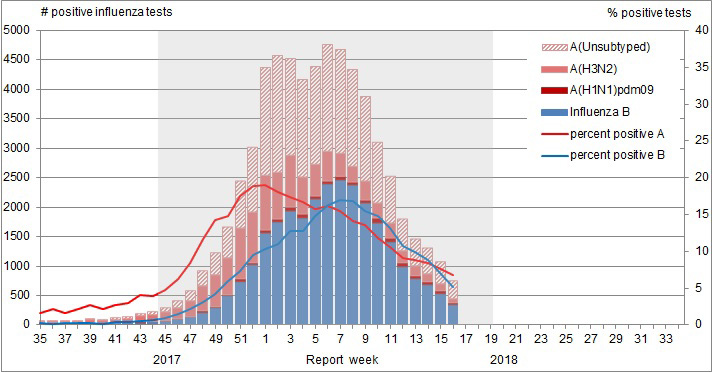
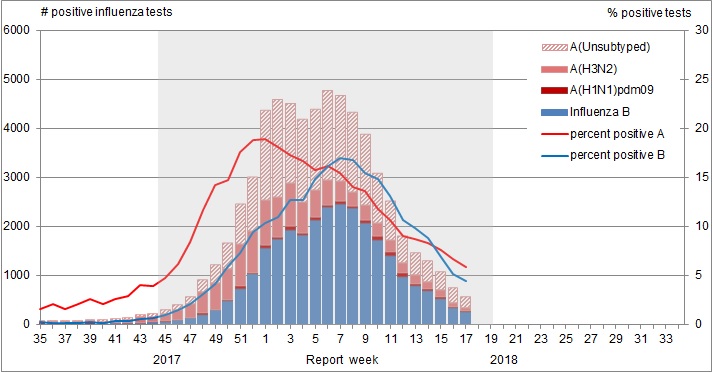
Figure 1 - Text Description [h=2]Laboratory-Confirmed Influenza Detections[/h] In weeks 51 and 52, both influenza A and B detections continued to increase. The proportion of tests positive for influenza increased to 25% in week 51 and 28% in week 52. The proportion of influenza detections that are influenza B has been increasing steadily since week 42. In week 52, 66% of detections were influenza A and 34% influenza B.
The number (1,968) and percentage (18.7%) of influenza A detections for week 52 are close to the seasonal average for this time of year. The number (994) and percentage of tests (9.4%) positive for influenza B in week 52 are well above expected levels. Influenza B is circulating much earlier than usual this season. Current levels of tests positive for influenza B are not typically seen until March. More than 15 times the number of influenza B detections have been reported this season compared to the same period during the past seven seasons. For data on other respiratory virus detections, see the Respiratory Virus Detections in Canada Report.
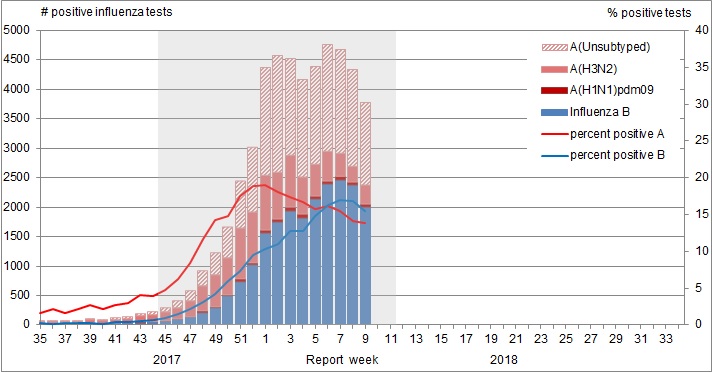
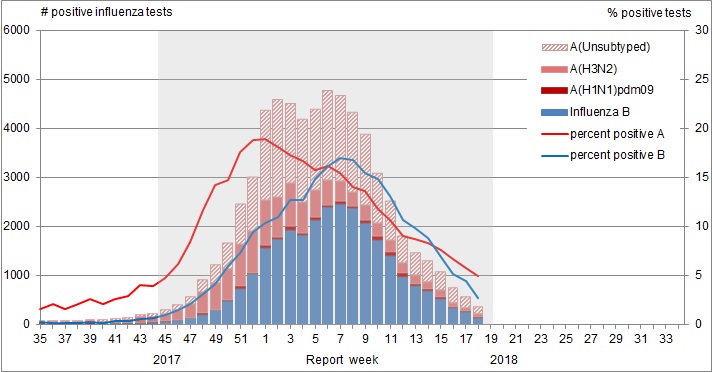
[h=3]Figure 2 - Number of positive influenza tests and percentage of tests positive, by type, subtype and report week, Canada, weeks 2017-35 to 2017-52[/h]
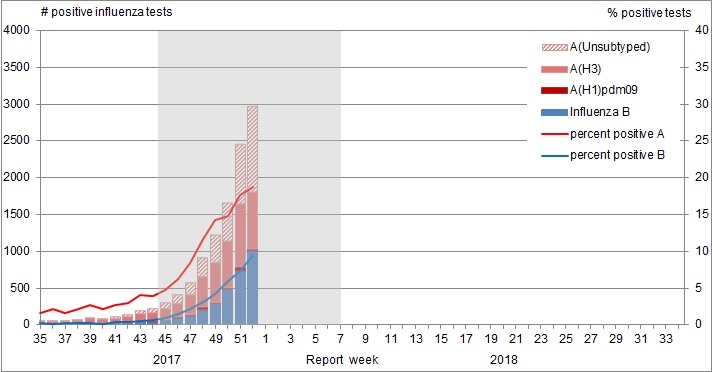
fig2-eng.jpg
The shaded area indicates weeks where the positivity rate was at least 5% and a minimum of 15 positive tests were observed, signalling the period of seasonal influenza activity.
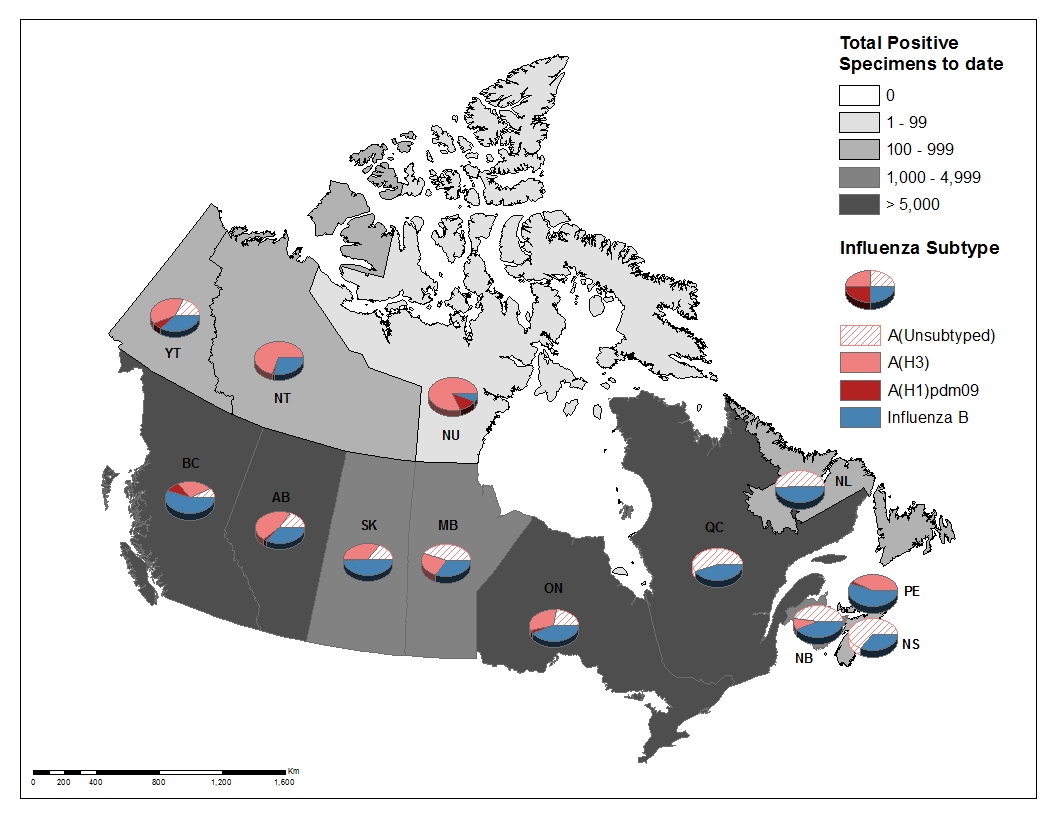
Figure 2 - Text Description To date this season, 11,275 laboratory-confirmed influenza detections have been reported, of which 74% have been influenza A. Influenza A(H3N2) has been the most common subtype detected this season, representing 95% of subtyped influenza A detections. For more detailed weekly and cumulative influenza data, see the text descriptions for Figures 2 and 3 or the Respiratory Virus Detections in Canada Report.
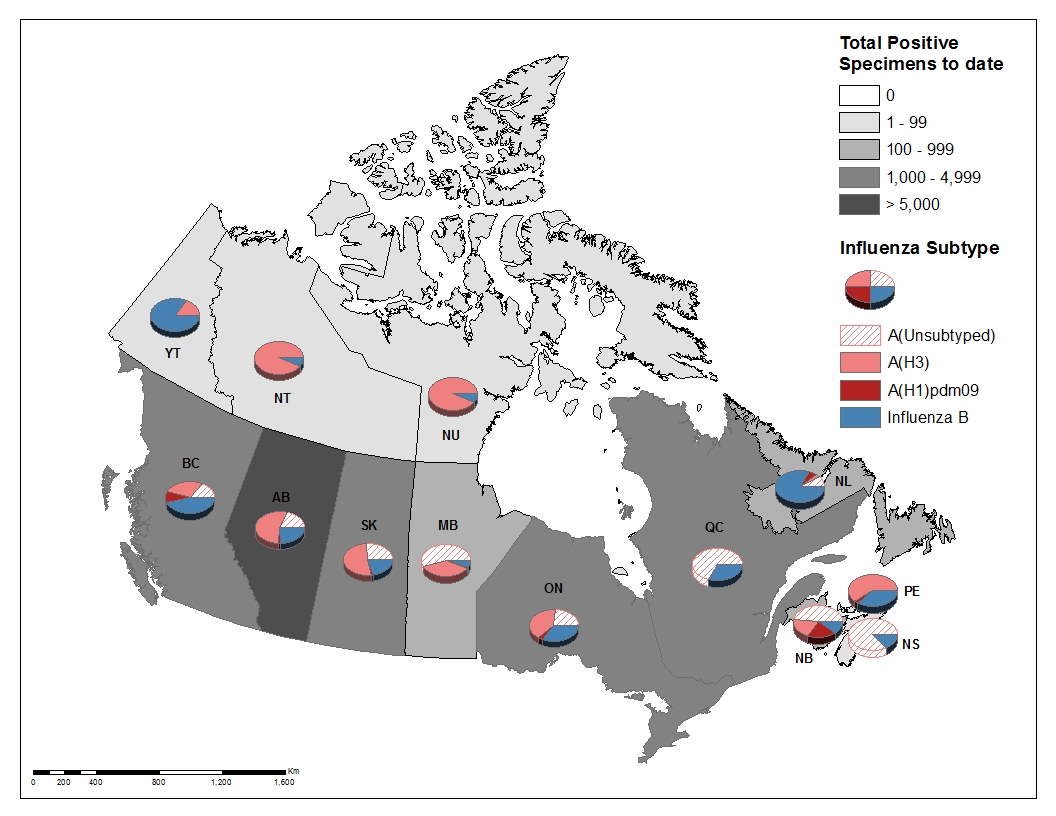
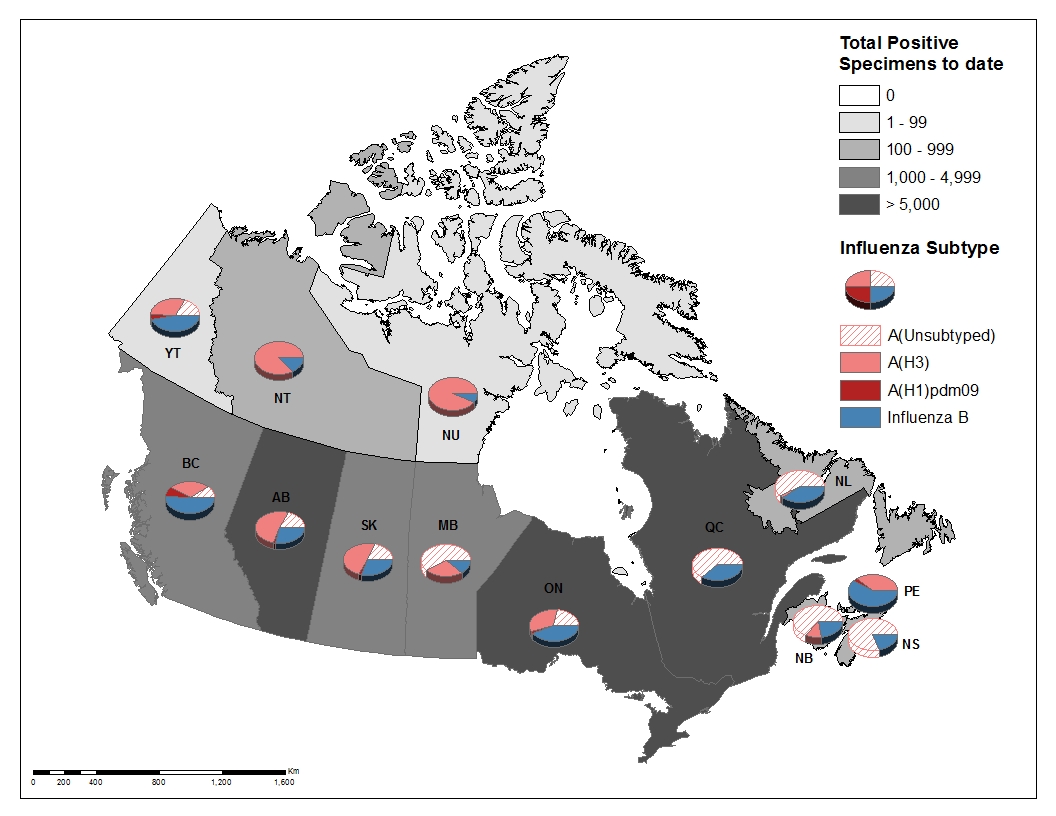
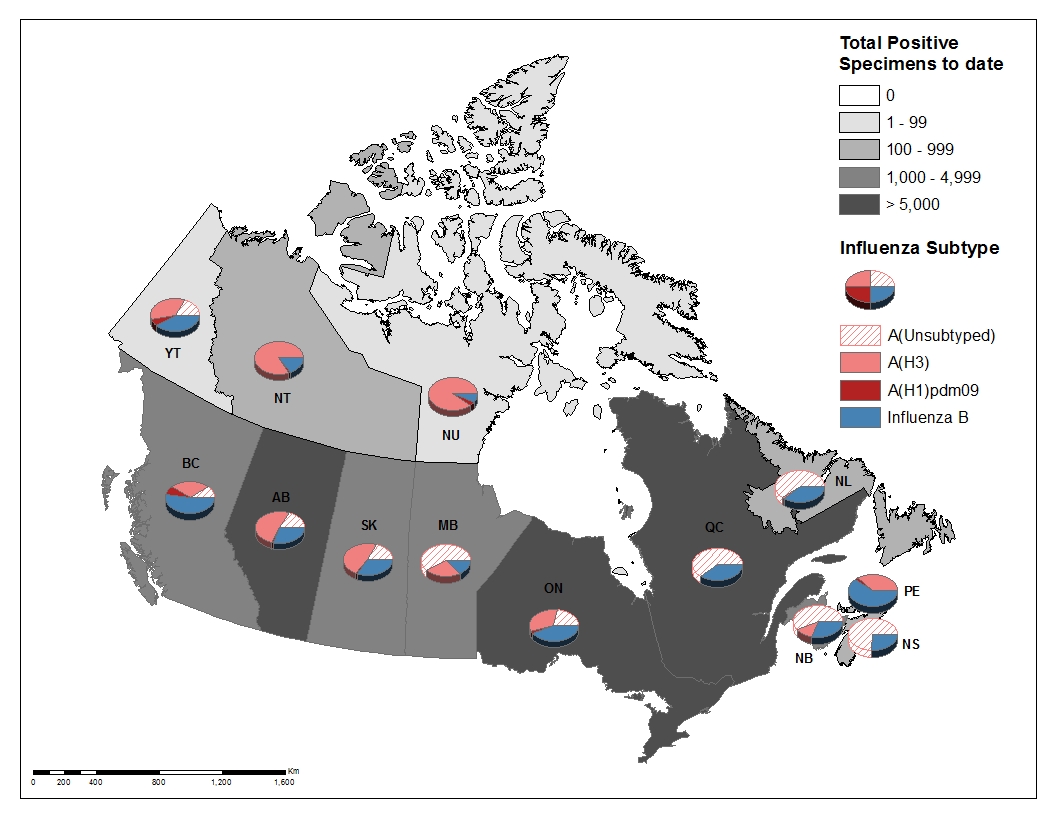
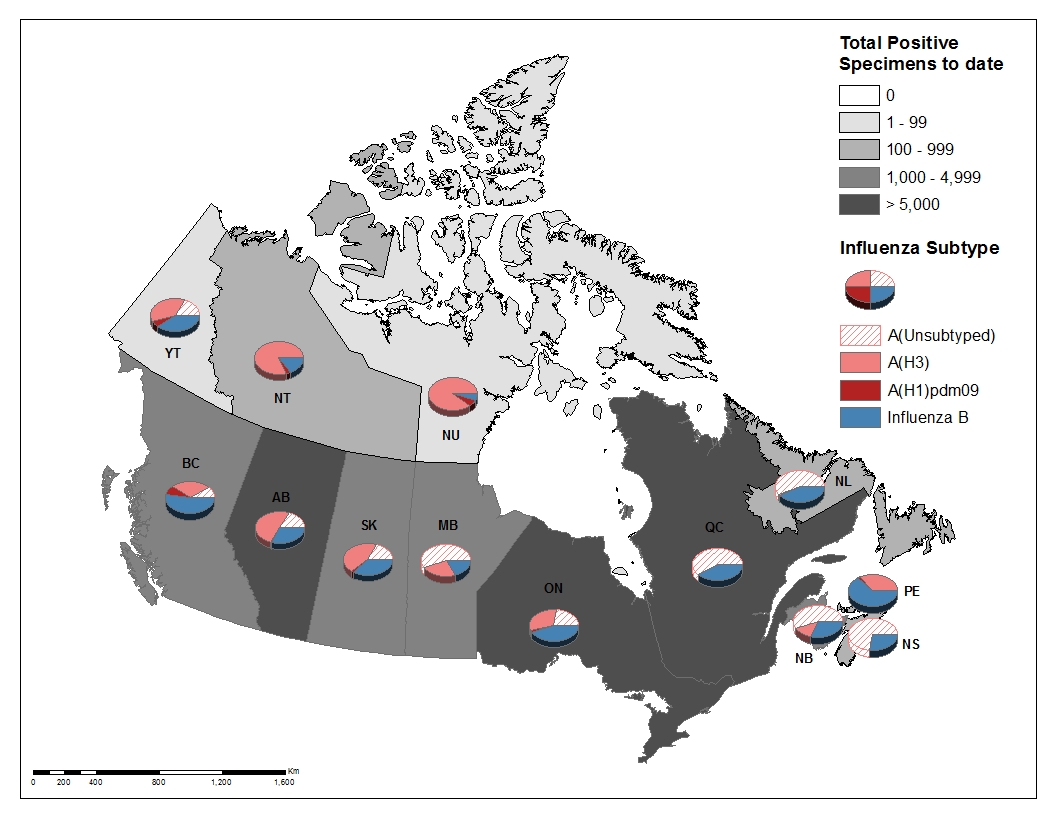
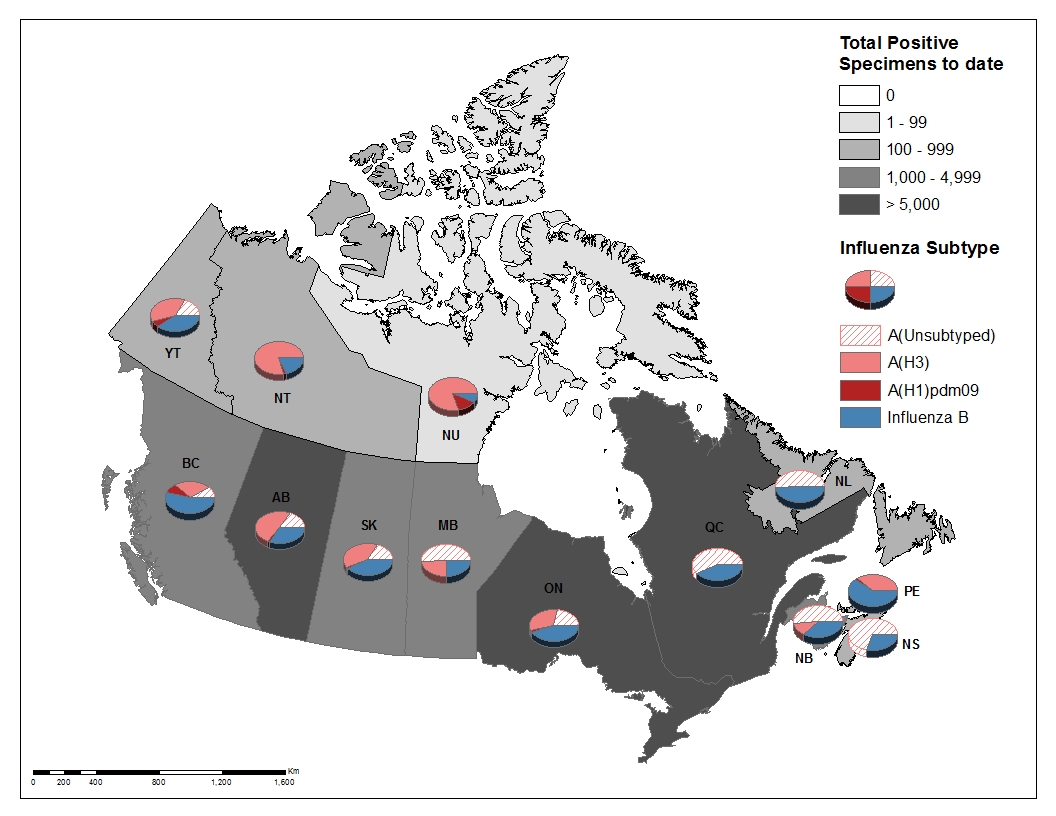
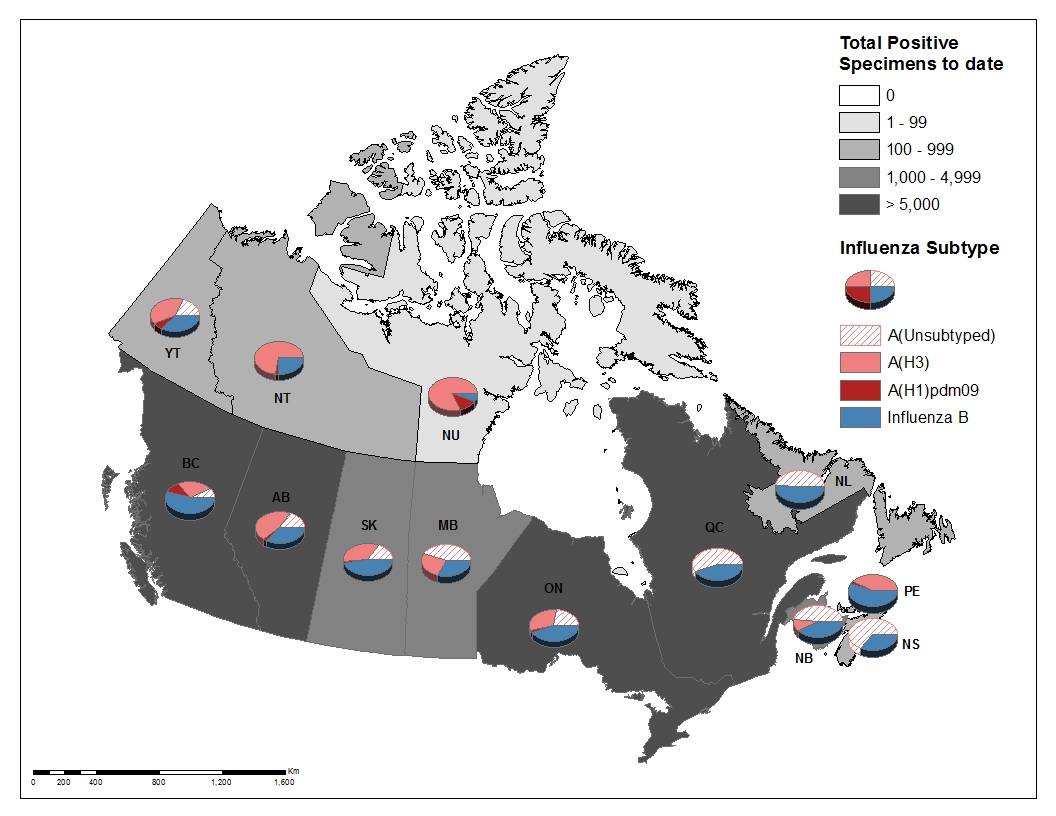
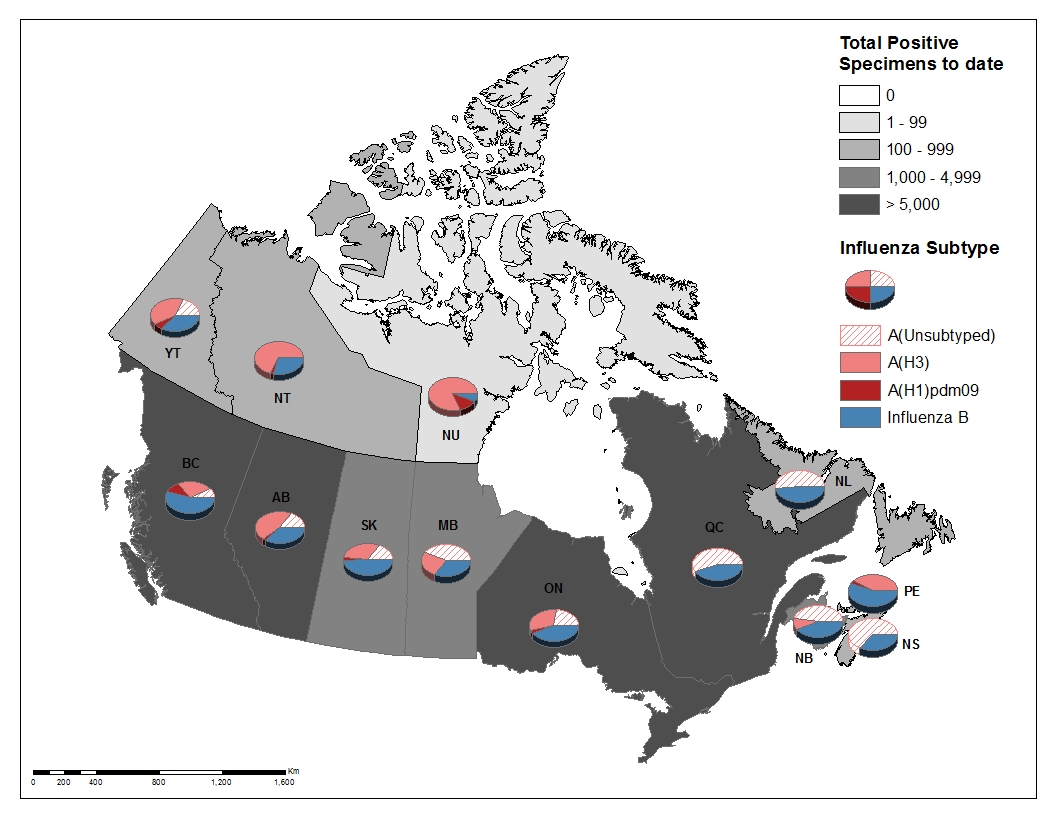
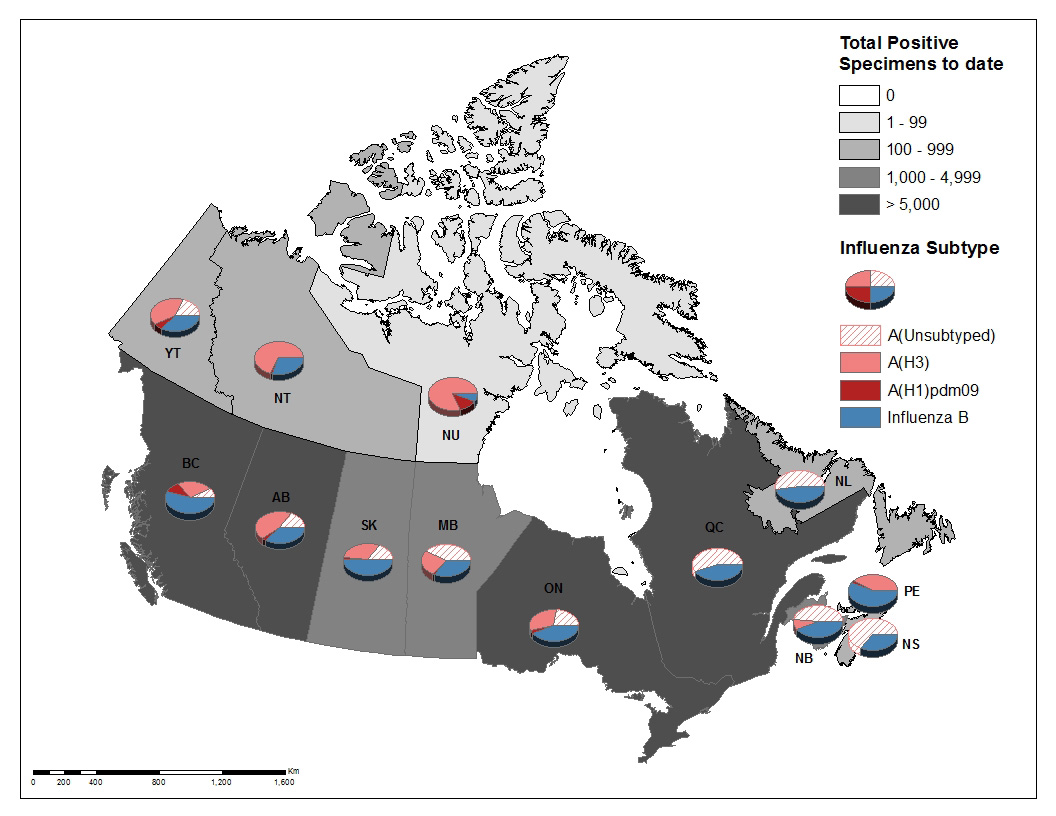
[h=3]Figure 3 - Cumulative numbers of positive influenza specimens by type/subtype and province/territory, Canada, weeks 2017-35 to 2017-52[/h]
fig3-eng.jpg
Figure 3 - Text Description To date this season, detailed information on age and type/subtype has been received for 10,336 laboratory-confirmed influenza cases (Table 1). Among all influenza cases with reported age and type/subtype information, 44% have been reported in adults 65 years of age and older. Among cases of influenza A(H3N2), adults 65 years of age and older represented 51% of cases, compared to 39% and 54% of cases reported in the same period in the 2016-17 and 2014-15 season, respectively. Cases of influenza B this season were distributed more evenly across all age-groups, with 36% of cases in adults 65 years of age and older, 23% of cases in adults 45-64 years of age, and 23% in children and adults under 20 years of age.
[TABLE="class: table table-striped table-bordered table-hover table-condensed, width: 1140"]
Table 1 - Cumulative numbers of positive influenza specimens by type, subtype and age-group reported through case-based laboratory reporting, Canada, weeks 2017-35 to 2017-52 [TR="class: bg-primary, bgcolor: #2572B4"]
Age groups (years) Cumulative (August 27, 2017 to December 30, 2017) [/TR]
[TR="class: bg-primary, bgcolor: #2572B4"]
Influenza A B Influenza A and B [/TR]
[TR="class: bg-primary, bgcolor: #2572B4"]
A Total A(H1) pdm09 A(H3) A (UnS)Table 1 Footnote1 Total # % [/TR]
[TR="bgcolor: #F5F5F5"]
0-4 [TD]629[/TD]
[TD]40[/TD]
[TD]325[/TD]
[TD]264[/TD]
[TD]140[/TD]
[TD]769[/TD]
[TD]7%[/TD]
[/TR]
[TR]
5-19 [TD]764[/TD]
[TD]38[/TD]
[TD]387[/TD]
[TD]339[/TD]
[TD]462[/TD]
[TD]1226[/TD]
[TD]12%[/TD]
[/TR]
[TR="bgcolor: #F5F5F5"]
20-44 [TD]1363[/TD]
[TD]55[/TD]
[TD]676[/TD]
[TD]632[/TD]
[TD]468[/TD]
[TD]1831[/TD]
[TD]18%[/TD]
[/TR]
[TR]
45-64 [TD]1351[/TD]
[TD]47[/TD]
[TD]682[/TD]
[TD]622[/TD]
[TD]610[/TD]
[TD]1961[/TD]
[TD]19%[/TD]
[/TR]
[TR="bgcolor: #F5F5F5"]
65+ [TD]3588[/TD]
[TD]17[/TD]
[TD]2165[/TD]
[TD]1406[/TD]
[TD]961[/TD]
[TD]4549[/TD]
[TD]44%[/TD]
[/TR]
[TR]
Total [TD]7695[/TD]
[TD]197[/TD]
[TD]4235[/TD]
[TD]3263[/TD]
[TD]2641[/TD]
[TD]10336[/TD]
[TD]100%[/TD]
[/TR]
[TR]
[TD="colspan: 8"] Table 1 Footnote 1 UnS: unsubtyped: The specimen was typed as influenza A, but no result for subtyping was available;
Return to table 1 footnote1referrer

[/TD]
[/TR]
[/TABLE]
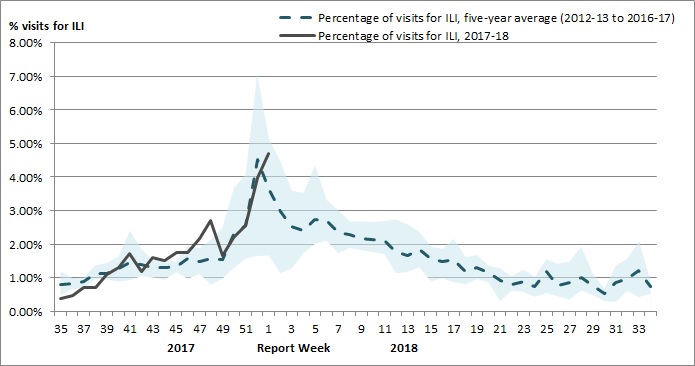
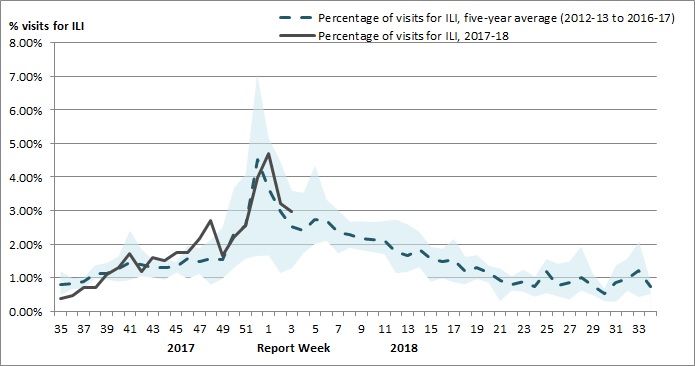
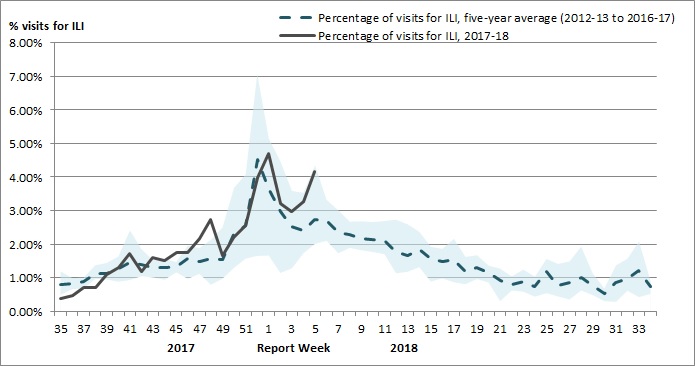
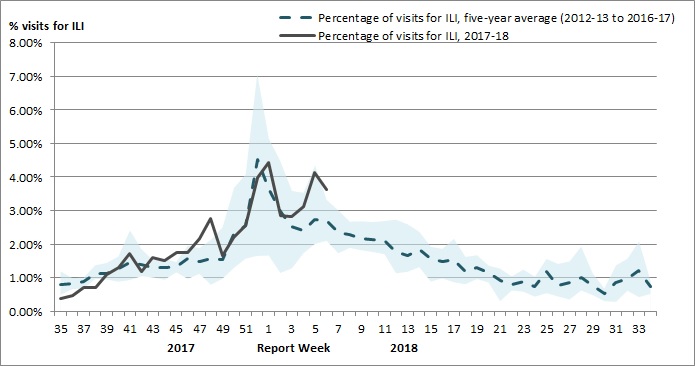
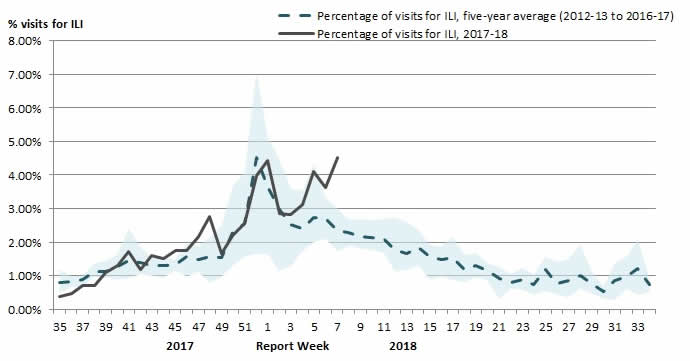
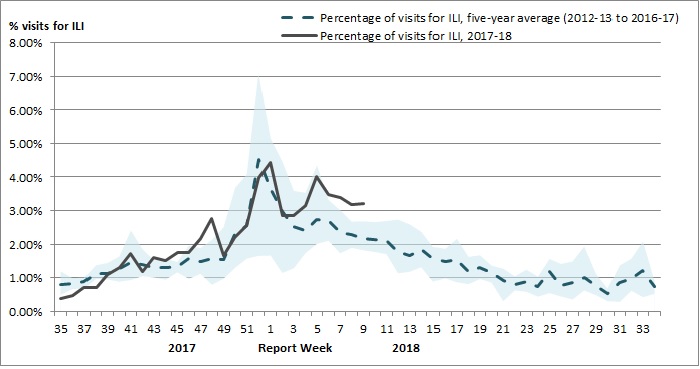
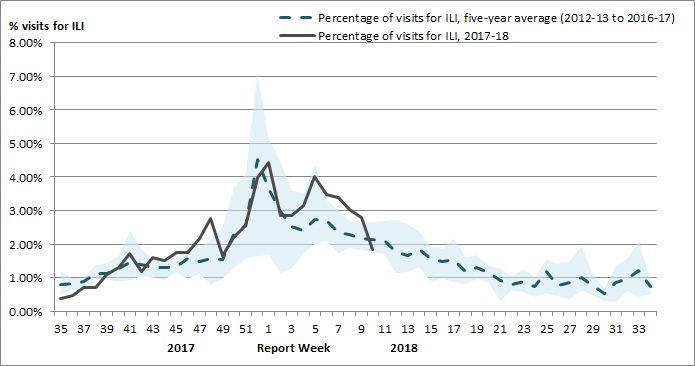
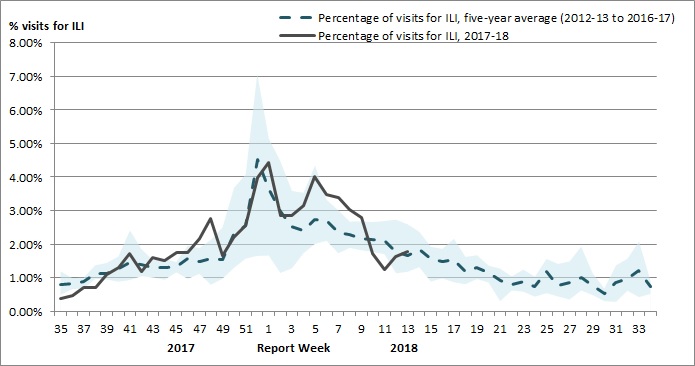
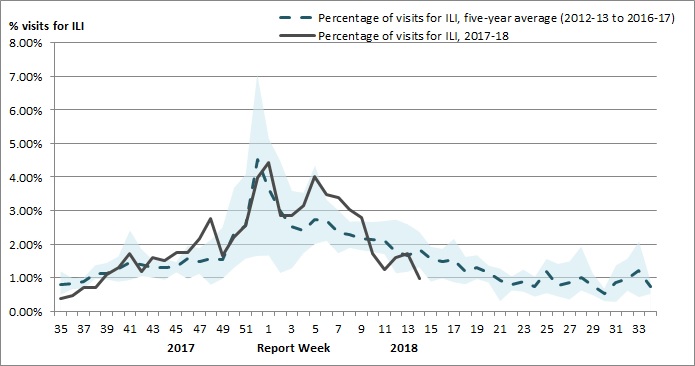
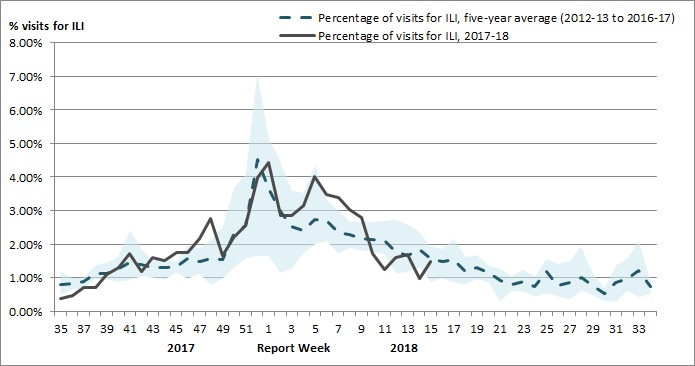
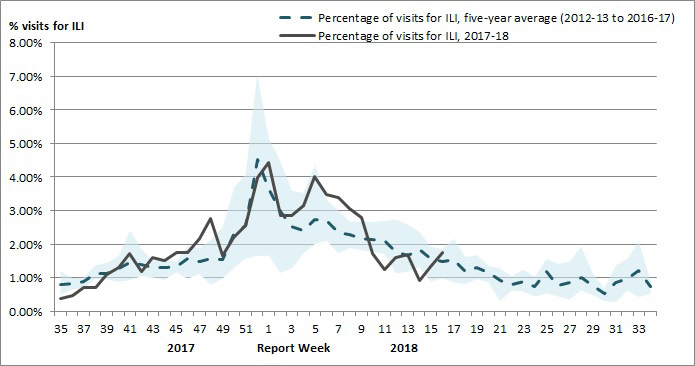
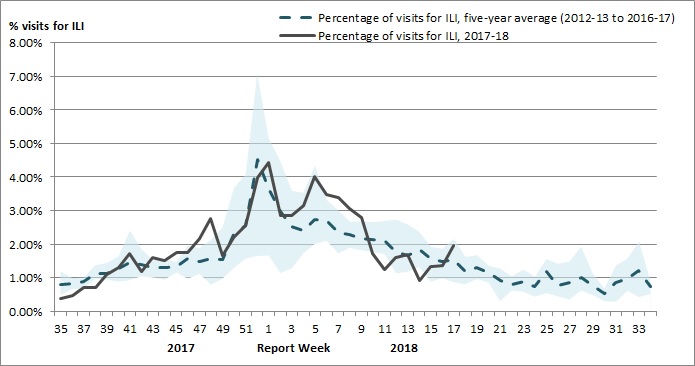
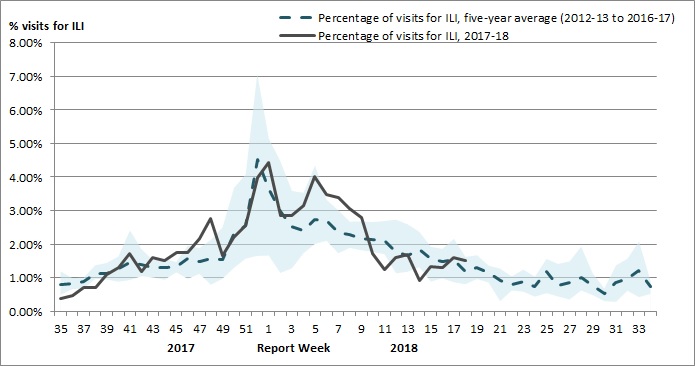
[h=2]Syndromic/Influenza-like Illness Surveillance[/h] [h=3]Healthcare Professionals Sentinel Syndromic Surveillance[/h] In week 52, 4.5% of visits to healthcare professionals were due to influenza-like illness (ILI); an increase compared to the previous week. Since week 49, the weekly proportion of healthcare visits for ILI has been similar to the 5-year average.
[h=3]Figure 4 - Percentage of visits for ILI reported by sentinels by report week, Canada, weeks 2017-35 to 2017-52[/h] Number of Sentinels Reporting in Week 52: 72
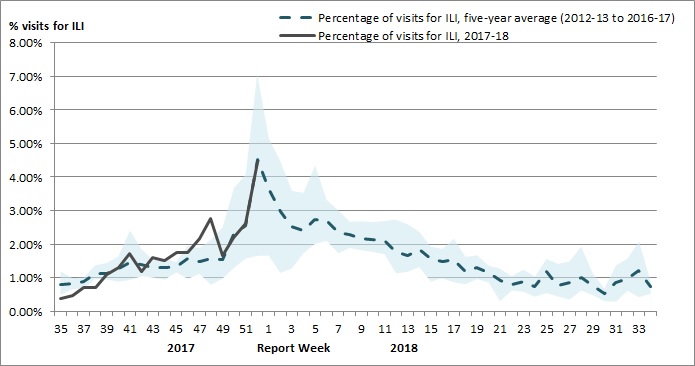
fig4-eng.jpg
The shaded area represents the maximum and minimum percentage of visits for ILI reported by week from seasons 2012-13 to 2016-17
Figure 4 - Text Description [h=3]Participatory Syndromic Surveillance[/h] FluWatchers is a participatory ILI surveillance system that relies on weekly voluntary submissions of syndromic information from Canadians across Canada.
In week 52, 1,202 participants reported to FluWatchers, of which 6% reported symptoms of cough and fever, and 10% of these consulted a healthcare professional. Among participants who reported cough and fever, 78% reported days missed from work or school, resulting in a combined total of 180 missed days of work or school.
[TABLE="class: table table-striped table-bordered table-hover table-condensed, width: 1140"]
Table 2 - Summary of influenza-like illness symptoms reported by participating Canadians, Canada, week 2017-52 [TR="class: bg-primary, bgcolor: #2572B4"]
Number of Participants Reporting Percentage participants reporting Cough and Fever Percentage of participants with cough and fever who consulted a healthcare professional Percentage of participants with cough and fever who reported missed days from work or school Number of missed days from work or school [/TR]
[TR="class: text-center, bgcolor: #F5F5F5"]
[TD]1202[/TD]
[TD]6%[/TD]
[TD]10%[/TD]
[TD]78%[/TD]
[TD]180[/TD]
[/TR]
[/TABLE]
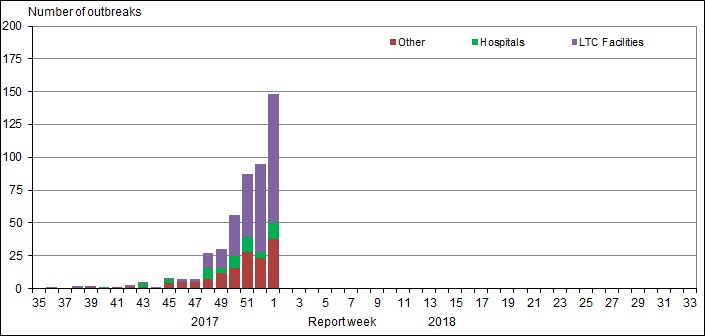
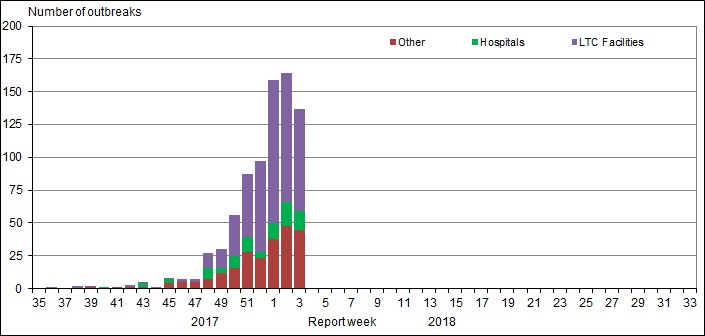
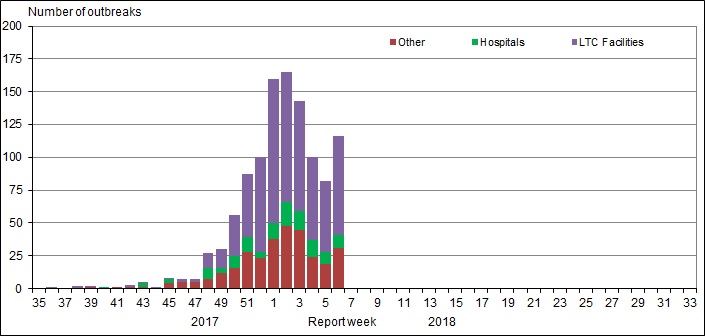
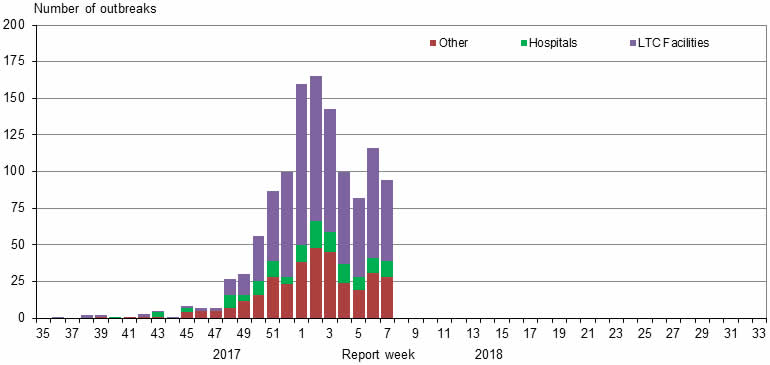
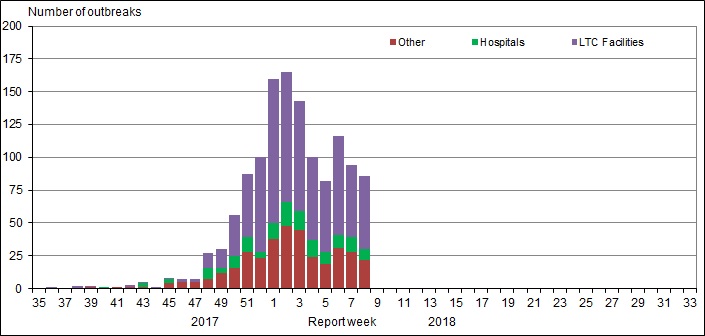
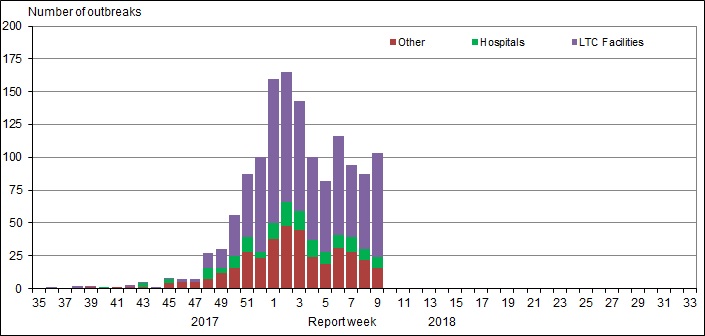
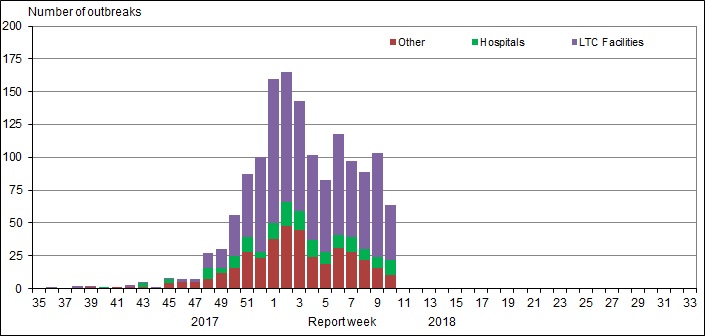
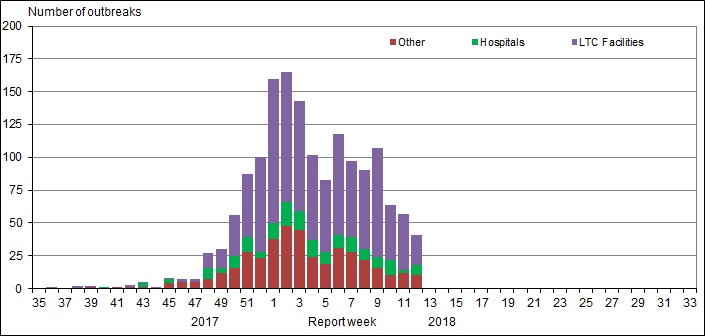
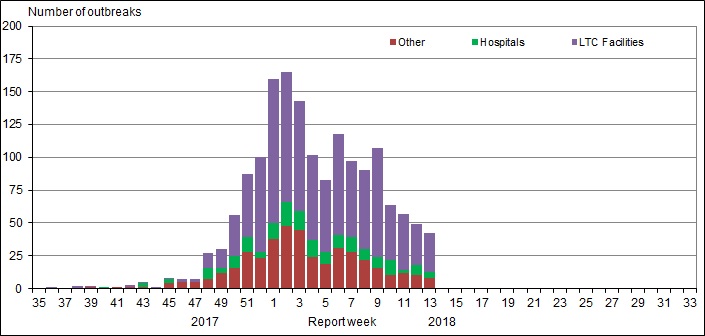
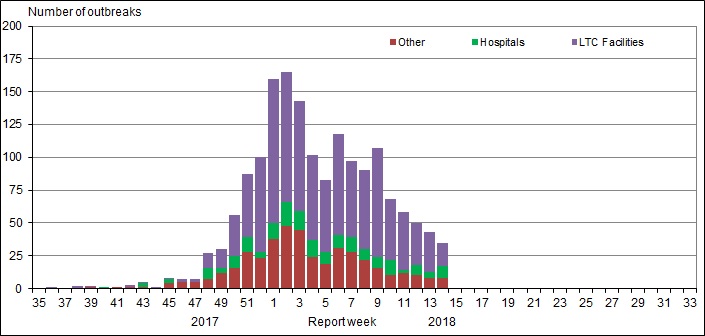
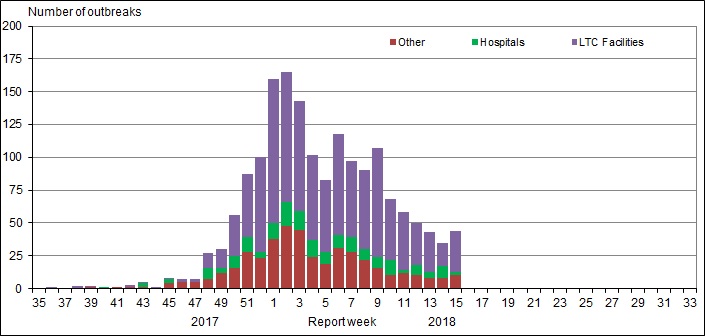
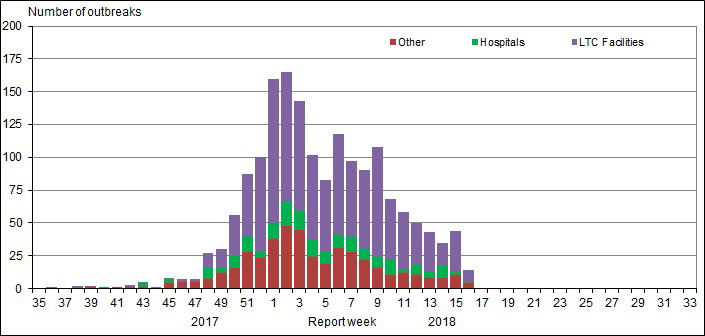
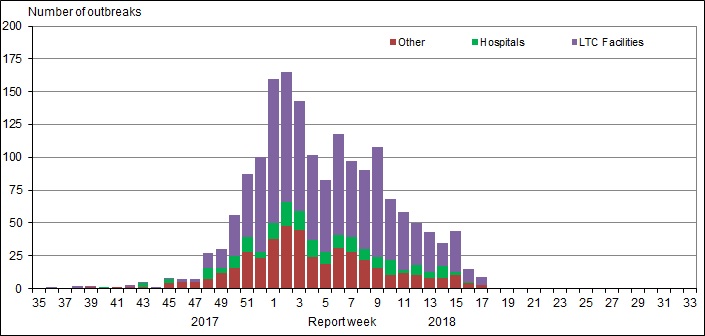
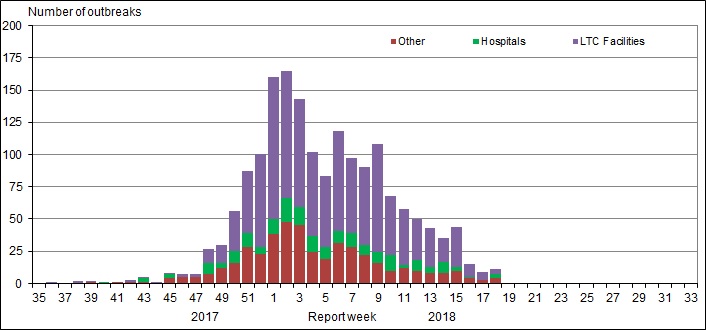
[h=2]Influenza Outbreak Surveillance[/h] In weeks 51 and 52, the number of reported laboratory-confirmed outbreaks of influenza increased. During this period, 137 new influenza outbreaks were reported: 97 in long-term care facilities, 12 in hospitals, and 28 in other settings. Among the 102 outbreaks with influenza type/subtype reported, 27 were associated with influenza B, and 69 were associated with influenza A, of which 21 were influenza A(H3N2) and 48 influenza A(unsubtyped). Six outbreaks were associated with a mix of influenza A and B.
To date this season, 293 influenza/ILI outbreaks have been reported, of which 166 (57%) occurred in LTC facilities. Among the 239 outbreaks for which the influenza type/subtype was reported, 179 were associated with influenza A (of which 99 were A(H3N2)), 51 were associated with influenza B, and nine were associated with a mix of A and B. Compared to recent influenza A(H3N2) seasons at week 52 or 53, the number of cumulative outbreaks reported this season has been slightly greater than during the 2016-17 and 2012-13 seasons, and lower compared to the 2014-15 season.
[h=3]Figure 5 - Number of new outbreaks of laboratory-confirmed influenza by report week, Canada, weeks 2017-35 to 2017-52[/h]
fig5-eng.jpg
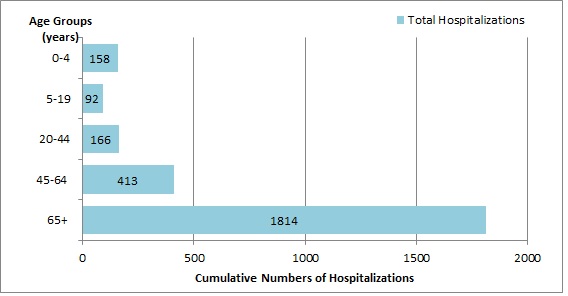
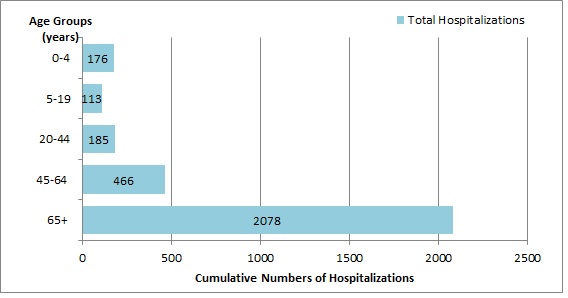
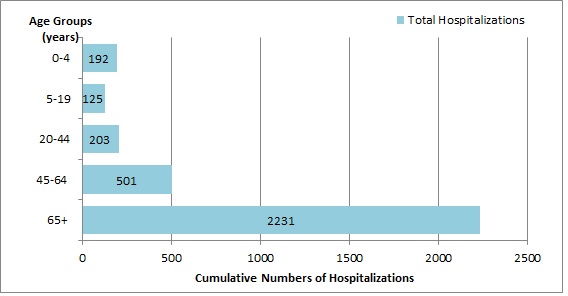
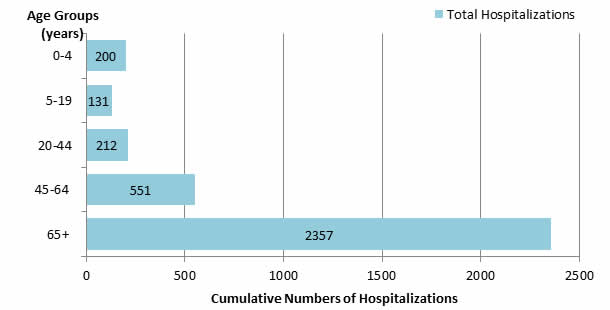
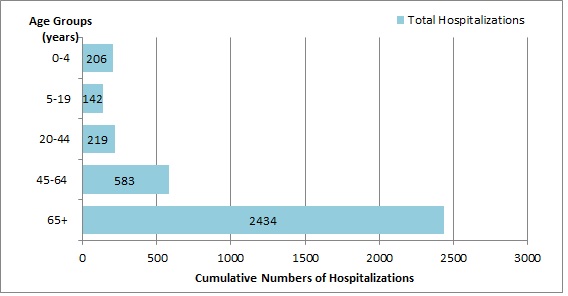
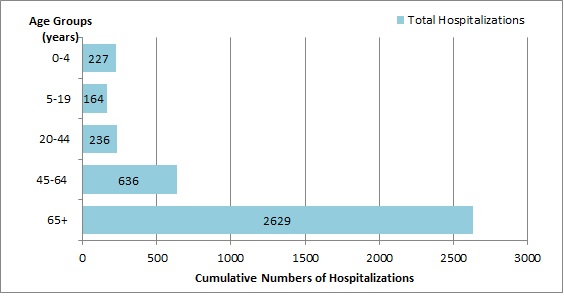
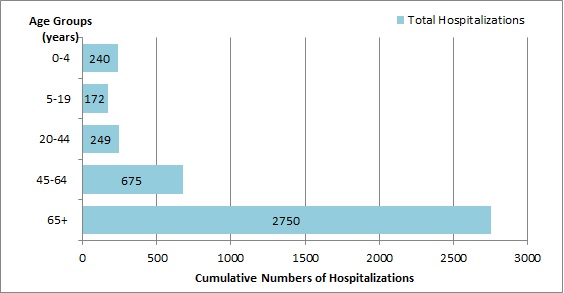
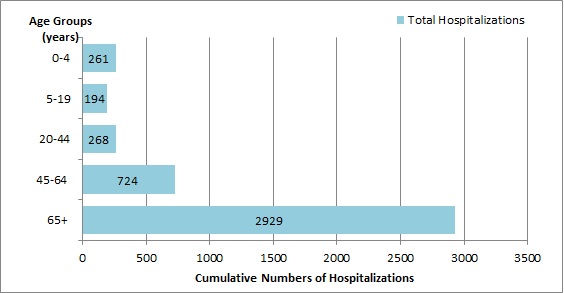
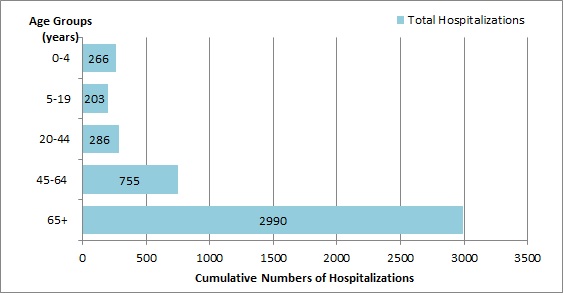
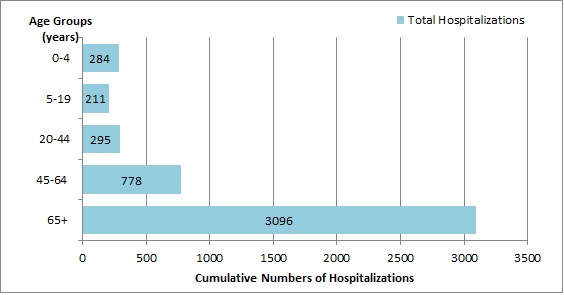
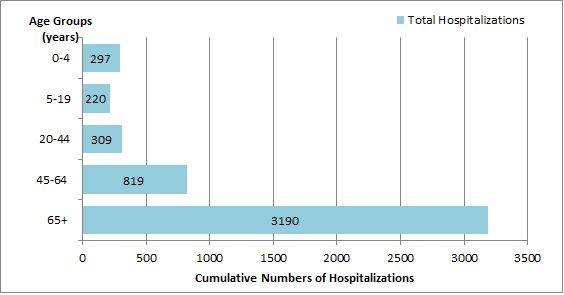
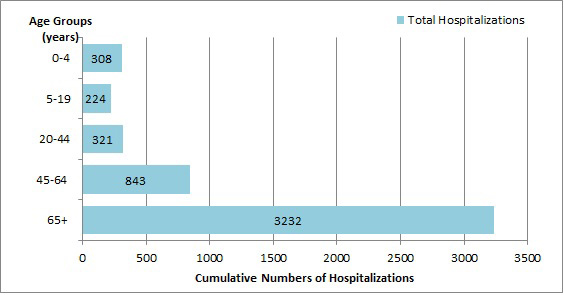
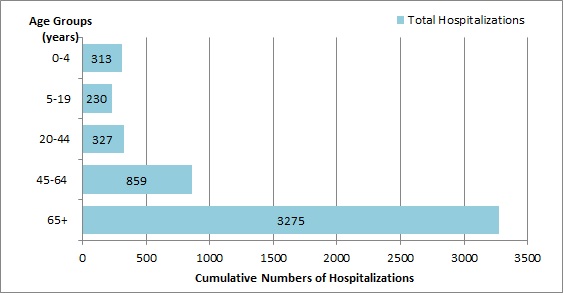
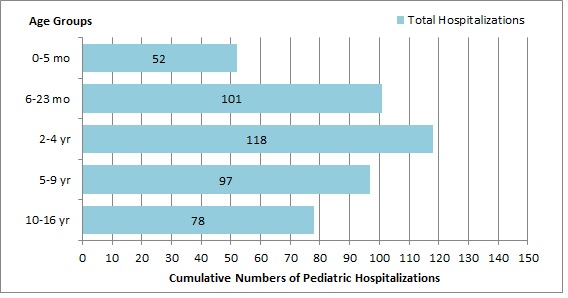
Figure 5 - Text Description [h=2]Severe Outcomes Influenza Surveillance[/h] [h=3]Provincial/Territorial Influenza Hospitalizations and Deaths[/h] In weeks 51 and 52, 94 influenza-associated hospitalizations were reported by participating provinces and territoriesFootnote1. However, this is an underrepresentation of the number of hospitalizations for this period, due to gaps in reporting. Retrospective updates will be included in the next FluWatch report.
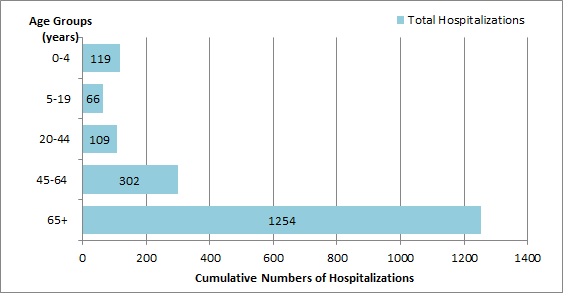
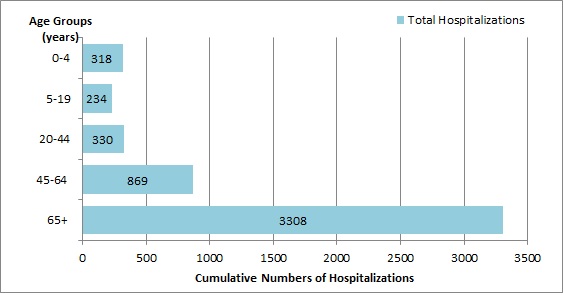
To date this season, 1,050 influenza-associated hospitalizations have been reported, 87% of which were associated with influenza A, and 710 cases (68%) were in adults 65 years of age or older. To date, 93 ICU admissions and 34 deaths have been reported.
[h=3]Figure 6 - Cumulative numbers of hospitalizations by age-group reported by participating provinces and territoriesfigure 6 note1, weeks 2017-35 to 2017-52[/h]
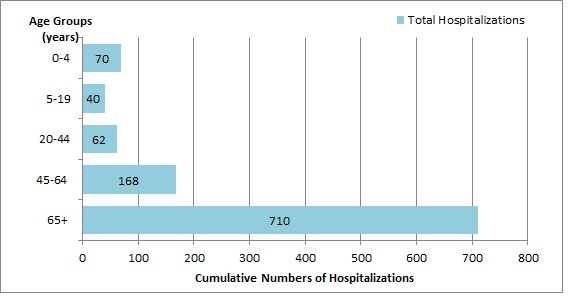
fig6-eng.jpg
Figure 6 - Text Description Figure 6 note 1 Influenza-associated hospitalizations are reported by NL, PE, NS, NB, MB, AB, YT and NT. Only hospitalizations that require intensive medical care are reported by SK.
Return to figure 6 note1referrer

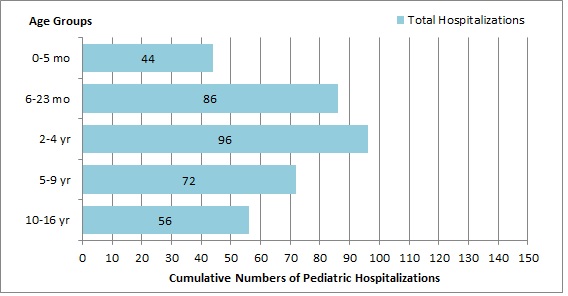
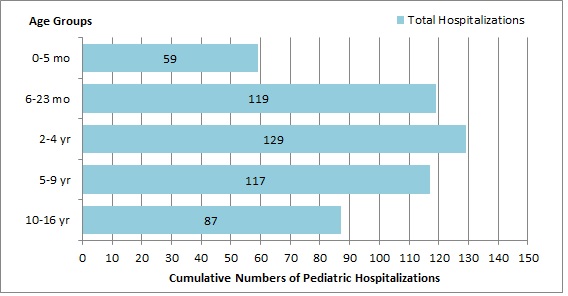
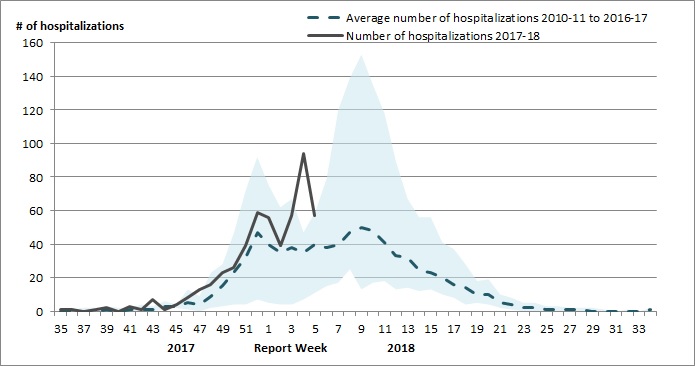
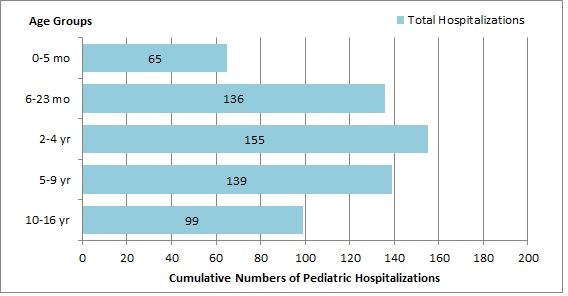
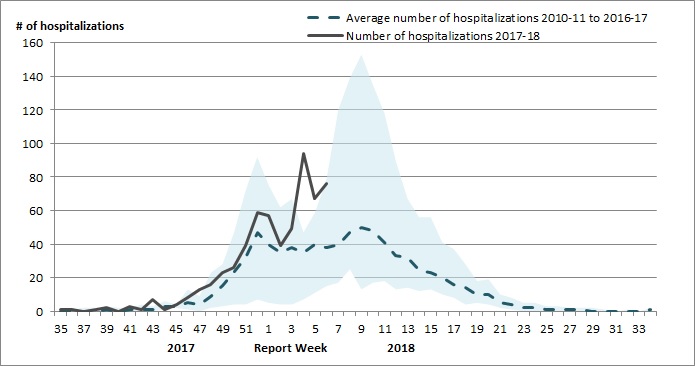
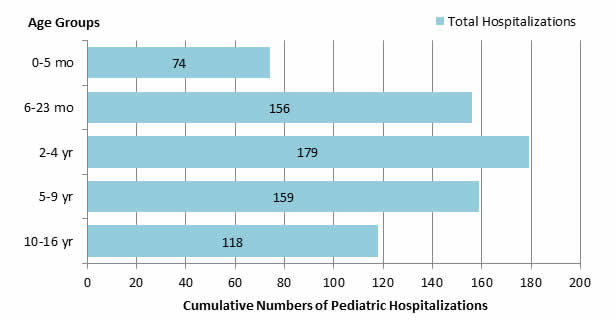
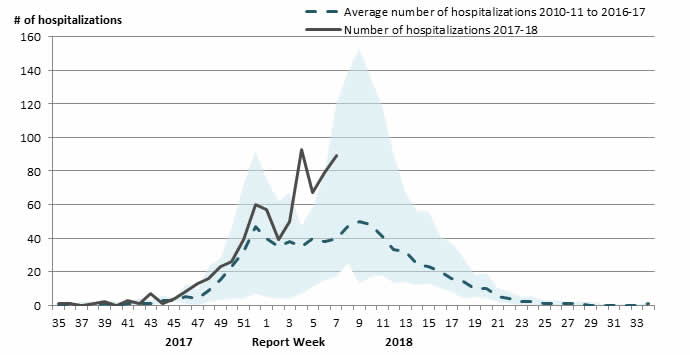
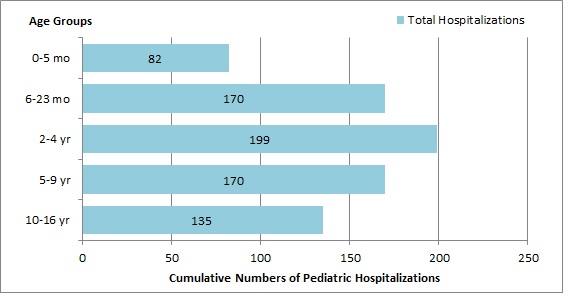
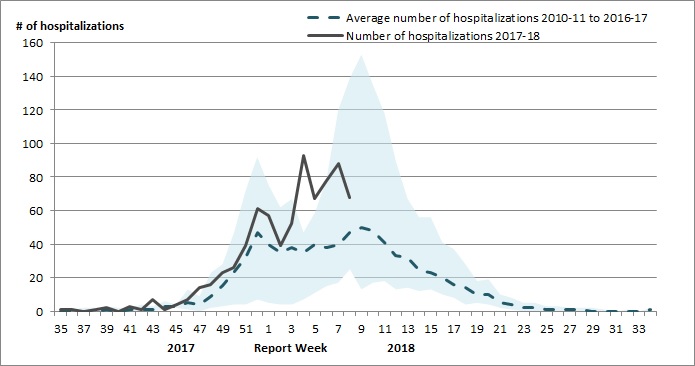
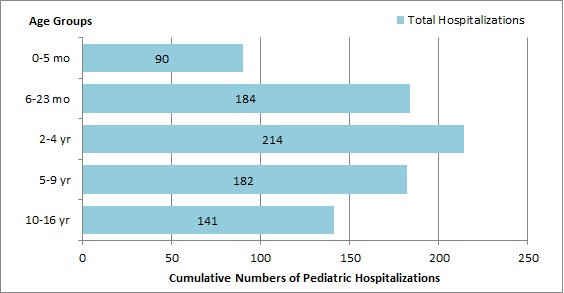
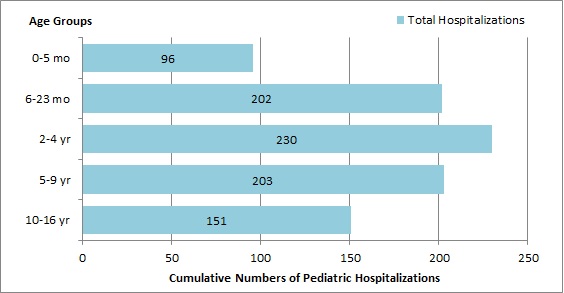
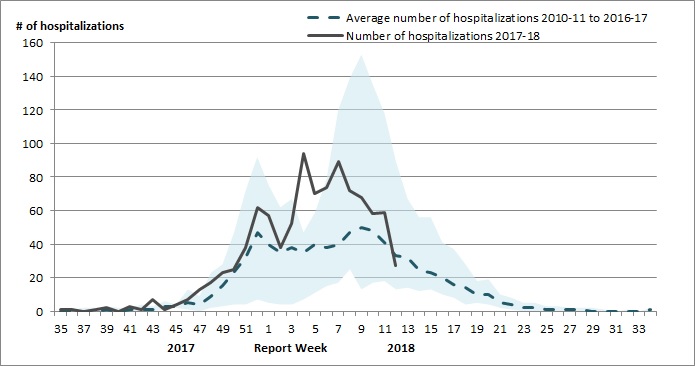
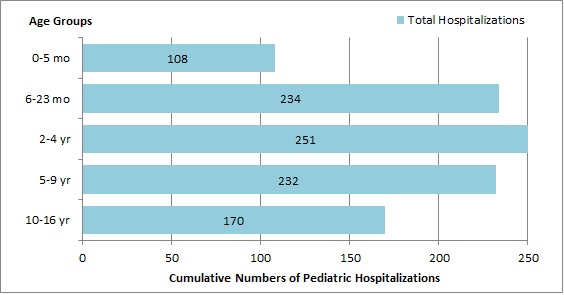
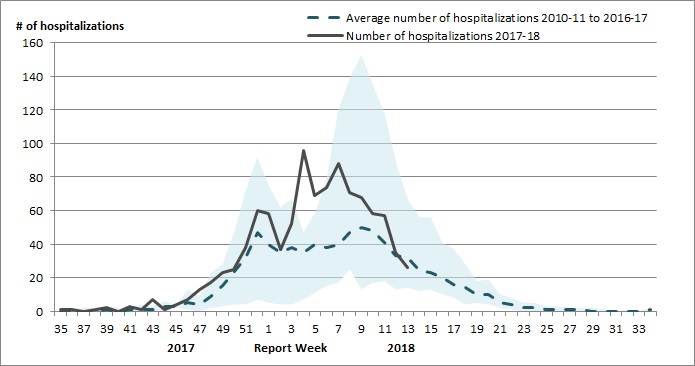
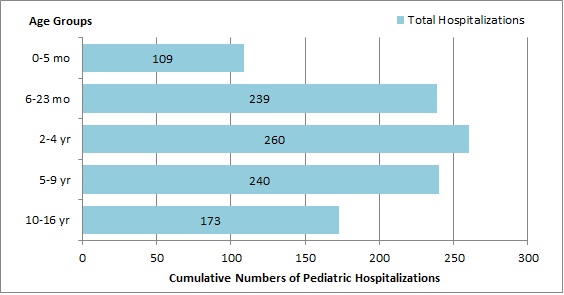
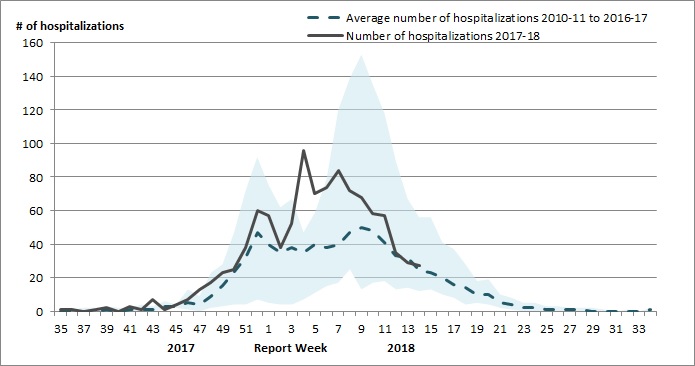
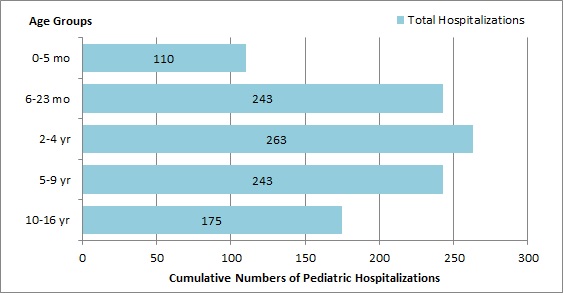
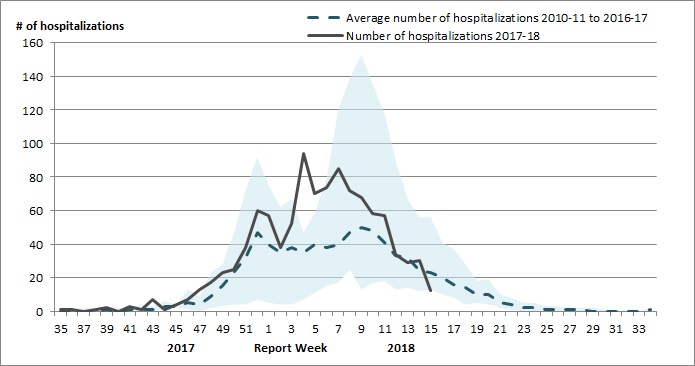
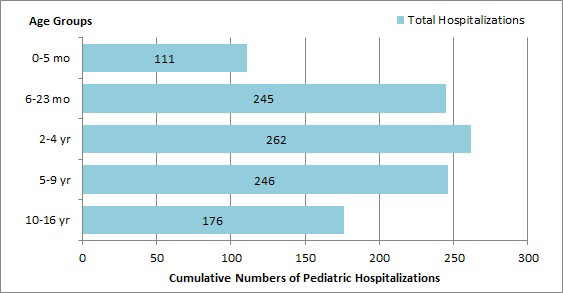
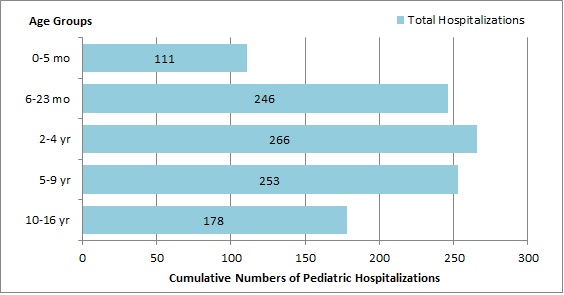
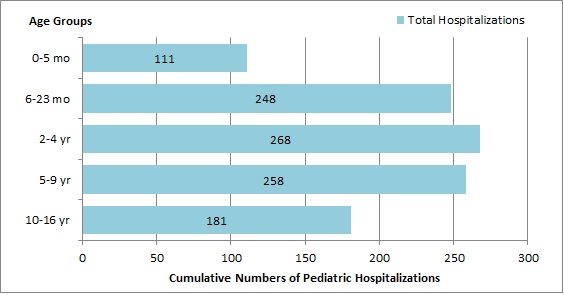
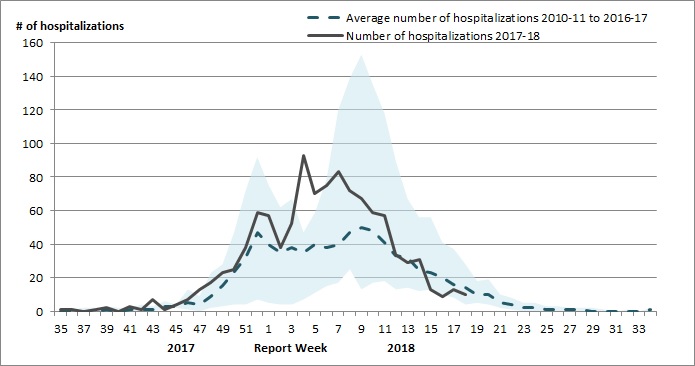
[h=3]Pediatric Influenza Hospitalizations and Deaths[/h] In weeks 51 and 52, the number of laboratory-confirmed influenza-associated pediatric (≤16 years of age) hospitalizations reported by the Immunization Monitoring Program Active (IMPACT) network continued to increase. A total of 84 hospitaliations were reported in this two-week period, of which 54 (64%) were due to influenza A. After several weeks above average, the number of hospitalizations reported in week 52 was similar to the seven-season weekly average.
To date this season, 195 pediatric hospitalizations have been reported by the IMPACT network, 144 (74%) of which were associated with influenza A. Thirty-five ICU admissions and fewer than five deaths have been reported. Compared to recent influenza A(H3N2) seasons at week 52, the number of hospitalizations reported this season have been greater than the 2016-17 season, but below the 2014-15 and 2012-13 seasons.
[h=3]Figure 7 - Cumulative numbers of pediatric hospitalizations (≤16 years of age) with influenza by type and age-group reported by the IMPACT network, Canada, weeks 2017-35 to 2017-52[/h]
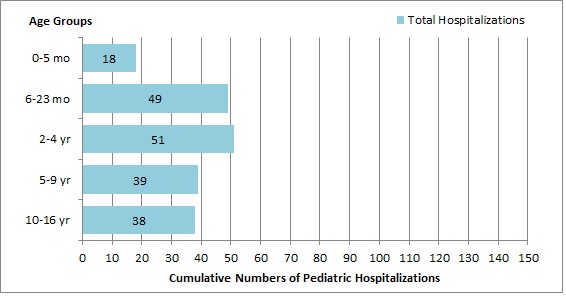
fig7-eng.jpg
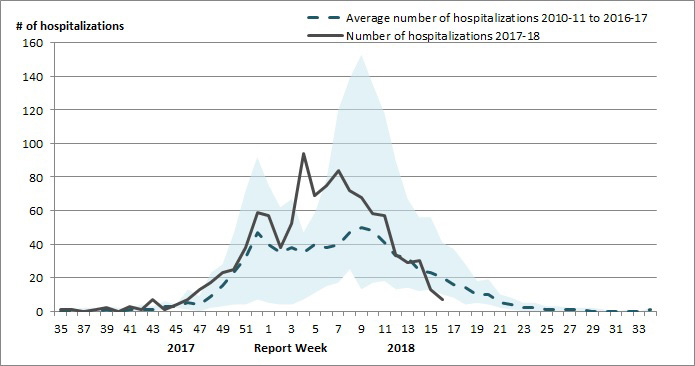
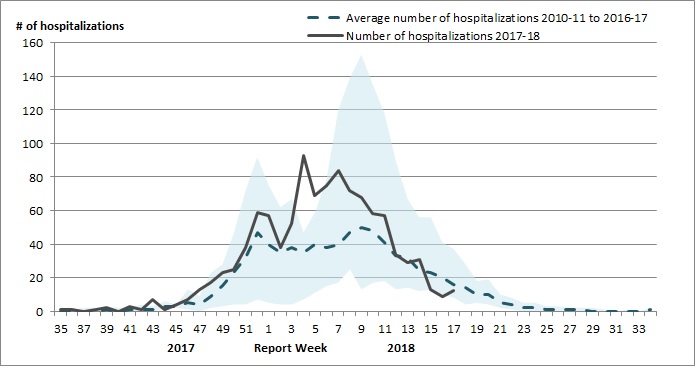
Figure 7 - Text Description [h=3]Figure 8 - Number of pediatric hospitalizations (≤16 years of age) with influenza reported by the IMPACT network, by week, Canada, weeks 2017-35 to 2017-52[/h]
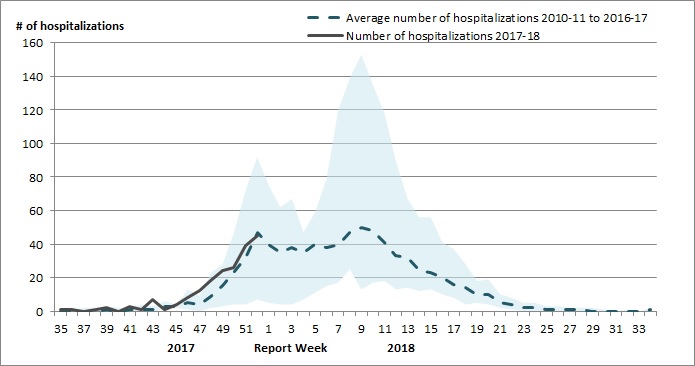
fig8-eng.jpg
Figure 8 - Text Description Figure 8 Footnote 1 The shaded area represents the maximum and minimum number of cases reported by week from seasons 2010-11 to 2016-17
Return to figure 8 note1referrer

[h=2]Influenza Strain Characterizations[/h] During the 2017-18 influenza season, the National Microbiology Laboratory (NML) has characterized 273 influenza viruses [190 A(H3N2), 20 A(H1N1)pdm09 and 63 B viruses] that were received from Canadian laboratories.
[h=3]Antigenic Characterization[/h] Among influenza viruses characterized by hemagglutination inhibition assay during the 2017-18 season, most viruses were antigenically similar to the cell-culture propagated reference strains recommended by WHO.
[TABLE="class: table table-striped table-bordered table-hover table-condensed, width: 1140"]
Table 3 - Influenza antigenic strain characterizations, Canada, weeks 2017-35 to 2017-52 [TR="class: bg-primary, bgcolor: #2572B4"]
Strain Characterization Results Count Description [/TR]
[TR="bgcolor: #F5F5F5"]
Influenza A (H3N2) [/TR]
[TR]
[TD]A/Hong Kong/4801/2014-like[/TD]
[TD]52[/TD]
[TD]Viruses antigenically similar to A/Hong Kong/4801/2014, the A(H3N2) component of the 2017-18 Northern Hemisphere's trivalent and quadrivalent vaccine.[/TD]
[/TR]
[TR="bgcolor: #F5F5F5"]
Influenza A (H1N1) [/TR]
[TR]
[TD]A/Michigan/45/2015-like[/TD]
[TD]20[/TD]
[TD]Viruses antigenically similar to A/Michigan/45/2015, the A(H1N1) component of the 2017-18 Northern Hemisphere's trivalent and quadrivalent influenza vaccine.[/TD]
[/TR]
[TR="bgcolor: #F5F5F5"]
Influenza B [/TR]
[TR]
[TD]B/Brisbane/60/2008-like
(Victoria lineage)[/TD]
[TD]1[/TD]
[TD]Viruses antigenically similar to B/Brisbane/60/2008.
B/Brisbane/60/2008 is the influenza B component of the 2017-18 Northern Hemisphere's trivalent and quadrivalent influenza vaccine.[/TD]
[/TR]
[TR="bgcolor: #F5F5F5"]
[TD]Reduced titer to B/Brisbane/60/2008
(Victoria lineage)[/TD]
[TD]5[/TD]
[TD]These B/Victoria lineage viruses reacted poorly with antisera raised against cell-propagated B/Brisbane/60/2008, suggesting some antigenic differences.[/TD]
[/TR]
[TR]
[TD]B/Phuket/3073/2013-like
(Yamagata lineage)[/TD]
[TD]57[/TD]
[TD]Viruses antigenically similar to B/Phuket/3073/2013, the additional influenza B component of the 2017-18 Northern Hemisphere quadrivalent influenza vaccine.[/TD]
[/TR]
[/TABLE]
[h=3]Genetic Characterization of A(H3N2) viruses[/h] During the 2017-18 season, 138 A(H3N2) viruses did not grow to sufficient titers for antigenic characterization by HI assay. Therefore, genetic characterization was performed to determine to which genetic group they belong. Sequence analysis showed that 111 A(H3N2) viruses belonged to genetic group 3C.2a and 27 viruses belonged to subclade 3C.2a1.
Additionally, of the 52 influenza A(H3N2) viruses that were characterized antigenically as similar to A/Hong Kong/4801/2014, 29 belonged to genetic group 3C.2a and four viruses belonged to subclade 3C.2a1. Sequencing is pending for the remaining 19 viruses.
A/Hong Kong/4801/2014-like virus belongs to genetic group 3C.2a and is the influenza A/H3N2 component of the 2017-18 Northern Hemisphere influenza vaccine.
[h=3]Genetic Characterization of Influenza B viruses[/h] Among the viruses characterized antigenically as having reduced titer to ferret antisera produced against cell-propagated B/Brisbane/60/2008, sequence analysis showed that all five viruses had a two amino acids deletion in the HA gene.
[h=2]Antiviral Resistance[/h] During the 2017-18 season, the National Microbiology Laboratory (NML) has tested 287 influenza viruses for resistance to oseltamivir, and 226 for resistance to zanamivir. All viruses were sensitive to these neuraminidase inhibitors (Table 4).
[TABLE="class: table table-striped table-bordered table-hover table-condensed, width: 1140"]
Table 4 - Antiviral resistance by influenza virus type and subtype, Canada, weeks 2017-35 to 2017-52 [TR="class: bg-primary, bgcolor: #2572B4"]
Virus type and subtype Oseltamivir Zanamivir [/TR]
[TR="class: bg-primary, bgcolor: #2572B4"]
# tested # resistant (%) # tested # resistant (%) [/TR]
[TR="bgcolor: #F5F5F5"]
[TD="class: text-center"]A (H3N2)[/TD]
[TD]206[/TD]
[TD]0 (0%)[/TD]
[TD]168[/TD]
[TD]0 (0%)[/TD]
[/TR]
[TR]
[TD="class: text-center"]A (H1N1)[/TD]
[TD]20[/TD]
[TD]0 (0%)[/TD]
[TD]12[/TD]
[TD]0 (0%)[/TD]
[/TR]
[TR="bgcolor: #F5F5F5"]
[TD="class: text-center"]B[/TD]
[TD]61[/TD]
[TD]0 (0%)[/TD]
[TD]46[/TD]
[TD]0 (0%)[/TD]
[/TR]
[TR]
[TD="class: text-center"]TOTAL[/TD]
[TD]287[/TD]
[TD]0 (0%)[/TD]
[TD]226[/TD]
[TD]0 (0%)[/TD]
[/TR]
[TR]
[TD="colspan: 5"] Note: Since the 2009 pandemic, all circulating influenza A viruses have been resistant to amantadine, and it is therefore not currently recommended for use in the treatment of influenza. During the 2017-18 season, the subset of influenza A viruses that were tested for resistance to amantadine were resistant.
[/TD]
[/TR]
[/TABLE]

...
https://www.canada.ca/en/public-hea...2017-2018/weeks51-52-december-17-30-2017.html
 
[h=1]FluWatch report: December 31, 2017 to January 6, 2018 (week 1)[/h]
[h=5]Overall Summary[/h]
  • Overall, influenza activity in Canada is high and continues to increase. Most indicators of influenza activity increased in week 01, and are in the higher range of expected levels for this time of year.
  • The majority of influenza detections continue to be A(H3N2), although the proportion of detections that are influenza B has been increasing steadily
  • Influenza B is circulating much earlier than usual this season. The number of influenza B detections remains substantially greater this season compared to previous years.
  • To date this season, the majority of lab confirmations, hospitalizations and deaths have been among adults 65 years of age and older.
  • For more information on the flu, see our Flu(influenza) web page.

[h=2]On this page[/h]
[h=2]Influenza/Influenza-like Illness Activity (geographic spread)[/h] In week 01, an increasing number of regions reported localized or widespread influenza activity; nine regions (BC(2), ON(3), QC(3) and PE(1)) reported widespread activity, and 27 regions (BC(2), AB(4), SK(1), MB (4), ON(4), QC(3), NB(5), NS(3) and NT(1)) reported localized activity.


pub-eng.jpg

Download the alternative format
(PDF format, 867 KB, 10 pages)
Organization:
Public Health Agency of Canada
Date published: 2018-01-12

[h=5]Related Topics[/h]


[h=3]Figure 1 - Map of overall influenza/ILI activity level by province and territory, Canada, week 2018-01[/h]
fig1-eng.jpg
Note: Influenza/ILI activity levels, as represented on this map, are assigned and reported by Provincial and Territorial Ministries of Health, based on laboratory confirmations, sentinel ILI rates and reported outbreaks. Please refer to detailed definitions at the end of the report. Maps from previous weeks, including any retrospective updates, are available in the mapping feature found in the Weekly Influenza Reports.
Figure 1 - Text Description [h=2]Laboratory-Confirmed Influenza Detections[/h] In week 01, both influenza A and B detections continued to increase although the rate of increase in influenza A detections was smaller compared to influenza B. The slowing of influenza A detections may indicate that we are approaching the peak of the season for influenza A, at the national level. However, the number of influenza B detections increased 52% compared to the previous week to1,529 in week 01, which is the highest weekly value observed over the past seven seasons.
The proportion of tests positive for influenza increased slightly from 28% in week 52 to 30% in week 01. The proportion of influenza detections that are influenza B has been increasing steadily since week 42. In week 01, 64% of detections were influenza A and 36% influenza B.
The number (2,732) and percentage (19.3%) of influenza A detections for week 01 are within the range of expected levels for this time of year. The number (1,529) and percentage of tests (10.8%) positive for influenza B in week 01 continue to be well above expected levels. Influenza B is circulating much earlier than usual this season. Twenty times the number of influenza B detections have been reported this season compared to the same period during the past seven seasons. For data on other respiratory virus detections, see the Respiratory Virus Detections in Canada Report.
[h=3]Figure 2 - Number of positive influenza tests and percentage of tests positive, by type, subtype and report week, Canada, weeks 2017-35 to 2018-01[/h]
fig2-eng.jpg
The shaded area indicates weeks where the positivity rate was at least 5% and a minimum of 15 positive tests were observed, signalling the period of seasonal influenza activity.
Figure 2 - Text Description To date this season, 15,572 laboratory-confirmed influenza detections have been reported, of which 71% have been influenza A. Influenza A(H3N2) has been the most common subtype detected this season, representing 94% of subtyped influenza A detections. For more detailed weekly and cumulative influenza data, see the text descriptions for Figures 2 and 3 or the Respiratory Virus Detections in Canada Report.
[h=3]Figure 3 - Cumulative numbers of positive influenza specimens by type/subtype and province/territory, Canada, weeks 2017-35 to 2018-01[/h]
fig3-eng.jpg
Figure 3 - Text Description To date this season, detailed information on age and type/subtype has been received for 14,038 laboratory-confirmed influenza cases (Table 1). Among all influenza cases with reported age and type/subtype information, 47% have been reported in adults 65 years of age and older. Among cases of influenza A(H3N2), adults 65 years of age and older represented 52% of cases, compared to 41% and 56% of cases reported in the same period in the 2016-17 and 2014-15 season, respectively. Cases of influenza B this season were distributed more evenly across all age-groups, but the largest proportion of cases was still among adults 65 years of age and older (41%), followed by adults 45-64 years of age (23%).
[TABLE="class: table table-striped table-bordered table-hover table-condensed, width: 1140"]
Table 1 - Cumulative numbers of positive influenza specimens by type, subtype and age-group reported through case-based laboratory reporting, Canada, weeks 2017-35 to 2018-01 [TR="class: bg-primary, bgcolor: #2572B4"]
Age groups (years) Cumulative (August 27, 2017 to January 6, 2018) [/TR]
[TR="class: bg-primary, bgcolor: #2572B4"]
Influenza A B Influenza A and B [/TR]
[TR="class: bg-primary, bgcolor: #2572B4"]
A Total A(H1) pdm09 A(H3) A (UnS)Table 1 Footnote1 Total # % [/TR]
[TR="bgcolor: #F5F5F5"]
0-4 [TD]842[/TD]
[TD]48[/TD]
[TD]389[/TD]
[TD]405[/TD]
[TD]211[/TD]
[TD]1053[/TD]
[TD]8%[/TD]
[/TR]
[TR]
5-19 [TD]868[/TD]
[TD]42[/TD]
[TD]429[/TD]
[TD]397[/TD]
[TD]563[/TD]
[TD]1431[/TD]
[TD]10%[/TD]
[/TR]
[TR="bgcolor: #F5F5F5"]
20-44 [TD]1710[/TD]
[TD]70[/TD]
[TD]809[/TD]
[TD]831[/TD]
[TD]631[/TD]
[TD]2341[/TD]
[TD]17%[/TD]
[/TR]
[TR]
45-64 [TD]1719[/TD]
[TD]56[/TD]
[TD]826[/TD]
[TD]837[/TD]
[TD]897[/TD]
[TD]2616[/TD]
[TD]19%[/TD]
[/TR]
[TR="bgcolor: #F5F5F5"]
65+ [TD]5001[/TD]
[TD]28[/TD]
[TD]2642[/TD]
[TD]2331[/TD]
[TD]1596[/TD]
[TD]6597[/TD]
[TD]47%[/TD]
[/TR]
[TR]
Total [TD]10140[/TD]
[TD]244[/TD]
[TD]5095[/TD]
[TD]4801[/TD]
[TD]3898[/TD]
[TD]14038[/TD]
[TD]100%[/TD]
[/TR]
[TR]
[TD="colspan: 8"] Table 1 Footnote 1 UnS: unsubtyped: The specimen was typed as influenza A, but no result for subtyping was available;
Return to table 1 footnote1referrer

[/TD]
[/TR]
[/TABLE]
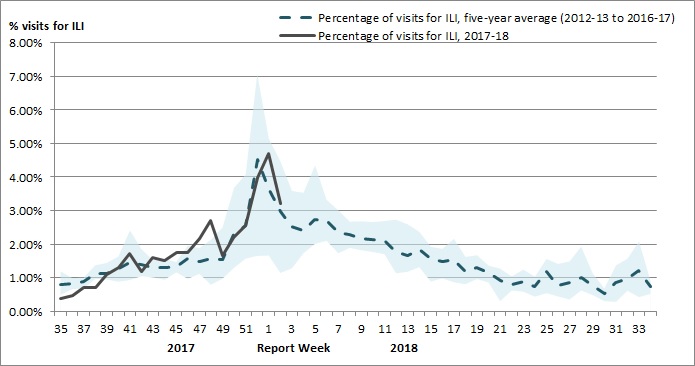
[h=2]Syndromic/Influenza-like Illness Surveillance[/h] [h=3]Healthcare Professionals Sentinel Syndromic Surveillance[/h] In week 01, 4.7% of visits to healthcare professionals were due to influenza-like illness (ILI); an increase compared to the previous week, and above the 5-year average.
[h=3]Figure 4 - Percentage of visits for ILI reported by sentinels by report week, Canada, weeks 2017-35 to 2018-01[/h] Number of Sentinels Reporting in Week 1: 116
fig4-eng.jpg
The shaded area represents the maximum and minimum percentage of visits for ILI reported by week from seasons 2012-13 to 2017-18
Figure 4 - Text Description [h=3]Participatory Syndromic Surveillance[/h] FluWatchers is a participatory ILI surveillance system that relies on weekly voluntary submissions of syndromic information from Canadians across Canada.
In week 01, 1,406 participants reported to FluWatchers, of which 5% reported symptoms of cough and fever, and 22% of these consulted a healthcare professional. Among participants who reported cough and fever, 84% reported days missed from work or school, resulting in a combined total of 186 missed days of work or school.
[TABLE="class: table table-striped table-bordered table-hover table-condensed, width: 1140"]
Table 2 - Summary of influenza-like illness symptoms reported by participating Canadians, Canada, week 2018-01 [TR="class: bg-primary, bgcolor: #2572B4"]
Number of Participants Reporting Percentage participants reporting Cough and Fever Percentage of participants with cough and fever who consulted a healthcare professional Percentage of participants with cough and fever who reported missed days from work or school Number of missed days from work or school [/TR]
[TR="class: text-center, bgcolor: #F5F5F5"]
[TD]1406[/TD]
[TD]5%[/TD]
[TD]22%[/TD]
[TD]84%[/TD]
[TD]186[/TD]
[/TR]
[/TABLE]
[h=2]Influenza Outbreak Surveillance[/h] In week 01, the number of reported laboratory-confirmed outbreaks of influenza increased compared to the previous week. In week 01, 148 new influenza outbreaks were reported: 98 in long-term care facilities, 12 in hospitals, and 38 in other settings. Among the 120 outbreaks with influenza type/subtype reported, 44 (37%) were associated with influenza B, and 73 were associated with influenza A, of which 20 were influenza A(H3N2) and 53 influenza A(unsubtyped). Three outbreaks were associated with a mix of influenza A and B.
To date this season, 486 influenza/ILI outbreaks have been reported, of which 282 (58%) occurred in LTC facilities. Among the 403 outbreaks for which the influenza type/subtype was reported, 286 were associated with influenza A (of which 153 were A(H3N2), 132 were A(unsubtyped) and one was A(H1N1)pdm09), 101 were associated with influenza B, and 16 were associated with a mix of A and B. Compared to recent influenza A(H3N2) seasons at week 01, the number of cumulative outbreaks reported this season has been greater than during the 2016-17 and 2012-13 seasons, and lower compared to the 2014-15 season.
[h=3]Figure 5 - Number of new outbreaks of laboratory-confirmed influenza by report week, Canada, weeks 2017-35 to 2018-01[/h]
fig5-eng.jpg
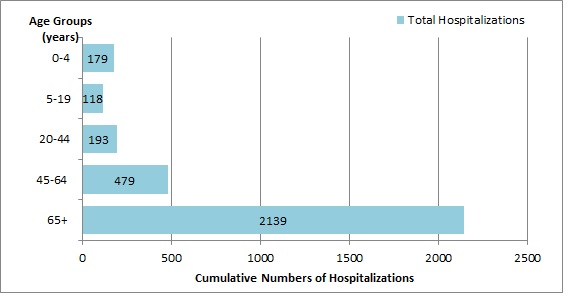
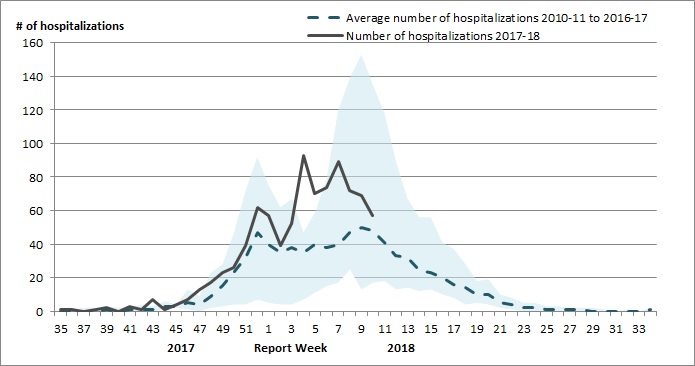
Figure 5 - Text Description [h=2]Severe Outcomes Influenza Surveillance[/h] [h=3]Provincial/Territorial Influenza Hospitalizations and Deaths[/h] In week 01, 128 influenza-associated hospitalizations were reported by participating provinces and territoriesFootnote1. In keeping with the early influenza activity this season, the number of hospitalizations is considerably elevated relative to the same period in the previous two seasons.
To date this season, 1,850 influenza-associated hospitalizations have been reported, 83% of which were associated with influenza A, and 1,254 cases (68%) were in adults 65 years of age or older. To date, 162 ICU admissions and 54 deaths have been reported.
[h=3]Figure 6 - Cumulative numbers of hospitalizations by age-group reported by participating provinces and territoriesfigure 6 note1, weeks 2017-35 to 2018-01[/h]
fig6-eng.jpg
Figure 6 - Text Description Figure 6 note 1 Influenza-associated hospitalizations are reported by NL, PE, NS, NB, MB, AB, YT and NT. Only hospitalizations that require intensive medical care are reported by SK.
Return to figure 6 note1referrer

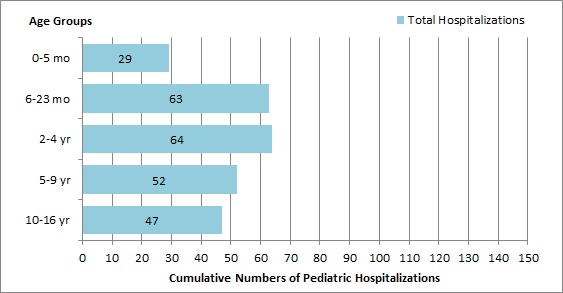
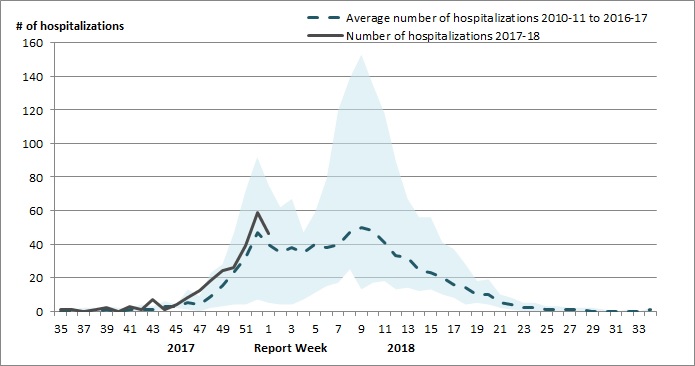
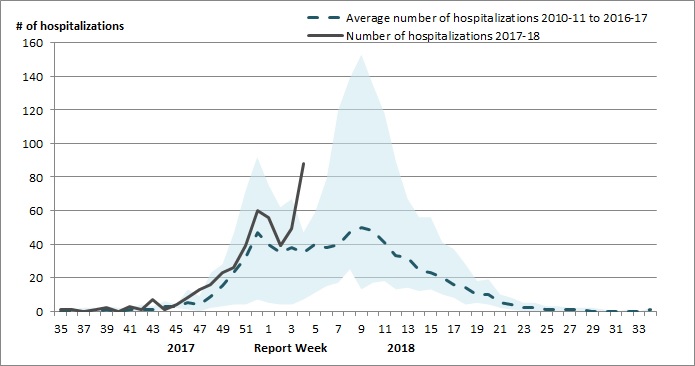
[h=3]Pediatric Influenza Hospitalizations and Deaths[/h] In week 01, the number of laboratory-confirmed influenza-associated pediatric (≤16 years of age) hospitalizations reported by the Immunization Monitoring Program Active (IMPACT) network decreased compared to the previous week. In week 01, 46 hospitaliations were reported, of which 25 (54%) were due to influenza A. The proportion of cases associated with influenza B has been increasing over the past three weeks. The number of weekly hospitalizations has been above the seven-season average since week 45.
To date this season, 253 pediatric hospitalizations have been reported by the IMPACT network, 177 (70%) of which were associated with influenza A. Forty-one ICU admissions and fewer than five deaths have been reported. Compared to recent influenza A(H3N2) seasons at week 01, the cumulative number of hospitalizations reported this season has been greater than the 2016-17 season, but below the 2014-15 and 2012-13 seasons.
[h=3]Figure 7 - Cumulative numbers of pediatric hospitalizations (≤16 years of age) with influenza by type and age-group reported by the IMPACT network, Canada, weeks 2017-35 to 2018-01[/h]
fig7-eng.jpg
Figure 7 - Text Description [h=3]Figure 8 - Number of pediatric hospitalizations (≤16 years of age) with influenza reported by the IMPACT network, by week, Canada, weeks 2017-35 to 2018-01[/h]
fig8-eng.jpg
Figure 8 - Text Description Figure 8 Footnote 1 The shaded area represents the maximum and minimum number of cases reported by week from seasons 2010-11 to 2017-18
Return to figure 8 note1referrer

[h=2]Influenza Strain Characterizations[/h] During the 2017-18 influenza season, the National Microbiology Laboratory (NML) has characterized 351 influenza viruses [229 A(H3N2), 26 A(H1N1)pdm09 and 96 B viruses] that were received from Canadian laboratories.
[h=3]Antigenic Characterization[/h] Among influenza viruses characterized by hemagglutination inhibition assay during the 2017-18 season, most viruses were antigenically similar to the cell-culture propagated reference strains recommended by WHO.
[TABLE="class: table table-striped table-bordered table-hover table-condensed, width: 1140"]
Table 3 - Influenza antigenic strain characterizations, Canada, weeks 2017-35 to 2018-01 [TR="class: bg-primary, bgcolor: #2572B4"]
Strain Characterization Results Count Description [/TR]
[TR="bgcolor: #F5F5F5"]
Influenza A (H3N2) [/TR]
[TR]
[TD]A/Hong Kong/4801/2014-like[/TD]
[TD]54[/TD]
[TD]Viruses antigenically similar to A/Hong Kong/4801/2014, the A(H3N2) component of the 2017-18 Northern Hemisphere's trivalent and quadrivalent vaccine.[/TD]
[/TR]
[TR="bgcolor: #F5F5F5"]
Influenza A (H1N1) [/TR]
[TR]
[TD]A/Michigan/45/2015-like[/TD]
[TD]26[/TD]
[TD]Viruses antigenically similar to A/Michigan/45/2015, the A(H1N1) component of the 2017-18 Northern Hemisphere's trivalent and quadrivalent influenza vaccine.[/TD]
[/TR]
[TR="bgcolor: #F5F5F5"]
Influenza B [/TR]
[TR]
[TD]B/Brisbane/60/2008-like
(Victoria lineage)[/TD]
[TD]1[/TD]
[TD]Viruses antigenically similar to B/Brisbane/60/2008.
B/Brisbane/60/2008 is the influenza B component of the 2017-18 Northern Hemisphere?s trivalent and quadrivalent influenza vaccine.[/TD]
[/TR]
[TR="bgcolor: #F5F5F5"]
[TD]Reduced titer to B/Brisbane/60/2008
(Victoria lineage)[/TD]
[TD]5[/TD]
[TD]These B/Victoria lineage viruses reacted poorly with antisera raised against cell-propagated B/Brisbane/60/2008, suggesting some antigenic differences.[/TD]
[/TR]
[TR]
[TD]B/Phuket/3073/2013-like
(Yamagata lineage)[/TD]
[TD]90[/TD]
[TD]Viruses antigenically similar to B/Phuket/3073/2013, the additional influenza B component of the 2017-18 Northern Hemisphere quadrivalent influenza vaccine.[/TD]
[/TR]
[/TABLE]
[h=3]Genetic Characterization of A(H3N2) viruses[/h] During the 2017-18 season, 175 A(H3N2) viruses did not grow to sufficient titers for antigenic characterization by HI assay. Therefore, genetic characterization was performed to determine to which genetic group they belong. Sequence analysis showed that 143 A(H3N2) viruses belonged to genetic group 3C.2a, 31 viruses belonged to subclade 3C.2a1 and one virus belonged to the clade 3C.3a.
Additionally, of the 54 influenza A(H3N2) viruses that were characterized antigenically as similar to A/Hong Kong/4801/2014, 45 belonged to genetic group 3C.2a and eight viruses belonged to subclade 3C.2a1. Sequencing is pending for the remaining one virus.
A/Hong Kong/4801/2014-like virus belongs to genetic group 3C.2a and is the influenza A/H3N2 component of the 2017-18 Northern Hemisphere influenza vaccine.
[h=3]Genetic Characterization of Influenza B viruses[/h] Among the viruses characterized antigenically as having reduced titer to ferret antisera produced against cell-propagated B/Brisbane/60/2008, sequence analysis showed that all five viruses had a two amino acids deletion in the HA gene.

...
https://www.canada.ca/en/public-hea...17-2018/week1-december-31-january-6-2018.html
 
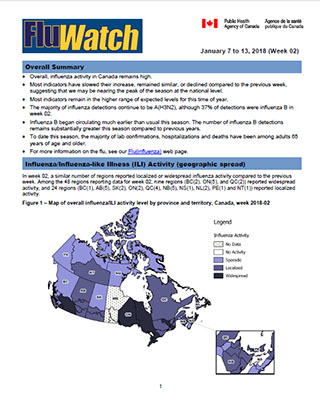
[h=1]FluWatch report: January 7, 2018 to January 13, 2018 (week 2)[/h]
[h=5]Overall Summary[/h]
  • Overall, influenza activity in Canada remains high.
  • Most indicators have slowed their increase, remained similar, or declined compared to the previous week, suggesting that we may be nearing the peak of the season at the national level.
  • Most indicators remain in the higher range of expected levels for this time of year.
  • The majority of influenza detections continue to be A(H3N2), although 37% of detections were influenza B in week 02.
  • Influenza B began circulating much earlier than usual this season. The number of influenza B detections remains substantially greater this season compared to previous years.
  • To date this season, the majority of lab confirmations, hospitalizations and deaths have been among adults 65 years of age and older.
  • For more information on the flu, see our Flu(influenza) web page.

[h=2]On this page[/h]
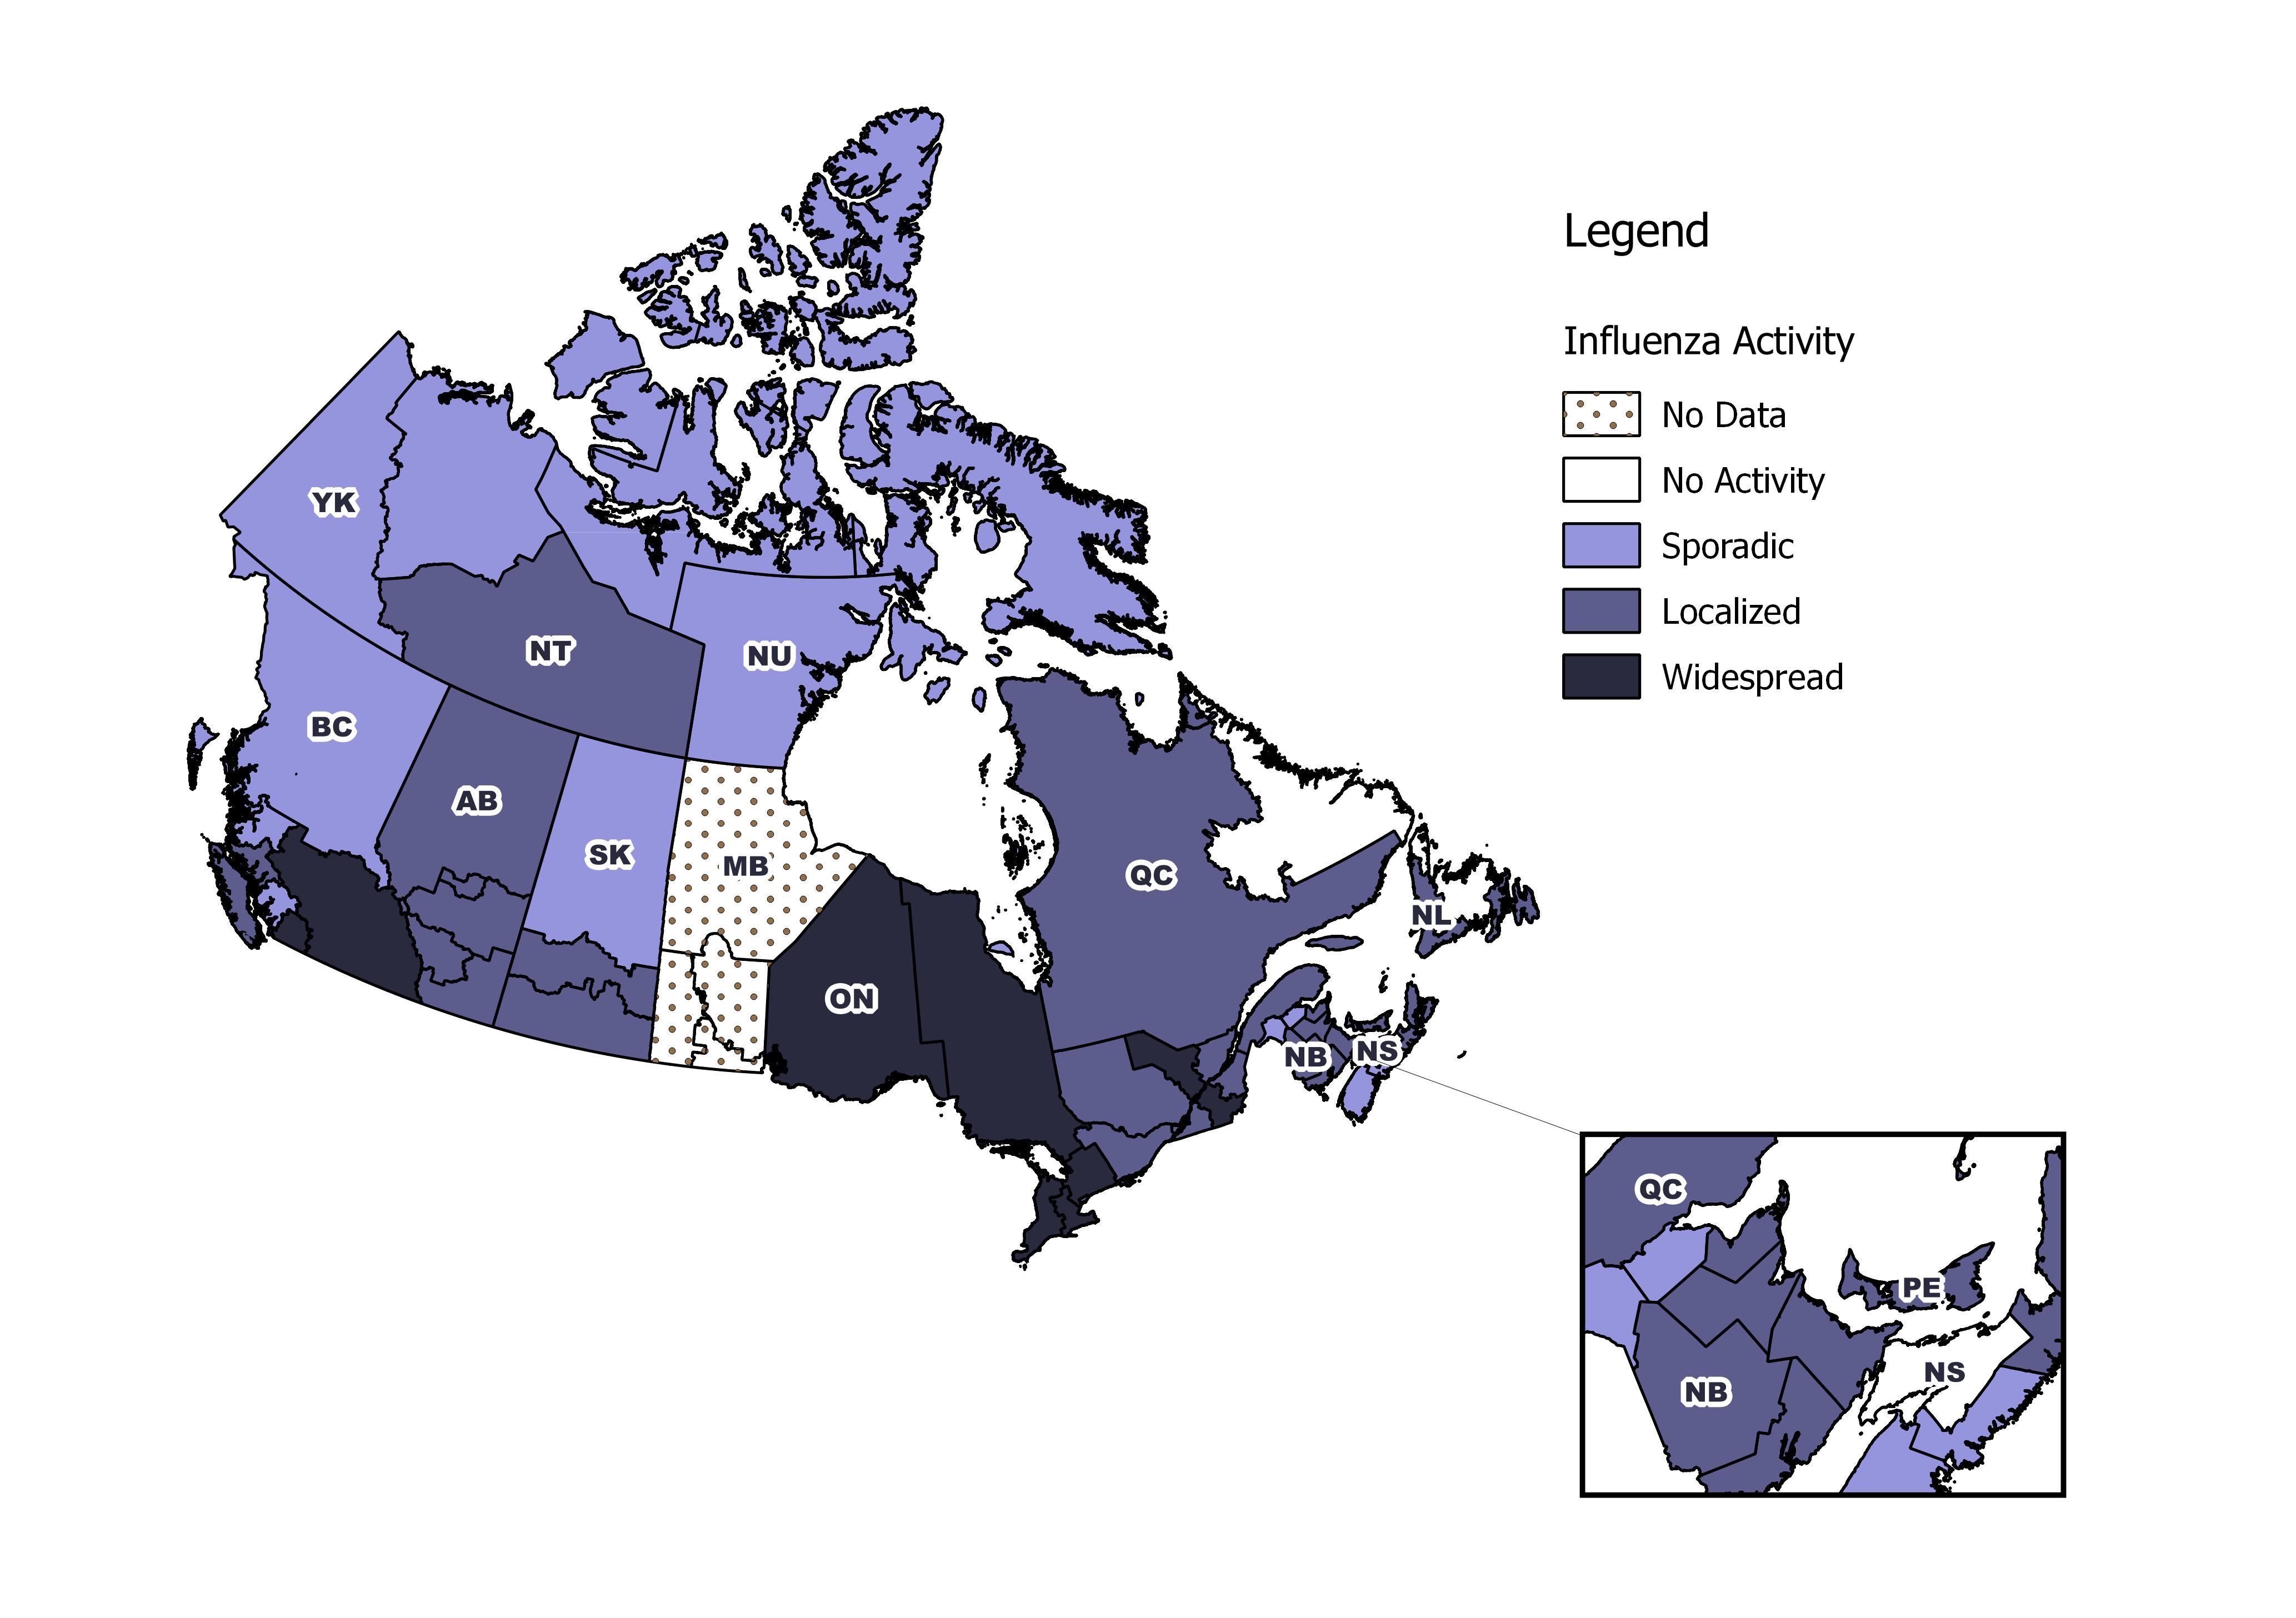
[h=2]Influenza/Influenza-like Illness Activity (geographic spread)[/h] In week 02, a similar number of regions reported localized or widespread influenza activity compared to the previous week. Among the 48 regions reporting data for week 02, nine regions (BC(2), ON(5), and QC(2)) reported widespread activity, and 24 regions (BC(1), AB(5), SK(2), ON(2), QC(4), NB(5), NS(1), NL(2), PE(1) and NT(1)) reported localized activity.


pub-eng.jpg

Download the alternative format
(PDF format, 658 KB, 10 pages)
Organization:
Public Health Agency of Canada
Date published: 2018-01-19

[h=5]Related Topics[/h]


[h=3]Figure 1 - Map of overall influenza/ILI activity level by province and territory, Canada, week 2018-02[/h]
fig1-eng.jpg
Note: Influenza/ILI activity levels, as represented on this map, are assigned and reported by Provincial and Territorial Ministries of Health, based on laboratory confirmations, sentinel ILI rates and reported outbreaks. Please refer to detailed definitions at the end of the report. Maps from previous weeks, including any retrospective updates, are available in the mapping feature found in the Weekly Influenza Reports.
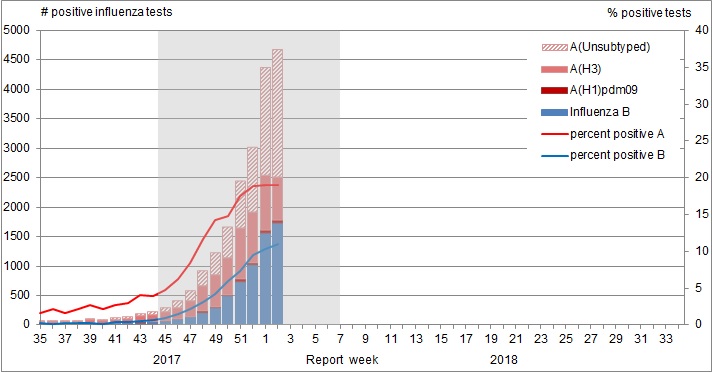
Figure 1 - Text Description [h=2]Laboratory-Confirmed Influenza Detections[/h] In week 02, both influenza A and B detections continued to increase although the rate of increase in influenza A detections was smaller compared to influenza B. The slowing of influenza A detections may indicate that we are approaching the peak of the season for influenza A, at the national level. The increase in the number of influenza B detections slowed slightly, increasing 11% compared to the previous week, to1,713 in week 02. Influenza B detections to date are higher than has been observed over the past seven seasons.
The proportion of tests positive for influenza increased slightly from 29% in week 01 to 30% in week 02. The proportion of influenza detections that are influenza B has been increasing since week 43. In week 02, 63% of detections were influenza A and 37% influenza B.
The number (2,952) and percentage (19.0%) of influenza A detections for week 02 are within the range of expected levels for this time of year. The number (1,713) and percentage of tests (11.0%) positive for influenza B in week 02 continue to be well above expected levels for this time of year. Influenza B is circulating much earlier than usual this season. Twenty times the number of influenza B detections have been reported this season compared to the average over the same period during the past seven seasons. However, the percentage of tests positive for influenza B at week 02 is within the range of levels usually observed in March-April. For data on other respiratory virus detections, see the Respiratory Virus Detections in Canada Report.
[h=3]Figure 2 - Number of positive influenza tests and percentage of tests positive, by type, subtype and report week, Canada, weeks 2017-35 to 2018-02[/h]
fig2-eng.jpg
The shaded area indicates weeks where the positivity rate was at least 5% and a minimum of 15 positive tests were observed, signalling the period of seasonal influenza activity.
Figure 2 - Text Description To date this season, 20,349 laboratory-confirmed influenza detections have been reported, of which 69% have been influenza A. Influenza A(H3N2) has been the most common subtype detected this season, representing 95% of subtyped influenza A detections. For more detailed weekly and cumulative influenza data, see the text descriptions for Figures 2 and 3 or the Respiratory Virus Detections in Canada Report.
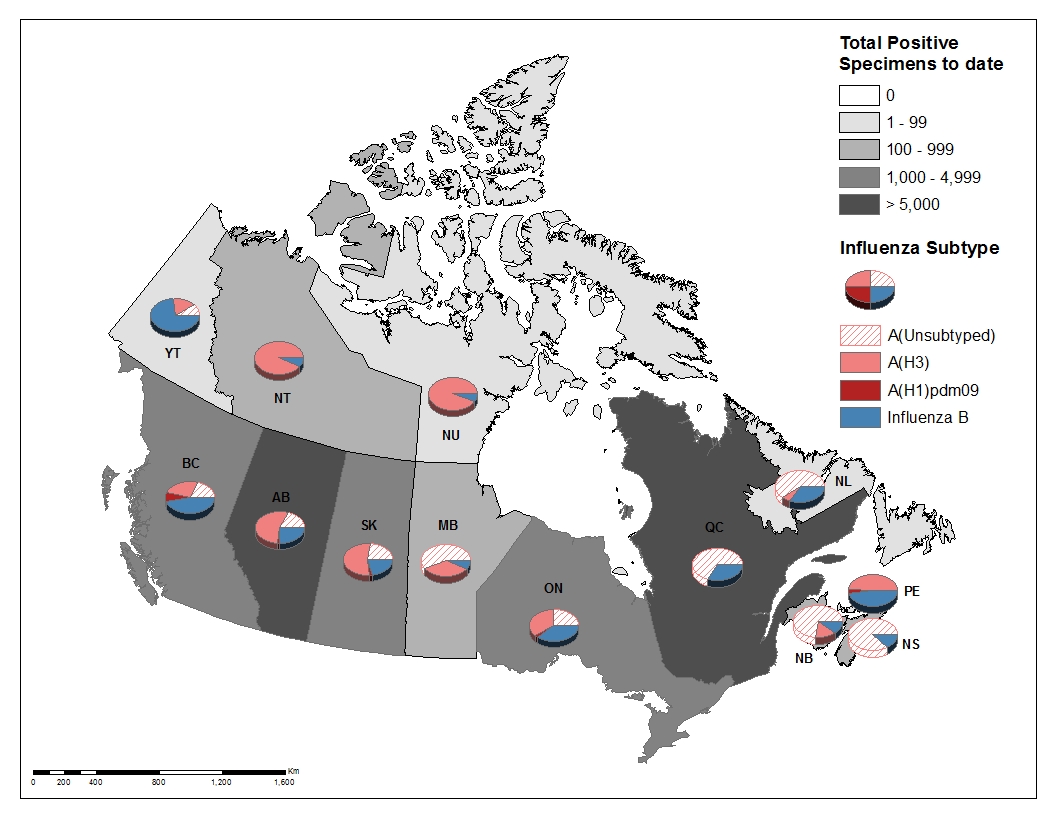
[h=3]Figure 3 - Cumulative numbers of positive influenza specimens by type/subtype and province/territory, Canada, weeks 2017-35 to 2018-02[/h]
fig3-eng.jpg
Figure 3 - Text Description To date this season, detailed information on age and type/subtype has been received for 17,495 laboratory-confirmed influenza cases (Table 1). Among all influenza cases with reported age and type/subtype information, 49% have been reported in adults 65 years of age and older. Among cases of influenza A(H3N2), adults 65 years of age and older represented 53% of cases, compared to 43% and 58% of cases reported in the same period in the 2016-17and 2014-15 season, respectively. Cases of influenza B this season were distributed more evenly across all age-groups, but the largest proportion of cases was still among adults 65 years of age and older (45%), followed by adults 45-64 years of age (23%).
[TABLE="class: table table-striped table-bordered table-hover table-condensed, width: 1140"]
Table 1 - Weekly and cumulative numbers of positive influenza specimens by type, subtype and age-group reported through case-based laboratory reporting, Canada, weeks 2017-35 to 2018-02 [TR="class: bg-primary, bgcolor: #2572B4"]
Age groups (years) Cumulative (August 27, 2017 to January 13, 2018) [/TR]
[TR="class: bg-primary, bgcolor: #2572B4"]
Influenza A B Influenza A and B [/TR]
[TR="class: bg-primary, bgcolor: #2572B4"]
A Total A(H1) pdm09 A(H3) A (UnS)Table 1 Footnote1 Total # % [/TR]
[TR="bgcolor: #F5F5F5"]
0-4 [TD]1005[/TD]
[TD]59[/TD]
[TD]429[/TD]
[TD]517[/TD]
[TD]291[/TD]
[TD]1296[/TD]
[TD]7%[/TD]
[/TR]
[TR]
5-19 [TD]953[/TD]
[TD]45[/TD]
[TD]461[/TD]
[TD]447[/TD]
[TD]654[/TD]
[TD]1607[/TD]
[TD]9%[/TD]
[/TR]
[TR="bgcolor: #F5F5F5"]
20-44 [TD]1983[/TD]
[TD]83[/TD]
[TD]890[/TD]
[TD]1010[/TD]
[TD]784[/TD]
[TD]2767[/TD]
[TD]16%[/TD]
[/TR]
[TR]
45-64 [TD]2074[/TD]
[TD]66[/TD]
[TD]937[/TD]
[TD]1071[/TD]
[TD]1187[/TD]
[TD]3261[/TD]
[TD]19%[/TD]
[/TR]
[TR="bgcolor: #F5F5F5"]
65+ [TD]6214[/TD]
[TD]35[/TD]
[TD]3048[/TD]
[TD]3131[/TD]
[TD]2350[/TD]
[TD]8564[/TD]
[TD]49%[/TD]
[/TR]
[TR]
Total [TD]12229[/TD]
[TD]288[/TD]
[TD]5765[/TD]
[TD]6176[/TD]
[TD]5266[/TD]
[TD]17495[/TD]
[TD]100%[/TD]
[/TR]
[TR]
[TD="colspan: 8"] Table 1 Footnote 1 UnS: unsubtyped: The specimen was typed as influenza A, but no result for subtyping was available;
Return to table 1 footnote1referrer

[/TD]
[/TR]
[/TABLE]
[h=2]Syndromic/Influenza-like Illness Surveillance[/h] [h=3]Healthcare Professionals Sentinel Syndromic Surveillance[/h] In week 02, 3.2% of visits to healthcare professionals were due to influenza-like illness (ILI); a decrease compared to the previous week, and slightly above the 5-year average.
[h=3]Figure 4 - Percentage of visits for ILI reported by sentinels by report week, Canada, weeks 2017-35 to 2018-02[/h] Number of Sentinels Reporting in Week 02: 144
fig4-eng.jpg
The shaded area represents the maximum and minimum percentage of visits for ILI reported by week from seasons 2012-13 to 2017-18
Figure 4 - Text Description [h=3]Participatory Syndromic Surveillance[/h] FluWatchers is a participatory ILI surveillance system that relies on weekly voluntary submissions of syndromic information from Canadians across Canada.
In week 02, 1,443 participants reported to FluWatchers, of which 4% reported symptoms of cough and fever, and 20% of these consulted a healthcare professional. Among participants who reported cough and fever, 74% reported days missed from work or school, resulting in a combined total of 135 missed days of work or school.
[TABLE="class: table table-striped table-bordered table-hover table-condensed, width: 1140"]
Table 2 - Summary of influenza-like illness symptoms reported by participating Canadians, Canada, week 2018-02 [TR="class: bg-primary, bgcolor: #2572B4"]
Number of Participants Reporting Percentage participants reporting Cough and Fever Percentage of participants with cough and fever who consulted a healthcare professional Percentage of participants with cough and fever who reported missed days from work or school Number of missed days from work or school [/TR]
[TR="class: text-center, bgcolor: #F5F5F5"]
[TD]1443[/TD]
[TD]4%[/TD]
[TD]20%[/TD]
[TD]74%[/TD]
[TD]135[/TD]
[/TR]
[/TABLE]
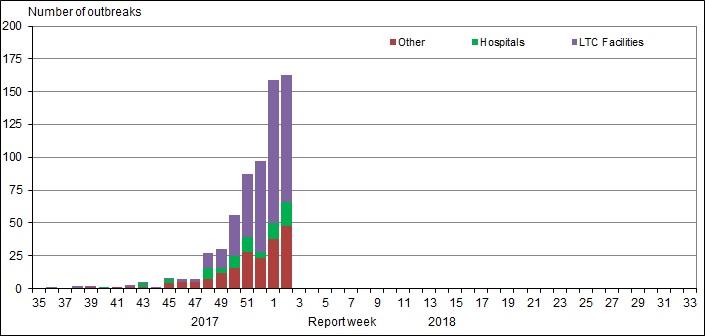
[h=2]Influenza Outbreak Surveillance[/h] In week 02, the number of reported laboratory-confirmed outbreaks of influenza increased slightly compared to the previous week. In week 02, 163 new influenza outbreaks were reported: 97 in long-term care facilities, 18 in hospitals, and 48 in other settings. In addition, one ILI outbreak was reported in a school. Among the 149 outbreaks with influenza type/subtype reported, 71 (48%) were associated with influenza B, and 73 were associated with influenza A, of which 17 were influenza A(H3N2) and 56 influenza A(unsubtyped). Five outbreaks were associated with a mix of influenza A and B.
To date this season, 663 influenza/ILI outbreaks have been reported, of which 392 (59%) occurred in LTC facilities. Among the 566 outbreaks for which the influenza type/subtype was reported, 364 were associated with influenza A (of which 175 were A(H3N2), 188 were A(unsubtyped) and one was A(H1N1)pdm09), 179 were associated with influenza B, and 23 were associated with a mix of A and B. Compared to recent influenza A(H3N2) seasons at week 02, the number of cumulative outbreaks reported this season has been greater than during the 2016-17 and 2012-13 seasons, and lower compared to the 2014-15 season.
[h=3]Figure 5 - Number of new outbreaks of laboratory-confirmed influenza by report week, Canada, weeks 2017-35 to 2018-02[/h]
fig5-eng.jpg
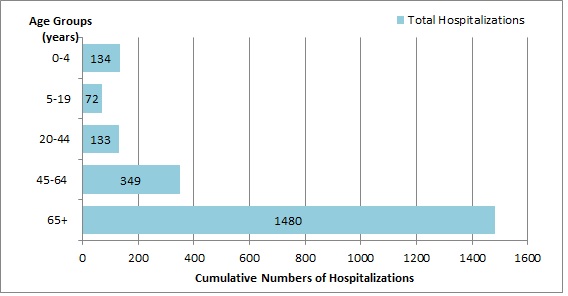
Figure 5 - Text Description [h=2]Severe Outcomes Influenza Surveillance[/h] [h=3]Provincial/Territorial Influenza Hospitalizations and Deaths[/h] In week 02, 133 influenza-associated hospitalizations were reported by participating provinces and territoriesFootnote1, a similar number compared to the previous week. In keeping with the early influenza activity this season, the number of hospitalizations is considerably elevated relative to the same period in the previous two seasons.
To date this season, 2,168 influenza-associated hospitalizations have been reported, 81% of which were associated with influenza A, and 1,480 cases (68%) were in adults 65 years of age or older. To date, 202 ICU admissions and 82 deaths have been reported.
[h=3]Figure 6 - Cumulative numbers of hospitalizations by age-group reported by participating provinces and territoriesfigure 6 note1, weeks 2017-35 to 2018-02[/h]
fig6-eng.jpg
Figure 6 - Text Description Figure 6 note 1 Influenza-associated hospitalizations are reported by NL, PE, NS, NB, MB, AB, YT and NT. Only hospitalizations that require intensive medical care are reported by SK.
Return to figure 6 note1referrer

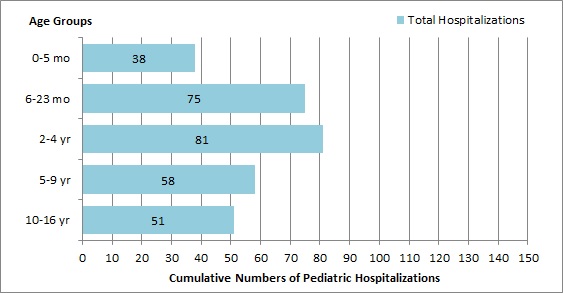
[h=3]Pediatric Influenza Hospitalizations and Deaths[/h] In week 02, the number of laboratory-confirmed influenza-associated pediatric (≤16 years of age) hospitalizations reported by the Immunization Monitoring Program Active (IMPACT) network decreased compared to the previous week. In week 02, 40 hospitaliations were reported, of which 25 (63%) were due to influenza A. The number of weekly hospitalizations has been above the seven-season average since week 45, but following seasonal patterns.
To date this season, 303 pediatric hospitalizations have been reported by the IMPACT network, 209 (69%) of which were associated with influenza A. Forty-eight ICU admissions and fewer than five deaths have been reported. Compared to the cumulative number of pediatric hospitalizations reported up to week 02 during recent influenza A(H3N2)-dominant seasons, the cumulative number of pediatric hospitalizations reported this season has been greater than the 2016-17 season, but below the 2014-15 and 2012-13 seasons.
[h=3]Figure 7 - Cumulative numbers of pediatric hospitalizations (≤16 years of age) with influenza by type and age-group reported by the IMPACT network, Canada, weeks 2017-35 to 2018-02[/h]
fig7-eng.jpg
Figure 7 - Text Description [h=3]Figure 8 - Number of pediatric hospitalizations (≤16 years of age) with influenza reported by the IMPACT network, by week, Canada, weeks 2017-35 to 2018-02[/h]
fig8-eng.jpg
Figure 8 - Text Description Figure 8 Footnote 1 The shaded area represents the maximum and minimum number of cases reported by week from seasons 2010-11 to 2017-18
Return to figure 8 note1referrer

[h=2]Influenza Strain Characterizations[/h] During the 2017-18 influenza season, the National Microbiology Laboratory (NML) has characterized 482 influenza viruses [299 A(H3N2), 34 A(H1N1)pdm09and 149 B viruses] that were received from Canadian laboratories.
[h=3]Antigenic Characterization[/h] Among influenza viruses characterized by hemagglutination inhibition assay during the 2017-18 season, most viruses were antigenically similar to the cell-culture propagated reference strains recommended by WHO.
[TABLE="class: table table-striped table-bordered table-hover table-condensed, width: 1140"]
Table 3 - Influenza antigenic strain characterizations, Canada, weeks 2017-35 to 2018-02 [TR="class: bg-primary, bgcolor: #2572B4"]
Strain Characterization Results Count Description [/TR]
[TR="bgcolor: #F5F5F5"]
Influenza A (H3N2) [/TR]
[TR]
[TD]A/Hong Kong/4801/2014-like[/TD]
[TD]72[/TD]
[TD]Viruses antigenically similar to A/Hong Kong/4801/2014, the A(H3N2) component of the 2017-18 Northern Hemisphere's trivalent and quadrivalent vaccine.[/TD]
[/TR]
[TR="bgcolor: #F5F5F5"]
[TD]Reduced titer to A/Hong Kong/4801/2014[/TD]
[TD]1[/TD]
[TD]These A(H3N2) viruses reacted poorly with antisera raised against cell-propagated A/Hong Kong/4801/2014, suggesting some antigenic differences[/TD]
[/TR]
[TR="bgcolor: #F5F5F5"]
Influenza A (H1N1) [/TR]
[TR]
[TD]A/Michigan/45/2015-like[/TD]
[TD]34[/TD]
[TD]Viruses antigenically similar to A/Michigan/45/2015, the A(H1N1) component of the 2017-18 Northern Hemisphere's trivalent and quadrivalent influenza vaccine.[/TD]
[/TR]
[TR="bgcolor: #F5F5F5"]
Influenza B [/TR]
[TR]
[TD]B/Brisbane/60/2008-like
(Victoria lineage)[/TD]
[TD]1[/TD]
[TD]Viruses antigenically similar to B/Brisbane/60/2008.
B/Brisbane/60/2008 is the influenza B component of the 2017-18 Northern Hemisphere?s trivalent and quadrivalent influenza vaccine.[/TD]
[/TR]
[TR="bgcolor: #F5F5F5"]
[TD]Reduced titer to B/Brisbane/60/2008
(Victoria lineage)[/TD]
[TD]6[/TD]
[TD]These B/Victoria lineage viruses reacted poorly with antisera raised against cell-propagated B/Brisbane/60/2008, suggesting some antigenic differences.[/TD]
[/TR]
[TR]
[TD]B/Phuket/3073/2013-like
(Yamagata lineage)[/TD]
[TD]142[/TD]
[TD]Viruses antigenically similar to B/Phuket/3073/2013, the additional influenza B component of the 2017-18 Northern Hemisphere quadrivalent influenza vaccine.[/TD]
[/TR]
[/TABLE]
[h=3]Genetic Characterization of A(H3N2) viruses[/h] During the 2017-18 season, 227 A(H3N2) viruses did not grow to sufficient titers for antigenic characterization by HI assay. Therefore, genetic characterization was performed to determine to which genetic group they belong. Sequence analysis showed that 185 A(H3N2) viruses belonged to genetic group 3C.2a,41 viruses belonged to subclade 3C.2a1 and one virus belonged to the clade 3C.3a.
Additionally, of the 72 influenza A(H3N2) viruses that were characterized antigenically as similar to A/Hong Kong/4801/2014, 57 belonged to genetic group 3C.2aand 10 viruses belonged to subclade 3C.2a1. The virus that showed reduced titer belonged to genetic clade 3C.3a. Sequencing is pending for the remaining 5 virus isolates.
A/Hong Kong/4801/2014-like virus belongs to genetic group 3C.2a and is the influenza A/H3N2 component of the 2017-18 Northern Hemisphere influenza vaccine.
[h=3]Genetic Characterization of Influenza B viruses[/h] Among the viruses characterized antigenically as having reduced titer to ferret antisera produced against cell-propagated B/Brisbane/60/2008, sequence analysis showed that all six viruses had a two amino acid deletion in the HA gene.

...
https://www.canada.ca/en/public-hea...017-2018/week2-january-7-january-13-2018.html
 
[h=1]FluWatch report: January 14, 2018 to January 20, 2018 (week 3)[/h] [h=5]Overall Summary[/h]
  • Overall, influenza activity in Canada remains high but there is some indication that activity is starting to slow down.
  • Most indicators remain in the higher range of expected levels for this time of year.
  • In week 3, the percentage of laboratory test positive for influenza B continued to increase while the percentage of laboratory test positive for influenza A remained stable.
  • The majority of influenza detections continue to be A(H3N2), although 40% of detections were influenza B in week 03.
  • To date this season, the majority of lab confirmations, hospitalizations and deaths have been among adults 65 years of age and older.
  • For more information on the flu, see our Flu(influenza) web page
[h=2]On this page[/h]
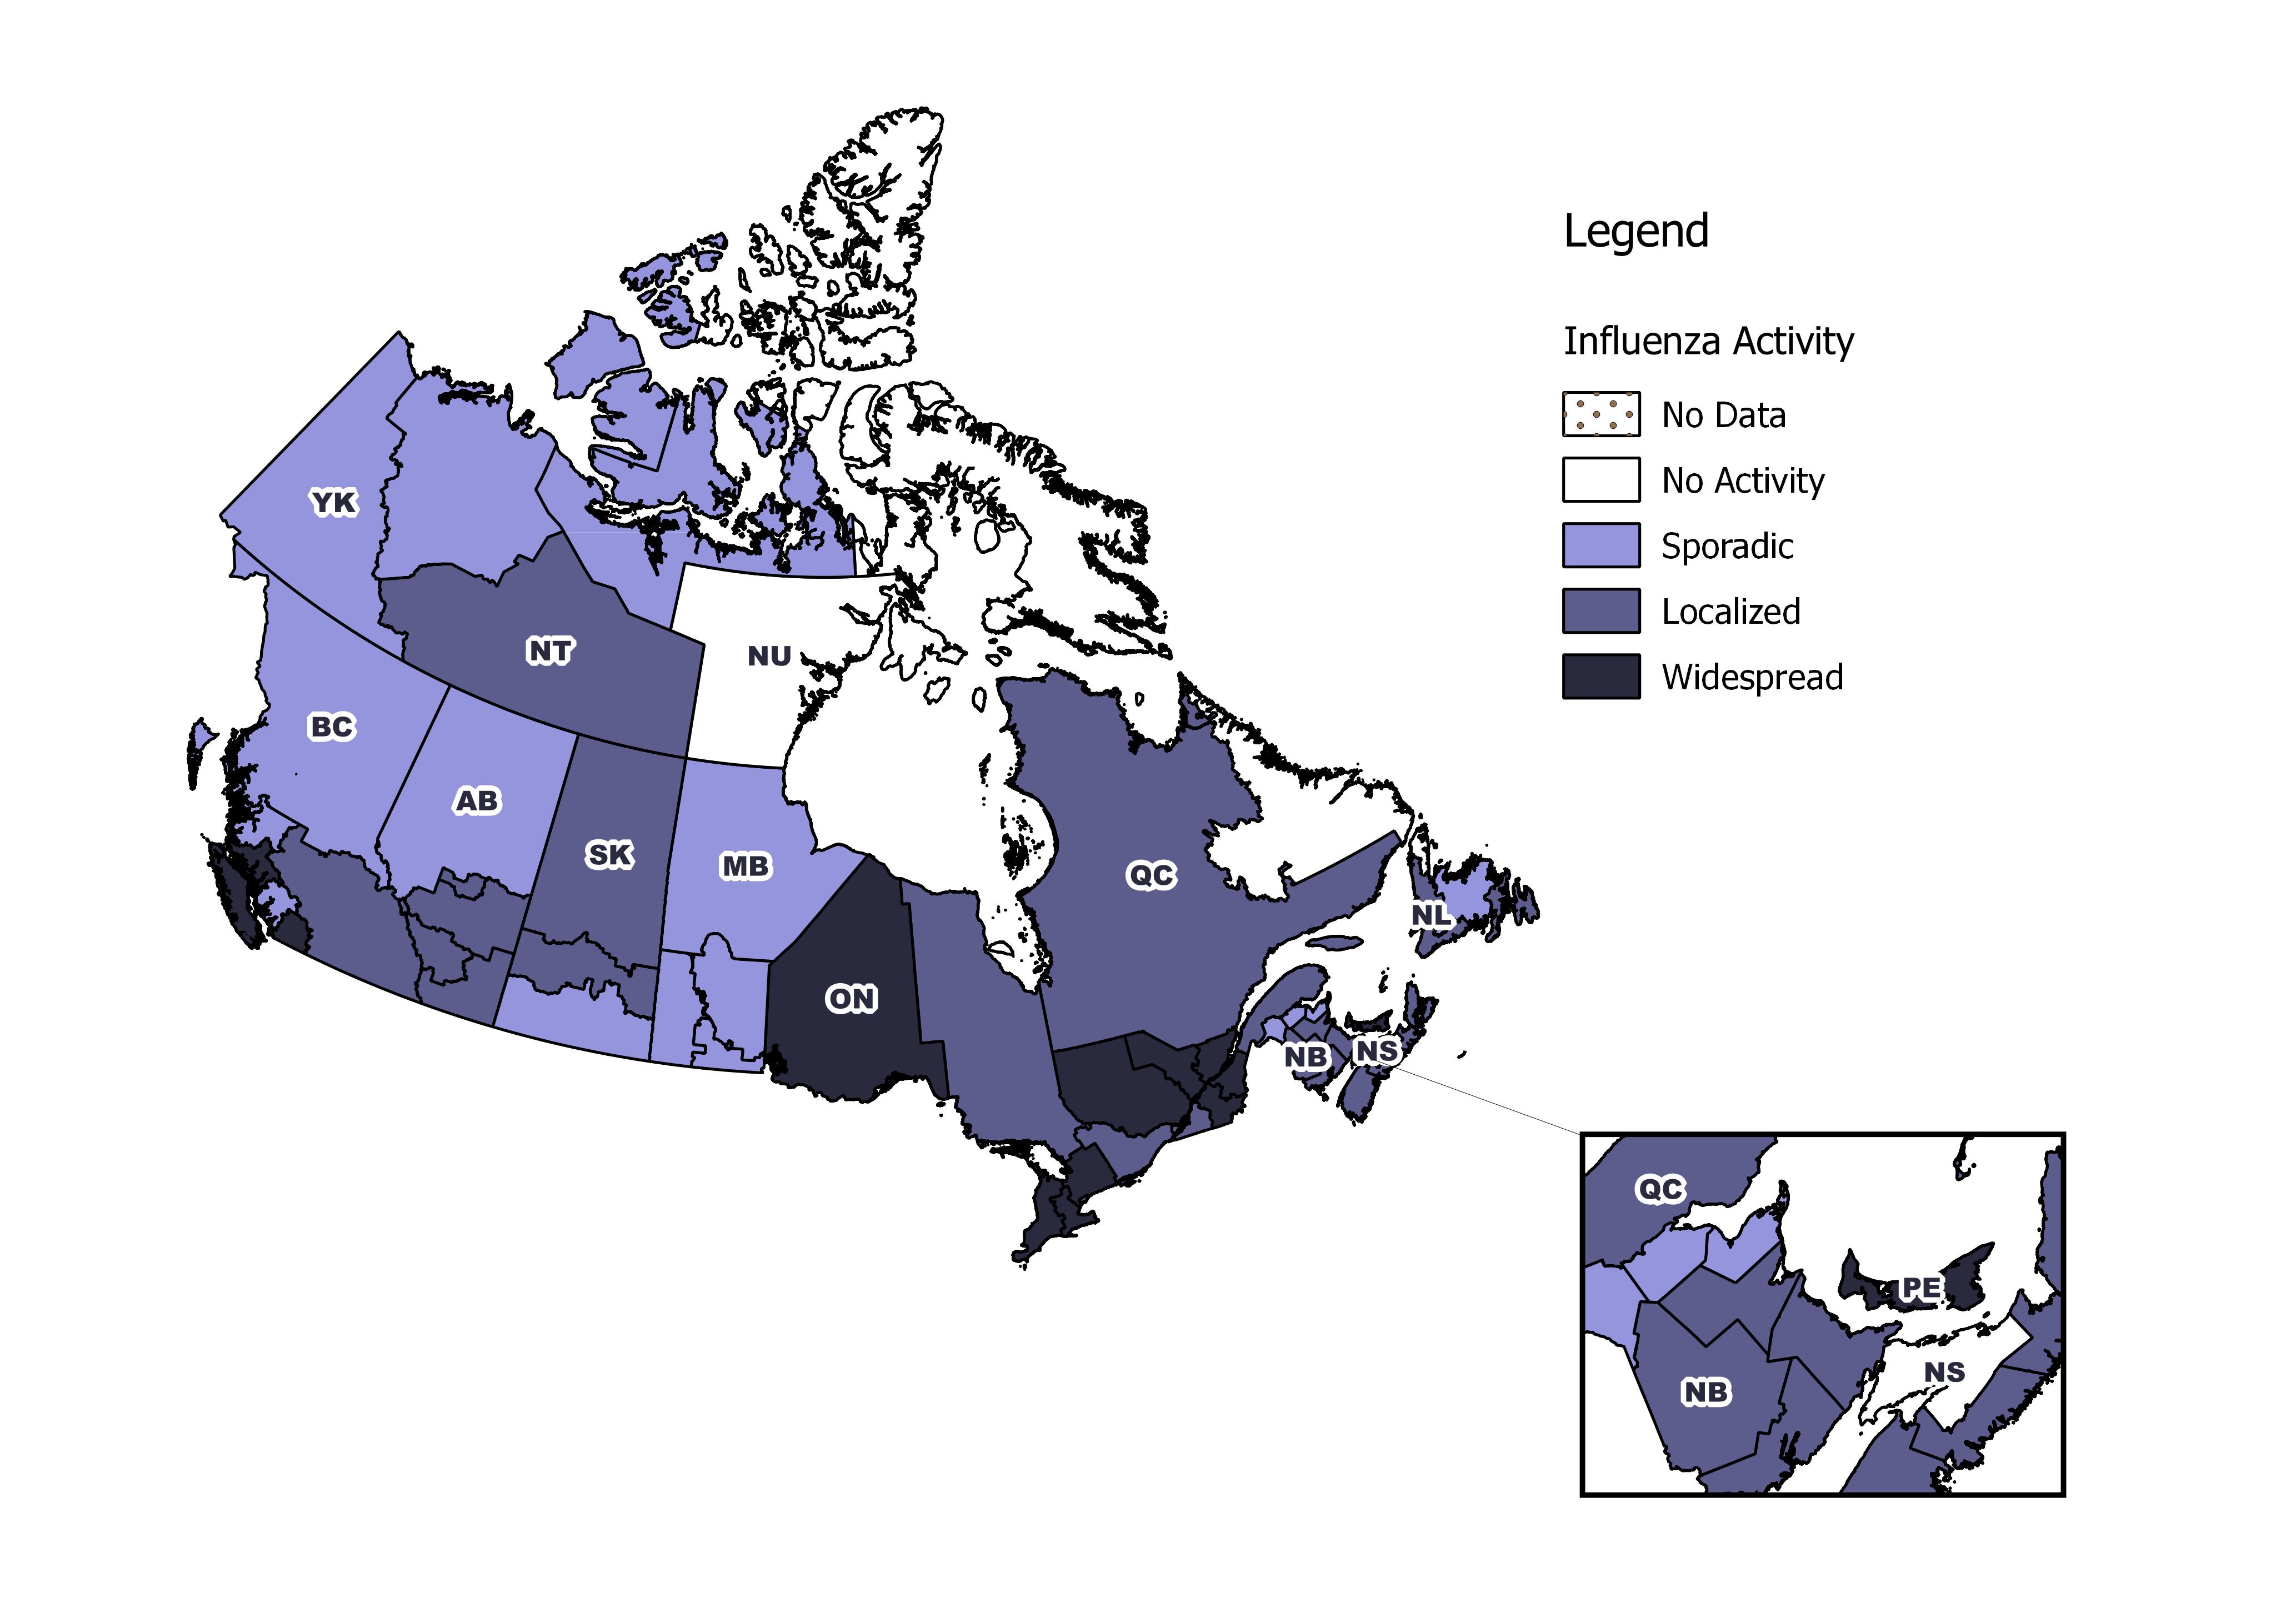
[h=2]Influenza/Influenza-like Illness Activity (geographic spread)[/h] In week 03, a similar number of regions reported localized or widespread influenza activity compared to the previous week. Among the 53 regions reporting data for week 03, 11 regions (BC(2), ON(4), QC(4), and PE (1)) reported widespread activity, and 23 regions (BC(1), AB(4), SK(2), MB(1), ON(3), QC(2), NB(4), NS(3), NL(2), and NT(1)) reported localized activity.


pub-eng.jpg

Download the alternative format
(PDF format, 658 KB, 10 pages)
Organization:
Public Health Agency of Canada
Date published: 2018-01-26

[h=5]Related Topics[/h]


[h=3]Figure 1 - Map of overall influenza/ILI activity level by province and territory, Canada, week 2018-03[/h]
fig1-eng.jpg
Note: Influenza/ILI activity levels, as represented on this map, are assigned and reported by Provincial and Territorial Ministries of Health, based on laboratory confirmations, sentinel ILI rates and reported outbreaks. Please refer to detailed definitions at the end of the report. Maps from previous weeks, including any retrospective updates, are available in the mapping feature found in the Weekly Influenza Reports.
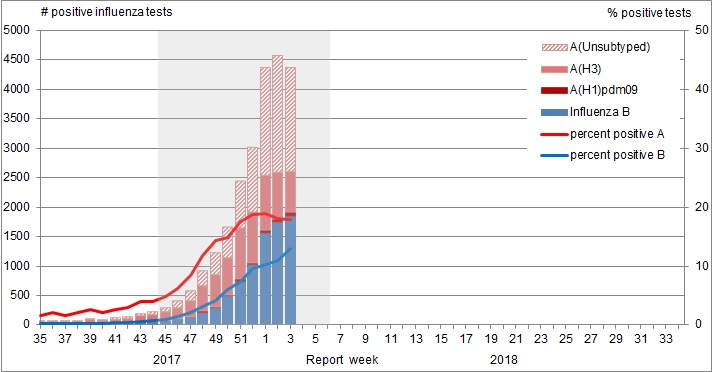
Figure 1 - Text Description [h=2]Laboratory-Confirmed Influenza Detections[/h] In week 03, the percentage of tests positive for influenza increased slightly from 29% in week 02 to 31% in week 03. This increase is mainly driven by influenza B activity: the percentage of test positive for influenza B increased from 11% in week 02 to 13% in week 03. Influenza B detections to date are higher than has been observed over the past seven seasons.
The percentage of test positive for influenza A remained stable at 18% since week 02. The stablization of influenza A detections over the past two weeks may indicate that the peak of the season for influenza A detections occurred in week 01.
The number (2,533) and percentage (18%) of influenza A detections for week 03 are within the range of expected levels for this time of year. The number (1,835) and percentage of tests (13%) positive for influenza B in week 03 continue to be well above expected levels for this time of year. For data on other respiratory virus detections, see the Respiratory Virus Detections in Canada Report. [h=3]Figure 2 - Number of positive influenza tests and percentage of tests positive, by type, subtype and report week, Canada, weeks 2017-35 to 2018-03[/h]
fig2-eng.jpg
The shaded area indicates weeks where the positivity rate was at least 5% and a minimum of 15 positive tests were observed, signalling the period of seasonal influenza activity.
Figure 2 - Text Description To date this season, 24,749 laboratory-confirmed influenza detections have been reported, of which 67% have been influenza A. Influenza A(H3N2) has been the most common subtype detected this season, representing 94% of subtyped influenza A detections. For more detailed weekly and cumulative influenza data, see the text descriptions for Figures 2 and 3 or the Respiratory Virus Detections in Canada Report.
[h=3]Figure 3 - Cumulative numbers of positive influenza specimens by type/subtype and province/territory, Canada, weeks 2017-35 to 2018-03[/h]
fig3-eng.jpg
Figure 3 - Text Description To date this season, detailed information on age and type/subtype has been received for 21,369 laboratory-confirmed influenza cases (Table 1). Among all influenza cases with reported age and type/subtype information, 50% have been reported in adults 65 years of age and older. Among cases of influenza A(H3N2), adults 65 years of age and older represented 53% of cases. Cases of influenza B this season were distributed more evenly across all age-groups, but the largest proportion of cases was still among adults 65 years of age and older (46%), followed by adults 45-64 years of age (22%).
[TABLE="class: table table-striped table-bordered table-hover table-condensed, width: 1140"]
Table 1 - Weekly and cumulative numbers of positive influenza specimens by type, subtype and age-group reported through case-based laboratory reporting, Canada, weeks 2017-35 to 2018-03 [TR="class: bg-primary, bgcolor: #2572B4"]
Age groups (years) Cumulative (August 27, 2017 to January 20, 2018) [/TR]
[TR="class: bg-primary, bgcolor: #2572B4"]
Influenza A B Influenza A and B [/TR]
[TR="class: bg-primary, bgcolor: #2572B4"]
A Total A(H1) pdm09 A(H3) A (UnS)Table 1 Footnote1 Total # % [/TR]
[TR="bgcolor: #F5F5F5"]
0-4 [TD]1208[/TD]
[TD]64[/TD]
[TD]469[/TD]
[TD]675[/TD]
[TD]391[/TD]
[TD]1599[/TD]
[TD]7%[/TD]
[/TR]
[TR]
5-19 [TD]1117[/TD]
[TD]55[/TD]
[TD]512[/TD]
[TD]550[/TD]
[TD]808[/TD]
[TD]1925[/TD]
[TD]9%[/TD]
[/TR]
[TR="bgcolor: #F5F5F5"]
20-44 [TD]2323[/TD]
[TD]101[/TD]
[TD]1001[/TD]
[TD]1221[/TD]
[TD]971[/TD]
[TD]3294[/TD]
[TD]15%[/TD]
[/TR]
[TR]
45-64 [TD]2436[/TD]
[TD]88[/TD]
[TD]1059[/TD]
[TD]1289[/TD]
[TD]1522[/TD]
[TD]3958[/TD]
[TD]19%[/TD]
[/TR]
[TR="bgcolor: #F5F5F5"]
65+ [TD]7454[/TD]
[TD]47[/TD]
[TD]3475[/TD]
[TD]3932[/TD]
[TD]3139[/TD]
[TD]10593[/TD]
[TD]50%[/TD]
[/TR]
[TR]
Total [TD]14538[/TD]
[TD]355[/TD]
[TD]6516[/TD]
[TD]7667[/TD]
[TD]6831[/TD]
[TD]21369[/TD]
[TD]100%[/TD]
[/TR]
[TR]
[TD="colspan: 8"] Table 1 Footnote 1 UnS: unsubtyped: The specimen was typed as influenza A, but no result for subtyping was available;
Return to table 1 footnote1referrer

[/TD]
[/TR]
[/TABLE]
[h=2]Syndromic/Influenza-like Illness Surveillance[/h] [h=3]Healthcare Professionals Sentinel Syndromic Surveillance[/h] In week 03, 3% of visits to healthcare professionals were due to influenza-like illness (ILI); a decrease compared to the previous week, and slightly above the 5-year average.
[h=3]Figure 4 - Percentage of visits for ILI reported by sentinels by report week, Canada, weeks 2017-35 to 2018-03[/h] Number of Sentinels Reporting in Week 03: 153
fig4-eng.jpg
The shaded area represents the maximum and minimum percentage of visits for ILI reported by week from seasons 2012-13 to 2017-18
Figure 4 - Text Description [h=3]Participatory Syndromic Surveillance[/h] FluWatchers is a participatory ILI surveillance system that relies on weekly voluntary submissions of syndromic information from Canadians across Canada.
In week 03, 1,469 participants reported to FluWatchers, of which 5% reported symptoms of cough and fever, and 31% of these consulted a healthcare professional. Among participants who reported cough and fever, 90% reported days missed from work or school, resulting in a combined total of 223 missed days of work or school.
[TABLE="class: table table-striped table-bordered table-hover table-condensed, width: 1140"]
Table 2 - Summary of influenza-like illness symptoms reported by participating Canadians, Canada, week 2018-03 [TR="class: bg-primary, bgcolor: #2572B4"]
Number of Participants Reporting Percentage participants reporting Cough and Fever Percentage of participants with cough and fever who consulted a healthcare professional Percentage of participants with cough and fever who reported missed days from work or school Number of missed days from work or school [/TR]
[TR="class: text-center, bgcolor: #F5F5F5"]
[TD]1469[/TD]
[TD]5%[/TD]
[TD]31%[/TD]
[TD]90%[/TD]
[TD]223[/TD]
[/TR]
[/TABLE]
[h=2]Influenza Outbreak Surveillance[/h] In week 03, the number of reported laboratory-confirmed outbreaks of influenza decreased compared to the previous week. In week 03, 137 new influenza outbreaks were reported: 78 in long-term care facilities, 14 in hospitals, and 45 in other settings. In addition, one ILI outbreak was reported in a school. Among the 129 outbreaks with influenza type/subtype reported, 52 (40%) were associated with influenza B, and 72 were associated with influenza A, of which 22 were influenza A(H3N2) and 50 influenza A(unsubtyped). Five outbreaks were associated with a mix of influenza A and B.
To date this season, 802 influenza/ILI outbreaks have been reported, of which 471 (59%) occurred in LTC facilities. Among the 696 outbreaks for which the influenza type/subtype was reported, 436 were associated with influenza A (of which 197 were A(H3N2), 238 were A(unsubtyped) and one was A(H1N1)pdm09), 232 were associated with influenza B, and 28 were associated with a mix of A and B. Compared to recent influenza A(H3N2) seasons at week 03, the number of cumulative outbreaks reported this season has been greater than during the 2016-17 and 2012-13 seasons, and lower compared to the 2014-15 season.
[h=3]Figure 5 - Number of new outbreaks of laboratory-confirmed influenza by report week, Canada, weeks 2017-35 to 2018-03[/h]
fig5-eng.jpg
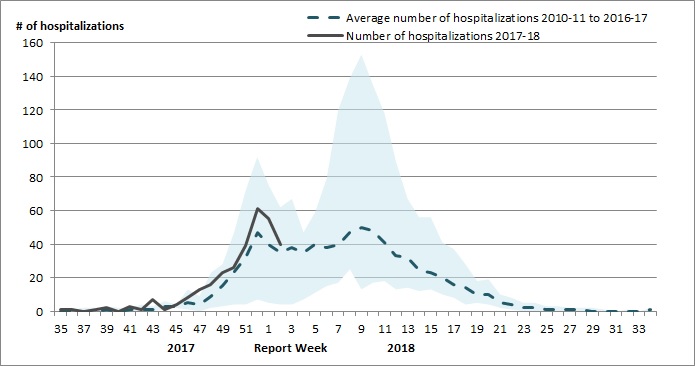
Figure 5 - Text Description [h=2]Severe Outcomes Influenza Surveillance[/h] [h=3]Provincial/Territorial Influenza Hospitalizations and Deaths[/h] In week 03, 182 influenza-associated hospitalizations were reported by participating provinces and territories1. In keeping with the early influenza activity this season, the number of hospitalizations is considerably elevated relative to the same period in the previous two seasons.
To date this season, 2,643 influenza-associated hospitalizations have been reported, 80% of which were associated with influenza A, and 1,814 cases (69%) were in adults 65 years of age or older. To date, 241 ICU admissions and 110 deaths have been reported.
[h=3]Figure 6 - Cumulative numbers of hospitalizations by age-group reported by participating provinces and territoriesfigure 6 note1, weeks 2017-35 to 2018-03[/h]
fig6-eng.jpg
Figure 6 - Text Description Figure 6 note 1 Influenza-associated hospitalizations are reported by NL, PE, NS, NB, MB, AB, YT and NT. Only hospitalizations that require intensive medical care are reported by SK.
Return to figure 6 note1referrer

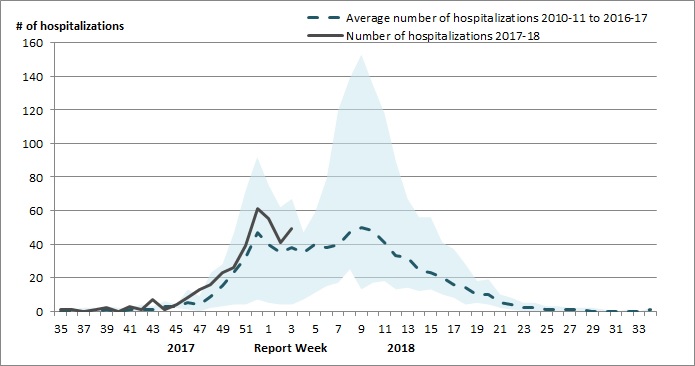
[h=3]Pediatric Influenza Hospitalizations and Deaths[/h] In week 03, the number of laboratory-confirmed influenza-associated pediatric (≤16 years of age) hospitalizations reported by the Immunization Monitoring Program Active (IMPACT) network increased compared to the previous week. In week 03, 49 hospitaliations were reported, of which 40 (82%) were due to influenza A. The number of weekly hospitalizations has been above the seven-season average since week 45, but following seasonal patterns.
To date this season, 354 pediatric hospitalizations have been reported by the IMPACT network, 250 (71%) of which were associated with influenza A. Fifty-eight ICU admissions and fewer than five deaths have been reported. Compared to the cumulative number of pediatric hospitalizations reported up to week 03 during recent influenza A(H3N2)-dominant seasons, the cumulative number of pediatric hospitalizations reported this season has been greater than the 2016-17 season, but below the 2014-15 and 2012-13 seasons.
[h=3]Figure 7 - Cumulative numbers of pediatric hospitalizations (≤16 years of age) with influenza by type and age-group reported by the IMPACT network, Canada, weeks 2017-35 to 2018-03[/h]
fig7-eng.jpg
Figure 7 - Text Description [h=3]Figure 8 - Number of pediatric hospitalizations (≤16 years of age) with influenza reported by the IMPACT network, by week, Canada, weeks 2017-35 to 2018-03[/h]
fig8-eng.jpg
Figure 8 - Text Description Figure 8 Footnote 1 The shaded area represents the maximum and minimum number of cases reported by week from seasons 2010-11 to 2017-18
Return to figure 8 note1referrer

[h=2]Influenza Strain Characterizations[/h] During the 2017-18 influenza season, the National Microbiology Laboratory (NML) has characterized 583 influenza viruses [318 A(H3N2), 42 A(H1N1)pdm09 and 223 B viruses] that were received from Canadian laboratories.
[h=3]Antigenic Characterization[/h] Among influenza viruses characterized by hemagglutination inhibition assay during the 2017-18 season, most viruses were antigenically similar to the cell-culture propagated reference strains recommended by WHO.
[TABLE="class: table table-striped table-bordered table-hover table-condensed, width: 1140"]
Table 3 - Influenza antigenic strain characterizations, Canada, weeks 2017-35 to 2018-03 [TR="class: bg-primary, bgcolor: #2572B4"]
Strain Characterization Results Count Description [/TR]
[TR="bgcolor: #F5F5F5"]
Influenza A (H3N2) [/TR]
[TR]
[TD]A/Hong Kong/4801/2014-like[/TD]
[TD]83[/TD]
[TD]Viruses antigenically similar to A/Hong Kong/4801/2014, the A(H3N2) component of the 2017-18 Northern Hemisphere's trivalent and quadrivalent vaccine.[/TD]
[/TR]
[TR="bgcolor: #F5F5F5"]
[TD]Reduced titer to A/Hong Kong/4801/2014[/TD]
[TD]1[/TD]
[TD]These A(H3N2) viruses reacted poorly with antisera raised against cell-propagated A/Hong Kong/4801/2014, suggesting some antigenic differences.[/TD]
[/TR]
[TR="bgcolor: #F5F5F5"]
Influenza A (H1N1) [/TR]
[TR]
[TD]A/Michigan/45/2015-like[/TD]
[TD]42[/TD]
[TD]Viruses antigenically similar to A/Michigan/45/2015, the A(H1N1) component of the 2017-18 Northern Hemisphere's trivalent and quadrivalent influenza vaccine.[/TD]
[/TR]
[TR="bgcolor: #F5F5F5"]
Influenza B [/TR]
[TR]
[TD]B/Brisbane/60/2008-like
(Victoria lineage)[/TD]
[TD]5[/TD]
[TD]Viruses antigenically similar to B/Brisbane/60/2008.
B/Brisbane/60/2008 is the influenza B component of the 2017-18 Northern Hemisphere's trivalent and quadrivalent influenza vaccine.[/TD]
[/TR]
[TR="bgcolor: #F5F5F5"]
[TD]Reduced titer to B/Brisbane/60/2008
(Victoria lineage)[/TD]
[TD]6[/TD]
[TD]These B/Victoria lineage viruses reacted poorly with antisera raised against cell-propagated B/Brisbane/60/2008, suggesting some antigenic differences.[/TD]
[/TR]
[TR]
[TD]B/Phuket/3073/2013-like
(Yamagata lineage)[/TD]
[TD]212[/TD]
[TD]Viruses antigenically similar to B/Phuket/3073/2013, the additional influenza B component of the 2017-18 Northern Hemisphere quadrivalent influenza vaccine.[/TD]
[/TR]
[/TABLE]
[h=3]Genetic Characterization of A(H3N2) viruses[/h] During the 2017-18 season, 234 A(H3N2) viruses did not grow to sufficient titers for antigenic characterization by HI assay. Therefore, genetic characterization was performed to determine to which genetic group they belong. Sequence analysis showed that 191 A(H3N2) viruses belonged to genetic group 3C.2a, 42 viruses belonged to subclade 3C.2a1 and one virus belonged to the clade 3C.3a.
Additionally, of the 83 influenza A(H3N2) viruses that were characterized antigenically as similar to A/Hong Kong/4801/2014, 60 belonged to genetic group 3C.2a and 11 viruses belonged to subclade 3C.2a1. The virus that showed reduced titer belonged to genetic clade 3C.3a. Sequencing is pending for the remaining 12 virus isolates.
A/Hong Kong/4801/2014-like virus belongs to genetic group 3C.2a and is the influenza A/H3N2 component of the 2017-18 Northern Hemisphere influenza vaccine.
[h=3]Genetic Characterization of Influenza B viruses[/h] Among the viruses characterized antigenically as having reduced titer to ferret antisera produced against cell-propagated B/Brisbane/60/2008, sequence analysis showed that all six viruses had a two amino acid deletion in the HA gene.
...

https://www.canada.ca/en/public-hea...watch/2017-2018/week3-january-14-20-2018.html
 
[h=1]FluWatch report: January 21, 2018 to January 27, 2018 (week 4)[/h]
week4-january-21-27-2018.jpg

Download the alternative format
(PDF format, 1017 KB, 10 pages)
Organization:
Public Health Agency of Canada
Date published: 2018-02-02

[h=5]Related Topics[/h]


[h=5]Overall Summary[/h]
  • Overall, influenza activity in Canada remains at peak levels but there are signs that activity is starting to slow down in parts of the country.
  • The majority of influenza detections continue to be A(H3N2), although 40% of detections were influenza B in week 04.
  • To date this season, the majority of lab confirmations, hospitalizations and deaths have been among adults 65 years of age and older.
  • A Canadian study reported a mid-season estimate of influenza vaccine effectiveness of 42% overall. The study confirmed an anticipated low vaccine effectiveness of 17% against the A(H3N2) strain and moderate vaccine effectiveness against influenza B of 55%, which is circulating at high levels in Canada this season.
  • For more information on the flu, see our Flu(influenza) web page.
[h=2]On this page[/h]
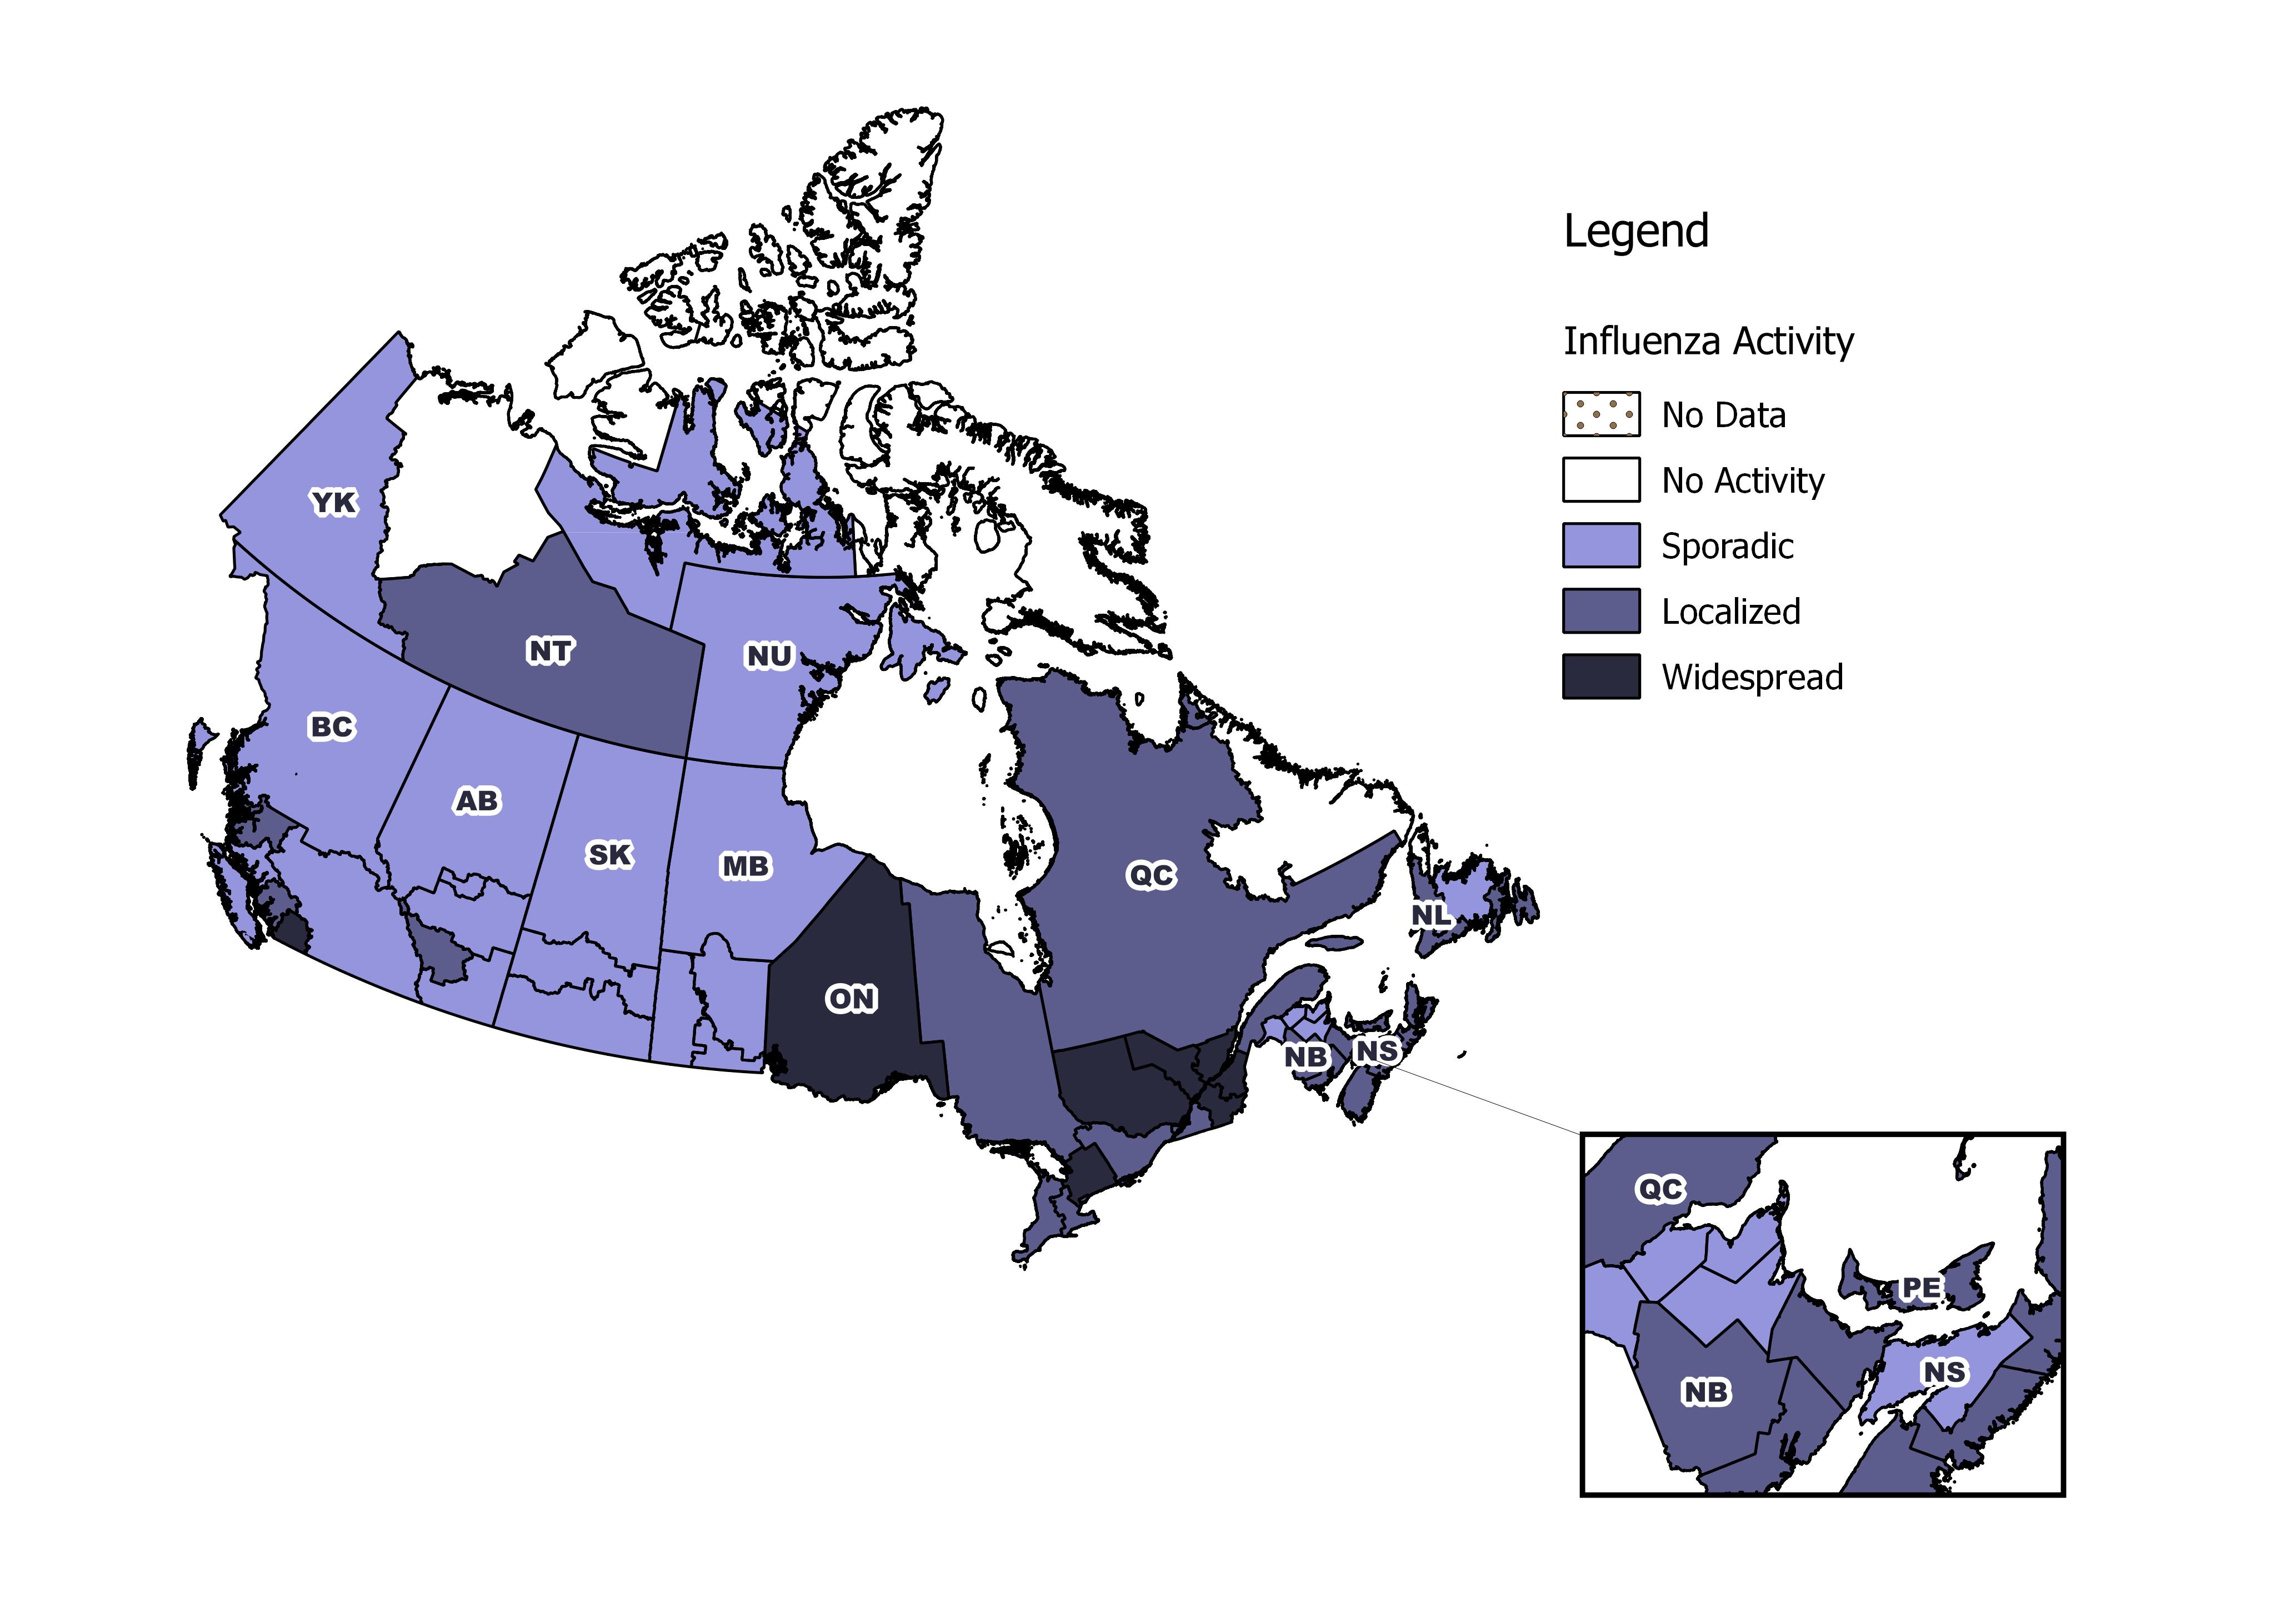
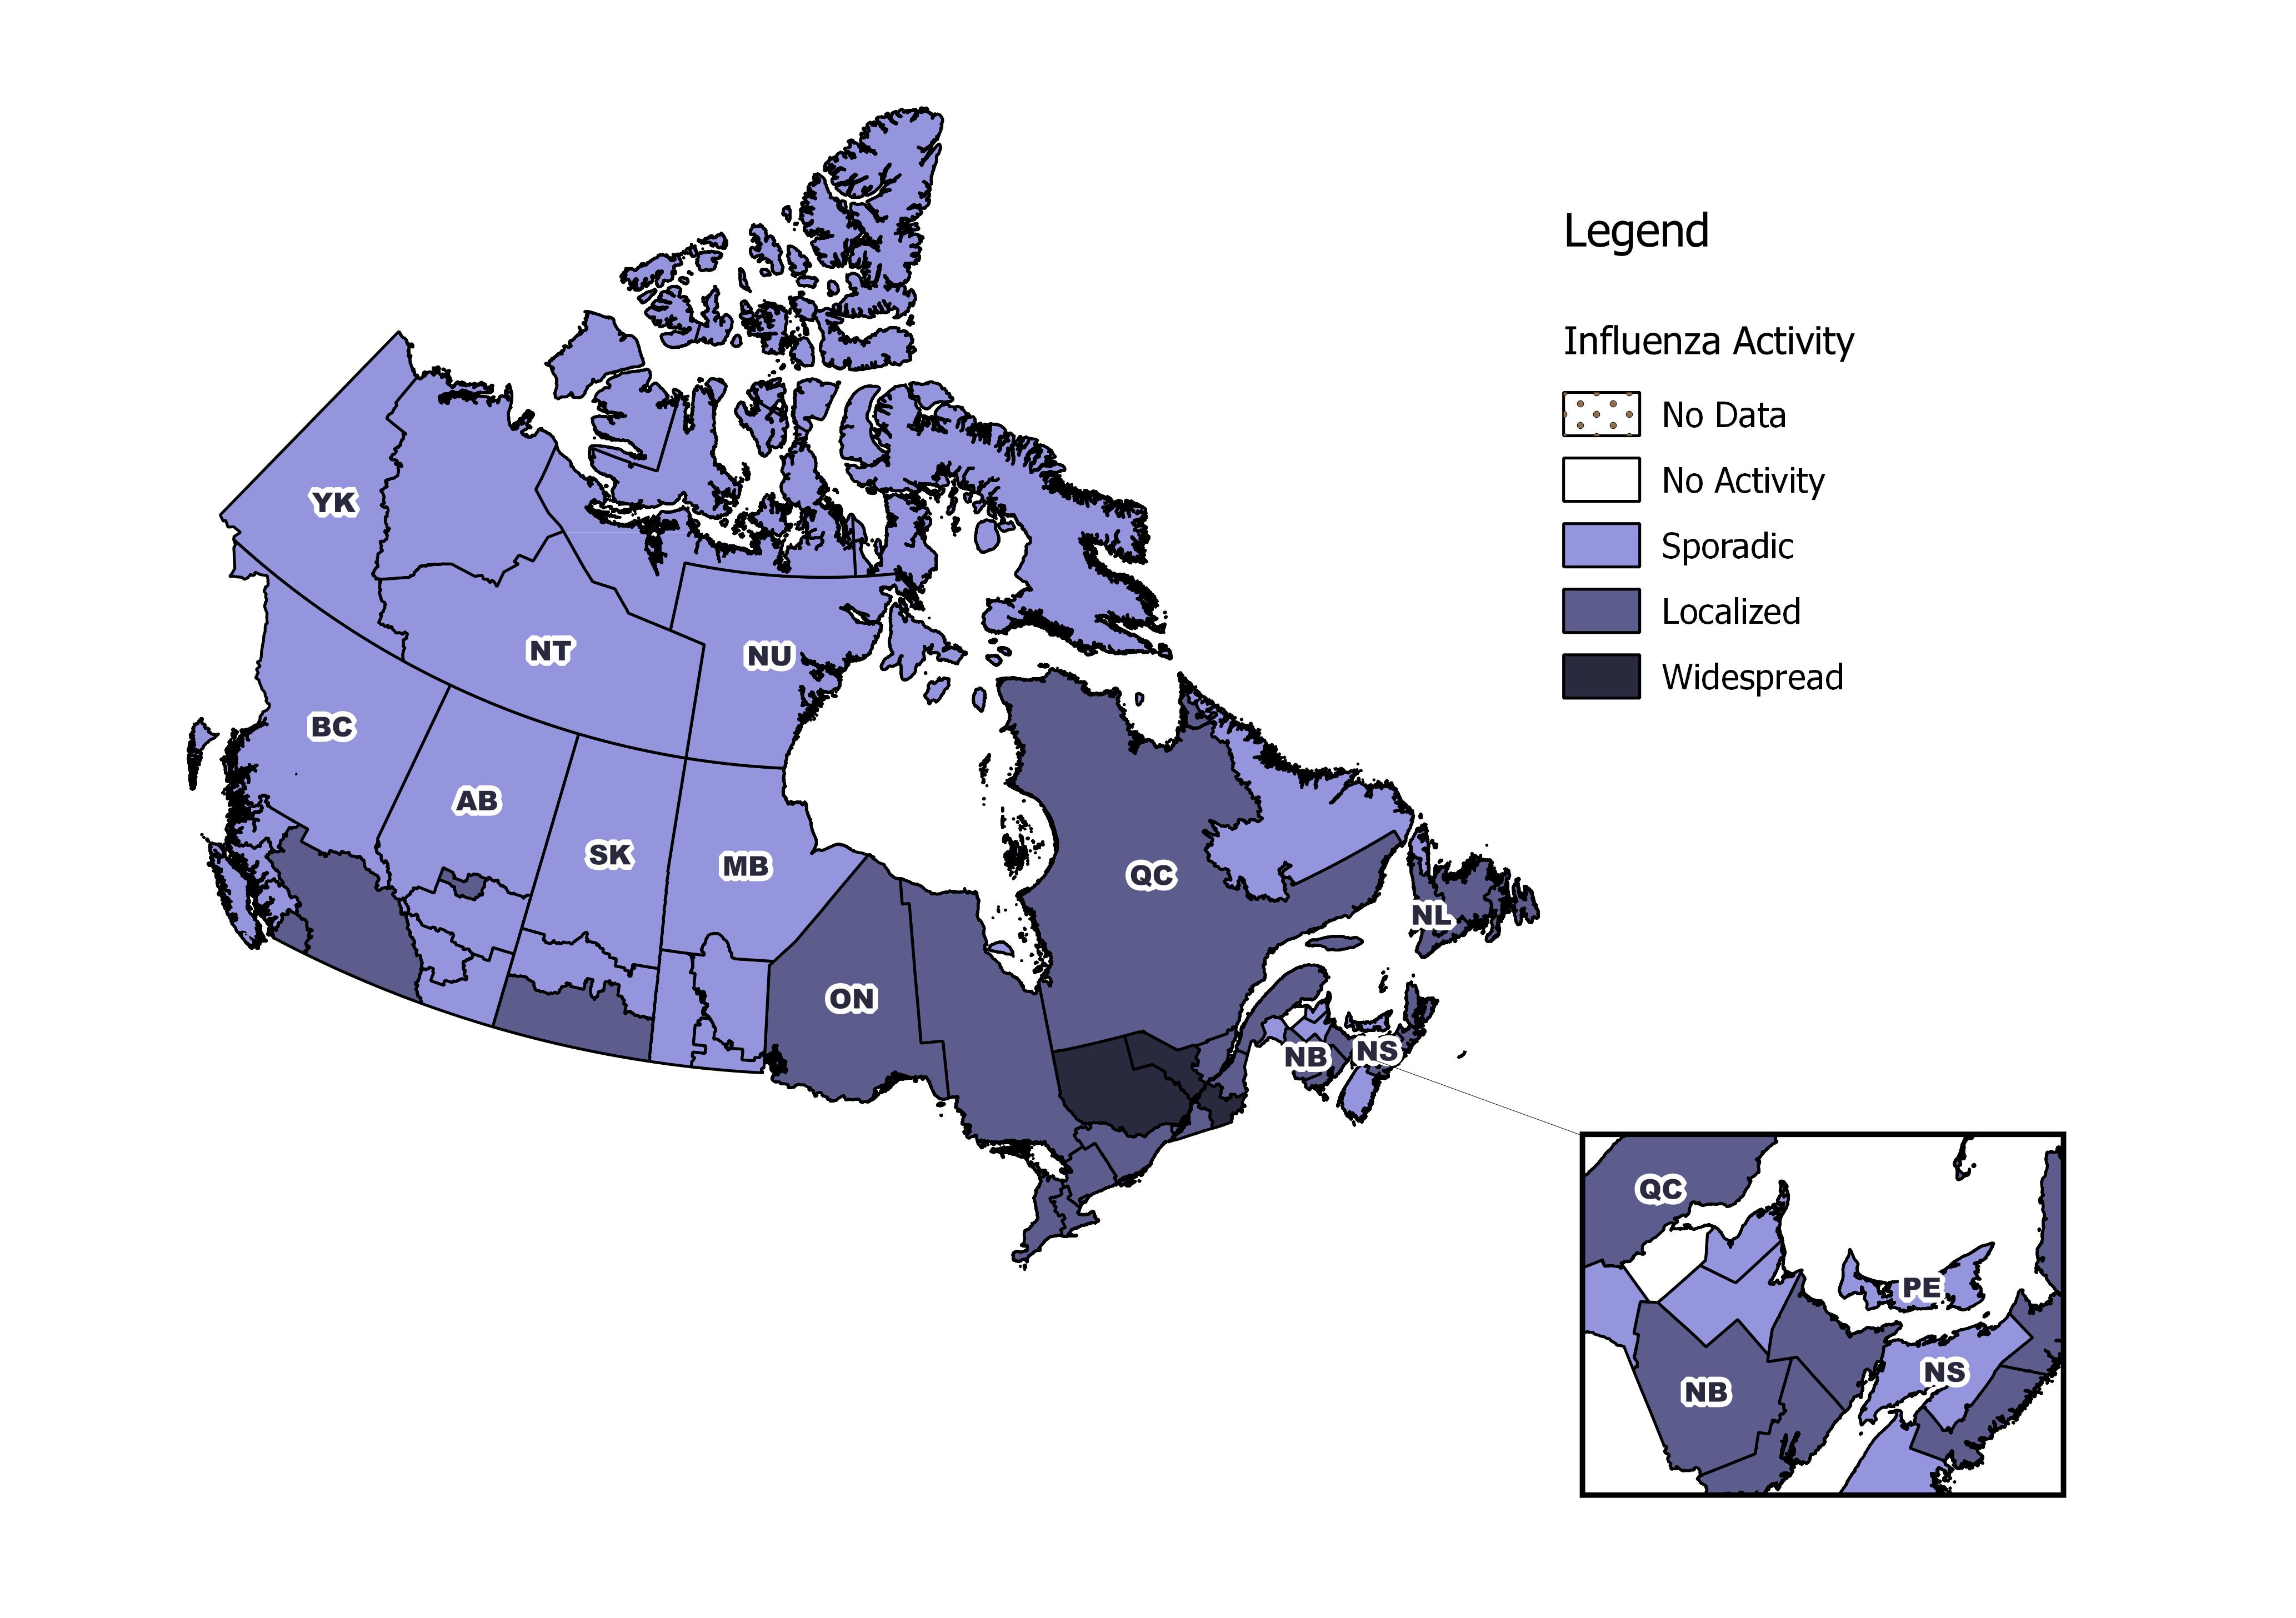
[h=2]Influenza/Influenza-like Illness Activity (geographic spread)[/h] In week 04, a similar number of regions reported localized or widespread influenza activity compared to the previous week. Among the 53 regions reporting data for week 04, 6 regions (BC(1), ON(2), QC(3)) reported widespread activity, and 21 regions (BC(1), AB(1), MB(1), ON(5), QC(3), NB(4), NS(3), NL(2), and NT(1)) reported localized activity.


[h=3]Figure 1 - Map of overall influenza/ILI activity level by province and territory, Canada, week 2018-04[/h]
fig1-eng.jpg
Note: Influenza/ILI activity levels, as represented on this map, are assigned and reported by Provincial and Territorial Ministries of Health, based on laboratory confirmations, sentinel ILI rates and reported outbreaks. Please refer to detailed definitions at the end of the report. Maps from previous weeks, including any retrospective updates, are available in the mapping feature found in the Weekly Influenza Reports.
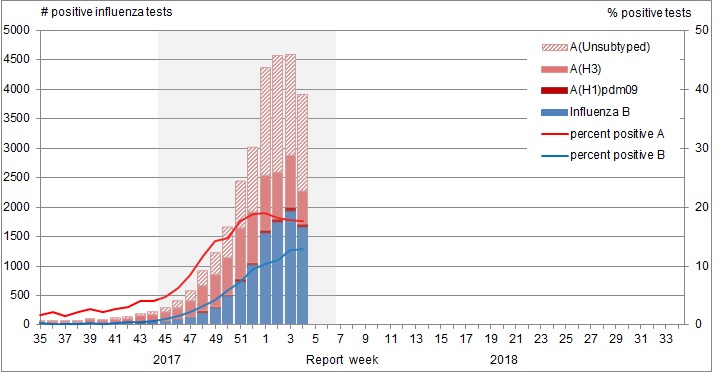
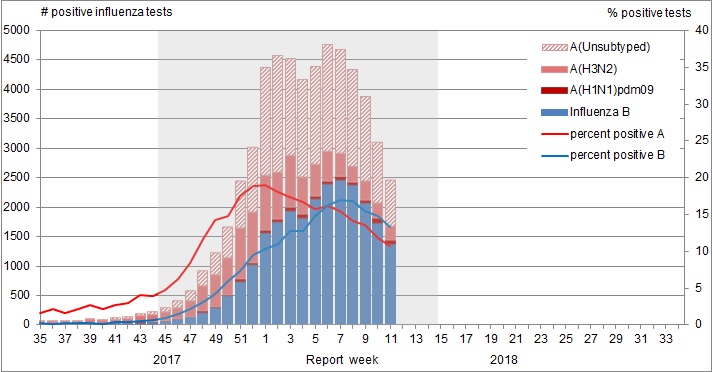
Figure 1 - Text Description [h=2]Laboratory-Confirmed Influenza Detections[/h] In week 04, the overall percentage of tests positive for influenza remained similar to the previous week at 31%. Since week 02, the percentage of tests positive for influenza A has remained stable at 18%. This suggests that the peak for influenza A detections occurred in week 01 (19%). The percentage of tests positive for influenza B remained similar to the previous week.
The percentage of influenza A detections for week 04 is average for this time of year. The percentage of tests positive for influenza B in week 04 continue to be well above expected levels for this time of year. For data on other respiratory virus detections, see the Respiratory Virus Detections in Canada Report.
[h=3]Figure 2 - Number of positive influenza tests and percentage of tests positive, by type, subtype and report week, Canada, weeks 2017-35 to 2018-04[/h]
fig2-eng.jpg
The shaded area indicates weeks where the positivity rate was at least 5% and a minimum of 15 positive tests were observed, signalling the period of seasonal influenza activity.
Figure 2 - Text Description To date this season, 28,729 laboratory-confirmed influenza detections have been reported, of which 66% have been influenza A. Influenza A(H3N2) has been the most common subtype detected this season, representing 94% of subtyped influenza A detections. For more detailed weekly and cumulative influenza data, see the text descriptions for Figures 2 and 3 or the Respiratory Virus Detections in Canada Report.
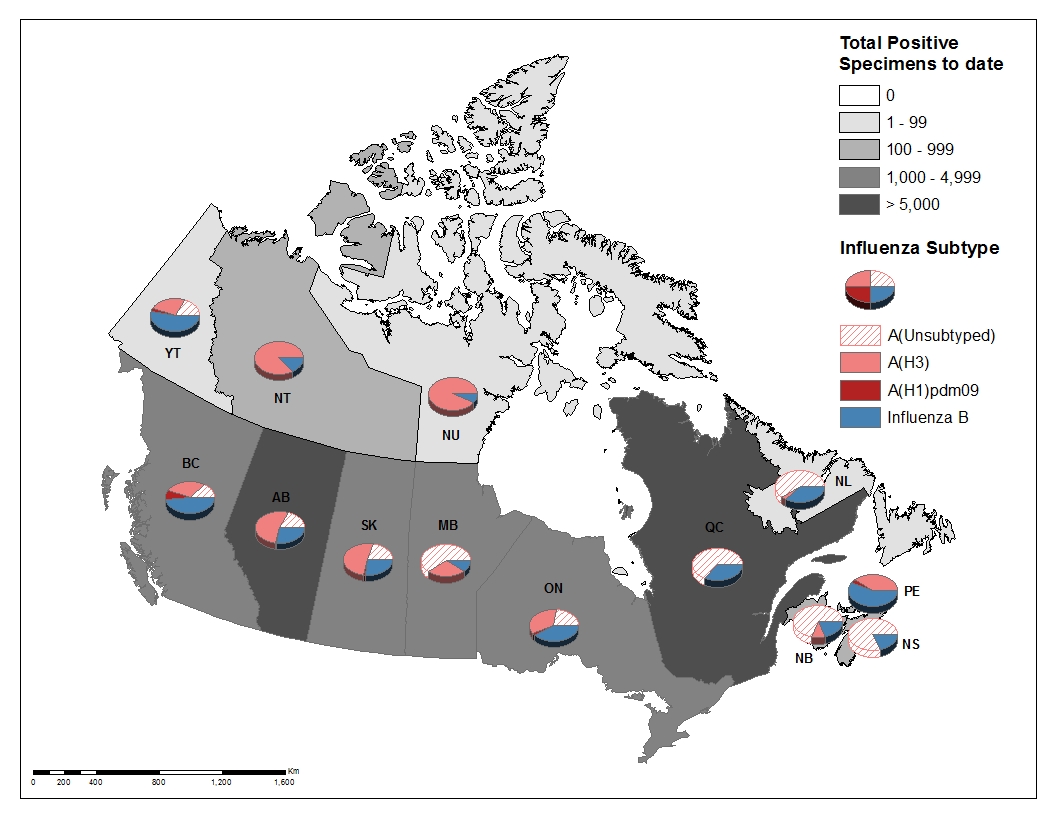
[h=3]Figure 3 - Cumulative numbers of positive influenza specimens by type/subtype and province/territory, Canada, weeks 2017-35 to 2018-04[/h]
fig3-eng.jpg
Figure 3 - Text Description To date this season, detailed information on age and type/subtype has been received for 25,244 laboratory-confirmed influenza cases (Table 1). Adults 65 years of age and older represent the largest proportion of cases overall (50%), and among cases of influenza A(H3N2) (54%) and influenza B (46%). Adults aged 20-64 represent 33% of cases overall and 31% of influenza A(H3N2) and 36% of influenza B cases. Although much smaller in numbers (402), the majority of influenza A(H1N1) cases are among adults less than 65 years of age, with adults aged 20-64 and children 0-19 years accounting for 53% and 33% of cases respectively.
[TABLE="class: table table-striped table-bordered table-hover table-condensed, width: 1140"]
Table 1 - Weekly and cumulative numbers of positive influenza specimens by type, subtype and age-group reported through case-based laboratory reporting, Canada, weeks 2017-35 to 2018-04 [TR="class: bg-primary, bgcolor: #2572B4"]
Age groups (years) Cumulative (August 27, 2017 to January 27, 2018) [/TR]
[TR="class: bg-primary, bgcolor: #2572B4"]
Influenza A B Influenza A and B [/TR]
[TR="class: bg-primary, bgcolor: #2572B4"]
A Total A(H1) pdm09 A(H3) A (UnS)Table 1 Footnote1 Total # % [/TR]
[TR="bgcolor: #F5F5F5"]
0-4 [TD]1461[/TD]
[TD]72[/TD]
[TD]505[/TD]
[TD]884[/TD]
[TD]496[/TD]
[TD]1957[/TD]
[TD]8%[/TD]
[/TR]
[TR]
5-19 [TD]1302[/TD]
[TD]62[/TD]
[TD]550[/TD]
[TD]690[/TD]
[TD]1038[/TD]
[TD]2340[/TD]
[TD]9%[/TD]
[/TR]
[TR="bgcolor: #F5F5F5"]
20-44 [TD]2690[/TD]
[TD]114[/TD]
[TD]1093[/TD]
[TD]1483[/TD]
[TD]1175[/TD]
[TD]3865[/TD]
[TD]15%[/TD]
[/TR]
[TR]
45-64 [TD]2761[/TD]
[TD]100[/TD]
[TD]1156[/TD]
[TD]1505[/TD]
[TD]1813[/TD]
[TD]4574[/TD]
[TD]18%[/TD]
[/TR]
[TR="bgcolor: #F5F5F5"]
65+ [TD]8715[/TD]
[TD]54[/TD]
[TD]3839[/TD]
[TD]4822[/TD]
[TD]3793[/TD]
[TD]12508[/TD]
[TD]50%[/TD]
[/TR]
[TR]
Total [TD]16929[/TD]
[TD]402[/TD]
[TD]7143[/TD]
[TD]9384[/TD]
[TD]8315[/TD]
[TD]25244[/TD]
[TD]100%[/TD]
[/TR]
[TR]
[TD="colspan: 8"] Table 1 Footnote 1 UnS: unsubtyped: The specimen was typed as influenza A, but no result for subtyping was available;
Return to table 1 footnote1referrer

[/TD]
[/TR]
[/TABLE]
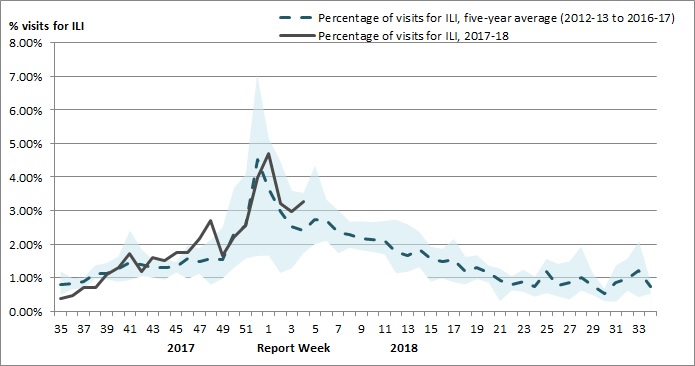
[h=2]Syndromic/Influenza-like Illness Surveillance[/h] [h=3]Healthcare Professionals Sentinel Syndromic Surveillance[/h] In week 04, 3% of visits to healthcare professionals were due to influenza-like illness (ILI); a slight increase compared to the previous week, and slightly above the 5-year average.
[h=3]Figure 4 - Percentage of visits for ILI reported by sentinels by report week, Canada, weeks 2017-35 to 2018-04[/h] Number of Sentinels Reporting in Week 04: 140
fig4-eng.jpg
The shaded area represents the maximum and minimum percentage of visits for ILI reported by week from seasons 2012-13 to 2017-18
Figure 4 - Text Description [h=3]Participatory Syndromic Surveillance[/h] FluWatchers is a participatory ILI surveillance system that relies on weekly voluntary submissions of syndromic information from Canadians across Canada.
In week 04, 1,479 participants reported to FluWatchers, of which 4% reported symptoms of cough and fever, and 29% of these consulted a healthcare professional. Among participants who reported cough and fever, 73% reported days missed from work or school, resulting in a combined total of 123 missed days of work or school.
[TABLE="class: table table-striped table-bordered table-hover table-condensed, width: 1140"]
Table 2 - Summary of influenza-like illness symptoms reported by participating Canadians, Canada, week 2018-04 [TR="class: bg-primary, bgcolor: #2572B4"]
Number of Participants Reporting Percentage participants reporting Cough and Fever Percentage of participants with cough and fever who consulted a healthcare professional Percentage of participants with cough and fever who reported missed days from work or school Number of missed days from work or school [/TR]
[TR="class: text-center, bgcolor: #F5F5F5"]
[TD]1479[/TD]
[TD]4%[/TD]
[TD]29%[/TD]
[TD]73%[/TD]
[TD]123[/TD]
[/TR]
[/TABLE]
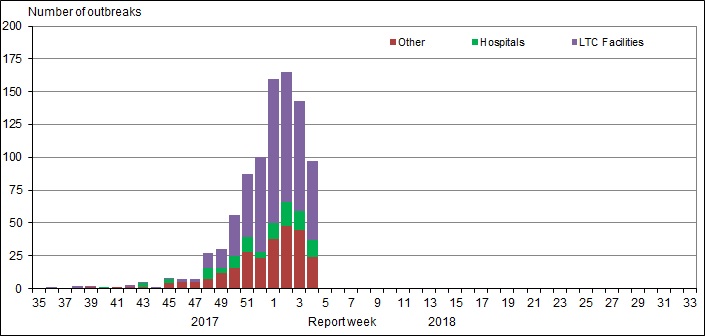
[h=2]Influenza Outbreak Surveillance[/h] In week 04, the number of reported laboratory-confirmed outbreaks of influenza decreased compared to the previous week. In week 04, 97 new influenza outbreaks were reported: 60 in long-term care facilities, 13 in hospitals, and 24 in other settings. In addition, six ILI outbreaks were reported schools. Among the 87 outbreaks with influenza type/subtype reported, 39 (45%) were associated with influenza B, and 44 were associated with influenza A. Four outbreaks were associated with a mix of influenza A and B.
To date this season, 916 influenza/ILI outbreaks have been reported, of which 542 (59%) occurred in LTC facilities. Among the 794 outbreaks for which the influenza type/subtype was reported, 483 (61%) were associated with influenza A) and 276 (35%) were associated with influenza B, and 34 (4%) were associated with a mix of A and B. Compared to recent influenza A(H3N2) seasons at week 04, the number of cumulative outbreaks reported this season has been greater than during the 2016-17 and 2012-13 seasons, and lower compared to the 2014-15 season.
[h=3]Figure 5 - Number of new outbreaks of laboratory-confirmed influenza by report week, Canada, weeks 2017-35 to 2018-04[/h]
fig5-eng.jpg
Figure 5 - Text Description [h=2]Severe Outcomes Influenza Surveillance[/h] [h=3]Provincial/Territorial Influenza Hospitalizations and Deaths[/h] In week 04, 130 influenza-associated hospitalizations were reported by participating provinces and territories1. To date this season, 3,018 influenza-associated hospitalizations have been reported, 79% of which were associated with influenza A, and 2,078 cases (69%) were in adults 65 years of age or older. To date, 271 ICU admissions and 120 deaths have been reported.
[h=3]Figure 6 - Cumulative numbers of hospitalizations by age-group reported by participating provinces and territoriesfigure 6 note1, weeks 2017-35 to 2018-04[/h]
fig6-eng.jpg
Figure 6 - Text Description Figure 6 note 1 Influenza-associated hospitalizations are reported by NL, PE, NS, NB, MB, AB, YT and NT. Only hospitalizations that require intensive medical care are reported by SK.
Return to figure 6 note1referrer

[h=3]Pediatric Influenza Hospitalizations and Deaths[/h] In week 04, the number of laboratory-confirmed influenza-associated pediatric (≤16 years of age) hospitalizations reported by the Immunization Monitoring Program Active (IMPACT) network increased compared to the previous week. In week 04, 88 hospitaliations were reported of which influenza A and B made up almost equal proportion of cases. The number of weekly hospitalizations has been above the seven-season average since week 45.
To date this season, 446 pediatric hospitalizations have been reported by the IMPACT network, 299 (67%) of which were associated with influenza A. Children 0-23 months accounted for the largest proportion of influenza A cases (40%) and the smallest propotion of influenza B cases (22%). Among the 147 hospitalizations due to influenza B, children 5-9 years accounted for the largest proportion of cases (29%).
Additionally, 71 ICU admissions and five deaths have been reported to date. Seventy percent of ICU cases were due to influenza A. Children aged 0-23 months and 10-16 years each accounted for 31% of ICU cases.
[h=3]Figure 7 - Cumulative numbers of pediatric hospitalizations (≤16 years of age) with influenza by type and age-group reported by the IMPACT network, Canada, weeks 2017-35 to 2018-04[/h]
fig7-eng.jpg
Figure 7 - Text Description [h=3]Figure 8 - Number of pediatric hospitalizations (≤16 years of age) with influenza reported by the IMPACT network, by week, Canada, weeks 2017-35 to 2018-04[/h]
fig8-eng.jpg
Figure 8 - Text Description Figure 8 Footnote 1 The shaded area represents the maximum and minimum number of cases reported by week from seasons 2010-11 to 2017-18
Return to figure 8 note1referrer

[h=2]Influenza Strain Characterizations[/h] During the 2017-18 influenza season, the National Microbiology Laboratory (NML) has characterized 874 influenza viruses [467 A(H3N2), 51 A(H1N1)pdm09 and 356 B viruses] that were received from Canadian laboratories.
[h=3]Antigenic Characterization[/h] Among influenza viruses characterized by hemagglutination inhibition assay during the 2017-18 season, most viruses were antigenically similar to the cell-culture propagated reference strains recommended by WHO.
[TABLE="class: table table-striped table-bordered table-hover table-condensed, width: 1140"]
Table 3 - Influenza antigenic strain characterizations, Canada, weeks 2017-35 to 2018-04 [TR="class: bg-primary, bgcolor: #2572B4"]
Strain Characterization Results Count Description [/TR]
[TR="bgcolor: #F5F5F5"]
Influenza A (H3N2) [/TR]
[TR]
[TD]A/Hong Kong/4801/2014-like[/TD]
[TD]118[/TD]
[TD]Viruses antigenically similar to A/Hong Kong/4801/2014, the A(H3N2) component of the 2017-18 Northern Hemisphere's trivalent and quadrivalent vaccine.[/TD]
[/TR]
[TR="bgcolor: #F5F5F5"]
[TD]Reduced titer to A/Hong Kong/4801/2014[/TD]
[TD]4[/TD]
[TD]These A(H3N2) viruses reacted poorly with antisera raised against cell-propagated A/Hong Kong/4801/2014, suggesting some antigenic differences.[/TD]
[/TR]
[TR="bgcolor: #F5F5F5"]
Influenza A (H1N1) [/TR]
[TR]
[TD]A/Michigan/45/2015-like[/TD]
[TD]51[/TD]
[TD]Viruses antigenically similar to A/Michigan/45/2015, the A(H1N1) component of the 2017-18 Northern Hemisphere's trivalent and quadrivalent influenza vaccine.[/TD]
[/TR]
[TR="bgcolor: #F5F5F5"]
Influenza B [/TR]
[TR]
[TD]B/Brisbane/60/2008-like
(Victoria lineage)[/TD]
[TD]5[/TD]
[TD]Viruses antigenically similar to B/Brisbane/60/2008.
B/Brisbane/60/2008 is the influenza B component of the 2017-18 Northern Hemisphere's trivalent and quadrivalent influenza vaccine.[/TD]
[/TR]
[TR="bgcolor: #F5F5F5"]
[TD]Reduced titer to B/Brisbane/60/2008
(Victoria lineage)[/TD]
[TD]10[/TD]
[TD]These B/Victoria lineage viruses reacted poorly with antisera raised against cell-propagated B/Brisbane/60/2008, suggesting some antigenic differences.[/TD]
[/TR]
[TR]
[TD]B/Phuket/3073/2013-like
(Yamagata lineage)[/TD]
[TD]341[/TD]
[TD]Viruses antigenically similar to B/Phuket/3073/2013, the additional influenza B component of the 2017-18 Northern Hemisphere quadrivalent influenza vaccine.[/TD]
[/TR]
[/TABLE]
[h=3]Genetic Characterization of A(H3N2) viruses[/h] During the 2017-18 season, 349 A(H3N2) viruses did not grow to sufficient titers for antigenic characterization by HI assay. Therefore, genetic characterization was performed to determine to which genetic group they belong. Sequence analysis showed that 295 A(H3N2) viruses belonged to genetic group 3C.2a, 53 viruses belonged to subclade 3C.2a1 and one virus belonged to the clade 3C.3a.
Additionally, of the 118 influenza A(H3N2) viruses that were characterized antigenically as similar to A/Hong Kong/4801/2014, 75 belonged to genetic group 3C.2a and 12 viruses belonged to subclade 3C.2a1. The four viruses that showed reduced titer belonged to genetic clade 3C.3a. Sequencing is pending for the remaining 27 virus isolates.
A/Hong Kong/4801/2014-like virus belongs to genetic group 3C.2a and is the influenza A/H3N2 component of the 2017-18 Northern Hemisphere influenza vaccine.
[h=3]Genetic Characterization of Influenza B viruses[/h] Among the viruses characterized antigenically as having reduced titer to ferret antisera produced against cell-propagated B/Brisbane/60/2008, sequence analysis showed that all 10 viruses had a two amino acid deletion in the HA gene.
...

https://www.canada.ca/en/public-hea...watch/2017-2018/week4-january-21-27-2018.html

 
[h=1]FluWatch report: January 28, 2018 to February 3, 2018 (week 5)[/h]
week5-january-28-february-3-2018-eng.jpg

Download the alternative format
(PDF format, 527 KB, 10 pages)
Organization:
Public Health Agency of Canada
Date published: 2018-02-09

[h=5]Related Topics[/h]


[h=5]Overall Summary[/h]
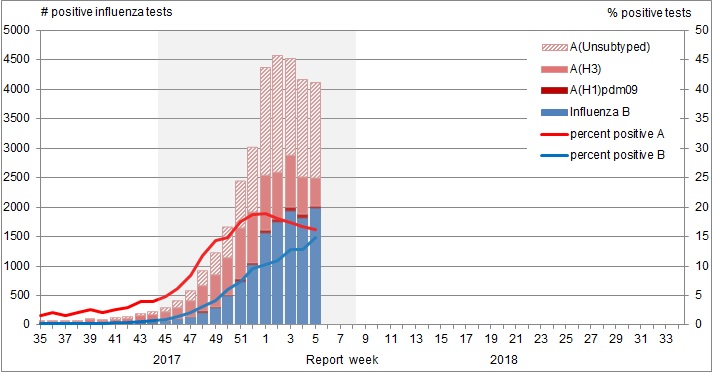
  • Overall, influenza activity in Canada remains at peak levels but there are signs that activity is starting to slow down in parts of the country.
  • In week 05, the total number of detections of influenza B were similar to the total number of detections of influenza A.
  • An increasing proportion of weekly pediatric hospitalizations reported by the IMPACT network are due to influenza B. In week 05, influenza A and B accounted for an equal proportion of hospitalizations.
  • To date this season, the majority of lab confirmations, hospitalizations and deaths have been among adults 65 years of age and older.
  • For more information on the flu, see our Flu(influenza) web page.

[h=2]On this page[/h]
[h=2]Influenza/Influenza-like Illness Activity (geographic spread)[/h] In week 05, a similar number of regions reported localized or widespread influenza activity compared to the previous week. Among the 46 regions reporting data for week 05, 7 regions (BC(1), ON(2), QC(3), PE(1)) reported widespread activity, and 25 regions (BC(2), AB(3), SK(1), ON(5), QC(3), NB(4), NS(3), NL(3), and NU(1)) reported localized activity.


[h=3]Figure 1 - Map of overall influenza/ILI activity level by province and territory, Canada, week 2018-05[/h]
fig1-eng.jpg
Note: Influenza/ILI activity levels, as represented on this map, are assigned and reported by Provincial and Territorial Ministries of Health, based on laboratory confirmations, sentinel ILI rates and reported outbreaks. Please refer to detailed definitions at the end of the report. Maps from previous weeks, including any retrospective updates, are available in the mapping feature found in the Weekly Influenza Reports.
Figure 1 - Text Description [h=2]Laboratory-Confirmed Influenza Detections[/h] In week 05, the overall percentage of tests positive for influenza was 31%. Since week 02, the percentage of tests positive for influenza A has been slowly declining to 16% from the peak in week 01 (19%). The percentage of tests positive for influenza B increased this week to 15%.
The percentage of influenza A detections for week 05 is average for this time of year. The percentage of tests positive for influenza B in week 05 continues to be well above expected levels for this time of year. For data on other respiratory virus detections, see the Respiratory Virus Detections in Canada Report.
[h=3]Figure 2 - Number of positive influenza tests and percentage of tests positive, by type, subtype and report week, Canada, weeks 2017-35 to 2018-05[/h]
fig2-eng.jpg
The shaded area indicates weeks where the positivity rate was at least 5% and a minimum of 15 positive tests were observed, signalling the period of seasonal influenza activity.
Figure 2 - Text Description To date this season, 33,095 laboratory-confirmed influenza detections have been reported, of which 64% have been influenza A. Influenza A(H3N2) has been the most common subtype detected this season, representing 94% of subtyped influenza A detections. For more detailed weekly and cumulative influenza data, see the text descriptions for Figures 2 and 3 or the Respiratory Virus Detections in Canada Report.
[h=3]Figure 3 - Cumulative numbers of positive influenza specimens by type/subtype and province/territory, Canada, weeks 2017-35 to 2018-05[/h]
fig3-eng.jpg
Figure 3 - Text Description To date this season, detailed information on age and type/subtype has been received for 29,037 laboratory-confirmed influenza cases (Table 1). Adults 65 years of age and older represent the largest proportion of cases overall (49%), and among cases of influenza A(H3N2) (53%) and influenza B (45%). Adults aged 20-64 represent 33% of cases overall and 31% of influenza A(H3N2) and 35% of influenza B cases. Although much smaller in numbers (445), the majority of influenza A(H1N1) cases are among adults less than 65 years of age, with adults aged 20-64 and children 0-19 years accounting for 53% and 34% of cases respectively.
[TABLE="class: table table-striped table-bordered table-hover table-condensed, width: 1140"]
Table 1 - Weekly and cumulative numbers of positive influenza specimens by type, subtype and age-group reported through case-based laboratory reporting, Canada, weeks 2017-35 to 2018-05 [TR="class: bg-primary, bgcolor: #2572B4"]
Age groups (years) Cumulative (August 27, 2017 to February 3, 2018) [/TR]
[TR="class: bg-primary, bgcolor: #2572B4"]
Influenza A B Influenza A and B [/TR]
[TR="class: bg-primary, bgcolor: #2572B4"]
A Total A(H1) pdm09 A(H3) A (UnS)Table 1 Footnote1 Total # % [/TR]
[TR="bgcolor: #F5F5F5"]
0-4 [TD]1752[/TD]
[TD]85[/TD]
[TD]557[/TD]
[TD]1110[/TD]
[TD]642[/TD]
[TD]2394[/TD]
[TD]8%[/TD]
[/TR]
[TR]
5-19 [TD]1518[/TD]
[TD]65[/TD]
[TD]607[/TD]
[TD]846[/TD]
[TD]1371[/TD]
[TD]2889[/TD]
[TD]10%[/TD]
[/TR]
[TR="bgcolor: #F5F5F5"]
20-44 [TD]2967[/TD]
[TD]126[/TD]
[TD]1162[/TD]
[TD]1679[/TD]
[TD]1390[/TD]
[TD]4357[/TD]
[TD]15%[/TD]
[/TR]
[TR]
45-64 [TD]3091[/TD]
[TD]111[/TD]
[TD]1258[/TD]
[TD]1722[/TD]
[TD]2178[/TD]
[TD]5269[/TD]
[TD]18%[/TD]
[/TR]
[TR="bgcolor: #F5F5F5"]
65+ [TD]9595[/TD]
[TD]58[/TD]
[TD]4104[/TD]
[TD]5433[/TD]
[TD]4533[/TD]
[TD]14128[/TD]
[TD]49%[/TD]
[/TR]
[TR]
Total [TD]18923[/TD]
[TD]445[/TD]
[TD]7688[/TD]
[TD]10790[/TD]
[TD]10114[/TD]
[TD]29037[/TD]
[TD]100%[/TD]
[/TR]
[TR]
[TD="colspan: 8"] Table 1 Footnote 1 UnS: unsubtyped: The specimen was typed as influenza A, but no result for subtyping was available;
Return to table 1 footnote1referrer

[/TD]
[/TR]
[/TABLE]
[h=2]Syndromic/Influenza-like Illness Surveillance[/h] [h=3]Healthcare Professionals Sentinel Syndromic Surveillance[/h] In week 05, 4% of visits to healthcare professionals were due to influenza-like illness (ILI); a increase compared to the previous week, and above the 5-year average.
[h=3]Figure 4 - Percentage of visits for ILI reported by sentinels by report week, Canada, weeks 2017-35 to 2018-05[/h] Number of Sentinels Reporting in Week 05: 141
fig4-eng.jpg
The shaded area represents the maximum and minimum percentage of visits for ILI reported by week from seasons 2012-13 to 2017-18
Figure 4 - Text Description [h=3]Participatory Syndromic Surveillance[/h] FluWatchers is a participatory ILI surveillance system that relies on weekly voluntary submissions of syndromic information from Canadians across Canada.
In week 05, 1,491 participants reported to FluWatchers, of which 4% reported symptoms of cough and fever, and 19% of these consulted a healthcare professional. Among participants who reported cough and fever, 77% reported days missed from work or school, resulting in a combined total of 108 missed days of work or school.
[TABLE="class: table table-striped table-bordered table-hover table-condensed, width: 1140"]
Table 2 - Summary of influenza-like illness symptoms reported by participating Canadians, Canada, week 2018-05 [TR="class: bg-primary, bgcolor: #2572B4"]
Number of Participants Reporting Percentage participants reporting Cough and Fever Percentage of participants with cough and fever who consulted a healthcare professional Percentage of participants with cough and fever who reported missed days from work or school Number of missed days from work or school [/TR]
[TR="class: text-center, bgcolor: #F5F5F5"]
[TD]1491[/TD]
[TD]4%[/TD]
[TD]19%[/TD]
[TD]77%[/TD]
[TD]108[/TD]
[/TR]
[/TABLE]
[h=2]Influenza Outbreak Surveillance[/h] In week 05, the number of reported laboratory-confirmed outbreaks of influenza decreased compared to the previous week. In week 05, 78 new influenza outbreaks were reported: 50 in long-term care facilities, 9 in hospitals, and 19 in other settings. In addition, seven ILI outbreaks were reported schools. Among the 75 outbreaks with influenza type/subtype reported, 33 (44%) were associated with influenza B, 38 (51%) were associated with influenza A and four outbreaks were associated with a mix of influenza A and B (5%).
To date this season, 1,004 influenza/ILI outbreaks have been reported, of which 595 (59%) occurred in LTC facilities. Among the 872 outbreaks for which the influenza type/subtype was reported, 523 (60%) were associated with influenza A) and 310 (36%) were associated with influenza B, and 39 (4%) were associated with a mix of A and B. Compared to recent influenza A(H3N2) seasons at week 05, the number of cumulative outbreaks reported this season has been greater than during the 2016-17 and 2012-13 seasons, and lower compared to the 2014-15 season.
[h=3]Figure 5 - Number of new outbreaks of laboratory-confirmed influenza by report week, Canada, weeks 2017-35 to 2018-05[/h]
fig5-eng.jpg
Figure 5 - Text Description [h=2]Severe Outcomes Influenza Surveillance[/h] [h=3]Provincial/Territorial Influenza Hospitalizations and Deaths[/h] In week 05, 84 influenza-associated hospitalizations were reported by participating provinces and territories1. To date this season, 3,108 influenza-associated hospitalizations have been reported, 78% of which were associated with influenza A, and 2,139 cases (69%) were in adults 65 years of age or older. To date, 285 ICU admissions and 130 deaths have been reported.
[h=3]Figure 6 - Cumulative numbers of hospitalizations by age-group reported by participating provinces and territoriesfigure 6 note1, weeks 2017-35 to 2018-05[/h]
fig6-eng.jpg
Figure 6 - Text Description Figure 6 note 1 Influenza-associated hospitalizations are reported by NL, PE, NS, NB, MB, AB, YT and NT. Only hospitalizations that require intensive medical care are reported by SK.
Return to figure 6 note1referrer

[h=3]Pediatric Influenza Hospitalizations and Deaths[/h] In week 05, the number of laboratory-confirmed influenza-associated pediatric (≤16 years of age) hospitalizations reported by the Immunization Monitoring Program Active (IMPACT) network decreased compared to the previous week. In week 05, 57 hospitalizations were reported of which influenza A and B made up almost equal proportion of cases. The number of weekly hospitalizations has been above the seven-season average since week 45.
To date this season, 511 pediatric hospitalizations have been reported by the IMPACT network, 334 (65%) of which were associated with influenza A. Children 0-23 months accounted for the largest proportion of influenza A hospitalizations (40%). Among the 177 hospitalizations due to influenza B, children 5-9 years accounted for the largest proportion of cases (31%).
Additionally, 83 ICU admissions and five deaths have been reported to date. Sixty-six percent of ICU cases were due to influenza A. Children aged 0-23 months and 10-16 years each accounted for 30% of ICU cases.
[h=3]Figure 7 - Cumulative numbers of pediatric hospitalizations (≤16 years of age) with influenza by type and age-group reported by the IMPACT network, Canada, weeks 2017-35 to 2018-05[/h]
fig7-eng.jpg
Figure 7 - Text Description [h=3]Figure 8 - Number of pediatric hospitalizations (≤16 years of age) with influenza reported by the IMPACT network, by week, Canada, weeks 2017-35 to 2018-05[/h]
fig8-eng.jpg
Figure 8 - Text Description Figure 8 Footnote 1 The shaded area represents the maximum and minimum number of cases reported by week from seasons 2010-11 to 2017-18
Return to figure 8 note1referrer

[h=2]Influenza Strain Characterizations[/h] During the 2017-18 influenza season, the National Microbiology Laboratory (NML) has characterized 1,178 influenza viruses [655 A(H3N2), 58 A(H1N1)pdm09 and 465 B viruses] that were received from Canadian laboratories.
[h=3]Antigenic Characterization[/h] Among influenza viruses characterized by hemagglutination inhibition assay during the 2017-18 season, most viruses were antigenically similar to the cell-culture propagated reference strains recommended by WHO.
[TABLE="class: table table-striped table-bordered table-hover table-condensed, width: 1140"]
Table 3 - Influenza antigenic strain characterizations, Canada, weeks 2017-35 to 2018-05 [TR="class: bg-primary, bgcolor: #2572B4"]
Strain Characterization Results Count Description [/TR]
[TR="bgcolor: #F5F5F5"]
Influenza A (H3N2) [/TR]
[TR]
[TD]A/Hong Kong/4801/2014-like[/TD]
[TD]134[/TD]
[TD]Viruses antigenically similar to A/Hong Kong/4801/2014, the A(H3N2) component of the 2017-18 Northern Hemisphere's trivalent and quadrivalent vaccine.[/TD]
[/TR]
[TR="bgcolor: #F5F5F5"]
[TD]Reduced titer to A/Hong Kong/4801/2014[/TD]
[TD]9[/TD]
[TD]These A(H3N2) viruses reacted poorly with antisera raised against cell-propagated A/Hong Kong/4801/2014, suggesting some antigenic differences.[/TD]
[/TR]
[TR="bgcolor: #F5F5F5"]
Influenza A (H1N1) [/TR]
[TR]
[TD]A/Michigan/45/2015-like[/TD]
[TD]58[/TD]
[TD]Viruses antigenically similar to A/Michigan/45/2015, the A(H1N1) component of the 2017-18 Northern Hemisphere's trivalent and quadrivalent influenza vaccine.[/TD]
[/TR]
[TR="bgcolor: #F5F5F5"]
Influenza B [/TR]
[TR]
[TD]B/Brisbane/60/2008-like
(Victoria lineage)[/TD]
[TD]6[/TD]
[TD]Viruses antigenically similar to B/Brisbane/60/2008.
B/Brisbane/60/2008 is the influenza B component of the 2017-18 Northern Hemisphere's trivalent and quadrivalent influenza vaccine.[/TD]
[/TR]
[TR="bgcolor: #F5F5F5"]
[TD]Reduced titer to B/Brisbane/60/2008
(Victoria lineage)[/TD]
[TD]14[/TD]
[TD]These B/Victoria lineage viruses reacted poorly with antisera raised against cell-propagated B/Brisbane/60/2008, suggesting some antigenic differences.[/TD]
[/TR]
[TR]
[TD]B/Phuket/3073/2013-like
(Yamagata lineage)[/TD]
[TD]445[/TD]
[TD]Viruses antigenically similar to B/Phuket/3073/2013, the additional influenza B component of the 2017-18 Northern Hemisphere quadrivalent influenza vaccine.[/TD]
[/TR]
[/TABLE]
[h=3]Genetic Characterization of A(H3N2) viruses[/h] During the 2017-18 season, 512 A(H3N2) viruses did not grow to sufficient titers for antigenic characterization by HI assay. Therefore, genetic characterization was performed to determine to which genetic group they belong. Sequence analysis showed that 445 A(H3N2) viruses belonged to genetic group 3C.2a, 66 viruses belonged to subclade 3C.2a1 and one virus belonged to the clade 3C.3a.
Additionally, of the 143 influenza A(H3N2) viruses that were characterized antigenically as similar to A/Hong Kong/4801/2014, 109 belonged to genetic group 3C.2a and 15 viruses belonged to subclade 3C.2a1. The nine viruses that showed reduced titer belonged to genetic clade 3C.3a. Sequencing is pending for the remaining 10 virus isolates.
A/Hong Kong/4801/2014-like virus belongs to genetic group 3C.2a and is the influenza A/H3N2 component of the 2017-18 Northern Hemisphere influenza vaccine.
[h=3]Genetic Characterization of Influenza B viruses[/h] Among the viruses characterized antigenically as having reduced titer to ferret antisera produced against cell-propagated B/Brisbane/60/2008, sequence analysis showed that all 14 viruses had a two amino acid deletion in the HA gene.
...

https://www.canada.ca/en/public-hea...17-2018/week5-january-28-february-3-2018.html

 
[h=1]FluWatch report: February 4 to February 10, 2018 (week 6)[/h]
pub-eng.jpg

Download the alternative format
(PDF format, 527 KB, 10 pages)
Organization:
Public Health Agency of Canada
Date published: 2018-02-16

[h=5]Related Topics[/h]


[h=5]Overall Summary[/h]
  • Overall, influenza activity in Canada remains at peak levels. Activity is starting to slow down in some parts of the country, but at the national level, several indicators of influenza circulation increased in week 06.
  • In week 06, the number of laboratory detections of influenza A and B were similar. Detections of influenza A are within expected levels for this time of year, however, circulation of influenza B is greater than observed during the past seven seasons.
  • To date this season, the majority of laboratory-confirmed cases, hospitalizations and deaths with influenza have been among adults 65 years of age and older.
  • For more information on the flu, see our Flu(influenza) web page.

[h=2]On this page[/h]
[h=2]Influenza/Influenza-like Illness Activity (geographic spread)[/h] In week 06, a similar number of regions reported localized or widespread influenza activity compared to the previous week. Among the 51 regions reporting data for week 06, 6 regions (BC(1), ON(2), QC(3)) reported widespread activity, and 25 regions (BC(1), AB(3), SK(2), MB(1), ON(5), QC(3), NB(1), NS(4), NL(3), PE(1) and NU(1)) reported localized activity.


[h=3]Figure 1 - Map of overall influenza/ILI activity level by province and territory, Canada, week 2018-06[/h]
fig1-eng.jpg
Note: Influenza/ILI activity levels, as represented on this map, are assigned and reported by Provincial and Territorial Ministries of Health, based on laboratory confirmations, sentinel ILI rates and reported outbreaks. Please refer to detailed definitions at the end of the report. Maps from previous weeks, including any retrospective updates, are available in the mapping feature found in the Weekly Influenza Reports.
Figure 1 - Text Description [h=2]Laboratory-Confirmed Influenza Detections[/h] In week 06, the overall percentage of tests positive for influenza increased from 31% to 34%. The percentage of tests positive for influenza A had been declining slowly since week 02, but increased in week 06 from 16% to 17%. The percentage of tests positive for influenza B continued to increase to 17% in week 06.
The percentage of influenza A detections for week 06 is within the expected range for this time of year. The percentage of tests positive for influenza B in week 06 continues to be well above expected levels for this time of year. For data on other respiratory virus detections, see the Respiratory Virus Detections in Canada Report.
[h=3]Figure 2 - Number of positive influenza tests and percentage of tests positive, by type, subtype and report week, Canada, weeks 2017-35 to 2018-06[/h]
fig2-eng.jpg
The shaded area indicates weeks where the positivity rate was at least 5% and a minimum of 15 positive tests were observed, signalling the period of seasonal influenza activity.
Figure 2 - Text Description To date this season, 38,014 laboratory-confirmed influenza detections have been reported, of which 62% have been influenza A. Influenza A(H3N2) has been the most common subtype detected this season, representing 94% of subtyped influenza A detections. For more detailed weekly and cumulative influenza data, see the text descriptions for Figures 2 and 3 or the Respiratory Virus Detections in Canada Report.
[h=3]Figure 3 - Cumulative numbers of positive influenza specimens by type/subtype and province/territory, Canada, weeks 2017-35 to 2018-06[/h]
fig3-eng.jpg
Figure 3 - Text Description To date this season, detailed information on age and type/subtype has been received for 33,159 laboratory-confirmed influenza cases (Table 1). Adults 65 years of age and older represent the largest proportion of cases overall (49%), and among cases of influenza A(H3N2) (54%) and influenza B (45%). Adults aged 20-64 represent 33% of cases overall and 31% of influenza A(H3N2) and 35% of influenza B cases. Although much smaller in numbers (466), the majority of influenza A(H1N1) cases are among adults less than 65 years of age, with adults aged 20-64 and children 0-19 years accounting for 54% and 33% of cases respectively.
[TABLE="class: table table-striped table-bordered table-hover table-condensed, width: 1140"]
Table 1 - Weekly and cumulative numbers of positive influenza specimens by type, subtype and age-group reported through case-based laboratory reporting, Canada, weeks 2017-35 to 2018-06 [TR="class: bg-primary, bgcolor: #2572B4"]
Age groups (years) Cumulative (August 27, 2017 to February 10, 2018) [/TR]
[TR="class: bg-primary, bgcolor: #2572B4"]
Influenza A B Influenza A and B [/TR]
[TR="class: bg-primary, bgcolor: #2572B4"]
A Total A(H1) pdm09 A(H3) A (UnS)Table 1 Footnote1 Total # % [/TR]
[TR="bgcolor: #F5F5F5"]
0-4 [TD]2022[/TD]
[TD]86[/TD]
[TD]578[/TD]
[TD]1358[/TD]
[TD]815[/TD]
[TD]2837[/TD]
[TD]9%[/TD]
[/TR]
[TR]
5-19 [TD]1714[/TD]
[TD]69[/TD]
[TD]626[/TD]
[TD]1019[/TD]
[TD]1682[/TD]
[TD]3396[/TD]
[TD]10%[/TD]
[/TR]
[TR="bgcolor: #F5F5F5"]
20-44 [TD]3238[/TD]
[TD]134[/TD]
[TD]1209[/TD]
[TD]1895[/TD]
[TD]1633[/TD]
[TD]4871[/TD]
[TD]15%[/TD]
[/TR]
[TR]
45-64 [TD]3412[/TD]
[TD]117[/TD]
[TD]1318[/TD]
[TD]1977[/TD]
[TD]2573[/TD]
[TD]5985[/TD]
[TD]18%[/TD]
[/TR]
[TR="bgcolor: #F5F5F5"]
65+ [TD]10600[/TD]
[TD]60[/TD]
[TD]4332[/TD]
[TD]6208[/TD]
[TD]5470[/TD]
[TD]16070[/TD]
[TD]48%[/TD]
[/TR]
[TR]
Total [TD]20986[/TD]
[TD]466[/TD]
[TD]8063[/TD]
[TD]12457[/TD]
[TD]12173[/TD]
[TD]33159[/TD]
[TD]100%[/TD]
[/TR]
[TR]
[TD="colspan: 8"] Table 1 Footnote 1 UnS: unsubtyped: The specimen was typed as influenza A, but no result for subtyping was available.
Return to table 1 footnote1referrer

[/TD]
[/TR]
[/TABLE]
[h=2]Syndromic/Influenza-like Illness Surveillance[/h] [h=3]Healthcare Professionals Sentinel Syndromic Surveillance[/h] In week 06, 3.6% of visits to healthcare professionals were due to influenza-like illness (ILI); a decrease compared to the previous week, and above the 5-year average.
[h=3]Figure 4 - Percentage of visits for ILI reported by sentinels by report week, Canada, weeks 2017-35 to 2018-06[/h] Number of Sentinels Reporting in Week 06: 165
fig4-eng.jpg
The shaded area represents the maximum and minimum percentage of visits for ILI reported by week from seasons 2012-13 to 2017-18
Figure 4 - Text Description [h=3]Participatory Syndromic Surveillance[/h] FluWatchers is a participatory ILI surveillance system that relies on weekly voluntary submissions of syndromic information from Canadians across Canada.
In week 06, 1,458 participants reported to FluWatchers, of which 4% reported symptoms of cough and fever, and 18% of these consulted a healthcare professional. Among participants who reported cough and fever, 69% reported days missed from work or school, resulting in a combined total of 157 missed days of work or school.
[TABLE="class: table table-striped table-bordered table-hover table-condensed, width: 1140"]
Table 2 - Summary of influenza-like illness symptoms reported by participating Canadians, Canada, week 2018-06 [TR="class: bg-primary, bgcolor: #2572B4"]
Number of Participants Reporting Percentage participants reporting Cough and Fever Percentage of participants with cough and fever who consulted a healthcare professional Percentage of participants with cough and fever who reported missed days from work or school Number of missed days from work or school [/TR]
[TR="class: text-center, bgcolor: #F5F5F5"]
[TD]1458[/TD]
[TD]4%[/TD]
[TD]18%[/TD]
[TD]69%[/TD]
[TD]157[/TD]
[/TR]
[/TABLE]
[h=2]Influenza Outbreak Surveillance[/h] In week 06, the number of reported laboratory-confirmed outbreaks of influenza increased compared to the previous week. In week 06, 122 new influenza outbreaks were reported: 75 in long-term care facilities, 10 in hospitals, and 31 in other settings. In addition, six ILI outbreaks were reported schools. Among the 106 outbreaks with influenza type/subtype reported, 54 (51%) were associated with influenza B, 45 (43%) were associated with influenza A and seven outbreaks were associated with a mix of influenza A and B (7%).
To date this season, 1,130 influenza/ILI outbreaks have been reported, of which 674 (60%) occurred in LTC facilities. Among the 982 outbreaks for which the influenza type/subtype was reported, 568 (58%) were associated with influenza A and 368 (38%) were associated with influenza B, and 46 (5%) were associated with a mix of A and B. Compared to recent influenza A(H3N2) seasons at week 06, the number of cumulative outbreaks reported this season has been greater than during the 2016-17 and 2012-13 seasons, and lower compared to the 2014-15 season.
[h=3]Figure 5 - Number of new outbreaks of laboratory-confirmed influenza by report week, Canada, weeks 2017-35 to 2018-06[/h]
fig5-eng.jpg
Figure 5 - Text Description [h=2]Severe Outcomes Influenza Surveillance[/h] [h=3]Provincial/Territorial Influenza Hospitalizations and Deaths[/h] In week 06, 88 influenza-associated hospitalizations were reported by participating provinces and territories1. To date this season, 3,252 influenza-associated hospitalizations have been reported, 78% of which were associated with influenza A, and 2,231 cases (69%) were in adults 65 years of age or older. To date, 292 ICU admissions and 142 deaths have been reported.
[h=3]Figure 6 - Cumulative numbers of hospitalizations by age-group reported by participating provinces and territoriesfigure 6 note1, weeks 2017-35 to 2018-06[/h]
fig6-eng.jpg
Figure 6 - Text Description Figure 6 note 1 Influenza-associated hospitalizations are reported by NL, PE, NS, NB, MB, AB, YT and NT. Only hospitalizations that require intensive medical care are reported by SK.
Return to figure 6 note1referrer

[h=3]Pediatric Influenza Hospitalizations and Deaths[/h] In week 06, the number of laboratory-confirmed influenza-associated pediatric (≤16 years of age) hospitalizations reported by the Immunization Monitoring Program Active (IMPACT) network increased compared to the previous week. In week 06, 76 hospitalizations were reported of which influenza A and B made up almost equal proportion of cases. The number of weekly hospitalizations has been above the seven-season average since week 45.
To date this season, 594 pediatric hospitalizations have been reported by the IMPACT network, 378 (64%) of which were associated with influenza A. Children 0-23 months accounted for the largest proportion of influenza A hospitalizations (39%). Among the 216 hospitalizations due to influenza B, children 5-9 years accounted for the largest proportion of cases (31%).
Additionally, 97 ICU admissions and five deaths have been reported to date. Children aged 0-23 months accounted for 30% of ICU cases. Among the ICU cases with available information, 66% were due to influenza A and approximately 30% had no reported previous or concurrent medical conditions.
[h=3]Figure 7 - Cumulative numbers of pediatric hospitalizations (≤16 years of age) with influenza by type and age-group reported by the IMPACT network, Canada, weeks 2017-35 to 2018-06[/h]
fig7-eng.jpg
Figure 7 - Text Description [h=3]Figure 8 - Number of pediatric hospitalizations (≤16 years of age) with influenza reported by the IMPACT network, by week, Canada, weeks 2017-35 to 2018-06[/h]
fig8-eng.jpg
Figure 8 - Text Description Figure 8 Footnote 1 The shaded area represents the maximum and minimum number of cases reported by week from seasons 2010-11 to 2017-18
Return to figure 8 note1referrer

[h=2]Influenza Strain Characterizations[/h] During the 2017-18 influenza season, the National Microbiology Laboratory (NML) has characterized 1,443 influenza viruses [810 A(H3N2), 72 A(H1N1)pdm09 and 561 B viruses] that were received from Canadian laboratories.
[h=3]Antigenic Characterization[/h] Among influenza viruses characterized by hemagglutination inhibition assay during the 2017-18 season, most viruses were antigenically similar to the cell-culture propagated reference strains recommended by WHO.
[TABLE="class: table table-striped table-bordered table-hover table-condensed, width: 1140"]
Table 3 - Influenza antigenic strain characterizations, Canada, weeks 2017-35 to 2018-06 [TR="class: bg-primary, bgcolor: #2572B4"]
Strain Characterization Results Count Description [/TR]
[TR="bgcolor: #F5F5F5"]
Influenza A (H3N2) [/TR]
[TR]
[TD]A/Hong Kong/4801/2014-like[/TD]
[TD]148[/TD]
[TD]Viruses antigenically similar to A/Hong Kong/4801/2014, the A(H3N2) component of the 2017-18 Northern Hemisphere's trivalent and quadrivalent vaccine.[/TD]
[/TR]
[TR="bgcolor: #F5F5F5"]
[TD]Reduced titer to A/Hong Kong/4801/2014[/TD]
[TD]15[/TD]
[TD]These A(H3N2) viruses reacted poorly with antisera raised against cell-propagated A/Hong Kong/4801/2014, suggesting some antigenic differences.[/TD]
[/TR]
[TR="bgcolor: #F5F5F5"]
Influenza A (H1N1) [/TR]
[TR]
[TD]A/Michigan/45/2015-like[/TD]
[TD]72[/TD]
[TD]Viruses antigenically similar to A/Michigan/45/2015, the A(H1N1) component of the 2017-18 Northern Hemisphere's trivalent and quadrivalent influenza vaccine.[/TD]
[/TR]
[TR="bgcolor: #F5F5F5"]
Influenza B [/TR]
[TR]
[TD]B/Brisbane/60/2008-like
(Victoria lineage)[/TD]
[TD]6[/TD]
[TD]Viruses antigenically similar to B/Brisbane/60/2008.
B/Brisbane/60/2008 is the influenza B component of the 2017-18 Northern Hemisphere's trivalent and quadrivalent influenza vaccine.[/TD]
[/TR]
[TR="bgcolor: #F5F5F5"]
[TD]Reduced titer to B/Brisbane/60/2008
(Victoria lineage)[/TD]
[TD]18[/TD]
[TD]These B/Victoria lineage viruses reacted poorly with antisera raised against cell-propagated B/Brisbane/60/2008, suggesting some antigenic differences.[/TD]
[/TR]
[TR]
[TD]B/Phuket/3073/2013-like
(Yamagata lineage)[/TD]
[TD]537[/TD]
[TD]Viruses antigenically similar to B/Phuket/3073/2013, the additional influenza B component of the 2017-18 Northern Hemisphere quadrivalent influenza vaccine.[/TD]
[/TR]
[/TABLE]
[h=3]Genetic Characterization of A(H3N2) viruses[/h] During the 2017-18 season, 647 A(H3N2) viruses did not grow to sufficient titers for antigenic characterization by HI assay. Therefore, genetic characterization was performed to determine to which genetic group they belong. Sequence analysis showed that 570 A(H3N2) viruses belonged to genetic group 3C.2a, 75 viruses belonged to subclade 3C.2a1 and two viruses belonged to the clade 3C.3a.
Additionally, of the 148 influenza A(H3N2) viruses that were characterized antigenically as similar to A/Hong Kong/4801/2014, 132 belonged to genetic group 3C.2a and 15 viruses belonged to subclade 3C.2a1. The 15 viruses that showed reduced titer to A/Hong Kong/4801/2014 belonged to genetic clade 3C.3a. Sequencing is pending for the remaining virus isolate.
A/Hong Kong/4801/2014-like virus belongs to genetic group 3C.2a and is the influenza A/H3N2 component of the 2017-18 Northern Hemisphere influenza vaccine.
[h=3]Genetic Characterization of Influenza B viruses[/h] Among the viruses characterized antigenically as having reduced titer to ferret antisera produced against cell-propagated B/Brisbane/60/2008, sequence analysis showed that all 18 viruses had a two amino acid deletion in the HA gene.
[h=2]Antiviral Resistance[/h] During the 2017-18 season, the National Microbiology Laboratory (NML) has tested 736 influenza viruses for resistance to oseltamivir and 732 viruses for resistance to zanamivir. All but one of the A(H1N1) viruses were sensitive to oseltamivir and all but one influenza B viruses were sensitive to zanamivir (Table 4).

...
https://www.canada.ca/en/public-hea...7-2018/week6-february-4-february-10-2018.html
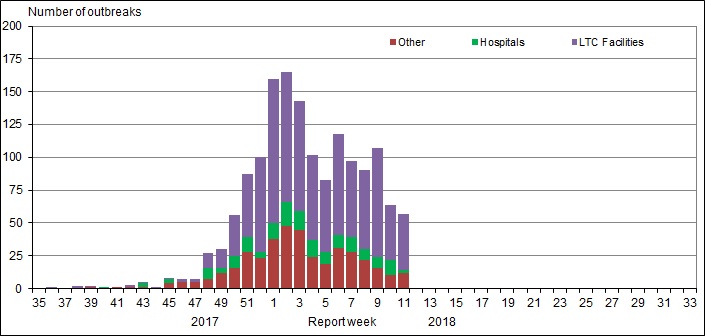
 
[h=1]FluWatch report: February 11 to February 17, 2018 (week 7)[/h]
cover-eng.gif

Download the alternative format
(PDF format, 527 KB, 10 pages)
Organization:
Public Health Agency of Canada
Date published: 2018-02-23

[h=5]Related Topics[/h]


[h=5]Overall Summary[/h]
  • Overall, influenza activity in Canada remains at peak levels.
  • Influenza activity is decreasing in some parts of the country but at the national level, the decline in activity has been slow.
  • In week 07, detections of influenza B were greater than those of influenza A.
  • To date this season, the majority of laboratory-confirmed cases, hospitalizations and deaths with influenza have been among adults 65 years of age and older.
  • The World Health Organization (WHO) has released the recommended composition of the influenza vaccine for use in the 2018-2019 northern hemisphere influenza season. The recommended strain was changed for the A(H3N2) component and one of the influenza B components.
  • For more information on the flu, see our Flu(influenza) web page.

[h=2]On this page[/h]
[h=2]Influenza/Influenza-like Illness Activity (geographic spread)[/h] In week 07, there was a slight decrease in the number of regions reporting localized or widespread influenza activity compared to the previous week. Among the 53 regions reporting data for week 07, 5 regions (ON(1), QC(4)) reported widespread activity, and 21 regions (BC(2), AB(2), ON(6), QC(1), NB(2), NS(2), NL(3), PE(1) and NU(2)) reported localized activity.


[h=3]Figure 1 - Map of overall influenza/ILI activity level by province and territory, Canada, week 2018-07[/h]
fig-1-eng.jpg
Note: Influenza/ILI activity levels, as represented on this map, are assigned and reported by Provincial and Territorial Ministries of Health, based on laboratory confirmations, sentinel ILI rates and reported outbreaks. Please refer to detailed definitions at the end of the report. Maps from previous weeks, including any retrospective updates, are available in the mapping feature found in the Weekly Influenza Reports.
Figure 1 - Text Description [h=2]Laboratory-Confirmed Influenza Detections[/h] In week 07, the overall percentage of tests positive for influenza was 33% The percentage of tests positive for influenza A continued to decline slowly. The percentage of tests positive for influenza B continued to increase to 17% in week 07. For the first time this season, detections of influenza B were greater than those of influenza A.
The percentage of influenza A detections for week 07 are below average but remain within the expected range for this time of year. The percentage of tests positive for influenza B in week 07 continues to be well above expected levels for this time of year. For data on other respiratory virus detections, see theRespiratory Virus Detections in Canada Report. [h=3]Figure 2 - Number of positive influenza tests and percentage of tests positive, by type, subtype and report week, Canada, weeks 2017-35 to 2018-07[/h]
fig-2-eng.jpg
The shaded area indicates weeks where the positivity rate was at least 5% and a minimum of 15 positive tests were observed, signalling the period of seasonal influenza activity.
Figure 2 - Text Description To date this season, 42,773 laboratory-confirmed influenza detections have been reported, of which 60% have been influenza A. Influenza A(H3N2) has been the most common subtype detected this season, representing 94% of subtyped influenza A detections. For more detailed weekly and cumulative influenza data, see the text descriptions for Figures 2 and 3 or the Respiratory Virus Detections in Canada Report.
[h=3]Figure 3 - Cumulative numbers of positive influenza specimens by type/subtype and province/territory, Canada, weeks 2017-35 to 2018-07[/h]
fig-3-eng.jpg
Figure 3 - Text Description To date this season, detailed information on age and type/subtype has been received for 34,733 laboratory-confirmed influenza cases (Table 1). Adults 65 years of age and older represent the largest proportion of cases overall (48%), and among cases of influenza A(H3N2) (54%) and influenza B (44%). Adults aged 20-64 represent 33% of cases overall and 31% of influenza A(H3N2) and 35% of influenza B cases. Although much smaller in numbers (548), the majority of influenza A(H1N1) cases are among adults less than 65 years of age, with adults aged 20-64 and children 0-19 years accounting for 53% and 34% of cases respectively.
[TABLE="class: table table-striped table-bordered table-hover table-condensed, width: 1140"]
Table 1 - Weekly and cumulative numbers of positive influenza specimens by type, subtype and age-group reported through case-based laboratory reporting, Canada, weeks 2017-35 to 2018-07 [TR="class: bg-primary, bgcolor: #2572B4"]
Age groups (years) Cumulative (August 27, 2017 to February 17, 2018) [/TR]
[TR="class: bg-primary, bgcolor: #2572B4"]
Influenza A B Influenza A and B [/TR]
[TR="class: bg-primary, bgcolor: #2572B4"]
A Total A(H1) pdm09 A(H3) A (UnS)Table 1 Footnote1 Total # % [/TR]
[TR="bgcolor: #F5F5F5"]
0-4 [TD="class: text-right"]2073[/TD]
[TD="class: text-right"]106[/TD]
[TD="class: text-right"]604[/TD]
[TD="class: text-right"]1363[/TD]
[TD="class: text-right"]877[/TD]
[TD="class: text-right"]2950[/TD]
[TD="class: text-right"]8%[/TD]
[/TR]
[TR]
5-19 [TD="class: text-right"]1761[/TD]
[TD="class: text-right"]82[/TD]
[TD="class: text-right"]652[/TD]
[TD="class: text-right"]1027[/TD]
[TD="class: text-right"]1845[/TD]
[TD="class: text-right"]3606[/TD]
[TD="class: text-right"]10%[/TD]
[/TR]
[TR="bgcolor: #F5F5F5"]
20-44 [TD="class: text-right"]3318[/TD]
[TD="class: text-right"]151[/TD]
[TD="class: text-right"]1266[/TD]
[TD="class: text-right"]1901[/TD]
[TD="class: text-right"]1807[/TD]
[TD="class: text-right"]5125[/TD]
[TD="class: text-right"]15%[/TD]
[/TR]
[TR]
45-64 [TD="class: text-right"]3537[/TD]
[TD="class: text-right"]137[/TD]
[TD="class: text-right"]1401[/TD]
[TD="class: text-right"]1999[/TD]
[TD="class: text-right"]2778[/TD]
[TD="class: text-right"]6315[/TD]
[TD="class: text-right"]18%[/TD]
[/TR]
[TR="bgcolor: #F5F5F5"]
65+ [TD="class: text-right"]10953[/TD]
[TD="class: text-right"]72[/TD]
[TD="class: text-right"]4600[/TD]
[TD="class: text-right"]6281[/TD]
[TD="class: text-right"]5784[/TD]
[TD="class: text-right"]16737[/TD]
[TD="class: text-right"]48%[/TD]
[/TR]
[TR]
Total [TD="class: text-right"]21642[/TD]
[TD="class: text-right"]548[/TD]
[TD="class: text-right"]8523[/TD]
[TD="class: text-right"]12571[/TD]
[TD="class: text-right"]13091[/TD]
[TD="class: text-right"]34733[/TD]
[TD="class: text-right"]100%[/TD]
[/TR]
[TR]
[TD="colspan: 8"] Table 1 Footnote 1 UnS: unsubtyped: The specimen was typed as influenza A, but no result for subtyping was available.
Return to table 1 footnote1referrer

[/TD]
[/TR]
[/TABLE]
[h=2]Syndromic/Influenza-like Illness Surveillance[/h] [h=3]Healthcare Professionals Sentinel Syndromic Surveillance[/h] In week 07, 4.5% of visits to healthcare professionals were due to influenza-like illness (ILI); an increase compared to the previous week, and above the 5-year average.
[h=3]Figure 4 - Percentage of visits for ILI reported by sentinels by report week, Canada, weeks 2017-35 to 2018-06[/h] Number of Sentinels Reporting in Week 07: 163
fig-4-eng.jpg
The shaded area represents the maximum and minimum percentage of visits for ILI reported by week from seasons 2012-13 to 2017-18
Figure 4 - Text Description [h=3]Participatory Syndromic Surveillance[/h] FluWatchers is a participatory ILI surveillance system that relies on weekly voluntary submissions of syndromic information from Canadians across Canada.
In week 07, 1,467 participants reported to FluWatchers, of which 4% reported symptoms of cough and fever, and 20% of these consulted a healthcare professional. Among participants who reported cough and fever, 76% reported days missed from work or school, resulting in a combined total of 140 missed days of work or school.
[TABLE="class: table table-striped table-bordered table-hover table-condensed, width: 1140"]
Table 2 - Summary of influenza-like illness symptoms reported by participating Canadians, Canada, week 2018-07 [TR="class: bg-primary, bgcolor: #2572B4"]
Number of Participants Reporting Percentage participants reporting Cough and Fever Percentage of participants with cough and fever who consulted a healthcare professional Percentage of participants with cough and fever who reported missed days from work or school Number of missed days from work or school [/TR]
[TR="class: text-center, bgcolor: #F5F5F5"]
[TD]1467[/TD]
[TD]4%[/TD]
[TD]20%[/TD]
[TD]76%[/TD]
[TD]140[/TD]
[/TR]
[/TABLE]
[h=2]Influenza Outbreak Surveillance[/h] In week 07, the number of reported laboratory-confirmed outbreaks of influenza decreased compared to the previous week.In week 07, 94 new influenza outbreaks were reported: 55 in long-term care facilities, 11 in hospitals, and 28 in other settings. In addition, four ILI outbreaks were reported schools. Among the 88 outbreaks with influenza type/subtype reported, 47 (53%) were associated with influenza B, 33 (38%) were associated with influenza A and eight outbreaks were associated with a mix of influenza A and B (9%).
To date this season, 1,228 influenza/ILI outbreaks have been reported, of which 729 (60%) occurred in LTC facilities. Among the 1,070 outbreaks for which the influenza type/subtype was reported, 601 (56%) were associated with influenza A and 415 (39%) were associated with influenza B, and 54 (5%) were associated with a mix of A and B. Compared to recent influenza A(H3N2) seasons at week 07, the number of cumulative outbreaks reported this season has been greater than during the 2016-17 season and lower compared to the 2014-15 season.
[h=3]Figure 5 - Number of new outbreaks of laboratory-confirmed influenza by report week, Canada, weeks 2017-35 to 2018-07[/h]
fig-5-eng.jpg
Figure 5 - Text Description [h=2]Severe Outcomes Influenza Surveillance[/h] [h=3]Provincial/Territorial Influenza Hospitalizations and Deaths[/h] In week 07, 46 influenza-associated hospitalizations were reported by participating provinces and territories1. To date this season, 3,451 influenza-associated hospitalizations have been reported, 77% of which were associated with influenza A, and 2,357 cases (68%) were in adults 65 years of age or older. To date, 317 ICU admissions and 163 deaths have been reported.
[h=3]Figure 6 - Cumulative numbers of hospitalizations by age-group reported by participating provinces and territoriesfigure 6 note1, weeks 2017-35 to 2018-07[/h]
fig-6-eng.jpg
Figure 6 - Text Description Figure 6 note 1 Influenza-associated hospitalizations are reported by NL, PE, NS, NB, MB, AB, YT and NT. Only hospitalizations that require intensive medical care are reported by SK.
Return to figure 6 note1referrer

[h=3]Pediatric Influenza Hospitalizations and Deaths[/h] In week 07, the number of laboratory-confirmed influenza-associated pediatric (≤16 years of age) hospitalizations reported by the Immunization Monitoring Program Active (IMPACT) network increased compared to the previous week. In week 07, 89 hospitalizations were reported of which 52 (60%) were due to influenza A. The number of weekly hospitalizations has been above the seven-season average since week 45.
To date this season, 686 pediatric hospitalizations have been reported by the IMPACT network, 431 (63%) of which were associated with influenza A. Children 0-23 months accounted for the largest proportion of influenza A hospitalizations (39%). Among the 255 hospitalizations due to influenza B, children 5-9 years accounted for the largest proportion of cases (30%).
Additionally, 114 ICU admissions and six deaths have been reported to date. Children aged 0-23 months and 10-16 years each accounted for 27% of ICU cases. Among the ICU cases with available information, 65% were due to influenza A and approximately 43% had no reported previous or concurrent medical conditions.
[h=3]Figure 7 - Cumulative numbers of pediatric hospitalizations (≤16 years of age) with influenza by type and age-group reported by the IMPACT network, Canada, weeks 2017-35 to 2018-07[/h]
fig-7-eng.jpg
Figure 7 - Text Description [h=3]Figure 8 - Number of pediatric hospitalizations (≤16 years of age) with influenza reported by the IMPACT network, by week, Canada, weeks 2017-35 to 2018-07[/h]
fig-8-eng.jpg
Figure 8 - Text Description Figure 8 Footnote 1 The shaded area represents the maximum and minimum number of cases reported by week from seasons 2010-11 to 2017-18
Return to figure 8 note1referrer

[h=2]Influenza Strain Characterizations[/h] During the 2017-18 influenza season, the National Microbiology Laboratory (NML) has characterized 1,701 influenza viruses [895 A(H3N2), 86 A(H1N1)pdm09 and 720 B viruses] that were received from Canadian laboratories.
[h=3]Antigenic Characterization[/h] Among influenza viruses characterized by hemagglutination inhibition assay during the 2017-18 season, most viruses were antigenically similar to the cell-culture propagated reference strains recommended by WHO.
[TABLE="class: table table-striped table-bordered table-hover table-condensed, width: 1140"]
Table 3 - Influenza antigenic strain characterizations, Canada, weeks 2017-35 to 2018-07 [TR="class: bg-primary, bgcolor: #2572B4"]
Strain Characterization Results Count Description [/TR]
[TR="bgcolor: #F5F5F5"]
Influenza A (H3N2) [/TR]
[TR]
[TD]A/Hong Kong/4801/2014-like[/TD]
[TD]166[/TD]
[TD]Viruses antigenically similar to A/Hong Kong/4801/2014, the A(H3N2) component of the 2017-18 Northern Hemisphere's trivalent and quadrivalent vaccine.[/TD]
[/TR]
[TR="bgcolor: #F5F5F5"]
[TD]Reduced titer to A/Hong Kong/4801/2014[/TD]
[TD]18[/TD]
[TD]These A(H3N2) viruses reacted poorly with antisera raised against cell-propagated A/Hong Kong/4801/2014, suggesting some antigenic differences.[/TD]
[/TR]
[TR="bgcolor: #F5F5F5"]
Influenza A (H1N1) [/TR]
[TR]
[TD]A/Michigan/45/2015-like[/TD]
[TD]86[/TD]
[TD]Viruses antigenically similar to A/Michigan/45/2015, the A(H1N1) component of the 2017-18 Northern Hemisphere's trivalent and quadrivalent influenza vaccine.[/TD]
[/TR]
[TR="bgcolor: #F5F5F5"]
Influenza B [/TR]
[TR]
[TD]B/Brisbane/60/2008-like
(Victoria lineage)[/TD]
[TD]7[/TD]
[TD]Viruses antigenically similar to B/Brisbane/60/2008.
B/Brisbane/60/2008 is the influenza B component of the 2017-18 Northern Hemisphere's trivalent and quadrivalent influenza vaccine.[/TD]
[/TR]
[TR="bgcolor: #F5F5F5"]
[TD]Reduced titer to B/Brisbane/60/2008
(Victoria lineage)[/TD]
[TD]24[/TD]
[TD]These B/Victoria lineage viruses reacted poorly with antisera raised against cell-propagated B/Brisbane/60/2008, suggesting some antigenic differences.[/TD]
[/TR]
[TR]
[TD]B/Phuket/3073/2013-like
(Yamagata lineage)[/TD]
[TD]689[/TD]
[TD]Viruses antigenically similar to B/Phuket/3073/2013, the additional influenza B component of the 2017-18 Northern Hemisphere quadrivalent influenza vaccine.[/TD]
[/TR]
[/TABLE]
[h=3]Genetic Characterization of A(H3N2) viruses[/h] During the 2017-18 season, 711 A(H3N2) viruses did not grow to sufficient titers for antigenic characterization by HI assay. Therefore, genetic characterization was performed to determine to which genetic group they belong. Sequence analysis showed that 632 A(H3N2) viruses belonged to genetic group 3C.2a, 77 viruses belonged to subclade 3C.2a1 and two viruses belonged to the clade 3C.3a.
Additionally, of the 184 influenza A(H3N2) viruses that were characterized antigenically as similar to A/Hong Kong/4801/2014, 144 belonged to genetic group 3C.2a and 16 viruses belonged to subclade 3C.2a1. The 18 viruses that showed reduced titer to A/Hong Kong/4801/2014 belonged to genetic clade 3C.3a. Sequencing is pending for the six remaining virus isolates.
A/Hong Kong/4801/2014-like virus belongs to genetic group 3C.2a and is the influenza A/H3N2 component of the 2017-18 Northern Hemisphere influenza vaccine.
[h=3]Genetic Characterization of Influenza B viruses[/h] Among the viruses characterized antigenically as having reduced titer to ferret antisera produced against cell-propagated B/Brisbane/60/2008, sequence analysis showed that all 22 viruses had a two amino acid deletion in the HA gene. Sequencing is pending for the two remaining virus isolates.
...

https://www.canada.ca/en/public-hea...atch/2017-2018/week7-february-11-17-2018.html


[h=1]FluWatch report: February 18 to February 24, 2018 (week 8)[/h]
cover-eng.jpg

Download the alternative format
(PDF format, 527 KB, 10 pages)
Organization:
Public Health Agency of Canada
Date published: 2018-03-02

[h=5]Related Topics[/h]


[h=5]Overall Summary[/h]
  • Overall, influenza activity in Canada remains at peak levels.
  • Influenza activity is slowly decreasing in many parts of the country.
  • Detections of influenza B were greater than those of influenza A.
  • To date this season, the majority of laboratory-confirmed cases, hospitalizations and deaths with influenza have been among adults 65 years of age and older.
  • For more information on the flu, see our Flu(influenza) web page.
[h=2]On this page[/h]
[h=2]Influenza/Influenza-like Illness Activity (geographic spread)[/h] In week 08, three regions (BC(1), ON(1), and QC(1)) reported widespread activity, and 25 regions (BC(1), AB(2), SK(1), MB(1), ON(6), QC(5), NB(3), NS(3), and NL(3) reported localized activity.


[h=3]Figure 1 - Map of overall influenza/ILI activity level by province and territory, Canada, week 2018-08[/h]
fig-1-eng.jpg
Note: Influenza/ILI activity levels, as represented on this map, are assigned and reported by Provincial and Territorial Ministries of Health, based on laboratory confirmations, sentinel ILI rates and reported outbreaks. Please refer to detailed definitions at the end of the report. Maps from previous weeks, including any retrospective updates, are available in the mapping feature found in the Weekly Influenza Reports.
Figure 1 - Text Description [h=2]Laboratory-Confirmed Influenza Detections[/h] In week 08, the overall percentage of tests positive for influenza was 31%, a small decrease from the previous week. The percentage of tests positive for influenza A continues to decline slowly to 14% in week 08. The percentage of tests positive for influenza B was similar to the previous week (17%). Similar to the previous week, detections of influenza B were greater than those of influenza A.
The percentage of influenza A detections for week 08 are below average but remain within the expected range for this time of year. The percentage of tests positive for influenza B in week 08 continues to be well above expected levels for this time of year. For data on other respiratory virus detections, see theRespiratory Virus Detections in Canada Report. [h=3]Figure 2 - Number of positive influenza tests and percentage of tests positive, by type, subtype and report week, Canada, weeks 2017-35 to 2018-08[/h]
fig-2-eng.jpg
The shaded area indicates weeks where the positivity rate was at least 5% and a minimum of 15 positive tests were observed, signalling the period of seasonal influenza activity.
Figure 2 - Text Description To date this season, 44,497 laboratory-confirmed influenza detections have been reported, of which 59% have been influenza A. Influenza A(H3N2) has been the most common subtype detected this season, representing 93% of subtyped influenza A detections. For more detailed weekly and cumulative influenza data, see the text descriptions for Figures 2 and 3 or the Respiratory Virus Detections in Canada Report.
[h=3]Figure 3 - Cumulative numbers of positive influenza specimens by type/subtype and province/territory, Canada, weeks 2017-35 to 2018-08[/h]
fig-3-eng.jpg
Figure 3 - Text Description To date this season, detailed information on age and type/subtype has been received for 38,578 laboratory-confirmed influenza cases (Table 1). Adults 65 years of age and older represent the largest proportion of cases overall (49%), and among cases of influenza A(H3N2) (57%) and influenza B (46%). Adults aged 20-64 represent 32% of cases overall and 30% of influenza A(H3N2) and 34% of influenza B cases. Although much smaller in numbers (555), the majority of influenza A(H1N1) cases are among adults less than 65 years of age, with adults aged 20-64 and children 0-19 years accounting for 54% and 32% of cases respectively.
[TABLE="class: table table-striped table-bordered table-hover table-condensed, width: 1140"]
Table 1 - Weekly and cumulative numbers of positive influenza specimens by type, subtype and age-group reported through case-based laboratory reporting, Canada, weeks 2017-35 to 2018-08 [TR="class: bg-primary, bgcolor: #2572B4"]
Age groups (years) Cumulative (August 27, 2017 to February 24, 2018) [/TR]
[TR="class: bg-primary, bgcolor: #2572B4"]
Influenza A B Influenza A and B [/TR]
[TR="class: bg-primary, bgcolor: #2572B4"]
A Total A(H1) pdm09 A(H3) A (UnS)Table 1 Footnote1 Total # % [/TR]
[TR="bgcolor: #F5F5F5"]
0-4 [TD]2351[/TD]
[TD]99[/TD]
[TD]488[/TD]
[TD]1764[/TD]
[TD]1059[/TD]
[TD]3410[/TD]
[TD]9%[/TD]
[/TR]
[TR]
5-19 [TD]1819[/TD]
[TD]79[/TD]
[TD]488[/TD]
[TD]1252[/TD]
[TD]1974[/TD]
[TD]3793[/TD]
[TD]10%[/TD]
[/TR]
[TR="bgcolor: #F5F5F5"]
20-44 [TD]3394[/TD]
[TD]157[/TD]
[TD]1061[/TD]
[TD]2176[/TD]
[TD]2000[/TD]
[TD]5394[/TD]
[TD]14%[/TD]
[/TR]
[TR]
45-64 [TD]3724[/TD]
[TD]143[/TD]
[TD]1251[/TD]
[TD]2330[/TD]
[TD]3252[/TD]
[TD]6976[/TD]
[TD]18%[/TD]
[/TR]
[TR="bgcolor: #F5F5F5"]
65+ [TD]11828[/TD]
[TD]77[/TD]
[TD]4413[/TD]
[TD]7338[/TD]
[TD]7177[/TD]
[TD]19005[/TD]
[TD]49%[/TD]
[/TR]
[TR]
Total [TD]23116[/TD]
[TD]555[/TD]
[TD]7701[/TD]
[TD]14860[/TD]
[TD]15462[/TD]
[TD]38578[/TD]
[TD]100%[/TD]
[/TR]
[TR]
[TD="colspan: 8"] Table 1 Footnote 1 UnS: unsubtyped: The specimen was typed as influenza A, but no result for subtyping was available.
Return to table 1 footnote1referrer

[/TD]
[/TR]
[/TABLE]
[h=2]Syndromic/Influenza-like Illness Surveillance[/h] [h=3]Healthcare Professionals Sentinel Syndromic Surveillance[/h] In week 08, 3.0% of visits to healthcare professionals were due to influenza-like illness (ILI); an increase compared to the previous week, and above the 5-year average.
[h=3]Figure 4 - Percentage of visits for ILI reported by sentinels by report week, Canada, weeks 2017-35 to 2018-06[/h] Number of Sentinels Reporting in Week 08: 164
fig-4-eng.jpg
The shaded area represents the maximum and minimum percentage of visits for ILI reported by week from seasons 2012-13 to 2017-18
Figure 4 - Text Description [h=3]Participatory Syndromic Surveillance[/h] FluWatchers is a participatory ILI surveillance system that relies on weekly voluntary submissions of syndromic information from Canadians across Canada.
In week 08, 1,419 participants reported to FluWatchers, of which 4% reported symptoms of cough and fever, and 30% of these consulted a healthcare professional. Among participants who reported cough and fever, 78% reported days missed from work or school, resulting in a combined total of 112 missed days of work or school.
[TABLE="class: table table-striped table-bordered table-hover table-condensed, width: 1140"]
Table 2 - Summary of influenza-like illness symptoms reported by participating Canadians, Canada, week 2018-08 [TR="class: bg-primary, bgcolor: #2572B4"]
Number of Participants Reporting Percentage participants reporting Cough and Fever Percentage of participants with cough and fever who consulted a healthcare professional Percentage of participants with cough and fever who reported missed days from work or school Number of missed days from work or school [/TR]
[TR="class: text-center, bgcolor: #F5F5F5"]
[TD]1419[/TD]
[TD]4%[/TD]
[TD]30%[/TD]
[TD]78%[/TD]
[TD]112[/TD]
[/TR]
[/TABLE]
[h=2]Influenza Outbreak Surveillance[/h] In week 08, the number of reported laboratory-confirmed outbreaks of influenza decreased compared to the previous week. In week 08, 86 new influenza outbreaks were reported: 56 in long-term care facilities, eight in hospitals, and 22 in other settings. In addition, three ILI outbreaks were reported schools. Among the 75 outbreaks with influenza type/subtype reported, 35 (47%) were associated with influenza B, 34 (45%) were associated with influenza A and six outbreaks were associated with a mix of influenza A and B (8%).
To date this season, 1,317 influenza/ILI outbreaks have been reported, of which 785 (60%) occurred in LTC facilities. Among the 1,145 outbreaks for which the influenza type/subtype was reported, 635 (55%) were associated with influenza A and 450 (39%) were associated with influenza B, and 60 (5%) were associated with a mix of A and B. Compared to recent influenza A(H3N2) seasons at week 08, the number of cumulative outbreaks reported this season has been greater than during the 2016-17 season and lower compared to the 2014-15 season.
[h=3]Figure 5 - Number of new outbreaks of laboratory-confirmed influenza by report week, Canada, weeks 2017-35 to 2018-08[/h]
fig-5-eng.jpg
Figure 5 - Text Description [h=2]Severe Outcomes Influenza Surveillance[/h] [h=3]Provincial/Territorial Influenza Hospitalizations and Deaths[/h] To date this season, 3,584 influenza-associated hospitalizations were reported by participating provinces and territories1. Among the hospitalizations, 2,702 (75%) were associated with influenza A, and 2,434 cases (68%) were in adults 65 years of age or older.
Additionally, 339 ICU admissions and 170 deaths have been reported to date. Adults aged 65 years of age or older accounted for the greatest proportion of ICU cases (43%), followed closely by adults aged 20-64 (41%). Adults aged 65 years of age or older accounted the majority of deaths (82%).
[h=3]Figure 6 - Cumulative numbers of hospitalizations by age-group reported by participating provinces and territoriesfigure 6 note1, weeks 2017-35 to 2018-08[/h]
fig-6-eng.jpg
Figure 6 - Text Description Figure 6 note 1 Influenza-associated hospitalizations are reported by NL, PE, NS, NB, MB, AB, YT and NT. Only hospitalizations that require intensive medical care are reported by SK.
Return to figure 6 note1referrer

[h=3]Pediatric Influenza Hospitalizations and Deaths[/h] In week 08, the number of laboratory-confirmed influenza-associated pediatric (≤16 years of age) hospitalizations reported by the Immunization Monitoring Program Active (IMPACT) network decreased compared to the previous week. In week 08, 68 hospitalizations were reported of which 48 (70%) were due to influenza A. The number of weekly hospitalizations has been above the seven-season average since week 45.
To date this season, 756 pediatric hospitalizations have been reported by the IMPACT network, 481 (64%) of which were associated with influenza A. Children 0-23 months accounted for the largest proportion of influenza A hospitalizations (39%). Among the 275 hospitalizations due to influenza B, children 5-9 years accounted for the largest proportion of cases (30%).
Additionally, 126 ICU admissions and eight deaths have been reported to date. Children aged 0-23 months accounted for the greatest proportion of ICU cases (29%). Among the ICU cases with available information, 66% were due to influenza A and approximately 43% had no reported previous or concurrent medical conditions. All reported deaths were among children over the age of two.
[h=3]Figure 7 - Cumulative numbers of pediatric hospitalizations (≤16 years of age) with influenza by type and age-group reported by the IMPACT network, Canada, weeks 2017-35 to 2018-08[/h]
fig-7-eng.jpg
Figure 7 - Text Description [h=3]Figure 8 - Number of pediatric hospitalizations (≤16 years of age) with influenza reported by the IMPACT network, by week, Canada, weeks 2017-35 to 2018-08[/h]
fig-8-eng.jpg
Figure 8 - Text Description Figure 8 Footnote 1 The shaded area represents the maximum and minimum number of cases reported by week from seasons 2010-11 to 2017-18
Return to figure 8 note1referrer

[h=2]Influenza Strain Characterizations[/h] During the 2017-18 influenza season, the National Microbiology Laboratory (NML) has characterized 1,917 influenza viruses [981 A(H3N2), 98 A(H1N1)pdm09 and 838 B viruses] that were received from Canadian laboratories.
[h=3]Antigenic Characterization[/h] Among influenza viruses characterized by hemagglutination inhibition assay during the 2017-18 season, most viruses were antigenically similar to the cell-culture propagated reference strains recommended by WHO.
[TABLE="class: table table-striped table-bordered table-hover table-condensed, width: 1140"]
Table 3 - Influenza antigenic strain characterizations, Canada, weeks 2017-35 to 2018-08 [TR="class: bg-primary, bgcolor: #2572B4"]
Strain Characterization Results Count Description [/TR]
[TR="bgcolor: #F5F5F5"]
Influenza A (H3N2) [/TR]
[TR]
[TD]A/Hong Kong/4801/2014-like[/TD]
[TD]189[/TD]
[TD]Viruses antigenically similar to A/Hong Kong/4801/2014, the A(H3N2) component of the 2017-18 Northern Hemisphere's trivalent and quadrivalent vaccine. [/TD]
[/TR]
[TR="bgcolor: #F5F5F5"]
[TD]Reduced titer to A/Hong Kong/4801/2014[/TD]
[TD]29[/TD]
[TD]These A(H3N2) viruses reacted poorly with antisera raised against cell-propagated A/Hong Kong/4801/2014, suggesting some antigenic differences[/TD]
[/TR]
[TR]
Influenza A (H1N1)pdm09 [/TR]
[TR="bgcolor: #F5F5F5"]
[TD]A/Michigan/45/2015-like[/TD]
[TD]98[/TD]
[TD]Viruses antigenically similar to A/Michigan/45/2015, the A(H1N1)pdm09 component of the 2017-18 Northern Hemisphere's trivalent and quadrivalent influenza vaccine.[/TD]
[/TR]
[TR]
Influenza B [/TR]
[TR="bgcolor: #F5F5F5"]
[TD]B/Brisbane/60/2008-like (Victoria lineage)[/TD]
[TD]8[/TD]
[TD]Viruses antigenically similar to B/Brisbane/60/2008.
B/Brisbane/60/2008 is the influenza B component of the 2017-18 Northern Hemisphere's trivalent and quadrivalent influenza vaccine.[/TD]
[/TR]
[TR]
[TD]Reduced titer to B/Brisbane/60/2008
(Victoria lineage)[/TD]
[TD]28[/TD]
[TD]These B/Victoria lineage viruses reacted poorly with antisera raised against cell-propagated B/Brisbane/60/2008, suggesting some antigenic differences.[/TD]
[/TR]
[TR="bgcolor: #F5F5F5"]
[TD]B/Phuket/3073/2013-like
(Yamagata lineage)[/TD]
[TD]802[/TD]
[TD]Viruses antigenically similar to B/Phuket/3073/2013, the additional influenza B component of the 2017-18 Northern Hemisphere quadrivalent influenza vaccine.[/TD]
[/TR]
[/TABLE]
[h=3]Genetic Characterization of A(H3N2) viruses[/h] During the 2017-18 season, 763 A(H3N2) viruses did not grow to sufficient titers for antigenic characterization by HI assay. Therefore, genetic characterization was performed to determine to which genetic group they belong. Sequence analysis showed that 679 A(H3N2) viruses belonged to genetic group 3C.2a, 82 viruses belonged to subclade 3C.2a1 and two viruses belonged to the clade 3C.3a.
Additionally, of the 218 influenza A(H3N2) viruses that were characterized antigenically as similar to A/Hong Kong/4801/2014, 153 belonged to genetic group 3C.2a and 17 viruses belonged to subclade 3C.2a1. The 29 viruses that showed reduced titer to A/Hong Kong/4801/2014 belonged to genetic clade 3C.3a. Sequencing is pending for the 19 remaining virus isolates.
A/Hong Kong/4801/2014-like virus belongs to genetic group 3C.2a and is the influenza A/H3N2 component of the 2017-18 Northern Hemisphere influenza vaccine.
[h=3]Genetic Characterization of Influenza B viruses[/h] Among the viruses characterized antigenically as having reduced titer to ferret antisera produced against cell-propagated B/Brisbane/60/2008, sequence analysis showed that all 28 viruses had a two amino acid deletion in the HA gene. Sequencing is pending for the two remaining virus isolates.
...

https://www.canada.ca/en/public-hea...-2018/week8-february-18-february-24-2018.html
 
[h=1]FluWatch report: February 25 to March 3, 2018 (week 9)[/h]
cover-eng.jpg

Download the alternative format
(PDF format, 539 KB, 10 pages)
Organization:
Public Health Agency of Canada
Date published: 2018-03-09

[h=5]Related Topics[/h]


[h=5]Overall Summary[/h]
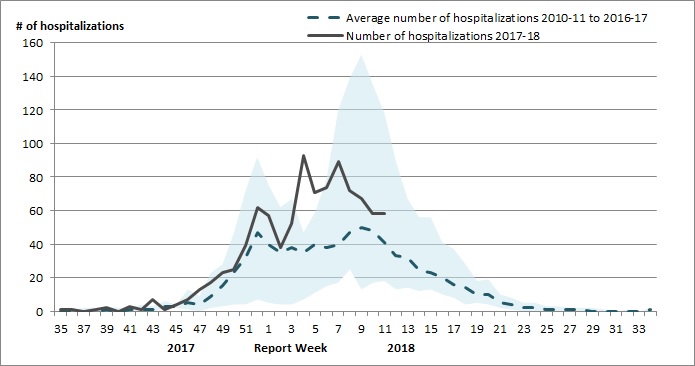
  • Laboratory data suggests that the influenza season peaked in week 07 but influenza activity in Canada remains high .
  • Influenza activity is slowly decreasing in many parts of the country.
  • Detections of influenza B continue to be greater than those of influenza A.
  • To date this season, the majority of laboratory-confirmed cases, hospitalizations and deaths with influenza have been among adults 65 years of age and older.
  • For more information on the flu, see our Flu(influenza) web page.
[h=2]On this page[/h]
[h=2]Influenza/Influenza-like Illness Activity (geographic spread)[/h] In week 09, seven regions (BC(2), ON(1), and QC(4)) reported widespread activity, and 22 regions (BC(1), AB(1), MB(2), ON(5), QC(2), NB(3), NS(4), NL(3), and PE(1)) reported localized activity.


[h=3]Figure 1 - Map of overall influenza/ILI activity level by province and territory, Canada, week 2018-09[/h]
fig-1-eng.jpg
Note: Influenza/ILI activity levels, as represented on this map, are assigned and reported by Provincial and Territorial Ministries of Health, based on laboratory confirmations, sentinel ILI rates and reported outbreaks. Please refer to detailed definitions at the end of the report. Maps from previous weeks, including any retrospective updates, are available in the mapping feature found in the Weekly Influenza Reports.
Figure 1 - Text Description [h=2]Laboratory-Confirmed Influenza Detections[/h] In week 09, the overall percentage of tests positive for influenza was 30%. For the past two weeks, the percentage of tests positive for influenza B has decreased. This indicates that the peak for influenza B detections occurred in week 07. This also suggests that the peak for the influenza season occurred week 07.
The percentage of influenza A detections for week 09 are below average but remain within the expected range for this time of year. The percentage of tests positive for influenza B in week 09 continues to be well above expected levels for this time of year. For data on other respiratory virus detections, see the Respiratory Virus Detections in Canada Report.
[h=3]Figure 2 - Number of positive influenza tests and percentage of tests positive, by type, subtype and report week, Canada, weeks 2017-35 to 2018-09[/h]
fig-2-eng.jpg
The shaded area indicates weeks where the positivity rate was at least 5% and a minimum of 15 positive tests were observed, signalling the period of seasonal influenza activity.
Figure 2 - Text Description To date this season, 50,912 laboratory-confirmed influenza detections have been reported, of which 58% have been influenza A. Influenza A(H3N2) has been the most common subtype detected this season, representing 93% of subtyped influenza A detections. For more detailed weekly and cumulative influenza data, see the text descriptions for Figures 2 and 3 or the Respiratory Virus Detections in Canada Report.
[h=3]Figure 3 - Cumulative numbers of positive influenza specimens by type/subtype and province/territory, Canada, weeks 2017-35 to 2018-09[/h]
fig-3-eng.jpg
Figure 3 - Text Description To date this season, detailed information on age and type/subtype has been received for 41,767 laboratory-confirmed influenza cases (Table 1). Adults 65 years of age and older represent the largest proportion of cases overall (49%), and among cases of influenza A(H3N2) (58%) and influenza B (47%). Adults aged 20-64 represent 32% of cases overall and 30% of influenza A(H3N2) and 34% of influenza B cases. Although much smaller in numbers (596), the majority of influenza A(H1N1) cases are among adults less than 65 years of age, with adults aged 20-64 and children 0-19 years accounting for 54% and 32% of cases respectively.
[TABLE="class: table table-striped table-bordered table-hover table-condensed, width: 1140"]
Table 1 - Weekly and cumulative numbers of positive influenza specimens by type, subtype and age-group reported through case-based laboratory reporting, Canada, weeks 2017-35 to 2018-09 [TR="class: bg-primary, bgcolor: #2572B4"]
Age groups (years) Cumulative (August 27, 2017 to March 3, 2018) [/TR]
[TR="class: bg-primary, bgcolor: #2572B4"]
Influenza A B Influenza A and B [/TR]
[TR="class: bg-primary, bgcolor: #2572B4"]
A Total A(H1) pdm09 A(H3) A (UnS)Table 1 Footnote1 Total # % [/TR]
[TR="bgcolor: #F5F5F5"]
0-4 [TD]2569[/TD]
[TD]106[/TD]
[TD]507[/TD]
[TD]1956[/TD]
[TD]1159[/TD]
[TD]3728[/TD]
[TD]9%[/TD]
[/TR]
[TR]
5-19 [TD]1971[/TD]
[TD]87[/TD]
[TD]499[/TD]
[TD]1385[/TD]
[TD]2135[/TD]
[TD]4106[/TD]
[TD]10%[/TD]
[/TR]
[TR="bgcolor: #F5F5F5"]
20-44 [TD]3610[/TD]
[TD]170[/TD]
[TD]1086[/TD]
[TD]2354[/TD]
[TD]2229[/TD]
[TD]5839[/TD]
[TD]14%[/TD]
[/TR]
[TR]
45-64 [TD]3926[/TD]
[TD]150[/TD]
[TD]1286[/TD]
[TD]2490[/TD]
[TD]3596[/TD]
[TD]7522[/TD]
[TD]18%[/TD]
[/TR]
[TR="bgcolor: #F5F5F5"]
65+ [TD]12593[/TD]
[TD]83[/TD]
[TD]4615[/TD]
[TD]7895[/TD]
[TD]7979[/TD]
[TD]20572[/TD]
[TD]49%[/TD]
[/TR]
[TR]
Total [TD]24669[/TD]
[TD]596[/TD]
[TD]7993[/TD]
[TD]16080[/TD]
[TD]17098[/TD]
[TD]41767[/TD]
[TD]100%[/TD]
[/TR]
[TR]
[TD="colspan: 8"] Table 1 Footnote 1 UnS: unsubtyped: The specimen was typed as influenza A, but no result for subtyping was available.
Return to table 1 footnote1referrer

[/TD]
[/TR]
[/TABLE]
[h=2]Syndromic/Influenza-like Illness Surveillance[/h] [h=3]Healthcare Professionals Sentinel Syndromic Surveillance[/h] In week 09, 3.2% of visits to healthcare professionals were due to influenza-like illness (ILI); similar to the previous week, and above the 5-year average.
[h=3]Figure 4 - Percentage of visits for ILI reported by sentinels by report week, Canada, weeks 2017-35 to 2018-09[/h] Number of Sentinels Reporting in Week 09: 177
fig-4-eng.jpg
The shaded area represents the maximum and minimum percentage of visits for ILI reported by week from seasons 2012-13 to 2017-18
Figure 4 - Text Description [h=3]Participatory Syndromic Surveillance[/h] FluWatchers is a participatory ILI surveillance system that relies on weekly voluntary submissions of syndromic information from Canadians across Canada.
In week 09, 1,419 participants reported to FluWatchers, of which 3% reported symptoms of cough and fever, and 14% of these consulted a healthcare professional. Among participants who reported cough and fever, 69% reported days missed from work or school, resulting in a combined total of 90 missed days of work or school.
[TABLE="class: table table-striped table-bordered table-hover table-condensed, width: 1140"]
Table 2 - Summary of influenza-like illness symptoms reported by participating Canadians, Canada, week 2018-09 [TR="class: bg-primary, bgcolor: #2572B4"]
Number of Participants Reporting Percentage participants reporting Cough and Fever Percentage of participants with cough and fever who consulted a healthcare professional Percentage of participants with cough and fever who reported missed days from work or school Number of missed days from work or school [/TR]
[TR="class: text-center, bgcolor: #F5F5F5"]
[TD]1419[/TD]
[TD]3%[/TD]
[TD]14%[/TD]
[TD]69%[/TD]
[TD]90[/TD]
[/TR]
[/TABLE]
[h=2]Influenza Outbreak Surveillance[/h] In week 09, 103 laboratory-confirmed outbreaks of influenza were reported, an increase compared to the previous week. Among the reported influenza outbreaks, 79 were reported in long-term care facilities, eight in hospitals, and 16 in other settings. In addition, seven ILI outbreaks were reported schools. Among the 87 outbreaks with influenza type/subtype reported, 48 (55%) were associated with influenza B, 37 (43%) were associated with influenza A and two outbreaks were associated with a mix of influenza A and B (2%).
To date this season, 1,428 influenza/ILI outbreaks have been reported, of which 865 (61%) occurred in LTC facilities. Among the 1,232 outbreaks for which the influenza type/subtype was reported, 672 (54%) were associated with influenza A and 498 (40%) were associated with influenza B, and 62 (5%) were associated with a mix of A and B.
[h=3]Figure 5 - Number of new outbreaks of laboratory-confirmed influenza by report week, Canada, weeks 2017-35 to 2018-09[/h]
fig-5-eng.jpg
Figure 5 - Text Description [h=2]Severe Outcomes Influenza Surveillance[/h] [h=3]Provincial/Territorial Influenza Hospitalizations and Deaths[/h] To date this season, 3,892 influenza-associated hospitalizations were reported by participating provinces and territories1. Among the hospitalizations, 2,861 (74%) were associated with influenza A, and 2,629 cases (68%) were in adults 65 years of age or older.
Additionally, 377 ICU admissions and 189 deaths have been reported to date. Adults aged 65 years of age or older accounted for the greatest proportion of ICU cases (43%), followed closely by adults aged 20-64 (42%). Adults aged 65 years of age or older accounted the majority of deaths (84%).
[h=3]Figure 6 - Cumulative numbers of hospitalizations by age-group reported by participating provinces and territoriesfigure 6 note1, weeks 2017-35 to 2018-09[/h]
fig-6-eng.jpg
Figure 6 - Text Description Figure 6 note 1 Influenza-associated hospitalizations are reported by NL, PE, NS, NB, MB, AB, YT and NT. Only hospitalizations that require intensive medical care are reported by SK.
Return to figure 6 note1referrer

[h=3]Pediatric Influenza Hospitalizations and Deaths[/h] In week 09, the number of laboratory-confirmed influenza-associated pediatric (≤16 years of age) hospitalizations reported by the Immunization Monitoring Program Active (IMPACT) network decreased compared to the previous week. In week 09, 58 hospitalizations were reported of which 36 (62%) were due to influenza A. The number of weekly hospitalizations has been above the seven-season average since week 45.
To date this season, 811 pediatric hospitalizations have been reported by the IMPACT network, 516 (64%) of which were associated with influenza A. Children 0-23 months accounted for the largest proportion of influenza A hospitalizations (39%). Among the 295 hospitalizations due to influenza B, children 5-9 years accounted for the largest proportion of cases (30%).
Additionally, 135 ICU admissions and nine deaths have been reported to date. Children aged 0-23 months accounted for the greatest proportion of ICU cases (28%), followed closely by children aged 10-16 years (27%). Among the ICU cases with available information, 65% were due to influenza A and approximately 43% had no reported previous or concurrent medical conditions. All reported deaths were among children over the age of two.
[h=3]Figure 7 - Cumulative numbers of pediatric hospitalizations (≤16 years of age) with influenza by type and age-group reported by the IMPACT network, Canada, weeks 2017-35 to 2018-09[/h]
fig-7-eng.jpg
Figure 7 - Text Description [h=3]Figure 8 - Number of pediatric hospitalizations (≤16 years of age) with influenza reported by the IMPACT network, by week, Canada, weeks 2017-35 to 2018-09[/h]
fig-8-eng.jpg
Figure 8 - Text Description Figure 8 Footnote 1 The shaded area represents the maximum and minimum number of cases reported by week from seasons 2010-11 to 2017-18
Return to figure 8 note1referrer

[h=2]Influenza Strain Characterizations[/h] During the 2017-18 influenza season, the National Microbiology Laboratory (NML) has characterized 2,085 influenza viruses [1,040 A(H3N2), 123 A(H1N1)pdm09 and 922 B viruses] that were received from Canadian laboratories.
[h=3]Antigenic Characterization[/h] Among influenza viruses characterized by hemagglutination inhibition assay during the 2017-18 season, most viruses were antigenically similar to the cell-culture propagated reference strains recommended by WHO.
[TABLE="class: table table-striped table-bordered table-hover table-condensed, width: 1140"]
Table 3 - Influenza antigenic strain characterizations, Canada, weeks 2017-35 to 2018-09 [TR="class: bg-primary, bgcolor: #2572B4"]
Strain Characterization Results Count Description [/TR]
[TR="bgcolor: #F5F5F5"]
Influenza A (H3N2) [/TR]
[TR]
[TD]A/Hong Kong/4801/2014-like[/TD]
[TD]207[/TD]
[TD]Viruses antigenically similar to A/Hong Kong/4801/2014, the A(H3N2) component of the 2017-18 Northern Hemisphere's trivalent and quadrivalent vaccine. [/TD]
[/TR]
[TR="bgcolor: #F5F5F5"]
[TD]Reduced titer to A/Hong Kong/4801/2014[/TD]
[TD]30[/TD]
[TD]These A(H3N2) viruses reacted poorly with antisera raised against cell-propagated A/Hong Kong/4801/2014, suggesting some antigenic differences[/TD]
[/TR]
[TR]
Influenza A (H1N1)pdm09 [/TR]
[TR="bgcolor: #F5F5F5"]
[TD]A/Michigan/45/2015-like[/TD]
[TD]123[/TD]
[TD]Viruses antigenically similar to A/Michigan/45/2015, the A(H1N1)pdm09 component of the 2017-18 Northern Hemisphere's trivalent and quadrivalent influenza vaccine.[/TD]
[/TR]
[TR]
Influenza B [/TR]
[TR="bgcolor: #F5F5F5"]
[TD]B/Brisbane/60/2008-like (Victoria lineage)[/TD]
[TD]8[/TD]
[TD]Viruses antigenically similar to B/Brisbane/60/2008.
B/Brisbane/60/2008 is the influenza B component of the 2017-18 Northern Hemisphere's trivalent and quadrivalent influenza vaccine.[/TD]
[/TR]
[TR]
[TD]Reduced titer to B/Brisbane/60/2008
(Victoria lineage)[/TD]
[TD]36[/TD]
[TD]These B/Victoria lineage viruses reacted poorly with antisera raised against cell-propagated B/Brisbane/60/2008, suggesting some antigenic differences.[/TD]
[/TR]
[TR="bgcolor: #F5F5F5"]
[TD]B/Phuket/3073/2013-like
(Yamagata lineage)[/TD]
[TD]878[/TD]
[TD]Viruses antigenically similar to B/Phuket/3073/2013, the additional influenza B component of the 2017-18 Northern Hemisphere quadrivalent influenza vaccine.[/TD]
[/TR]
[/TABLE]
[h=3]Genetic Characterization of A(H3N2) viruses[/h] During the 2017-18 season, 803 A(H3N2) viruses did not grow to sufficient titers for antigenic characterization by HI assay. Therefore, genetic characterization was performed to determine to which genetic group they belong. Sequence analysis showed that 719 A(H3N2) viruses belonged to genetic group 3C.2a, 82 viruses belonged to subclade 3C.2a1 and two viruses belonged to the clade 3C.3a.
Additionally, of the 237 influenza A(H3N2) viruses that were characterized antigenically as similar to A/Hong Kong/4801/2014, 176 belonged to genetic group 3C.2a and 21 viruses belonged to subclade 3C.2a1. The 30 viruses that showed reduced titer to A/Hong Kong/4801/2014 belonged to genetic clade 3C.3a. Sequencing is pending for the 10 remaining virus isolates.
A/Hong Kong/4801/2014-like virus belongs to genetic group 3C.2a and is the influenza A/H3N2 component of the 2017-18 Northern Hemisphere influenza vaccine.
[h=3]Genetic Characterization of Influenza B viruses[/h] Among the viruses characterized antigenically as having reduced titer to ferret antisera produced against cell-propagated B/Brisbane/60/2008, sequence analysis showed that 28 viruses had a two amino acid deletion in the HA gene. Sequencing is pending for the eight remaining virus isolates.
...
https://www.canada.ca/en/public-hea...2017-2018/week9-february-25-march-3-2018.html

 
[h=1]FluWatch report: March 4, 2018 to March 10, 2018 (week 10)[/h]
pub-eng.jpg

Download the alternative format
(PDF format, 539 KB, 10 pages)
Organization:
Public Health Agency of Canada
Date published: 2018-03-16

[h=5]Related Topics[/h]


[h=5]Overall Summary[/h]
  • All indicators of influenza activity decreased from the previous week.
  • Influenza activity remains elevated in many parts of the country.
  • Detections of influenza B continue to be greater than those of influenza A.
  • To date this season, the majority of laboratory-confirmed cases, hospitalizations and deaths with influenza have been among adults 65 years of age and older.
  • For more information on the flu, see our Flu(influenza) web page.
[h=2]On this page[/h]
[h=2]Influenza/Influenza-like Illness Activity (geographic spread)[/h] In week 10, two regions (BC(1), and QC(1)) reported widespread activity, and 24 regions (BC(2), AB(2), ON(6), QC(4), NB(2), NS(4), NL(3), and NT(1)) reported localized activity.


[h=3]Figure 1 - Map of overall influenza/ILI activity level by province and territory, Canada, week 2018-10[/h]
fig1-eng.jpg
Note: Influenza/ILI activity levels, as represented on this map, are assigned and reported by Provincial and Territorial Ministries of Health, based on laboratory confirmations, sentinel ILI rates and reported outbreaks. Please refer to detailed definitions at the end of the report. Maps from previous weeks, including any retrospective updates, are available in the mapping feature found in the Weekly Influenza Reports.
Figure 1 - Text Description [h=2]Laboratory-Confirmed Influenza Detections[/h] In week 10, the overall percentage of tests positive for influenza was 27%. The overall percentage of tests positive for influenza has been slowly decreasing from the peak in week 07. Detections of influenza B continue to be greater than those of influenza A. Influenza B accounted for 55% of influenza detections in week 10.
The percentage of influenza A detections for week 10 are below average but remain within the expected range for this time of year. The percentage of tests positive for influenza B in week 10 continues to be well above expected levels for this time of year. For data on other respiratory virus detections, see the Respiratory Virus Detections in Canada Report.
[h=3]Figure 2 - Number of positive influenza tests and percentage of tests positive, by type, subtype and report week, Canada, weeks 2017-35 to 2018-10[/h]
fig2-eng.jpg
The shaded area indicates weeks where the positivity rate was at least 5% and a minimum of 15 positive tests were observed, signalling the period of seasonal influenza activity.
Figure 2 - Text Description To date this season, 53,898 laboratory-confirmed influenza detections have been reported, of which 57% have been influenza A. Influenza A(H3N2) has been the most common subtype detected this season, representing 93% of subtyped influenza A detections. For more detailed weekly and cumulative influenza data, see the text descriptions for Figures 2 and 3 or the Respiratory Virus Detections in Canada Report.
[h=3]Figure 3 - Cumulative numbers of positive influenza specimens by type/subtype and province/territory, Canada, weeks 2017-35 to 2018-10[/h]
fig3-eng.jpg
Figure 3 - Text Description To date this season, detailed information on age and type/subtype has been received for 44,153 laboratory-confirmed influenza cases (Table 1). Adults 65 years of age and older represent the largest proportion of cases overall (49%), and among cases of influenza A(H3N2) (58%) and influenza B (47%). Adults aged 20-64 represent 32% of cases overall and 29% of influenza A(H3N2) and 34% of influenza B cases. Although much smaller in numbers (659), the majority of influenza A(H1N1) cases are among adults less than 65 years of age, with adults aged 20-64 and children 0-19 years accounting for 54% and 32% of cases respectively.
[TABLE="class: table table-striped table-bordered table-hover table-condensed, width: 1140"]
Table 1 - Weekly and cumulative numbers of positive influenza specimens by type, subtype and age-group reported through case-based laboratory reporting, Canada, weeks 2017-35 to 2018-10 [TR="class: bg-primary, bgcolor: #2572B4"]
Age groups (years) Cumulative (August 27, 2017 to March 10, 2018) [/TR]
[TR="class: bg-primary, bgcolor: #2572B4"]
Influenza A B Influenza A and B [/TR]
[TR="class: bg-primary, bgcolor: #2572B4"]
A Total A(H1) pdm09 A(H3) A (UnS)Table 1 Footnote1 Total # % [/TR]
[TR="bgcolor: #F5F5F5"]
0-4 [TD]2741[/TD]
[TD]118[/TD]
[TD]524[/TD]
[TD]2099[/TD]
[TD]1252[/TD]
[TD]3993[/TD]
[TD]9%[/TD]
[/TR]
[TR]
5-19 [TD]2068[/TD]
[TD]93[/TD]
[TD]512[/TD]
[TD]1463[/TD]
[TD]2259[/TD]
[TD]4327[/TD]
[TD]10%[/TD]
[/TR]
[TR="bgcolor: #F5F5F5"]
20-44 [TD]3760[/TD]
[TD]188[/TD]
[TD]1110[/TD]
[TD]2462[/TD]
[TD]2351[/TD]
[TD]6111[/TD]
[TD]14%[/TD]
[/TR]
[TR]
45-64 [TD]4093[/TD]
[TD]167[/TD]
[TD]1322[/TD]
[TD]2604[/TD]
[TD]3883[/TD]
[TD]7976[/TD]
[TD]18%[/TD]
[/TR]
[TR="bgcolor: #F5F5F5"]
65+ [TD]13092[/TD]
[TD]93[/TD]
[TD]4792[/TD]
[TD]8207[/TD]
[TD]8654[/TD]
[TD]21746[/TD]
[TD]49%[/TD]
[/TR]
[TR]
Total [TD]25754[/TD]
[TD]659[/TD]
[TD]8260[/TD]
[TD]16835[/TD]
[TD]18399[/TD]
[TD]44153[/TD]
[TD]100%[/TD]
[/TR]
[TR]
[TD="colspan: 8"] Table 1 Footnote 1 UnS: unsubtyped: The specimen was typed as influenza A, but no result for subtyping was available.
Return to table 1 footnote1referrer

[/TD]
[/TR]
[/TABLE]
[h=2]Syndromic/Influenza-like Illness Surveillance[/h] [h=3]Healthcare Professionals Sentinel Syndromic Surveillance[/h] In week 10, 1.8% of visits to healthcare professionals were due to influenza-like illness (ILI); a decrease from the previous week.
[h=3]Figure 4 - Percentage of visits for ILI reported by sentinels by report week, Canada, weeks 2017-35 to 2018-10[/h] Number of Sentinels Reporting in Week 10: 170
fig4-eng.jpg
The shaded area represents the maximum and minimum percentage of visits for ILI reported by week from seasons 2012-13 to 2017-18
Figure 4 - Text Description [h=3]Participatory Syndromic Surveillance[/h] FluWatchers is a participatory ILI surveillance system that relies on weekly voluntary submissions of syndromic information from Canadians across Canada.
In week 10, 1,385 participants reported to FluWatchers, of which 3% reported symptoms of cough and fever, and 22% of these consulted a healthcare professional. Among participants who reported cough and fever, 73% reported days missed from work or school, resulting in a combined total of 74 missed days of work or school.
[TABLE="class: table table-striped table-bordered table-hover table-condensed, width: 1140"]
Table 2 - Summary of influenza-like illness symptoms reported by participating Canadians, Canada, week 2018-10 [TR="class: bg-primary, bgcolor: #2572B4"]
Number of Participants Reporting Percentage participants reporting Cough and Fever Percentage of participants with cough and fever who consulted a healthcare professional Percentage of participants with cough and fever who reported missed days from work or school Number of missed days from work or school [/TR]
[TR="class: text-center, bgcolor: #F5F5F5"]
[TD]1385[/TD]
[TD]3%[/TD]
[TD]22%[/TD]
[TD]73%[/TD]
[TD]74[/TD]
[/TR]
[/TABLE]
[h=2]Influenza Outbreak Surveillance[/h] In week 10, 64 laboratory-confirmed outbreaks of influenza were reported, a sharp decrease compared to the previous week. Among the reported influenza outbreaks, 42 were reported in long-term care facilities(LTC), 12 in hospitals, and 10 in other settings. In addition, six ILI outbreaks were reported schools. Among the 52 outbreaks with influenza type/subtype reported, 29 (56%) were associated with influenza A, 23 (44%) were associated with influenza B.
To date this season, 1,508 influenza/ILI outbreaks have been reported, of which 917 (61%) occurred in LTC facilities. Among the 1,294 outbreaks for which the influenza type/subtype was reported, 678 (52%) were associated with influenza A and 500 (39%) were associated with influenza B, and 64 (5%) were associated with a mix of A and B.
[h=3]Figure 5 - Number of new outbreaks of laboratory-confirmed influenza by report week, Canada, weeks 2017-35 to 2018-10[/h]
fig5-eng.jpg
Figure 5 - Text Description [h=2]Severe Outcomes Influenza Surveillance[/h] [h=3]Provincial/Territorial Influenza Hospitalizations and Deaths[/h] To date this season, 4,086 influenza-associated hospitalizations were reported by participating provinces and territories. Among the hospitalizations, 2,936 (72%) were associated with influenza A, and 2,750 cases (67%) were in adults 65 years of age or older.
Additionally, 394 ICU admissions and 201 deaths have been reported to date. Adults aged 65 years of age or older accounted for the greatest proportion of ICU cases (43%), followed closely by adults aged 20-64 (41%). Adults aged 65 years of age or older accounted the majority of deaths (84%).
[h=3]Figure 6 - Cumulative numbers of hospitalizations by age-group reported by participating provinces and territoriesfigure 6 note1, weeks 2017-35 to 2018-10[/h]
fig6-eng.jpg
Figure 6 - Text Description Figure 6 note 1 Influenza-associated hospitalizations are reported by NL, PE, NS, NB, MB, AB, YT and NT. Only hospitalizations that require intensive medical care are reported by SK.
Return to figure 6 note1referrer

[h=3]Pediatric Influenza Hospitalizations and Deaths[/h] In week 10, the number of laboratory-confirmed influenza-associated pediatric (≤16 years of age) hospitalizations reported by the Immunization Monitoring Program Active (IMPACT) network decreased compared to the previous week. In week 10, 57 hospitalizations were reported of which 33 (58%) were due to influenza A. Pediatric hospitalizations have been decreasing since week 07. The number of weekly hospitalizations has been above the seven-season average since week 45.
To date this season, 882 pediatric hospitalizations have been reported by the IMPACT network, 555 (63%) of which were associated with influenza A. Children 0-23 months accounted for the largest proportion of influenza A hospitalizations (40%). Among the 327 hospitalizations due to influenza B, children 5-9 years accounted for the largest proportion of cases (31%).
Additionally, 139 ICU admissions and nine deaths have been reported to date. Children aged 0-23 months accounted for the greatest proportion of ICU cases (28%), followed closely by children aged 10-16 years (27%). Among the ICU cases with available information, 65% were due to influenza A and approximately 42% had no reported previous or concurrent medical conditions. All reported deaths were among children over the age of two.
[h=3]Figure 7 - Cumulative numbers of pediatric hospitalizations (≤16 years of age) with influenza by type and age-group reported by the IMPACT network, Canada, weeks 2017-35 to 2018-10[/h]
fig7-eng.jpg
Figure 7 - Text Description [h=3]Figure 8 - Number of pediatric hospitalizations (≤16 years of age) with influenza reported by the IMPACT network, by week, Canada, weeks 2017-35 to 2018-10[/h]
fig8-eng.jpg
Figure 8 - Text Description Figure 8 Footnote 1 The shaded area represents the maximum and minimum number of cases reported by week from seasons 2010-11 to 2017-18
Return to figure 8 note1referrer

[h=2]Influenza Strain Characterizations[/h] During the 2017-18 influenza season, the National Microbiology Laboratory (NML) has characterized 2,367 influenza viruses [1,139 A(H3N2), 155 A(H1N1)pdm09 and 1,073 B viruses] that were received from Canadian laboratories.
[h=3]Antigenic Characterization[/h] Among influenza viruses characterized by hemagglutination inhibition (HI) assay during the 2017-18 season, most viruses were antigenically similar to the cell-culture propagated reference strains recommended by WHO.
[TABLE="class: table table-striped table-bordered table-hover table-condensed, width: 1140"]
Table 3 - Influenza antigenic strain characterizations, Canada, weeks 2017-35 to 2018-10 [TR="class: bg-primary, bgcolor: #2572B4"]
Strain Characterization Results Count Description [/TR]
[TR="bgcolor: #F5F5F5"]
Influenza A (H3N2) [/TR]
[TR]
[TD]A/Hong Kong/4801/2014-like[/TD]
[TD]226[/TD]
[TD]Viruses antigenically similar to A/Hong Kong/4801/2014, the A(H3N2) component of the 2017-18 Northern Hemisphere's trivalent and quadrivalent vaccine. [/TD]
[/TR]
[TR="bgcolor: #F5F5F5"]
[TD]Reduced titer to A/Hong Kong/4801/2014[/TD]
[TD]45[/TD]
[TD]These A(H3N2) viruses reacted poorly with antisera raised against cell-propagated A/Hong Kong/4801/2014, suggesting some antigenic differences[/TD]
[/TR]
[TR]
Influenza A (H1N1)pdm09 [/TR]
[TR="bgcolor: #F5F5F5"]
[TD]A/Michigan/45/2015-like[/TD]
[TD]155[/TD]
[TD]Viruses antigenically similar to A/Michigan/45/2015, the A(H1N1)pdm09 component of the 2017-18 Northern Hemisphere's trivalent and quadrivalent influenza vaccine.[/TD]
[/TR]
[TR]
Influenza B [/TR]
[TR="bgcolor: #F5F5F5"]
[TD]B/Brisbane/60/2008-like (Victoria lineage)[/TD]
[TD]10[/TD]
[TD]Viruses antigenically similar to B/Brisbane/60/2008.
B/Brisbane/60/2008 is the influenza B component of the 2017-18 Northern Hemisphere's trivalent and quadrivalent influenza vaccine.[/TD]
[/TR]
[TR]
[TD]Reduced titer to B/Brisbane/60/2008
(Victoria lineage)[/TD]
[TD]37[/TD]
[TD]These B/Victoria lineage viruses reacted poorly with antisera raised against cell-propagated B/Brisbane/60/2008, suggesting some antigenic differences.[/TD]
[/TR]
[TR="bgcolor: #F5F5F5"]
[TD]B/Phuket/3073/2013-like
(Yamagata lineage)[/TD]
[TD]1026[/TD]
[TD]Viruses antigenically similar to B/Phuket/3073/2013, the additional influenza B component of the 2017-18 Northern Hemisphere quadrivalent influenza vaccine.[/TD]
[/TR]
[/TABLE]
[h=3]Genetic Characterization of A(H3N2) viruses[/h] During the 2017-18 season, 868 A(H3N2) viruses did not grow to sufficient titers for antigenic characterization by HI assay. Therefore, genetic characterization was performed to determine to which genetic group they belong. Sequence analysis showed that 779 A(H3N2) viruses belonged to genetic group 3C.2a, 87 viruses belonged to subclade 3C.2a1 and two viruses belonged to the clade 3C.3a.
Additionally, of the 271 influenza A(H3N2) viruses that were characterized antigenically as similar to A/Hong Kong/4801/2014, 196 belonged to genetic group 3C.2a and 21 viruses belonged to subclade 3C.2a1. The 45 viruses that showed reduced titer to A/Hong Kong/4801/2014 belonged to genetic clade 3C.3a. Sequencing is pending for the nine remaining virus isolates.
A/Hong Kong/4801/2014-like virus belongs to genetic group 3C.2a and is the influenza A/H3N2 component of the 2017-18 Northern Hemisphere influenza vaccine.
[h=3]Genetic Characterization of Influenza B viruses[/h] Among the viruses characterized antigenically as having reduced titer to ferret antisera produced against cell-propagated B/Brisbane/60/2008, sequence analysis showed that 36 viruses had a two amino acid deletion in the HA gene. Sequencing is pending for the one remaining virus isolate.

...

https://www.canada.ca/en/public-hea...h/2017-2018/week10-march-4-march-10-2018.html

 
[h=1]FluWatch report: March 11 to March 17, 2018 (week 11)[/h]
pub-eng.jpg

Download the alternative format
(PDF format, 546 KB, 10 pages)
Organization:
Public Health Agency of Canada
Date published: 2018-03-23

[h=5]Related Topics[/h]


[h=5]Overall Summary[/h]
  • All indicators of influenza activity have either decreased or remained similar to the previous week.
  • The influenza season peaked in mid-February, but influenza activity remains elevated in many parts of the country.
  • Detections of influenza B continue to be greater than those of influenza A.
  • To date this season, the majority of laboratory-confirmed cases, hospitalizations and deaths with influenza have been among adults 65 years of age and older.
  • For more information on the flu, see our Flu(influenza) web page.
[h=2]On this page[/h]
[h=2]Influenza/Influenza-like Illness Activity (geographic spread)[/h] In week 11, two regions in QC reported widespread activity, and 24 regions (BC(2), AB(1), SK(1), MB(1), ON(7), QC(4), NB(3), NS(2), and NL(3)) reported localized activity.


[h=3]Figure 1 - Map of overall influenza/ILI activity level by province and territory, Canada, week 2018-11[/h]
fig1-eng.jpg
Note: Influenza/ILI activity levels, as represented on this map, are assigned and reported by Provincial and Territorial Ministries of Health, based on laboratory confirmations, sentinel ILI rates and reported outbreaks. Please refer to detailed definitions at the end of the report. Maps from previous weeks, including any retrospective updates, are available in the mapping feature found in the Weekly Influenza Reports.

Figure 1 - Text Description [h=2]Laboratory-Confirmed Influenza Detections[/h] In week 11, the overall percentage of tests positive for influenza was 24%, a decrease from the previous week. The overall percentage of tests positive for influenza has been slowly decreasing from the peak in week 07. Detections of influenza B continue to be greater than those of influenza A. Influenza B accounted for 55% of influenza detections in week 11.
The percentage of influenza A detections for week 11 are around the average for this time of year. The percentage of tests positive for influenza B in week 11 continues to be well above expected levels for this time of year. For data on other respiratory virus detections, see the Respiratory Virus Detections in Canada Report.
[h=3]Figure 2 - Number of positive influenza tests and percentage of tests positive, by type, subtype and report week, Canada, weeks 2017-35 to 2018-11[/h]
fig2-eng.jpg
The shaded area indicates weeks where the positivity rate was at least 5% and a minimum of 15 positive tests were observed, signalling the period of seasonal influenza activity.

Figure 2 - Text Description To date this season, 56,284 laboratory-confirmed influenza detections have been reported, of which 57% have been influenza A. Influenza A(H3N2) has been the most common subtype detected this season, representing 92% of subtyped influenza A detections. For more detailed weekly and cumulative influenza data, see the text descriptions for Figures 2 and 3 or the Respiratory Virus Detections in Canada Report.
[h=3]Figure 3 - Cumulative numbers of positive influenza specimens by type/subtype and province/territory, Canada, weeks 2017-35 to 2018-11[/h]
fig3-eng.jpg

Figure 3 - Text Description To date this season, detailed information on age and type/subtype has been received for 46,154 laboratory-confirmed influenza cases (Table 1). Adults 65 years of age and older represent the largest proportion of cases overall (49%), and among cases of influenza A(H3N2) (58%) and influenza B (47%). Adults aged 20-64 represent 32% of cases overall and 29% of influenza A(H3N2) and 34% of influenza B cases. Although much smaller in numbers (720), the majority of influenza A(H1N1) cases are among adults less than 65 years of age, with adults aged 20-64 and children 0-19 years accounting for 53% and 32% of cases respectively.
[TABLE="class: table table-striped table-bordered table-hover table-condensed, width: 940"]
Table 1 - Cumulative numbers of positive influenza specimens by type, subtype and age-group reported through case-based laboratory reporting, Canada, weeks 2017-35 to 2018-11 [TR="class: bg-primary, bgcolor: #2572B4"]
Age groups (years) Cumulative (August 27, 2017 to March 17, 2018) [/TR]
[TR="class: bg-primary, bgcolor: #2572B4"]
Influenza A B Influenza A and B [/TR]
[TR="class: bg-primary, bgcolor: #2572B4"]
A Total A(H1) pdm09 A(H3) A (UnS)Table 1 Footnote1 Total # % [/TR]
[TR="bgcolor: #F5F5F5"]
0-4 [TD]2854[/TD]
[TD]126[/TD]
[TD]530[/TD]
[TD]2198[/TD]
[TD]1327[/TD]
[TD]4181[/TD]
[TD]9%[/TD]
[/TR]
[TR]
5-19 [TD]2139[/TD]
[TD]106[/TD]
[TD]520[/TD]
[TD]1513[/TD]
[TD]2358[/TD]
[TD]4497[/TD]
[TD]10%[/TD]
[/TR]
[TR="bgcolor: #F5F5F5"]
20-44 [TD]3889[/TD]
[TD]203[/TD]
[TD]1126[/TD]
[TD]2560[/TD]
[TD]2472[/TD]
[TD]6361[/TD]
[TD]14%[/TD]
[/TR]
[TR]
45-64 [TD]4234[/TD]
[TD]180[/TD]
[TD]1345[/TD]
[TD]2709[/TD]
[TD]4118[/TD]
[TD]8352[/TD]
[TD]18%[/TD]
[/TR]
[TR="bgcolor: #F5F5F5"]
65+ [TD]13524[/TD]
[TD]105[/TD]
[TD]4898[/TD]
[TD]8521[/TD]
[TD]9239[/TD]
[TD]22763[/TD]
[TD]49%[/TD]
[/TR]
[TR]
Total [TD]26640[/TD]
[TD]720[/TD]
[TD]8419[/TD]
[TD]17501[/TD]
[TD]19514[/TD]
[TD]46154[/TD]
[TD]100%[/TD]
[/TR]
[TR]
[TD="colspan: 8"] Table 1 Footnote 1 UnS: unsubtyped: The specimen was typed as influenza A, but no result for subtyping was available.
Return to table 1 footnote1referrer

[/TD]
[/TR]
[/TABLE]
[h=2]Syndromic/Influenza-like Illness Surveillance[/h] [h=3]Healthcare Professionals Sentinel Syndromic Surveillance[/h] In week 11, 1.4% of visits to healthcare professionals were due to influenza-like illness (ILI); a decrease from the previous week.
[h=3]Figure 4 - Percentage of visits for ILI reported by sentinels by report week, Canada, weeks 2017-35 to 2018-11[/h] Number of Sentinels Reporting in Week 11: 167
fig4-eng.jpg
The shaded area represents the maximum and minimum percentage of visits for ILI reported by week from seasons 2012-13 to 2016-17

Figure 4 - Text Description [h=3]Participatory Syndromic Surveillance[/h] FluWatchers is a participatory ILI surveillance system that relies on weekly voluntary submissions of syndromic information from Canadians across Canada.
In week 11, 1,394 participants reported to FluWatchers, of which 2% reported symptoms of cough and fever, and 42% of these consulted a healthcare professional. Among participants who reported cough and fever, 69% reported days missed from work or school, resulting in a combined total of 57 missed days of work or school.
[TABLE="class: table table-striped table-bordered table-hover table-condensed, width: 940"]
Table 2 - Summary of influenza-like illness symptoms reported by participating Canadians, Canada, week 2018-11 [TR="class: bg-primary, bgcolor: #2572B4"]
Number of Participants Reporting Percentage participants reporting Cough and Fever Percentage of participants with cough and fever who consulted a healthcare professional Percentage of participants with cough and fever who reported missed days from work or school Number of missed days from work or school [/TR]
[TR="class: text-center, bgcolor: #F5F5F5"]
[TD]1394[/TD]
[TD]2%[/TD]
[TD]42%[/TD]
[TD]69%[/TD]
[TD]57[/TD]
[/TR]
[/TABLE]
[h=2]Influenza Outbreak Surveillance[/h] In week 11, 57 laboratory-confirmed outbreaks of influenza were reported, a decrease compared to the previous week. Among the reported influenza outbreaks, 43 were reported in long-term care facilities (LTC), 2 in hospitals, and 12 in other settings. Among the 53 outbreaks with influenza type/subtype reported, 26 (49%) were associated with influenza A, 26 (49%) were associated with influenza B and one outbreak was associated with a mix of influenza A and B (2%).
To date this season, 1,570 influenza/ILI outbreaks have been reported, of which 965 (61%) occurred in LTC facilities. Among the 1,352 outbreaks for which the influenza type/subtype was reported, 736 (54%) were associated with influenza A and 551 (41%) were associated with influenza B, and 65 (5%) were associated with a mix of A and B.
[h=3]Figure 5 - Number of new outbreaks of laboratory-confirmed influenza by report week, Canada, weeks 2017-35 to 2018-11[/h]
fig5-eng.jpg

Figure 5 - Text Description [h=2]Severe Outcomes Influenza Surveillance[/h] [h=3]Provincial/Territorial Influenza Hospitalizations and Deaths[/h] To date this season, 4,220 influenza-associated hospitalizations were reported by participating provinces and territoriesFootnote1. Among the hospitalizations, 2,986 (71%) were associated with influenza A, and 2,883 cases (67%) were in adults 65 years of age or older.
Additionally, 412 ICU admissions and 207 deaths have been reported to date. Adults aged 65 years of age or older accounted for the greatest proportion of ICU cases (43%), followed closely by adults aged 20-64 (40%). Adults aged 65 years of age or older accounted the majority of deaths (84%).
[h=3]Figure 6 - Cumulative numbers of hospitalizations by age-group reported by participating provinces and territoriesfigure 6 note1, weeks 2017-35 to 2018-11[/h]
fig6-eng.jpg

Figure 6 - Text Description Figure 6 note 1 Influenza-associated hospitalizations are reported by NL, PE, NS, NB, MB, AB, YT and NT. Only hospitalizations that require intensive medical care are reported by SK.
Return to figure 6 note1referrer

[h=3]Pediatric Influenza Hospitalizations and Deaths[/h] In week 11, 57 laboratory-confirmed influenza-associated pediatric (≤16 years of age) hospitalizations were reported by the Immunization Monitoring Program Active (IMPACT) network. Influenza A accounted for 57% of the hospitalizations. Pediatric hospitalizations have been on a general decline since week 07. The number of weekly hospitalizations has been above the seven-season average for the majority of the season.
To date this season, 936 pediatric hospitalizations have been reported by the IMPACT network, 582 (62%) of which were associated with influenza A. Children 0-23 months accounted for the largest proportion of influenza A hospitalizations (39%). Among the 354 hospitalizations due to influenza B, children 5-9 years accounted for the largest proportion of cases (30%).
Additionally, 149 ICU admissions and nine deaths have been reported to date. Children aged 0-23 months accounted for the greatest proportion of ICU cases (30%), followed by children aged 10-16 years (26%). Among the ICU cases with available information, 62% were due to influenza A and approximately 43% had no reported previous or concurrent medical conditions. All reported deaths were among children over the age of two.
[h=3]Figure 7 - Cumulative numbers of pediatric hospitalizations (≤16 years of age) with influenza by type and age-group reported by the IMPACT network, Canada, weeks 2017-35 to 2018-11[/h]
fig7-eng.jpg

Figure 7 - Text Description [h=3]Figure 8 - Number of pediatric hospitalizations (≤16 years of age) with influenza reported by the IMPACT network, by week, Canada, weeks 2017-35 to 2018-11[/h]
fig8-eng.jpg

Figure 8 - Text Description Figure 8 Footnote 1 The shaded area represents the maximum and minimum number of cases reported by week from seasons 2010-11 to 2016-17
Return to figure 8 note1referrer

[h=2]Influenza Strain Characterizations[/h] During the 2017-18 influenza season, the National Microbiology Laboratory (NML) has characterized 2,514 influenza viruses [1,190 A(H3N2), 164 A(H1N1)pdm09 and 1,160 B viruses] that were received from Canadian laboratories.
[h=3]Antigenic Characterization[/h] Among influenza viruses characterized by hemagglutination inhibition (HI) assay during the 2017-18 season, most viruses were antigenically similar to the cell-culture propagated reference strains recommended by WHO.
[TABLE="class: table table-striped table-bordered table-hover table-condensed, width: 940"]
Table 3 - Influenza antigenic strain characterizations, Canada, weeks 2017-35 to 2018-11 [TR="class: bg-primary, bgcolor: #2572B4"]
Strain Characterization Results Count Description [/TR]
[TR="bgcolor: #F5F5F5"]
Influenza A (H3N2) [/TR]
[TR]
[TD]A/Hong Kong/4801/2014-like[/TD]
[TD]243[/TD]
[TD]Viruses antigenically similar to A/Hong Kong/4801/2014, the A(H3N2) component of the 2017-18 Northern Hemisphere's trivalent and quadrivalent vaccine.[/TD]
[/TR]
[TR="bgcolor: #F5F5F5"]
[TD]Reduced titer to A/Hong Kong/4801/2014[/TD]
[TD]53[/TD]
[TD]These A(H3N2) viruses reacted poorly with antisera raised against cell-propagated A/Hong Kong/4801/2014, suggesting some antigenic differences[/TD]
[/TR]
[TR]
Influenza A (H1N1)pdm09 [/TR]
[TR="bgcolor: #F5F5F5"]
[TD]A/Michigan/45/2015-like[/TD]
[TD]164[/TD]
[TD]Viruses antigenically similar to A/Michigan/45/2015, the A(H1N1)pdm09 component of the 2017-18 Northern Hemisphere's trivalent and quadrivalent influenza vaccine.[/TD]
[/TR]
[TR]
Influenza B [/TR]
[TR="bgcolor: #F5F5F5"]
[TD]B/Brisbane/60/2008-like (Victoria lineage)[/TD]
[TD]10[/TD]
[TD]Viruses antigenically similar to B/Brisbane/60/2008.
B/Brisbane/60/2008 is the influenza B component of the 2017-18 Northern Hemisphere's trivalent and quadrivalent influenza vaccine.[/TD]
[/TR]
[TR]
[TD]Reduced titer to B/Brisbane/60/2008
(Victoria lineage)[/TD]
[TD]40[/TD]
[TD]These B/Victoria lineage viruses reacted poorly with antisera raised against cell-propagated B/Brisbane/60/2008, suggesting some antigenic differences.[/TD]
[/TR]
[TR="bgcolor: #F5F5F5"]
[TD]B/Phuket/3073/2013-like
(Yamagata lineage)[/TD]
[TD]1,110[/TD]
[TD]Viruses antigenically similar to B/Phuket/3073/2013, the additional influenza B component of the 2017-18 Northern Hemisphere quadrivalent influenza vaccine.[/TD]
[/TR]
[/TABLE]
[h=3]Genetic Characterization of A(H3N2) viruses[/h] During the 2017-18 season, 894 A(H3N2) viruses did not grow to sufficient titers for antigenic characterization by HI assay. Therefore, genetic characterization was performed to determine to which genetic group they belong. Sequence analysis showed that 799 A(H3N2) viruses belonged to genetic group 3C.2a, 93 viruses belonged to subclade 3C.2a1 and two viruses belonged to the clade 3C.3a.
Additionally, of the 296 influenza A(H3N2) viruses that were characterized antigenically as similar to A/Hong Kong/4801/2014, 210 belonged to genetic group 3C.2a and 22 viruses belonged to subclade 3C.2a1. The 53 viruses that showed reduced titer to A/Hong Kong/4801/2014 belonged to genetic clade 3C.3a. Sequencing is pending for the 11 remaining virus isolates.
A/Hong Kong/4801/2014-like virus belongs to genetic group 3C.2a and is the influenza A/H3N2 component of the 2017-18 Northern Hemisphere influenza vaccine.
[h=3]Genetic Characterization of Influenza B viruses[/h] Among the viruses characterized antigenically as having reduced titer to ferret antisera produced against cell-propagated B/Brisbane/60/2008, sequence analysis showed that 37 viruses had a two amino acid deletion in the HA gene. Sequencing is pending for the three remaining virus isolates.

...
https://www.canada.ca/en/public-hea.../2017-2018/week11-march-11-march-17-2018.html

 
[h=1]FluWatch report: March 18 to March 24, 2018 (week 12)[/h]
pub-eng.jpg

Download the alternative format
(PDF format, 889 KB, 10 pages)
Organization:
Public Health Agency of Canada
Date published: 2018-03-29

[h=5]Related Topics[/h]


[h=5]Overall Summary[/h]
  • Due to the shortened reporting week, not all data providers were able to report their data.
  • The influenza season peaked in mid-February, but influenza activity remains elevated in many parts of the country.
  • Overall, laboratory detections of influenza are steadily decreasing.
  • To date this season, the majority of laboratory-confirmed cases, hospitalizations and deaths with influenza have been among adults 65 years of age and older.
  • For more information on the flu, see our Flu(influenza) web page.
[h=2]On this page[/h]
[h=2]Influenza/Influenza-like Illness Activity (geographic spread)[/h] In week 12, 13 regions (BC(2), AB(1), ON(7), NB(1) and NS(2)) reported localized activity.


[h=3]Figure 1 - Map of overall influenza/ILI activity level by province and territory, Canada, week 2018-12[/h]
fig1-eng.jpg
Note: Influenza/ILI activity levels, as represented on this map, are assigned and reported by Provincial and Territorial Ministries of Health, based on laboratory confirmations, sentinel ILI rates and reported outbreaks. Please refer to detailed definitions at the end of the report. Maps from previous weeks, including any retrospective updates, are available in the mapping feature found in the Weekly Influenza Reports.

Figure 1 - Text Description [h=2]Laboratory-Confirmed Influenza Detections[/h] In week 12, the overall percentage of tests positive for influenza was 20%, a decrease from the previous week. Overall, laboratory detections of influenza are steadily decreasing. Influenza B accounted for 53% of influenza detections in week 12.
The percentage of influenza A detections for week 12 is around the average for this time of year. The percentage of tests positive for influenza B in week 12 is above average but within the expected range for this time of year. For data on other respiratory virus detections, see the Respiratory Virus Detections in Canada Report.
[h=3]Figure 2 - Number of positive influenza tests and percentage of tests positive, by type, subtype and report week, Canada, weeks 2017-35 to 2018-12[/h]
fig2-eng.jpg
The shaded area indicates weeks where the positivity rate was at least 5% and a minimum of 15 positive tests were observed, signalling the period of seasonal influenza activity.

Figure 2 - Text Description To date this season, 58,317 laboratory-confirmed influenza detections have been reported, of which 56% have been influenza A. Influenza A(H3N2) has been the most common subtype detected this season, representing 92% of subtyped influenza A detections. For more detailed weekly and cumulative influenza data, see the text descriptions for Figures 2 and 3 or the Respiratory Virus Detections in Canada Report.
[h=3]Figure 3 - Cumulative numbers of positive influenza specimens by type/subtype and province/territory, Canada, weeks 2017-35 to 2018-12[/h]
fig3-eng.jpg

Figure 3 - Text Description To date this season, detailed information on age and type/subtype has been received for 47,533 laboratory-confirmed influenza cases (Table 1). Adults 65 years of age and older represent the largest proportion of cases overall (49%), and among cases of influenza A(H3N2) (58%) and influenza B (47%). Adults aged 20-64 represent 32% of cases overall and 29% of influenza A(H3N2) and 34% of influenza B cases. Although much smaller in numbers (789), the majority of influenza A(H1N1) cases are among adults less than 65 years of age, with adults aged 20-64 and children 0-19 years accounting for 53% and 32% of cases respectively.
[TABLE="class: table table-striped table-bordered table-hover table-condensed, width: 1140"]
Table 1 - Cumulative numbers of positive influenza specimens by type, subtype and age-group reported through case-based laboratory reporting, Canada, weeks 2017-35 to 2018-12 [TR="class: bg-primary, bgcolor: #2572B4"]
Age groups (years) Cumulative (August 27, 2017 to March 24, 2018) [/TR]
[TR="class: bg-primary, bgcolor: #2572B4"]
Influenza A B Influenza A and B [/TR]
[TR="class: bg-primary, bgcolor: #2572B4"]
A Total A(H1) pdm09 A(H3) A (UnS)Table 1 Footnote1 Total # % [/TR]
[TR="bgcolor: #F5F5F5"]
0-4 [TD]2935[/TD]
[TD]133[/TD]
[TD]537[/TD]
[TD]2265[/TD]
[TD]1379[/TD]
[TD]4314[/TD]
[TD]9%[/TD]
[/TR]
[TR]
5-19 [TD]2189[/TD]
[TD]120[/TD]
[TD]526[/TD]
[TD]1543[/TD]
[TD]2425[/TD]
[TD]4614[/TD]
[TD]10%[/TD]
[/TR]
[TR="bgcolor: #F5F5F5"]
20-44 [TD]3992[/TD]
[TD]221[/TD]
[TD]1147[/TD]
[TD]2624[/TD]
[TD]2555[/TD]
[TD]6547[/TD]
[TD]14%[/TD]
[/TR]
[TR]
45-64 [TD]4346[/TD]
[TD]198[/TD]
[TD]1367[/TD]
[TD]2781[/TD]
[TD]4286[/TD]
[TD]8632[/TD]
[TD]18%[/TD]
[/TR]
[TR="bgcolor: #F5F5F5"]
65+ [TD]13831[/TD]
[TD]117[/TD]
[TD]5012[/TD]
[TD]8702[/TD]
[TD]9595[/TD]
[TD]23426[/TD]
[TD]49%[/TD]
[/TR]
[TR]
Total [TD]27293[/TD]
[TD]789[/TD]
[TD]8589[/TD]
[TD]17915[/TD]
[TD]20240[/TD]
[TD]47533[/TD]
[TD]100%[/TD]
[/TR]
[TR]
[TD="colspan: 8"] Table 1 Footnote 1 UnS: unsubtyped: The specimen was typed as influenza A, but no result for subtyping was available.
Return to table 1 footnote1referrer

[/TD]
[/TR]
[/TABLE]
[h=2]Syndromic/Influenza-like Illness Surveillance[/h] [h=3]Healthcare Practitioners Sentinel Syndromic Surveillance[/h] In week 12, 1.5% of visits to healthcare professionals were due to influenza-like illness (ILI); a slight increase from the previous week.
[h=3]Figure 4 - Percentage of visits for ILI reported by sentinels by report week, Canada, weeks 2017-35 to 2018-12[/h] Number of Sentinels Reporting in Week 12: 166
fig4-eng.jpg
The shaded area represents the maximum and minimum percentage of visits for ILI reported by week from seasons 2012-13 to 2016-17

Figure 4 - Text Description [h=3]Participatory Syndromic Surveillance[/h] FluWatchers is a participatory ILI surveillance system that relies on weekly voluntary submissions of syndromic information from Canadians across Canada.
In week 12, 1,345 participants reported to FluWatchers, of which 3% reported symptoms of cough and fever, and 23% of these consulted a healthcare professional. Among participants who reported cough and fever, 72% reported days missed from work or school, resulting in a combined total of 63 missed days of work or school.
[TABLE="class: table table-striped table-bordered table-hover table-condensed, width: 1140"]
Table 2 - Summary of influenza-like illness symptoms reported by participating Canadians, Canada, week 2018-12 [TR="class: bg-primary, bgcolor: #2572B4"]
Number of Participants Reporting Percentage participants reporting Cough and Fever Percentage of participants with cough and fever who consulted a healthcare professional Percentage of participants with cough and fever who reported missed days from work or school Number of missed days from work or school [/TR]
[TR="class: text-center, bgcolor: #F5F5F5"]
[TD]1345[/TD]
[TD]3%[/TD]
[TD]23%[/TD]
[TD]72%[/TD]
[TD]63[/TD]
[/TR]
[/TABLE]
[h=2]Influenza Outbreak Surveillance[/h] In week 12, 41 laboratory-confirmed outbreaks of influenza were reported. Among the reported influenza outbreaks, 23 were reported in long-term care facilities (LTC), eight in hospitals, and 10 in other settings. Among the 35 outbreaks with influenza type/subtype reported, 22 (63%) were associated with influenza A, 12 (34%) were associated with influenza B and one outbreak was associated with a mix of influenza A and B (2%).
To date this season, 1,611 influenza/ILI outbreaks have been reported, of which 988 (61%) occurred in LTC facilities. Among the 1,387 outbreaks for which the influenza type/subtype was reported, 758 (55%) were associated with influenza A and 563 (41%) were associated with influenza B, and 66 (5%) were associated with a mix of A and B.
[h=3]Figure 5 - Number of new outbreaks of laboratory-confirmed influenza by report week, Canada, weeks 2017-35 to 2018-12[/h]
fig5-eng.jpg

Figure 5 - Text Description [h=2]Severe Outcomes Influenza Surveillance[/h] [h=3]Provincial/Territorial Influenza Hospitalizations and Deaths[/h] To date this season, 4,376 influenza-associated hospitalizations were reported by participating provinces and territoriesFootnote1. Among the hospitalizations, 3,067 (70%) were associated with influenza A, and 2,929 cases (67%) were in adults 65 years of age or older.
Additionally, 429 ICU admissions and 218 deaths have been reported to date. Adults aged 65 years of age or older accounted for the greatest proportion of ICU cases (43%), followed closely by adults aged 20-64 (40%). Adults aged 65 years of age or older accounted the majority of deaths (84%).
[h=3]Figure 6 - Cumulative numbers of hospitalizations by age-group reported by participating provinces and territoriesfigure 6 note1, weeks 2017-35 to 2018-12[/h]
fig6-eng.jpg

Figure 6 - Text Description Figure 6 note 1 Influenza-associated hospitalizations are reported by NL, PE, NS, NB, MB, AB, YT and NT. Only hospitalizations that require intensive medical care are reported by SK.
Return to figure 6 note1referrer

[h=3]Pediatric Influenza Hospitalizations and Deaths[/h] In the preliminary data for week 12, 27 laboratory-confirmed influenza-associated pediatric (≤16 years of age) hospitalizations were reported by the Immunization Monitoring Program Active (IMPACT) network. Influenza A accounted for 63% of the hospitalizations. Pediatric hospitalizations have been on a general decline since week 07.
To date this season, 964 pediatric hospitalizations have been reported by the IMPACT network, 601 (62%) of which were associated with influenza A. Children 0-23 months accounted for the largest proportion of influenza A hospitalizations (40%). Among the 363 hospitalizations due to influenza B, children 5-9 years accounted for the largest proportion of cases (31%).
Additionally, 151 ICU admissions and nine deaths have been reported to date. Children aged 0-23 months accounted for the greatest proportion of ICU cases (29%), followed by children aged 10-16 years (26%). Among the ICU cases with available information, 63% were due to influenza A and approximately 48% had no reported previous or concurrent medical conditions. All reported deaths were among children over the age of two.
[h=3]Figure 7 - Cumulative numbers of pediatric hospitalizations (≤16 years of age) with influenza by type and age-group reported by the IMPACT network, Canada, weeks 2017-35 to 2018-12[/h]
fig7-eng.jpg

Figure 7 - Text Description [h=3]Figure 8 - Number of pediatric hospitalizations (≤16 years of age) with influenza reported by the IMPACT network, by week, Canada, weeks 2017-35 to 2018-12[/h]
fig8-eng.jpg

Figure 8 - Text Description Figure 8 Footnote 1 The shaded area represents the maximum and minimum number of cases reported by week from seasons 2010-11 to 2016-17
Return to figure 8 note1referrer

[h=2]Influenza Strain Characterizations[/h] During the 2017-18 influenza season, the National Microbiology Laboratory (NML) has characterized 2,710 influenza viruses [1,203 A(H3N2), 182 A(H1N1)pdm09 and 1,325 B viruses] that were received from Canadian laboratories.
[h=3]Antigenic Characterization[/h] Among influenza viruses characterized by hemagglutination inhibition (HI) assay during the 2017-18 season, most viruses were antigenically similar to the cell-culture propagated reference strains recommended by WHO.
[TABLE="class: table table-striped table-bordered table-hover table-condensed, width: 1140"]
Table 3 - Influenza antigenic strain characterizations, Canada, weeks 2017-35 to 2018-12 [TR="class: bg-primary, bgcolor: #2572B4"]
Strain Characterization Results Count Description [/TR]
[TR="bgcolor: #F5F5F5"]
Influenza A (H3N2) [/TR]
[TR]
[TD]A/Hong Kong/4801/2014-like[/TD]
[TD]256[/TD]
[TD]Viruses antigenically similar to A/Hong Kong/4801/2014, the A(H3N2) component of the 2017-18 Northern Hemisphere's trivalent and quadrivalent vaccine.[/TD]
[/TR]
[TR="bgcolor: #F5F5F5"]
[TD]Reduced titer to A/Hong Kong/4801/2014[/TD]
[TD]53[/TD]
[TD]These A(H3N2) viruses reacted poorly with antisera raised against cell-propagated A/Hong Kong/4801/2014, suggesting some antigenic differences[/TD]
[/TR]
[TR]
Influenza A (H1N1)pdm09 [/TR]
[TR="bgcolor: #F5F5F5"]
[TD]A/Michigan/45/2015-like[/TD]
[TD]182[/TD]
[TD]Viruses antigenically similar to A/Michigan/45/2015, the A(H1N1)pdm09 component of the 2017-18 Northern Hemisphere's trivalent and quadrivalent influenza vaccine.[/TD]
[/TR]
[TR]
Influenza B [/TR]
[TR="bgcolor: #F5F5F5"]
[TD]B/Brisbane/60/2008-like (Victoria lineage)[/TD]
[TD]14[/TD]
[TD]Viruses antigenically similar to B/Brisbane/60/2008.
B/Brisbane/60/2008 is the influenza B component of the 2017-18 Northern Hemisphere's trivalent and quadrivalent influenza vaccine.[/TD]
[/TR]
[TR]
[TD]Reduced titer to B/Brisbane/60/2008
(Victoria lineage)[/TD]
[TD]42[/TD]
[TD]These B/Victoria lineage viruses reacted poorly with antisera raised against cell-propagated B/Brisbane/60/2008, suggesting some antigenic differences.[/TD]
[/TR]
[TR="bgcolor: #F5F5F5"]
[TD]B/Phuket/3073/2013-like
(Yamagata lineage)[/TD]
[TD]1269[/TD]
[TD]Viruses antigenically similar to B/Phuket/3073/2013, the additional influenza B component of the 2017-18 Northern Hemisphere quadrivalent influenza vaccine.[/TD]
[/TR]
[/TABLE]
[h=3]Genetic Characterization of A(H3N2) viruses[/h] During the 2017-18 season, 894 A(H3N2) viruses did not grow to sufficient titers for antigenic characterization by HI assay. Therefore, genetic characterization was performed to determine to which genetic group they belong. Sequence analysis showed that 799 A(H3N2) viruses belonged to genetic group 3C.2a, 93 viruses belonged to subclade 3C.2a1 and two viruses belonged to the clade 3C.3a.
Additionally, of the 309 influenza A(H3N2) viruses that were characterized antigenically as similar to A/Hong Kong/4801/2014, 210 belonged to genetic group 3C.2a and 22 viruses belonged to subclade 3C.2a1. The 53 viruses that showed reduced titer to A/Hong Kong/4801/2014 belonged to genetic clade 3C.3a. Sequencing is pending for the 24 remaining virus isolates.
A/Hong Kong/4801/2014-like virus belongs to genetic group 3C.2a and is the influenza A/H3N2 component of the 2017-18 Northern Hemisphere influenza vaccine.
[h=3]Genetic Characterization of Influenza B viruses[/h] Among the viruses characterized antigenically as having reduced titer to ferret antisera produced against cell-propagated B/Brisbane/60/2008, sequence analysis showed that 37 viruses had a two amino acid deletion in the HA gene. Sequencing is pending for the five remaining virus isolates.

...
https://www.canada.ca/en/public-hea.../2017-2018/week12-march-18-march-24-2018.html

 
[h=1]FluWatch report: March 25 to March 31, 2018 (week 13)[/h]
pub-eng.jpg

Download the alternative format
(PDF format, 889 KB, 10 pages)
Organization:
Public Health Agency of Canada
Date published: 2018-04-06

[h=5]Related Topics[/h]


[h=5]Overall Summary[/h]
  • The influenza season peaked in mid-February, but influenza activity remains elevated in many parts of the country.
  • Laboratory detections of influenza are steadily decreasing.
  • Weekly pediatric hospitalizations have been on a general decline since mid-February.
  • To date this season, the majority of laboratory-confirmed cases, hospitalizations and deaths with influenza have been among adults 65 years of age and older.
  • For more information on the flu, see our Flu(influenza) web page.
[h=2]On this page[/h]
[h=2]Influenza/Influenza-like Illness Activity (geographic spread)[/h] In week 13, two regions (BC(1) and QC(1)) reported widespread activity and 23 regions (BC(2), SK(1), ON(7), QC(3), NB(3), NL(2), PE(1) and NS(4)) reported localized activity.


[h=3]Figure 1 - Map of overall influenza/ILI activity level by province and territory, Canada, week 2018-13[/h]
fig1-eng.jpg
Note: Influenza/ILI activity levels, as represented on this map, are assigned and reported by Provincial and Territorial Ministries of Health, based on laboratory confirmations, sentinel ILI rates and reported outbreaks. Please refer to detailed definitions at the end of the report. Maps from previous weeks, including any retrospective updates, are available in the mapping feature found in the Weekly Influenza Reports.

Figure 1 - Text Description [h=2]Laboratory-Confirmed Influenza Detections[/h] In week 13, the overall percentage of tests positive for influenza was 19%, a decrease from the previous week. Overall, laboratory detections of influenza are steadily decreasing. Influenza B accounted for 54% of influenza detections in week 13.
The percentage of influenza A detections for week 13 is around the average for this time of year. The percentage of tests positive for influenza B in week 13 is above average but within the expected range for this time of year. For data on other respiratory virus detections, see the Respiratory Virus Detections in Canada Report.
[h=3]Figure 2 - Number of positive influenza tests and percentage of tests positive, by type, subtype and report week, Canada, weeks 2017-35 to 2018-13[/h]
fig2-eng.jpg
The shaded area indicates weeks where the positivity rate was at least 5% and a minimum of 15 positive tests were observed, signalling the period of seasonal influenza activity.

Figure 2 - Text Description To date this season, 59,699 laboratory-confirmed influenza detections have been reported, of which 56% have been influenza A. Influenza A(H3N2) has been the most common subtype detected this season, representing 91% of subtyped influenza A detections. For more detailed weekly and cumulative influenza data, see the text descriptions for Figures 2 and 3 or the Respiratory Virus Detections in Canada Report.
[h=3]Figure 3 - Cumulative numbers of positive influenza specimens by type/subtype and province/territory, Canada, weeks 2017-35 to 2018-13[/h]
fig3-eng.jpg

Figure 3 - Text Description To date this season, detailed information on age and type/subtype has been received for 48,582 laboratory-confirmed influenza cases (Table 1). Adults 65 years of age and older represent the largest proportion of cases overall (49%), and among cases of influenza A(H3N2) (59%) and influenza B (48%). Adults aged 20-64 represent 32% of cases overall and 29% of influenza A(H3N2) and 34% of influenza B cases. Although much smaller in numbers (814), the majority of influenza A(H1N1) cases are among adults less than 65 years of age, with adults aged 20-64 and children 0-19 years accounting for 53% and 32% of cases respectively.
[TABLE="class: table table-striped table-bordered table-hover table-condensed, width: 1140"]
Table 1 - Cumulative numbers of positive influenza specimens by type, subtype and age-group reported through case-based laboratory reporting, Canada, weeks 2017-35 to 2018-13 [TR="class: bg-primary, bgcolor: #2572B4"]
Age groups (years) Cumulative (August 27, 2017 to March 31, 2018) [/TR]
[TR="class: bg-primary, bgcolor: #2572B4"]
Influenza A B Influenza A and B [/TR]
[TR="class: bg-primary, bgcolor: #2572B4"]
A Total A(H1) pdm09 A(H3) A (UnS)Table 1 Footnote1 Total # % [/TR]
[TR="bgcolor: #F5F5F5"]
0-4 [TD]2991[/TD]
[TD]136[/TD]
[TD]544[/TD]
[TD]2311[/TD]
[TD]1406[/TD]
[TD]4397[/TD]
[TD]9%[/TD]
[/TR]
[TR]
5-19 [TD]2216[/TD]
[TD]121[/TD]
[TD]532[/TD]
[TD]1563[/TD]
[TD]2474[/TD]
[TD]4690[/TD]
[TD]10%[/TD]
[/TR]
[TR="bgcolor: #F5F5F5"]
20-44 [TD]4048[/TD]
[TD]227[/TD]
[TD]1164[/TD]
[TD]2657[/TD]
[TD]2613[/TD]
[TD]6661[/TD]
[TD]14%[/TD]
[/TR]
[TR]
45-64 [TD]4426[/TD]
[TD]207[/TD]
[TD]1395[/TD]
[TD]2824[/TD]
[TD]4413[/TD]
[TD]8839[/TD]
[TD]18%[/TD]
[/TR]
[TR="bgcolor: #F5F5F5"]
65+ [TD]14100[/TD]
[TD]123[/TD]
[TD]5135[/TD]
[TD]8842[/TD]
[TD]9895[/TD]
[TD]23995[/TD]
[TD]49%[/TD]
[/TR]
[TR]
Total [TD]27781[/TD]
[TD]814[/TD]
[TD]8770[/TD]
[TD]18197[/TD]
[TD]20801[/TD]
[TD]48582[/TD]
[TD]100%[/TD]
[/TR]
[TR]
[TD="colspan: 8"] Table 1 Footnote 1 UnS: unsubtyped: The specimen was typed as influenza A, but no result for subtyping was available.
Return to table 1 footnote1referrer

[/TD]
[/TR]
[/TABLE]
[h=2]Syndromic/Influenza-like Illness Surveillance[/h] [h=3]Healthcare Practitioners Sentinel Syndromic Surveillance[/h] In week 13, 1.8% of visits to healthcare professionals were due to influenza-like illness (ILI); an increase from the previous week.
[h=3]Figure 4 - Percentage of visits for ILI reported by sentinels by report week, Canada, weeks 2017-35 to 2018-13[/h] Number of Sentinels Reporting in Week 13: 172
fig4-eng.jpg
The shaded area represents the maximum and minimum percentage of visits for ILI reported by week from seasons 2012-13 to 2016-17

Figure 4 - Text Description [h=3]Participatory Syndromic Surveillance[/h] FluWatchers is a participatory ILI surveillance system that relies on weekly voluntary submissions of syndromic information from Canadians across Canada.
In week 13, 1,287 participants reported to FluWatchers, of which 2% reported symptoms of cough and fever, and 16% of these consulted a healthcare professional. Among participants who reported cough and fever, 76% reported days missed from work or school, resulting in a combined total of 44 missed days of work or school.
[TABLE="class: table table-striped table-bordered table-hover table-condensed, width: 1140"]
Table 2 - Summary of influenza-like illness symptoms reported by participating Canadians, Canada, week 2018-13 [TR="class: bg-primary, bgcolor: #2572B4"]
Number of Participants Reporting Percentage participants reporting Cough and Fever Percentage of participants with cough and fever who consulted a healthcare professional Percentage of participants with cough and fever who reported missed days from work or school Number of missed days from work or school [/TR]
[TR="class: text-center, bgcolor: #F5F5F5"]
[TD]1287[/TD]
[TD]2%[/TD]
[TD]16%[/TD]
[TD]76%[/TD]
[TD]44[/TD]
[/TR]
[/TABLE]
[h=2]Influenza Outbreak Surveillance[/h] In week 13, 42 laboratory-confirmed outbreaks of influenza were reported. Among the reported influenza outbreaks, 29 were reported in long-term care facilities (LTC), five in hospitals, and eight in other settings. Among the 32 outbreaks with influenza type/subtype reported, 18 (56%) were associated with influenza A, 13 (41%) were associated with influenza B and one outbreak was associated with a mix of influenza A and B (3%).
To date this season, 1,663 influenza/ILI outbreaks have been reported, of which 1,025 (62%) occurred in LTC facilities. Among the 1,427 outbreaks for which the influenza type/subtype was reported, 781 (55%) were associated with influenza A and 579 (41%) were associated with influenza B, and 67 (5%) were associated with a mix of A and B.
[h=3]Figure 5 - Number of new outbreaks of laboratory-confirmed influenza by report week, Canada, weeks 2017-35 to 2018-13[/h]
fig5-eng.jpg

Figure 5 - Text Description [h=2]Severe Outcomes Influenza Surveillance[/h] [h=3]Provincial/Territorial Influenza Hospitalizations and Deaths[/h] To date this season, 4,500 influenza-associated hospitalizations were reported by participating provinces and territoriesFootnote1. Among the hospitalizations, 3,116 (69%) were associated with influenza A, and 2,990 cases (66%) were in adults 65 years of age or older.
Additionally, 439 ICU admissions and 230 deaths have been reported to date. Adults aged 65 years of age or older accounted for the greatest proportion of ICU cases (44%), followed closely by adults aged 20-64 (40%). Adults aged 65 years of age or older accounted the majority of deaths (83%).
[h=3]Figure 6 - Cumulative numbers of hospitalizations by age-group reported by participating provinces and territoriesfigure 6 note1, weeks 2017-35 to 2018-13[/h]
fig6-eng.jpg

Figure 6 - Text Description Figure 6 note 1 Influenza-associated hospitalizations are reported by NL, PE, NS, NB, MB, AB, YT and NT. Only hospitalizations that require intensive medical care are reported by SK.
Return to figure 6 note1referrer

[h=3]Pediatric Influenza Hospitalizations and Deaths[/h] In week 13, 26 laboratory-confirmed influenza-associated pediatric (≤16 years of age) hospitalizations were reported by the Immunization Monitoring Program Active (IMPACT) network. Influenza A accounted for 62% of the hospitalizations. Pediatric hospitalizations have been on a general decline since week 07.
To date this season, 995 pediatric hospitalizations have been reported by the IMPACT network, 619 (62%) of which were associated with influenza A. Children 0-23 months accounted for the largest proportion of influenza A hospitalizations (41%). Among the 376 hospitalizations due to influenza B, children 5-9 years accounted for the largest proportion of cases (31%).
Additionally, 159 ICU admissions and nine deaths have been reported to date. Children aged 0-23 months accounted for the greatest proportion of ICU cases (28%), followed by children aged 10-16 years (26%). Among the ICU cases with available information, 64% were due to influenza A and approximately 48% had no reported previous or concurrent medical conditions. All but one reported deaths were among children over the age of two.
[h=3]Figure 7 - Cumulative numbers of pediatric hospitalizations (≤16 years of age) with influenza by type and age-group reported by the IMPACT network, Canada, weeks 2017-35 to 2018-13[/h]
fig7-eng.jpg

Figure 7 - Text Description [h=3]Figure 8 - Number of pediatric hospitalizations (≤16 years of age) with influenza reported by the IMPACT network, by week, Canada, weeks 2017-35 to 2018-13[/h]
fig8-eng.jpg

Figure 8 - Text Description Figure 8 Footnote 1 The shaded area represents the maximum and minimum number of cases reported by week from seasons 2010-11 to 2016-17
Return to figure 8 note1referrer

[h=2]Influenza Strain Characterizations[/h] During the 2017-18 influenza season, the National Microbiology Laboratory (NML) has characterized 2,856 influenza viruses [1,287 A(H3N2), 200 A(H1N1)pdm09 and 1,369 B viruses] that were received from Canadian laboratories.
[h=3]Antigenic Characterization[/h] Among influenza viruses characterized by hemagglutination inhibition (HI) assay during the 2017-18 season, most viruses were antigenically similar to the cell-culture propagated reference strains recommended by WHO.
[TABLE="class: table table-striped table-bordered table-hover table-condensed, width: 1140"]
Table 3 - Influenza antigenic strain characterizations, Canada, weeks 2017-35 to 2018-13 [TR="class: bg-primary, bgcolor: #2572B4"]
Strain Characterization Results Count Description [/TR]
[TR="bgcolor: #F5F5F5"]
Influenza A (H3N2) [/TR]
[TR]
[TD]A/Hong Kong/4801/2014-like[/TD]
[TD]256[/TD]
[TD]Viruses antigenically similar to A/Hong Kong/4801/2014, the A(H3N2) component of the 2017-18 Northern Hemisphere's trivalent and quadrivalent vaccine.[/TD]
[/TR]
[TR="bgcolor: #F5F5F5"]
[TD]Reduced titer to A/Hong Kong/4801/2014[/TD]
[TD]65[/TD]
[TD]These A(H3N2) viruses reacted poorly with antisera raised against cell-propagated A/Hong Kong/4801/2014, suggesting some antigenic differences[/TD]
[/TR]
[TR]
Influenza A (H1N1)pdm09 [/TR]
[TR="bgcolor: #F5F5F5"]
[TD]A/Michigan/45/2015-like[/TD]
[TD]200[/TD]
[TD]Viruses antigenically similar to A/Michigan/45/2015, the A(H1N1)pdm09 component of the 2017-18 Northern Hemisphere's trivalent and quadrivalent influenza vaccine.[/TD]
[/TR]
[TR]
Influenza B [/TR]
[TR="bgcolor: #F5F5F5"]
[TD]B/Brisbane/60/2008-like (Victoria lineage)[/TD]
[TD]14[/TD]
[TD]Viruses antigenically similar to B/Brisbane/60/2008.
B/Brisbane/60/2008 is the influenza B component of the 2017-18 Northern Hemisphere's trivalent and quadrivalent influenza vaccine.[/TD]
[/TR]
[TR]
[TD]Reduced titer to B/Brisbane/60/2008
(Victoria lineage)[/TD]
[TD]43[/TD]
[TD]These B/Victoria lineage viruses reacted poorly with antisera raised against cell-propagated B/Brisbane/60/2008, suggesting some antigenic differences.[/TD]
[/TR]
[TR="bgcolor: #F5F5F5"]
[TD]B/Phuket/3073/2013-like
(Yamagata lineage)[/TD]
[TD]1312[/TD]
[TD]Viruses antigenically similar to B/Phuket/3073/2013, the additional influenza B component of the 2017-18 Northern Hemisphere quadrivalent influenza vaccine.[/TD]
[/TR]
[/TABLE]
[h=3]Genetic Characterization of A(H3N2) viruses[/h] During the 2017-18 season, 965 A(H3N2) viruses did not grow to sufficient titers for antigenic characterization by HI assay. Therefore, genetic characterization was performed to determine to which genetic group they belong. Sequence analysis showed that 862 A(H3N2) viruses belonged to genetic group 3C.2a, 101 viruses belonged to subclade 3C.2a1 and two viruses belonged to the clade 3C.3a.
Additionally, of the 322 influenza A(H3N2) viruses that were characterized antigenically as similar to A/Hong Kong/4801/2014, 232 belonged to genetic group 3C.2a and 24 viruses belonged to subclade 3C.2a1. The 65 viruses that showed reduced titer to A/Hong Kong/4801/2014 belonged to genetic clade 3C.3a. Sequencing is pending for the remaining one isolate.
A/Hong Kong/4801/2014-like virus belongs to genetic group 3C.2a and is the influenza A/H3N2 component of the 2017-18 Northern Hemisphere influenza vaccine.
[h=3]Genetic Characterization of Influenza B viruses[/h] Among the viruses characterized antigenically as having reduced titer to ferret antisera produced against cell-propagated B/Brisbane/60/2008, sequence analysis showed that 43 viruses had a two amino acid deletion in the HA gene. Sequencing is pending for the remaining virus isolate.

...
https://www.canada.ca/en/public-hea.../2017-2018/week13-march-25-march-31-2018.html

 
[h=1]FluWatch report: April 1, 2018 to April 7, 2018 (Week 14)[/h]
pub-eng.jpg

Download the alternative format
(PDF format, 563 KB, 10 pages)
Organization:
Public Health Agency of Canada
Date published: 2018-04-13

[h=5]Related Topics[/h]


[h=5]Overall Summary[/h]
  • Influenza activity in Canada continued to decrease, but many parts of the country are still reporting localized activity.
  • All indicators of influenza activity decreased from the previous week.
  • Detections of influenza B are similar to those of influenza A.
  • To date this season, the majority of laboratory-confirmed cases, hospitalizations and deaths with influenza have been among adults 65 years of age and older.
  • For more information on the flu, see our Flu(influenza) web page.
[h=2]On this page[/h]
[h=2]Influenza/Influenza-like Illness Activity (geographic spread)[/h] In week 14, 20 regions ( SK(1), ON(7), QC(3), NB(4 ), NL(2), NS(2 ) and NT(1)) reported localized activity.


[h=3]Figure 1 - Map of overall influenza/ILI activity level by province and territory, Canada, week 2018-14[/h]
Fig1.1_ENG.jpg
Note: Influenza/ILI activity levels, as represented on this map, are assigned and reported by Provincial and Territorial Ministries of Health, based on laboratory confirmations, sentinel ILI rates and reported outbreaks. Please refer to detailed definitions at the end of the report. Maps from previous weeks, including any retrospective updates, are available in the mapping feature found in the Weekly Influenza Reports.

Figure 1 - Text Description [h=2]Laboratory-Confirmed Influenza Detections[/h] In week 14, the overall percentage of tests positive for influenza was 17%, a decrease from the previous week. Overall, laboratory detections of influenza are steadily decreasing. Influenza B accounted for 51% of influenza detections in week 14.
The percentage of tests positive for influenza A and influenza B detections are both around the average for this time of year. For data on other respiratory virus detections, see the Respiratory Virus Detections in Canada Report.
[h=3]Figure 2 - Number of positive influenza tests and percentage of tests positive, by type, subtype and report week, Canada, weeks 2017-35 to 2018-14[/h]
Fig2.2_ENG.jpg
The shaded area indicates weeks where the positivity rate was at least 5% and a minimum of 15 positive tests were observed, signalling the period of seasonal influenza activity.

Figure 2 - Text Description To date this season, 61,061 laboratory-confirmed influenza detections have been reported, of which 56% have been influenza A. Influenza A(H3N2) has been the most common subtype detected this season, representing 91% of subtyped influenza A detections. For more detailed weekly and cumulative influenza data, see the text descriptions for Figures 2 and 3 or the Respiratory Virus Detections in Canada Report.
[h=3]Figure 3 - Cumulative numbers of positive influenza specimens by type/subtype and province/territory, Canada, weeks 2017-35 to 2018-14[/h]
Fig3.3_EN.jpg

Figure 3 - Text Description To date this season, detailed information on age and type/subtype has been received for 49 ,497 laboratory-confirmed influenza cases (Table 1). Adults 65 years of age and older represent the largest proportion of cases overall (50 %), and among cases of influenza A(H3N2) (59%) and influenza B (48 %). Adults aged 20-64 represent 32% of cases overall and 29% of influenza A(H3N2) and 34% of influenza B cases. Although much smaller in numbers (848 ), the majority of influenza A(H1N1)pdm09 cases are among adults less than 65 years of age, with adults aged 20-64 and children 0-19 years accounting for 53% and 31 % of cases respectively.
[TABLE="class: table table-striped table-bordered table-hover table-condensed, width: 1140"]
Table 1 ? Cumulative numbers of positive influenza specimens by type, subtype and age-group reported through case-based laboratory reporting, Canada, weeks 2017-35 to 2018-14 [TR="class: bg-primary, bgcolor: #2572B4"]
Age groups (years) Cumulative (August 27, 2017 to April 7, 2018) [/TR]
[TR="class: bg-primary, bgcolor: #2572B4"]
Influenza A B Influenza A and B [/TR]
[TR="class: bg-primary, bgcolor: #2572B4"]
A Total A(H1N1) pdm09 A(H3N2) A (UnS)1 Total # % [/TR]
[TR="bgcolor: #F5F5F5"]
[TD]0-4[/TD]
[TD]3049[/TD]
[TD]140[/TD]
[TD]547[/TD]
[TD]2362[/TD]
[TD]1432[/TD]
[TD]4481[/TD]
[TD]9%[/TD]
[/TR]
[TR]
[TD]5-19[/TD]
[TD]2238[/TD]
[TD]126[/TD]
[TD]533[/TD]
[TD]1579[/TD]
[TD]2506[/TD]
[TD]4744[/TD]
[TD]10%[/TD]
[/TR]
[TR="bgcolor: #F5F5F5"]
[TD]20-44[/TD]
[TD]4105[/TD]
[TD]236[/TD]
[TD]1170[/TD]
[TD]2699[/TD]
[TD]2669[/TD]
[TD]6774[/TD]
[TD]14%[/TD]
[/TR]
[TR]
[TD]45-64[/TD]
[TD]4493[/TD]
[TD]214[/TD]
[TD]1403[/TD]
[TD]2876[/TD]
[TD]4502[/TD]
[TD]8995[/TD]
[TD]18%[/TD]
[/TR]
[TR="bgcolor: #F5F5F5"]
[TD]65+[/TD]
[TD]14381[/TD]
[TD]132[/TD]
[TD]5210[/TD]
[TD]9039[/TD]
[TD]10122[/TD]
[TD]24503[/TD]
[TD]50%[/TD]
[/TR]
[TR]
[TD]Total[/TD]
[TD]28266[/TD]
[TD]848[/TD]
[TD]8863[/TD]
[TD]18555[/TD]
[TD]21231[/TD]
[TD]49497[/TD]
[TD]100%[/TD]
[/TR]
[/TABLE]
[h=2]Syndromic/Influenza-like Illness Surveillance[/h] [h=3]Healthcare Practitioners Sentinel Syndromic Surveillance[/h] In week 14, 1.0% of visits to healthcare professionals were due to influenza-like illness (ILI); a decrease from the previous week.
[h=3]Figure 4 - Percentage of visits for ILI reported by sentinels by report week, Canada, weeks 2017-35 to 2018-14[/h] Number of Sentinels Reporting in Week 14: 178
Fig4.4_ENG.jpg
The shaded area represents the maximum and minimum percentage of visits for ILI reported by week from seasons 2012-13 to 2016-17

Figure 4 - Text Description [h=3]Participatory Syndromic Surveillance[/h] FluWatchers is a participatory ILI surveillance system that relies on weekly voluntary submissions of syndromic information from Canadians across Canada.
In week 14 , 1,373 participants reported to FluWatchers, of which 3 % reported symptoms of cough and fever, and 23 % of these consulted a healthcare professional. Among participants who reported cough and fever, 60 % reported days missed from work or school, resulting in a combined total of 57 missed days of work or school.
[TABLE="class: table table-striped table-bordered table-hover table-condensed, width: 1140"]
Table 2 - Summary of influenza-like illness symptoms reported by participating Canadians, Canada, week 2018-14 [TR="class: bg-primary, bgcolor: #2572B4"]
Number of Participants Reporting Percentage participants reporting Cough and Fever Percentage of participants with cough and fever who consulted a healthcare professional Percentage of participants with cough and fever who reported missed days from work or school Number of missed days from work or school [/TR]
[TR="class: text-center, bgcolor: #F5F5F5"]
[TD]1373[/TD]
[TD]3%[/TD]
[TD]23%[/TD]
[TD]60%[/TD]
[TD]57[/TD]
[/TR]
[/TABLE]
[h=2]Influenza Outbreak Surveillance[/h] In week 14, 35 laboratory-confirmed outbreaks of influenza were reported. Among the reported influenza outbreaks, 18 were reported in long-term care facilities (LTC), nine in hospitals, and eight in other settings. Among the 31 outbreaks with influenza type/subtype reported, 20 (65%) were associated with influenza A and 11 (35%) were associated with influenza B.
To date this season, 1,705 influenza/ILI outbreaks have been reported, of which 1,050 (62%) occurred in LTC facilities. Among the 1,465 outbreaks for which the influenza type/subtype was reported, 803 (55%) were associated with influenza A and 594(41%) were associated with influenza B, and 68 (5%) were associated with a mix of A and B.
[h=3]Figure 5 - Number of new outbreaks of laboratory-confirmed influenza by report week, Canada, weeks 2017-35 to 2018-14[/h]
Fig5.5_ENG.jpg

Figure 5 - Text Description [h=2]Severe Outcomes Influenza Surveillance[/h] [h=3]Provincial/Territorial Influenza Hospitalizations and Deaths[/h] To date this season, 4,664 influenza-associated hospitalizations were reported by participating provinces and territoriesFootnote1. Among the hospitalizations, 3,195 (69%) were associated with influenza A, and 3,096 cases (66%) were in adults 65 years of age or older.
Additionally, 469 ICU admissions and 248 deaths have been reported to date. Adults aged 65 years of age or older accounted for the greatest proportion of ICU cases (43%), followed closely by adults aged 20-64 (40%). Adults aged 65 years of age or older accounted the majority of deaths (84%).
[h=3]Figure 6 - Cumulative numbers of hospitalizations by age-group reported by participating provinces and territoriesfigure 6 note1, weeks 2017-35 to 2018-14[/h]
Fig6.6_ENG.jpg

Figure 6 - Text Description Figure 6 note 1 Influenza-associated hospitalizations are reported by NL, PE, NS, NB, MB, AB, YT and NT. Only hospitalizations that require intensive medical care are reported by SK.
Return to figure 6 note1referrer

[h=3]Pediatric Influenza Hospitalizations and Deaths[/h] In week 14, 27 laboratory-confirmed influenza-associated pediatric (≤16 years of age) hospitalizations were reported by the Immunization Monitoring Program Active (IMPACT) network. Influenza A accounted for 67% of the hospitalizations. Pediatric hospitalizations have been on a general decline since week 07. The number of weekly reported hospitalizations has finally fallen to levels that are near the seven-season average.
To date this season, 1,021 pediatric hospitalizations have been reported by the IMPACT network, 636 (62%) of which were associated with influenza A. Children 0-23 months accounted for the largest proportion of influenza A hospitalizations (40%). Among the 385 hospitalizations due to influenza B, children 5-9 years accounted for the largest proportion of cases (31%).
Additionally, 164 ICU admissions and nine deaths have been reported to date. Children aged 0-23 months accounted for the greatest proportion of ICU cases (28%), followed by children aged 10-16 years (26%). Among the ICU cases with available information, 63% were due to influenza A and approximately 47% had no reported previous or concurrent medical conditions. All but one reported deaths were among children over the age of two.
[h=3]Figure 7 - Cumulative numbers of pediatric hospitalizations (≤16 years of age) with influenza by type and age-group reported by the IMPACT network, Canada, weeks 2017-35 to 2018-14[/h]
Fig7.7_EN.jpg

Figure 7 - Text Description [h=3]Figure 8 - Number of pediatric hospitalizations (≤16 years of age) with influenza reported by the IMPACT network, by week, Canada, weeks 2017-35 to 2018-14[/h]
Fig8.8_EN.jpg

Figure 8 - Text Description Figure 8 Footnote 1 The shaded area represents the maximum and minimum number of cases reported by week from seasons 2010-11 to 2016-17
Return to figure 8 note1referrer

[h=2]Influenza Strain Characterizations[/h] During the 2017-18 influenza season, the National Microbiology Laboratory (NML) has characterized 3,006 influenza viruses [1,343 A(H3N2), 217 A(H1N1)pdm09 and 1,446 B viruses] that were received from Canadian laboratories.
[h=3]Antigenic Characterization[/h] Among influenza viruses characterized by hemagglutination inhibition (HI) assay during the 2017-18 season, most viruses were antigenically similar to the cell-culture propagated reference strains recommended by WHO.
[TABLE="class: table table-striped table-bordered table-hover table-condensed, width: 1140"]
Table 3 - Influenza antigenic strain characterizations, Canada, weeks 2017-35 to 2018-14 [TR="class: bg-primary, bgcolor: #2572B4"]
Strain Characterization Results Count Description [/TR]
[TR="bgcolor: #F5F5F5"]
Influenza A (H3N2) [/TR]
[TR]
[TD]A/Hong Kong/4801/2014-like[/TD]
[TD]273[/TD]
[TD]Viruses antigenically similar to A/Hong Kong/4801/2014, the A(H3N2) component of the 2017-18 Northern Hemisphere's trivalent and quadrivalent vaccine.[/TD]
[/TR]
[TR="bgcolor: #F5F5F5"]
[TD]Reduced titer to A/Hong Kong/4801/2014[/TD]
[TD]69[/TD]
[TD]These A(H3N2) viruses reacted poorly with antisera raised against cell-propagated A/Hong Kong/4801/2014, suggesting some antigenic differences[/TD]
[/TR]
[TR]
Influenza A (H1N1)pdm09 [/TR]
[TR="bgcolor: #F5F5F5"]
[TD]A/Michigan/45/2015-like[/TD]
[TD]217[/TD]
[TD]Viruses antigenically similar to A/Michigan/45/2015, the A(H1N1)pdm09 component of the 2017-18 Northern Hemisphere's trivalent and quadrivalent influenza vaccine.[/TD]
[/TR]
[TR]
Influenza B [/TR]
[TR="bgcolor: #F5F5F5"]
[TD]B/Brisbane/60/2008-like (Victoria lineage)[/TD]
[TD]16[/TD]
[TD]Viruses antigenically similar to B/Brisbane/60/2008.
B/Brisbane/60/2008 is the influenza B component of the 2017-18 Northern Hemisphere's trivalent and quadrivalent influenza vaccine.[/TD]
[/TR]
[TR]
[TD]Reduced titer to B/Brisbane/60/2008
(Victoria lineage)[/TD]
[TD]47[/TD]
[TD]These B/Victoria lineage viruses reacted poorly with antisera raised against cell-propagated B/Brisbane/60/2008, suggesting some antigenic differences.[/TD]
[/TR]
[TR="bgcolor: #F5F5F5"]
[TD]B/Phuket/3073/2013-like
(Yamagata lineage)[/TD]
[TD]1,383[/TD]
[TD]Viruses antigenically similar to B/Phuket/3073/2013, the additional influenza B component of the 2017-18 Northern Hemisphere quadrivalent influenza vaccine.[/TD]
[/TR]
[/TABLE]
[h=3]Genetic Characterization of A(H3N2) viruses[/h] During the 2017-18 season, 1,001 A(H3N2) viruses did not grow to sufficient titers for antigenic characterization by HI assay. Therefore, genetic characterization was performed to determine to which genetic group they belong. Sequence analysis showed that 894 A(H3N2) viruses belonged to genetic group 3C.2a, 105 viruses belonged to subclade 3C.2a1 and two viruses belonged to the clade 3C.3a.
Additionally, of the 342 influenza A(H3N2) viruses that were characterized antigenically as similar to A/Hong Kong/4801/2014, 241 belonged to genetic group 3C.2a and 25 viruses belonged to subclade 3C.2a1. The 69 viruses that showed reduced titer to A/Hong Kong/4801/2014 belonged to genetic clade 3C.3a. Sequencing is pending for the remaining seven isolates.
A/Hong Kong/4801/2014-like virus belongs to genetic group 3C.2a and is the influenza A/H3N2 component of the 2017-18 Northern Hemisphere influenza vaccine.
[h=3]Genetic Characterization of Influenza B viruses[/h] Among the viruses characterized antigenically as having reduced titer to ferret antisera produced against cell-propagated B/Brisbane/60/2008, sequence analysis showed that 43 viruses had a two amino acid deletion in the HA gene. Sequencing is pending for the remaining four virus isolates.

...
https://www.canada.ca/en/public-hea...ch/2017-2018/week14-april-1-april-7-2018.html

 
[h=1]FluWatch report: April 8 to April 14, 2018 (week 15)[/h]
pub-eng.jpg

Download the alternative format
(PDF format, 563 KB, 10 pages)
Organization:
Public Health Agency of Canada
Date published: 2018-04-13

[h=5]Related Topics[/h]


[h=5]Overall Summary[/h]
  • Overall influenza activity in Canada continued to decrease, but many parts of the country are still reporting localized activity.
  • Two indicators of influenza activity (influenza-like illness and outbreaks) slightly increased from the previous week.
  • Detections of influenza A were greater than those of influenza B.
  • To date this season, the majority of laboratory-confirmed cases, hospitalizations and deaths with influenza have been among adults 65 years of age and older.
  • For more information on the flu, see our Flu(influenza) web page.
[h=2]On this page[/h]
[h=2]Influenza/Influenza-like Illness Activity (geographic spread)[/h] In week 15, one region in QC reported widespread activity and 23 regions (BC(1), AB(1), MB(2), ON(7), QC(3), NB(2), NL(3), NS(2), PE(1) and NT(1)) reported localized activity.


[h=3]Figure 1 - Map of overall influenza/ILI activity level by province and territory, Canada, week 2018-15[/h]
Fig1-eng.jpg
Note: Influenza/ILI activity levels, as represented on this map, are assigned and reported by Provincial and Territorial Ministries of Health, based on laboratory confirmations, sentinel ILI rates and reported outbreaks. Please refer to detailed definitions at the end of the report. Maps from previous weeks, including any retrospective updates, are available in the mapping feature found in the Weekly Influenza Reports.

Figure 1 - Text Description [h=2]Laboratory-Confirmed Influenza Detections[/h] In week 15, the overall percentage of tests positive for influenza was 15%, a decrease from the previous week. Overall, laboratory detections of influenza are steadily decreasing. Influenza A accounted for 54% of influenza detections in week 15.
Overall, laboratory detections of influenza are around the average for this time of year. For data on other respiratory virus detections, see the Respiratory Virus Detections in Canada Report.
[h=3]Figure 2 - Number of positive influenza tests and percentage of tests positive, by type, subtype and report week, Canada, weeks 2017-35 to 2018-15[/h]
Fig2-eng.jpg
The shaded area indicates weeks where the positivity rate was at least 5% and a minimum of 15 positive tests were observed, signalling the period of seasonal influenza activity.

Figure 2 - Text Description To date this season, 62,062 laboratory-confirmed influenza detections have been reported, of which 56% have been influenza A. Influenza A(H3N2) has been the most common subtype detected this season, representing 91% of subtyped influenza A detections. For more detailed weekly and cumulative influenza data, see the text descriptions for Figures 2 and 3 or the Respiratory Virus Detections in Canada Report.
[h=3]Figure 3 - Cumulative numbers of positive influenza specimens by type/subtype and province/territory, Canada, weeks 2017-35 to 2018-15[/h]
Fig3-eng.jpg

Figure 3 - Text Description To date this season, detailed information on age and type/subtype has been received for 50,204 laboratory-confirmed influenza cases (Table 1). Adults 65 years of age and older represent the largest proportion of cases overall (50%), and among cases of influenza A(H3N2) (59%) and influenza B (48%). Adults aged 20-64 represent 32% of cases overall and 29% of influenza A(H3N2) and 34% of influenza B cases. Although much smaller in numbers (883), the majority of influenza A(H1N1)pdm09 cases are among adults less than 65 years of age, with adults aged 20-64 and children 0-19 years accounting for 54% and 31% of cases respectively.
[TABLE="class: table table-striped table-bordered table-hover table-condensed, width: 1140"]
Table 1 ? Cumulative numbers of positive influenza specimens by type, subtype and age-group reported through case-based laboratory reporting, Canada, weeks 2017-35 to 2018-15 [TR="class: bg-primary, bgcolor: #2572B4"]
Age groups (years) Cumulative (August 27, 2017 to April 14, 2018) [/TR]
[TR="class: bg-primary, bgcolor: #2572B4"]
Influenza A B Influenza A and B [/TR]
[TR="class: bg-primary, bgcolor: #2572B4"]
A Total A(H1N1) pdm09 A(H3N2) A (UnS)1 Total # % [/TR]
[TR="bgcolor: #F5F5F5"]
[TD]0-4[/TD]
[TD]3077[/TD]
[TD]144[/TD]
[TD]551[/TD]
[TD]2382[/TD]
[TD]1452[/TD]
[TD]4529[/TD]
[TD]9%[/TD]
[/TR]
[TR]
[TD]5-19[/TD]
[TD]2256[/TD]
[TD]126[/TD]
[TD]536[/TD]
[TD]1594[/TD]
[TD]2525[/TD]
[TD]4781[/TD]
[TD]10%[/TD]
[/TR]
[TR="bgcolor: #F5F5F5"]
[TD]20-44[/TD]
[TD]4150[/TD]
[TD]244[/TD]
[TD]1179[/TD]
[TD]2727[/TD]
[TD]2707[/TD]
[TD]6857[/TD]
[TD]14%[/TD]
[/TR]
[TR]
[TD]45-64[/TD]
[TD]4558[/TD]
[TD]229[/TD]
[TD]1427[/TD]
[TD]2902[/TD]
[TD]4571[/TD]
[TD]9129[/TD]
[TD]18%[/TD]
[/TR]
[TR="bgcolor: #F5F5F5"]
[TD]65+[/TD]
[TD]14610[/TD]
[TD]140[/TD]
[TD]5314[/TD]
[TD]9156[/TD]
[TD]10298[/TD]
[TD]24908[/TD]
[TD]50%[/TD]
[/TR]
[TR]
[TD]Total[/TD]
[TD]28651[/TD]
[TD]883[/TD]
[TD]9007[/TD]
[TD]18761[/TD]
[TD]21553[/TD]
[TD]50204[/TD]
[TD]100%[/TD]
[/TR]
[/TABLE]
[h=2]Syndromic/Influenza-like Illness Surveillance[/h] [h=3]Healthcare Practitioners Sentinel Syndromic Surveillance[/h] In week 15, 1.5% of visits to healthcare professionals were due to influenza-like illness (ILI); a decrease from the previous week.
[h=3]Figure 4 - Percentage of visits for ILI reported by sentinels by report week, Canada, weeks 2017-35 to 2018-15[/h] Number of Sentinels Reporting in Week 15: 159
Fig4-eng.jpg
The shaded area represents the maximum and minimum percentage of visits for ILI reported by week from seasons 2012-13 to 2016-17

Figure 4 - Text Description [h=3]Participatory Syndromic Surveillance[/h] FluWatchers is a participatory ILI surveillance system that relies on weekly voluntary submissions of syndromic information from Canadians across Canada.
In week 15, 1,315 participants reported to FluWatchers, of which 2% reported symptoms of cough and fever, and 41% of these consulted a healthcare professional. Among participants who reported cough and fever, 73% reported days missed from work or school, resulting in a combined total of 59 missed days of work or school.
[TABLE="class: table table-striped table-bordered table-hover table-condensed, width: 1140"]
Table 2 - Summary of influenza-like illness symptoms reported by participating Canadians, Canada, week 2018-15 [TR="class: bg-primary, bgcolor: #2572B4"]
Number of Participants Reporting Percentage participants reporting Cough and Fever Percentage of participants with cough and fever who consulted a healthcare professional Percentage of participants with cough and fever who reported missed days from work or school Number of missed days from work or school [/TR]
[TR="class: text-center, bgcolor: #F5F5F5"]
[TD]1315[/TD]
[TD]2%[/TD]
[TD]41%[/TD]
[TD]73%[/TD]
[TD]59[/TD]
[/TR]
[/TABLE]
[h=2]Influenza Outbreak Surveillance[/h] In week 15, 44 laboratory-confirmed outbreaks of influenza were reported. Among the reported influenza outbreaks, 31 were reported in long-term care facilities (LTC), three in hospitals, and 10 in other settings. In addition, two ILI outbreaks were reported in schools. Among the 35 outbreaks with influenza type/subtype reported, 22 (63%) were associated with influenza A, 12 (34%) were associated with influenza B and one outbreak (3%) was associated with a mix of influenza A and B.
To date this season, 1,751 influenza/ILI outbreaks have been reported, of which 1,081 (62%) occurred in LTC facilities. Among the 1,500 outbreaks for which the influenza type/subtype was reported, 825 (55%) were associated with influenza A and 606 (40%) were associated with influenza B, and 69 (5%) were associated with a mix of A and B.
[h=3]Figure 5 - Number of new outbreaks of laboratory-confirmed influenza by report week, Canada, weeks 2017-35 to 2018-15[/h]
Fig5-eng.jpg

Figure 5 - Text Description [h=2]Severe Outcomes Influenza Surveillance[/h] [h=3]Provincial/Territorial Influenza Hospitalizations and Deaths[/h] To date this season, 4,835 influenza-associated hospitalizations were reported by participating provinces and territoriesFootnote1. Among the hospitalizations, 3,260 (67%) were associated with influenza A, and 3,190 cases (66%) were in adults 65 years of age or older.
Additionally, 487 ICU admissions and 265 deaths have been reported to date. Adults aged 65 years of age or older accounted for the greatest proportion of ICU cases (44%), followed by adults aged 20-64 (39%). Adults aged 65 years of age or older accounted the majority of deaths (85%).
[h=3]Figure 6 - Cumulative numbers of hospitalizations by age-group reported by participating provinces and territoriesfigure 6 note1, weeks 2017-35 to 2018-15[/h]
Fig6-eng.jpg

Figure 6 - Text Description Figure 6 note 1 Influenza-associated hospitalizations are reported by NL, PE, NS, NB, MB, AB, YT and NT. Only hospitalizations that require intensive medical care are reported by SK.
Return to figure 6 note1referrer

[h=3]Pediatric Influenza Hospitalizations and Deaths[/h] In week 15, 12 laboratory-confirmed influenza-associated pediatric (≤16 years of age) hospitalizations were reported by the Immunization Monitoring Program Active (IMPACT) network. Influenza A accounted for 67% of the hospitalizations. Pediatric hospitalizations have been on a general decline since week 07. The number of weekly reported hospitalizations has finally fallen to levels that are near the seven-season average.
To date this season, 1,034 pediatric hospitalizations have been reported by the IMPACT network, 643 (62%) of which were associated with influenza A. Children 0-23 months accounted for the largest proportion of influenza A hospitalizations (40%). Among the 391 hospitalizations due to influenza B, children 5-9 years accounted for the largest proportion of cases (31%).
Additionally, 175 ICU admissions and nine deaths have been reported to date. Children aged 0-23 months accounted for the greatest proportion of ICU cases (29%), followed by children aged 5-9 years (26%). Among the ICU cases with available information, 63% were due to influenza A and approximately 47% had no reported previous or concurrent medical conditions. All but one reported deaths were among children over the age of two.
[h=3]Figure 7 - Cumulative numbers of pediatric hospitalizations (≤16 years of age) with influenza by type and age-group reported by the IMPACT network, Canada, weeks 2017-35 to 2018-15[/h]
Fig7-eng.jpg

Figure 7 - Text Description [h=3]Figure 8 - Number of pediatric hospitalizations (≤16 years of age) with influenza reported by the IMPACT network, by week, Canada, weeks 2017-35 to 2018-15[/h]
Fig8-eng.jpg

Figure 8 - Text Description Figure 8 Footnote 1 The shaded area represents the maximum and minimum number of cases reported by week from seasons 2010-11 to 2016-17
Return to figure 8 note1referrer

[h=2]Influenza Strain Characterizations[/h] During the 2017-18 influenza season, the National Microbiology Laboratory (NML) has characterized 3,146 influenza viruses [1,377 A(H3N2), 239 A(H1N1)pdm09 and 1,530 B viruses] that were received from Canadian laboratories.
[h=3]Antigenic Characterization[/h] Among influenza viruses characterized by hemagglutination inhibition (HI) assay during the 2017-18 season, most viruses were antigenically similar to the cell-culture propagated reference strains recommended by WHO.
[TABLE="class: table table-striped table-bordered table-hover table-condensed, width: 1140"]
Table 3 - Influenza antigenic strain characterizations, Canada, weeks 2017-35 to 2018-15 [TR="class: bg-primary, bgcolor: #2572B4"]
Strain Characterization Results Count Description [/TR]
[TR="bgcolor: #F5F5F5"]
Influenza A (H3N2) [/TR]
[TR]
[TD]A/Hong Kong/4801/2014-like[/TD]
[TD]277[/TD]
[TD]Viruses antigenically similar to A/Hong Kong/4801/2014, the A(H3N2) component of the 2017-18 Northern Hemisphere's trivalent and quadrivalent vaccine.[/TD]
[/TR]
[TR="bgcolor: #F5F5F5"]
[TD]Reduced titer to A/Hong Kong/4801/2014[/TD]
[TD]79[/TD]
[TD]These A(H3N2) viruses reacted poorly with antisera raised against cell-propagated A/Hong Kong/4801/2014, suggesting some antigenic differences[/TD]
[/TR]
[TR]
Influenza A (H1N1)pdm09 [/TR]
[TR="bgcolor: #F5F5F5"]
[TD]A/Michigan/45/2015-like[/TD]
[TD]239[/TD]
[TD]Viruses antigenically similar to A/Michigan/45/2015, the A(H1N1)pdm09 component of the 2017-18 Northern Hemisphere's trivalent and quadrivalent influenza vaccine.[/TD]
[/TR]
[TR]
Influenza B [/TR]
[TR="bgcolor: #F5F5F5"]
[TD]B/Brisbane/60/2008-like (Victoria lineage)[/TD]
[TD]16[/TD]
[TD]Viruses antigenically similar to B/Brisbane/60/2008.
B/Brisbane/60/2008 is the influenza B component of the 2017-18 Northern Hemisphere's trivalent and quadrivalent influenza vaccine.[/TD]
[/TR]
[TR]
[TD]Reduced titer to B/Brisbane/60/2008
(Victoria lineage)[/TD]
[TD]48[/TD]
[TD]These B/Victoria lineage viruses reacted poorly with antisera raised against cell-propagated B/Brisbane/60/2008, suggesting some antigenic differences.[/TD]
[/TR]
[TR="bgcolor: #F5F5F5"]
[TD]B/Phuket/3073/2013-like
(Yamagata lineage)[/TD]
[TD]1,466[/TD]
[TD]Viruses antigenically similar to B/Phuket/3073/2013, the additional influenza B component of the 2017-18 Northern Hemisphere quadrivalent influenza vaccine.[/TD]
[/TR]
[/TABLE]
[h=3]Genetic Characterization of A(H3N2) viruses[/h] During the 2017-18 season, 1,021 A(H3N2) viruses did not grow to sufficient titers for antigenic characterization by HI assay. Therefore, genetic characterization was performed to determine to which genetic group they belong. Sequence analysis showed that 913 A(H3N2) viruses belonged to genetic group 3C.2a, 106 viruses belonged to subclade 3C.2a1 and two viruses belonged to the clade 3C.3a.
Additionally, of the 356 influenza A(H3N2) viruses that were characterized antigenically as similar to A/Hong Kong/4801/2014, 245 belonged to genetic group 3C.2a and 25 viruses belonged to subclade 3C.2a1. The 79 viruses that showed reduced titer to A/Hong Kong/4801/2014 belonged to genetic clade 3C.3a. Sequencing is pending for the remaining seven isolates.
A/Hong Kong/4801/2014-like virus belongs to genetic group 3C.2a and is the influenza A/H3N2 component of the 2017-18 Northern Hemisphere influenza vaccine.
[h=3]Genetic Characterization of Influenza B viruses[/h] Among the viruses characterized antigenically as having reduced titer to ferret antisera produced against cell-propagated B/Brisbane/60/2008, sequence analysis showed that 47 viruses had a two amino acid deletion in the HA gene. Sequencing is pending for the remaining virus isolate.

...
https://www.canada.ca/en/public-hea...h/2017-2018/week15-april-8-april-14-2018.html

 
FluWatch report: April 15, 2018 to April 21, 2018 (Week 16)

Overall Summary
  • Overall, influenza activity in Canada continued to decrease, but parts of the country are still reporting localized activity.
  • All indicators of influenza activity have either decreased or remained similar to the previous week.
  • Detections of influenza A were greater than those of influenza B.
  • To date this season, the majority of laboratory-confirmed cases, hospitalizations and deaths with influenza have been among adults 65 years of age and older.
  • For more information on the flu, see our Flu(influenza) web page.
On this page
pub-eng.jpg

Download the alternative format
(PDF format, 1.7 MB, 11 pages)
Organization:
Public Health Agency of Canada
Date published: 2018-04-27

Related Topics


Influenza/Influenza-like Illness Activity (geographic spread)

In week 16, 14 regions ( ON(7), QC(1), NB(2), NL(2), NS(1) and NT(1)) reported localized activity. Six regions reported no influenza activity.
Figure 1 - Map of overall influenza/ILI activity level by province and territory, Canada, week 2018-16
fig1-eng.jpg
Note: Influenza/ILI activity levels, as represented on this map, are assigned and reported by Provincial and Territorial Ministries of Health, based on laboratory confirmations, sentinel ILI rates and reported outbreaks. Please refer to detailed definitions at the end of the report. Maps from previous weeks, including any retrospective updates, are available in the mapping feature found in the Weekly Influenza Reports.


Figure 1 - Text descriptionLaboratory-Confirmed Influenza Detections

In week 16, the overall percentage of tests positive for influenza was 12%, a decrease from the previous week. Overall, laboratory detections of influenza are steadily decreasing. In week 16, 719 positive influenza tests were reported, down from 955 tests reported in week 15. Influenza A accounted for 57% of influenza detections in week 16.
Overall, laboratory detections of influenza are around the average for this time of year. For data on other respiratory virus detections, see the Respiratory Virus Detections in Canada Report.
Figure 2 - Number of positive influenza tests and percentage of tests positive, by type, subtype and report week, Canada, weeks 2017-35 to 2018-16

fig2-eng.jpg
The shaded area indicates weeks where the positivity rate was at least 5% and a minimum of 15 positive tests were observed, signalling the period of seasonal influenza activity.


Figure 2 - Text descriptionTo date this season, 62,933 laboratory-confirmed influenza detections have been reported, of which 56% have been influenza A. Influenza A(H3N2) has been the most common subtype detected this season, representing 91% of subtyped influenza A detections. For more detailed weekly and cumulative influenza data, see the text descriptions for Figures 2 and 3 or the Respiratory Virus Detections in Canada Report.
Figure 3 - Cumulative numbers of positive influenza specimens by type/subtype and province/territory, Canada, weeks 2017-35 to 2018-16
fig3-eng.jpg


Figure 3 - Text descriptionTo date this season, detailed information on age and type/subtype has been received for 50,729 laboratory-confirmed influenza cases (Table 1). Adults 65 years of age and older represent the largest proportion of cases overall (50%), and among cases of influenza A(H3N2) (59%) and influenza B (48%). Adults aged 20-64 represent 32% of cases overall and 29% of influenza A(H3N2) and 34% of influenza B cases. Although much smaller in numbers (898), the majority of influenza A(H1N1)pdm09 cases are among adults less than 65 years of age, with adults aged 20-64 and children 0-19 years accounting for 54% and 30% of cases respectively.
[TABLE="class: table table-striped table-bordered table-hover table-condensed , width: 1140"]
[TR="class: bg-primary cke_show_border, bgcolor: #2572B4"]
[/TR]
[TR="class: bg-primary cke_show_border, bgcolor: #2572B4"]
[/TR]
[TR="class: bg-primary cke_show_border, bgcolor: #2572B4"]
[/TR]
[TR="class: cke_show_border, bgcolor: #F5F5F5"]
[TD]0-4[/TD]
[TD]3099[/TD]
[TD]148[/TD]
[TD]556[/TD]
[TD]2395[/TD]
[TD]1461[/TD]
[TD]4560[/TD]
[TD]9%[/TD]
[/TR]
[TR="class: cke_show_border"]
[TD]5-19[/TD]
[TD]2273[/TD]
[TD]125[/TD]
[TD]538[/TD]
[TD]1610[/TD]
[TD]2536[/TD]
[TD]4809[/TD]
[TD]9%[/TD]
[/TR]
[TR="class: cke_show_border, bgcolor: #F5F5F5"]
[TD]20-44[/TD]
[TD]4179[/TD]
[TD]251[/TD]
[TD]1183[/TD]
[TD]2745[/TD]
[TD]2732[/TD]
[TD]6911[/TD]
[TD]14%[/TD]
[/TR]
[TR="class: cke_show_border"]
[TD]45-64[/TD]
[TD]4605[/TD]
[TD]231[/TD]
[TD]1432[/TD]
[TD]2942[/TD]
[TD]4628[/TD]
[TD]9233[/TD]
[TD]18%[/TD]
[/TR]
[TR="class: cke_show_border, bgcolor: #F5F5F5"]
[TD]65+[/TD]
[TD]14791[/TD]
[TD]143[/TD]
[TD]5392[/TD]
[TD]9256[/TD]
[TD]10425[/TD]
[TD]25216[/TD]
[TD]50%[/TD]
[/TR]
[TR="class: cke_show_border"]
[TD]Total[/TD]
[TD]28947[/TD]
[TD]898[/TD]
[TD]9101[/TD]
[TD]18948[/TD]
[TD]21782[/TD]
[TD]50729[/TD]
[TD]100%[/TD]
[/TR]
[TR="class: cke_show_border"]
[TD="colspan: 8"]Table 1 Notes

Table 1 Note 1UnS: unsubtyped: The specimen was typed as influenza A, but no result for subtyping was available
Return to table 1 note1referrer
[/TD]
[/TR]
[/TABLE]
Syndromic/Influenza-like Illness Surveillance

Healthcare Practitioners Sentinel Syndromic Surveillance

In week 16, 1.7% of visits to healthcare professionals were due to influenza-like illness (ILI); a decrease from the previous week.
Figure 4 - Percentage of visits for ILI reported by sentinels by report week, Canada, weeks 2017-35 to 2018-16

Number of participants in week 16: 158
fig4-eng.jpg
The shaded area represents the maximum and minimum percentage of visits for ILI reported by week from seasons 2012-13 to 2016-17


Figure 4 - Text descriptionParticipatory Syndromic Surveillance

FluWatchers is a participatory ILI surveillance system that relies on weekly voluntary submissions of syndromic information from Canadians across Canada.
In week 16, 1,314 participants reported to FluWatchers, of which 1% reported symptoms of cough and fever, and 19% of these consulted a healthcare professional. Among participants who reported cough and fever, 88% reported days missed from work or school, resulting in a combined total of 43 missed days of work or school.
[TABLE="class: table table-striped table-bordered table-hover table-condensed , width: 1140"]
[TR="class: bg-primary cke_show_border, bgcolor: #2572B4"]
[/TR]
[TR="class: text-center cke_show_border, bgcolor: #F5F5F5"]
[TD]1314[/TD]
[TD]1%[/TD]
[TD]19%[/TD]
[TD]88%[/TD]
[TD]43[/TD]
[/TR]
[/TABLE]
Influenza Outbreak Surveillance

In week 16, 14 laboratory-confirmed outbreaks of influenza were reported. Among the reported influenza outbreaks, nine were reported in long-term care facilities (LTC), one in a hospital, and four in other settings. In addition, one ILI outbreak was reported in a school. Among the 11 outbreaks with influenza type/subtype reported, eight (73%) were associated with influenza A and three (27%) were associated with influenza B.
To date this season, 1,767 influenza/ILI outbreaks have been reported, of which 1,091 (62%) occurred in LTC facilities. Among the 1,512 outbreaks for which the influenza type/subtype was reported, 834 (55%) were associated with influenza A and 609 (40%) were associated with influenza B, and 69 (5%) were associated with a mix of A and B.
Figure 5 - Number of new outbreaks of laboratory-confirmed influenza by report week, Canada, weeks 2017-35 to 2018-16

fig5-eng.jpg


Figure 5 - Text descriptionSevere Outcomes Influenza Surveillance

Provincial/Territorial Influenza Hospitalizations and Deaths

To date this season, 4,928 influenza-associated hospitalizations were reported by participating provinces and territoriesFootnote1. Among the hospitalizations, 3,305 (67%) were associated with influenza A, and 3,232 cases (66%) were in adults 65 years of age or older.
Additionally, 496 ICU admissions and 271 deaths have been reported to date. Adults aged 65 years of age or older accounted for the greatest proportion of ICU cases (44%), followed by adults aged 20-64 (40%). Adults aged 65 years of age or older accounted the majority of deaths (85%).
Figure 6 - Cumulative numbers of hospitalizations by age-group reported by participating provinces and territoriesfigure 6 note1, weeks 2017-35 to 2018-16

fig6-eng.jpg


Figure 6 - Text descriptionFigure 6 note 1Influenza-associated hospitalizations are reported by NL, PE, NS, NB, MB, AB, YT and NT. Only hospitalizations that require intensive medical care are reported by SK.
Return to figure 6 note1referrer

Pediatric Influenza Hospitalizations and Deaths

In week 16, seven laboratory-confirmed influenza-associated pediatric (≤16 years of age) hospitalizations were reported by the Immunization Monitoring Program Active (IMPACT) network. Influenza A accounted for 57% of the hospitalizations. Pediatric hospitalizations have been on a general decline since week 07. The number of weekly reported hospitalizations has finally fallen to levels that are below the seven-season average.
To date this season, 1,040 pediatric hospitalizations have been reported by the IMPACT network, 645 (62%) of which were associated with influenza A. Children 0-23 months accounted for the largest proportion of influenza A hospitalizations (40%). Among the 395 hospitalizations due to influenza B, children 5-9 years accounted for the largest proportion of cases (31%).
Additionally, 177 ICU admissions and nine deaths have been reported to date. Children aged 0-23 months accounted for the greatest proportion of ICU cases (29%), followed by children aged 5-9 years (30%). Among the ICU cases with available information, 25% were due to influenza A and approximately 46% had no reported previous or concurrent medical conditions. All but one reported deaths were among children over the age of two.
Figure 7 - Cumulative numbers of pediatric hospitalizations (≤16 years of age) with influenza by type and age-group reported by the IMPACT network, Canada, weeks 2017-35 to 2018-16

fig7-eng.jpg


Figure 7 - Text descriptionFigure 8 - Number of pediatric hospitalizations (≤16 years of age) with influenza reported by the IMPACT network, by week, Canada, weeks 2017-35 to 2018-16

fig8-eng.jpg
The shaded area represents the maximum and minimum number of cases reported by week from seasons 2010-11 to 2016-17


Figure 8 - Text descriptionInfluenza Strain Characterizations

During the 2017-18 influenza season, the National Microbiology Laboratory (NML) has characterized 3,317 influenza viruses [1,420 A(H3N2), 247 A(H1N1)pdm09 and 1,650 B viruses] that were received from Canadian laboratories.
Antigenic Characterization

Among influenza viruses characterized by hemagglutination inhibition (HI) assay during the 2017-18 season, most viruses were antigenically similar to the cell-culture propagated reference strains recommended by WHO.
[TABLE="class: table table-striped table-bordered table-hover table-condensed , width: 1140"]
[TR="class: bg-primary cke_show_border, bgcolor: #2572B4"]
[/TR]
[TR="class: cke_show_border, bgcolor: #F5F5F5"]
[/TR]
[TR="class: cke_show_border"]
[TD]A/Hong Kong/4801/2014-like[/TD]
[TD]287[/TD]
[TD]Viruses antigenically similar to A/Hong Kong/4801/2014, the A(H3N2) component of the 2017-18 Northern Hemisphere's trivalent and quadrivalent vaccine.[/TD]
[/TR]
[TR="class: cke_show_border, bgcolor: #F5F5F5"]
[TD]Reduced titer to A/Hong Kong/4801/2014[/TD]
[TD]82[/TD]
[TD]These A(H3N2) viruses reacted poorly with antisera raised against cell-propagated A/Hong Kong/4801/2014, suggesting some antigenic differences[/TD]
[/TR]
[TR="class: cke_show_border, bgcolor: #F5F5F5"]
[/TR]
[TR="class: cke_show_border"]
[TD]A/Michigan/45/2015-like[/TD]
[TD]247[/TD]
[TD]Viruses antigenically similar to A/Michigan/45/2015, the A(H1N1)pdm09 component of the 2017-18 Northern Hemisphere's trivalent and quadrivalent influenza vaccine.[/TD]
[/TR]
[TR="class: cke_show_border, bgcolor: #F5F5F5"]
[/TR]
[TR="class: cke_show_border"]
[TD]B/Brisbane/60/2008-like
(Victoria lineage)
[/TD]
[TD]20[/TD]
[TD]Viruses antigenically similar to B/Brisbane/60/2008.
B/Brisbane/60/2008 is the influenza B component of the 2017-18 Northern Hemisphere's trivalent and quadrivalent influenza vaccine.
[/TD]
[/TR]
[TR="class: cke_show_border, bgcolor: #F5F5F5"]
[TD]Reduced titer to B/Brisbane/60/2008
(Victoria lineage)
[/TD]
[TD]49[/TD]
[TD]These B/Victoria lineage viruses reacted poorly with antisera raised against cell-propagated B/Brisbane/60/2008, suggesting some antigenic differences[/TD]
[/TR]
[TR="class: cke_show_border"]
[TD]B/Phuket/3073/2013-like
(Yamagata lineage)
[/TD]
[TD]1581[/TD]
[TD]Viruses antigenically similar to B/Phuket/3073/2013, the additional influenza B component of the 2017-18 Northern Hemisphere quadrivalent influenza vaccine.[/TD]
[/TR]
[/TABLE]
Genetic Characterization of A(H3N2) viruses

During the 2017-18 season, 1,051 A(H3N2) viruses did not grow to sufficient titers for antigenic characterization by HI assay. Therefore, genetic characterization was performed to determine to which genetic group they belong. Sequence analysis showed that 942 A(H3N2) viruses belonged to genetic group 3C.2a, 107 viruses belonged to subclade 3C.2a1 and two viruses belonged to the clade 3C.3a.
Additionally, of the 369 influenza A(H3N2) viruses that were characterized antigenically as similar to A/Hong Kong/4801/2014, 251 belonged to genetic group 3C.2a and 26 viruses belonged to subclade 3C.2a1. The 82 viruses that showed reduced titer to A/Hong Kong/4801/2014 belonged to genetic clade 3C.3a. Sequencing is pending for the remaining 10 isolates.
A/Hong Kong/4801/2014-like virus belongs to genetic group 3C.2a and is the influenza A/H3N2 component of the 2017-18 Northern Hemisphere influenza vaccine.
Genetic Characterization of Influenza B viruses

Among the viruses characterized antigenically as having reduced titer to ferret antisera produced against cell-propagated B/Brisbane/60/2008, sequence analysis showed that 48 viruses had a two amino acid deletion in the HA gene. Sequencing is pending for the remaining virus isolate.
...

https://www.canada.ca/en/public-hea...uwatch/2017-2018/week16-april-15-21-2018.html
 
[h=1]FluWatch report: April 22, 2018 to April 28, 2018 (Week 17)[/h] [h=5]Overall Summary[/h]
  • Overall, influenza activity in Canada continued to decrease, but parts of the country are still reporting localized activity.
  • The number of regions reporting no influenza activity increased from the previous week.
  • Detections of influenza A were greater than those of influenza B.
  • To date this season, the majority of laboratory-confirmed cases, hospitalizations and deaths with influenza have been among adults 65 years of age and older.
  • For more information on the flu, see our Flu(influenza) web page.
[h=2]On this page[/h]

pub-eng.jpg

Download the alternative format
(PDF format, 1.7 MB, 11 pages)
Organization:
Public Health Agency of Canada
Date published: 2018-05-04

[h=2]Related Topics[/h]


[h=2]Influenza/Influenza-like Illness Activity (geographic spread)[/h] In week 17, 16 regions (BC(1), SK(1), ON(7), NB(3), NL(2), NS(1) and NT(1)) reported localized activity. Nine regions (SK(2), MB(2), NB(1), NS(2) and NU(2)) reported no influenza activity.
Figure 1 - Map of overall influenza/ILI activity level by province and territory, Canada, week 2018-17
fig1-eng.jpg
Note: Influenza/ILI activity levels, as represented on this map, are assigned and reported by Provincial and Territorial Ministries of Health, based on laboratory confirmations, sentinel ILI rates and reported outbreaks. Please refer to detailed definitions at the end of the report. Maps from previous weeks, including any retrospective updates, are available in the mapping feature found in the Weekly Influenza Reports.

Figure 1 - Text description [h=2]Laboratory-Confirmed Influenza Detections[/h] In week 17, the percentage of tests positive for influenza was 10%, a decrease from the previous week. Laboratory detections of influenza are steadily decreasing. In week 17, 526 positive influenza tests were reported, down from 719 tests reported in week 16. Influenza A accounted for 57% of influenza detections in week 17.
Overall, laboratory detections of influenza are around the average for this time of year. For data on other respiratory virus detections, see the Respiratory Virus Detections in Canada Report.
[h=3]Figure 2 - Number of positive influenza tests and percentage of tests positive, by type, subtype and report week, Canada, weeks 2017-35 to 2018-17[/h]
fig2-eng.jpg
The shaded area indicates weeks where the positivity rate was at least 5% and a minimum of 15 positive tests were observed, signalling the period of seasonal influenza activity.

Figure 2 - Text description To date this season, 63,476 laboratory-confirmed influenza detections have been reported, of which 56% have been influenza A. Influenza A(H3N2) has been the most common subtype detected this season, representing 90% of subtyped influenza A detections. For more detailed weekly and cumulative influenza data, see the text descriptions for Figures 2 and 3 or the Respiratory Virus Detections in Canada Report.
Figure 3 - Cumulative numbers of positive influenza specimens by type/subtype and province/territory, Canada, weeks 2017-35 to 2018-17
fig3-eng.jpg

Figure 3 - Text description To date this season, detailed information on age and type/subtype has been received for 51,076 laboratory-confirmed influenza cases (Table 1). Adults 65 years of age and older represent the largest proportion of cases overall (50%), and among cases of influenza A(H3N2) (59%) and influenza B (48%). Adults aged 20-64 represent 32% of cases overall and 29% of influenza A(H3N2) and 34% of influenza B cases. Although much smaller in numbers (910), the majority of influenza A(H1N1)pdm09 cases are among adults less than 65 years of age, with adults aged 20-64 and children 0-19 years accounting for 54% and 30% of cases respectively.
[TABLE="class: table table-striped table-bordered table-hover table-condensed, width: 1140"]
Table 1 - Cumulative numbers of positive influenza specimens by type, subtype and age-group reported through case-based laboratory reporting, Canada, weeks 2017-35 to 2018-17 [TR="class: bg-primary, bgcolor: #2572B4"]
Age groups (years) Cumulative (August 27, 2017 to April 28, 2018) [/TR]
[TR="class: bg-primary, bgcolor: #2572B4"]
Influenza A B Influenza A and B [/TR]
[TR="class: bg-primary, bgcolor: #2572B4"]
A Total A(H1N1) pdm09 A(H3N2) A (UnS)table 1 note1 Total # % [/TR]
[TR="bgcolor: #F5F5F5"]
[TD]0-4[/TD]
[TD="class: text-right"]3125[/TD]
[TD="class: text-right"]150[/TD]
[TD="class: text-right"]557[/TD]
[TD="class: text-right"]2418[/TD]
[TD="class: text-right"]1475[/TD]
[TD="class: text-right"]4600[/TD]
[TD="class: text-right"]9%[/TD]
[/TR]
[TR]
[TD]5-19[/TD]
[TD="class: text-right"]2286[/TD]
[TD="class: text-right"]126[/TD]
[TD="class: text-right"]539[/TD]
[TD="class: text-right"]1621[/TD]
[TD="class: text-right"]2544[/TD]
[TD="class: text-right"]4830[/TD]
[TD="class: text-right"]9%[/TD]
[/TR]
[TR="bgcolor: #F5F5F5"]
[TD]20-44[/TD]
[TD="class: text-right"]4206[/TD]
[TD="class: text-right"]255[/TD]
[TD="class: text-right"]1186[/TD]
[TD="class: text-right"]2765[/TD]
[TD="class: text-right"]2748[/TD]
[TD="class: text-right"]6954[/TD]
[TD="class: text-right"]14%[/TD]
[/TR]
[TR]
[TD]45-64[/TD]
[TD="class: text-right"]4633[/TD]
[TD="class: text-right"]233[/TD]
[TD="class: text-right"]1436[/TD]
[TD="class: text-right"]2964[/TD]
[TD="class: text-right"]4662[/TD]
[TD="class: text-right"]9295[/TD]
[TD="class: text-right"]18%[/TD]
[/TR]
[TR="bgcolor: #F5F5F5"]
[TD]65+[/TD]
[TD="class: text-right"]14884[/TD]
[TD="class: text-right"]146[/TD]
[TD="class: text-right"]5426[/TD]
[TD="class: text-right"]9312[/TD]
[TD="class: text-right"]10513[/TD]
[TD="class: text-right"]25397[/TD]
[TD="class: text-right"]50%[/TD]
[/TR]
[TR]
[TD]Total[/TD]
[TD="class: text-right"]29134[/TD]
[TD="class: text-right"]910[/TD]
[TD="class: text-right"]9144[/TD]
[TD="class: text-right"]19080[/TD]
[TD="class: text-right"]21942[/TD]
[TD="class: text-right"]51076[/TD]
[TD="class: text-right"]100%[/TD]
[/TR]
[TR]
[TD="colspan: 8"] [h=5]Table 1 Notes[/h] Table 1 Note 1 UnS: unsubtyped: The specimen was typed as influenza A, but no result for subtyping was available
Return to table 1 note1referrer

[/TD]
[/TR]
[/TABLE]
[h=2]Syndromic/Influenza-like Illness Surveillance[/h] [h=3]Healthcare Practitioners Sentinel Syndromic Surveillance[/h] In week 17, 2.0% of visits to healthcare professionals were due to influenza-like illness (ILI).
[h=3]Figure 4 - Percentage of visits for ILI reported by sentinels by report week, Canada, weeks 2017-35 to 2018-17[/h] Number of participants in week 17: 165
fig4-eng.jpg
The shaded area represents the maximum and minimum percentage of visits for ILI reported by week from seasons 2012-13 to 2016-17

Figure 4 - Text description [h=3]Participatory Syndromic Surveillance[/h] FluWatchers is a participatory ILI surveillance system that relies on weekly voluntary submissions of syndromic information from Canadians across Canada.
In week 17, 1,319 participants reported to FluWatchers, of which 2% reported symptoms of cough and fever, and 10% of these consulted a healthcare professional. Among participants who reported cough and fever, 80% reported days missed from work or school, resulting in a combined total of 35 missed days of work or school.
[TABLE="class: table table-striped table-bordered table-hover table-condensed, width: 1140"]
Table 2 - Summary of influenza-like illness symptoms reported by participating Canadians, Canada, week 2018-17 [TR="class: bg-primary, bgcolor: #2572B4"]
Number of Participants Reporting Percentage participants reporting Cough and Fever Percentage of participants with cough and fever who consulted a healthcare professional Percentage of participants with cough and fever who reported missed days from work or school Number of missed days from work or school [/TR]
[TR="class: text-center, bgcolor: #F5F5F5"]
[TD]1319[/TD]
[TD]2%[/TD]
[TD]10%[/TD]
[TD]80%[/TD]
[TD]35[/TD]
[/TR]
[/TABLE]
[h=2]Influenza Outbreak Surveillance[/h] In week 17, nine laboratory-confirmed outbreaks of influenza were reported. Among the reported influenza outbreaks, six were reported in long-term care facilities (LTC) and three in other settings. In addition, one ILI outbreak was reported in a school. Among the seven outbreaks with influenza type/subtype reported, five (71%) were associated with influenza B and two (29%) were associated with influenza A.
To date this season, 1,778 influenza/ILI outbreaks have been reported, of which 1,098 (62%) occurred in LTC facilities. Among the 1,520 outbreaks for which the influenza type/subtype was reported, 836 (55%) were associated with influenza A and 615 (40%) were associated with influenza B, and 69 (5%) were associated with a mix of A and B.
[h=3]Figure 5 - Number of new outbreaks of laboratory-confirmed influenza by report week, Canada, weeks 2017-35 to 2018-17[/h]
fig5-eng.jpg

Figure 5 - Text description [h=2]Severe Outcomes Influenza Surveillance[/h] [h=3]Provincial/Territorial Influenza Hospitalizations and Deaths[/h] To date this season, 5,004 influenza-associated hospitalizations were reported by participating provinces and territoriesFootnote1. Among the hospitalizations, 3,337 (67%) were associated with influenza A, and 3,275 cases (65%) were in adults 65 years of age or older.
Additionally, 504 ICU admissions and 278 deaths have been reported to date. Adults aged 65 years of age or older accounted for the greatest proportion of ICU cases (44%), followed by adults aged 20-64 (40%). Adults aged 65 years of age or older accounted the majority of deaths (85%).
[h=3]Figure 6 - Cumulative numbers of hospitalizations by age-group reported by participating provinces and territoriesfigure 6 note1, weeks 2017-35 to 2018-17[/h]
fig6-eng.jpg

Figure 6 - Text description Figure 6 note 1 Influenza-associated hospitalizations are reported by NL, PE, NS, NB, MB, AB, YT and NT. Only hospitalizations that require intensive medical care are reported by SK.
Return to figure 6 note1referrer

[h=3]Pediatric Influenza Hospitalizations and Deaths[/h] In week 17, 12 laboratory-confirmed influenza-associated pediatric (≤16 years of age) hospitalizations were reported by the Immunization Monitoring Program Active (IMPACT) network. Influenza A accounted for 67% of the hospitalizations. Pediatric hospitalizations have been on a general decline since week 07. The number of weekly reported hospitalizations are below the seven-season average.
To date this season, 1,054 pediatric hospitalizations have been reported by the IMPACT network, 654 (62%) of which were associated with influenza A. Children 0-23 months accounted for the largest proportion of influenza A hospitalizations (39%). Among the 400 hospitalizations due to influenza B, children 5-9 years accounted for the largest proportion of cases (31%).
Additionally, 179 ICU admissions and nine deaths have been reported to date. Children aged 0-23 months accounted for the greatest proportion of ICU cases (30%), followed by children aged 5-9 years (26%). Among the ICU cases with available information, 63% were due to influenza A and approximately 47% had no reported previous or concurrent medical conditions. All but one reported deaths were among children over the age of two.
[h=3]Figure 7 - Cumulative numbers of pediatric hospitalizations (≤16 years of age) with influenza by type and age-group reported by the IMPACT network, Canada, weeks 2017-35 to 2018-17[/h]
fig7-eng.jpg

Figure 7 - Text description [h=3]Figure 8 - Number of pediatric hospitalizations (≤16 years of age) with influenza reported by the IMPACT network, by week, Canada, weeks 2017-35 to 2018-17[/h]
fig8-eng.jpg
The shaded area represents the maximum and minimum number of cases reported by week from seasons 2010-11 to 2016-17

Figure 8 - Text description [h=2]Influenza Strain Characterizations[/h] During the 2017-18 influenza season, the National Microbiology Laboratory (NML) has characterized 3,358 influenza viruses [1,426 A(H3N2), 252 A(H1N1)pdm09 and 1,680 B viruses] that were received from Canadian laboratories.
[h=3]Antigenic Characterization[/h] Among influenza viruses characterized by hemagglutination inhibition (HI) assay during the 2017-18 season, most viruses were antigenically similar to the cell-culture propagated reference strains recommended by WHO.
[TABLE="class: table table-striped table-bordered table-hover table-condensed, width: 1140"]
Table 3 - Influenza antigenic strain characterizations, Canada, weeks 2017-35 to 2018-17 [TR="class: bg-primary, bgcolor: #2572B4"]
Strain Characterization Results Count Description [/TR]
[TR="bgcolor: #F5F5F5"]
Influenza A (H3N2) [/TR]
[TR]
[TD]A/Hong Kong/4801/2014-like[/TD]
[TD]291[/TD]
[TD]Viruses antigenically similar to A/Hong Kong/4801/2014, the A(H3N2) component of the 2017-18 Northern Hemisphere's trivalent and quadrivalent vaccine.[/TD]
[/TR]
[TR="bgcolor: #F5F5F5"]
[TD]Reduced titer to A/Hong Kong/4801/2014[/TD]
[TD]84[/TD]
[TD]These A(H3N2) viruses reacted poorly with antisera raised against cell-propagated A/Hong Kong/4801/2014, suggesting some antigenic differences.[/TD]
[/TR]
[TR]
Influenza A (H1N1)pdm09 [/TR]
[TR="bgcolor: #F5F5F5"]
[TD]A/Michigan/45/2015-like[/TD]
[TD]252[/TD]
[TD]Viruses antigenically similar to A/Michigan/45/2015, the A(H1N1)pdm09 component of the 2017-18 Northern Hemisphere's trivalent and quadrivalent influenza vaccine.[/TD]
[/TR]
[TR]
Influenza B [/TR]
[TR="bgcolor: #F5F5F5"]
[TD]B/Brisbane/60/2008-like
(Victoria lineage)[/TD]
[TD]20[/TD]
[TD]Viruses antigenically similar to B/Brisbane/60/2008. B/Brisbane/60/2008 is the influenza B component of the 2017-18 Northern Hemisphere?s trivalent and quadrivalent influenza vaccine.[/TD]
[/TR]
[TR]
[TD]Reduced titer to B/Brisbane/60/2008
(Victoria lineage)[/TD]
[TD]51[/TD]
[TD]These B/Victoria lineage viruses reacted poorly with antisera raised against cell-propagated B/Brisbane/60/2008, suggesting some antigenic differences.[/TD]
[/TR]
[TR="bgcolor: #F5F5F5"]
[TD]B/Phuket/3073/2013-like
(Yamagata lineage)[/TD]
[TD]1609[/TD]
[TD]Viruses antigenically similar to B/Phuket/3073/2013, the additional influenza B component of the 2017-18 Northern Hemisphere quadrivalent influenza vaccine.[/TD]
[/TR]
[/TABLE]
[h=3]Genetic Characterization of A(H3N2) viruses[/h] During the 2017-18 season, 1,051 A(H3N2) viruses did not grow to sufficient titers for antigenic characterization by HI assay. Therefore, genetic characterization was performed to determine to which genetic group they belong. Sequence analysis showed that 942 A(H3N2) viruses belonged to genetic group 3C.2a, 107 viruses belonged to subclade 3C.2a1 and two viruses belonged to the clade 3C.3a.
Additionally, of the 291 influenza A(H3N2) viruses that were characterized antigenically as similar to A/Hong Kong/4801/2014, 265 belonged to genetic group 3C.2a and 26 viruses belonged to subclade 3C.2a1. The 84 viruses that showed reduced titer to A/Hong Kong/4801/2014 belonged to genetic clade 3C.3a.
A/Hong Kong/4801/2014-like virus belongs to genetic group 3C.2a and is the influenza A/H3N2 component of the 2017-18 Northern Hemisphere influenza vaccine.
[h=3]Genetic Characterization of Influenza B viruses[/h] Among the viruses characterized antigenically as having reduced titer to ferret antisera produced against cell-propagated B/Brisbane/60/2008, sequence analysis showed that 49 viruses had a two amino acid deletion in the HA gene. Sequencing is pending for the remaining two virus isolates.
...

https://www.canada.ca/en/public-hea...uwatch/2017-2018/week17-april-22-28-2018.html

 
[h=1]FluWatch report: April 29, 2018 to May 5, 2018 (Week 18)[/h] [h=5]Overall Summary[/h]
  • Overall, influenza activity in Canada continued to decrease, but parts of Central and Eastern Canada are still reporting localized activity.
  • Many indicators of influenza activity are either near or below average for this time of year.
  • Detections of influenza A were greater than those of influenza B.
  • To date this season, the majority of laboratory-confirmed cases, hospitalizations and deaths with influenza have been among adults 65 years of age and older.
  • For more information on the flu, see our Flu(influenza) web page.
[h=2]On this page[/h]

pub_week18-eng.jpg

Download the alternative format
(PDF format, 1.7 MB, 11 pages)
Organization:
Public Health Agency of Canada
Date published: 2018-05-11

[h=2]Related Topics[/h]


[h=2]Influenza/Influenza-like Illness Activity (geographic spread)[/h] In week 18, 13 regions (MB(1), ON(6), QC(2), NB(1), NL(2) and PE(1)) reported localized activity. Eight regions (MB(2), NB(2), NS(1), YK(1) and NU(2)) reported no influenza activity.
Figure 1 - Map of overall influenza/ILI activity level by province and territory, Canada, week 2018-18
fig1-eng.jpg
Note: Influenza/ILI activity levels, as represented on this map, are assigned and reported by Provincial and Territorial Ministries of Health, based on laboratory confirmations, sentinel ILI rates and reported outbreaks. Please refer to detailed definitions at the end of the report. Maps from previous weeks, including any retrospective updates, are available in the mapping feature found in the Weekly Influenza Reports.

Figure 1 - Text description [h=2]Laboratory-Confirmed Influenza Detections[/h] In week 18, the percentage of tests positive for influenza was 8%, a decrease from the previous week. Laboratory detections of influenza are steadily decreasing. In week 18, 367 positive influenza tests were reported, down from 526 tests reported in week 17. Influenza A accounted for 66% of influenza detections in week 18.
Overall, laboratory detections of influenza are below average for this time of year. For data on other respiratory virus detections, see the Respiratory Virus Detections in Canada Report. [h=3]Figure 2 - Number of positive influenza tests and percentage of tests positive, by type, subtype and report week, Canada, weeks 2017-35 to 2018-18[/h]
fig2-eng.jpg
The shaded area indicates weeks where the positivity rate was at least 5% and a minimum of 15 positive tests were observed, signalling the period of seasonal influenza activity.

Figure 2 - Text description To date this season, 63,853 laboratory-confirmed influenza detections have been reported, of which 56% have been influenza A. Influenza A(H3N2) has been the most common subtype detected this season, representing 90% of subtyped influenza A detections. For more detailed weekly and cumulative influenza data, see the text descriptions for Figures 2 and 3 or the Respiratory Virus Detections in Canada Report.
Figure 3 - Cumulative numbers of positive influenza specimens by type/subtype and province/territory, Canada, weeks 2017-35 to 2018-18
fig3-eng.jpg

Figure 3 - Text description To date this season, detailed information on age and type/subtype has been received for 51,313 laboratory-confirmed influenza cases (Table 1). Adults 65 years of age and older represent the largest proportion of cases overall (50%), and among cases of influenza A(H3N2) (59%) and influenza B (48%). Adults aged 20-64 represent 32% of cases overall and 29% of influenza A(H3N2) and 34% of influenza B cases. Although much smaller in numbers (933), the majority of influenza A(H1N1)pdm09 cases are among adults less than 65 years of age, with adults aged 20-64 and children 0-19 years accounting for 53% and 31% of cases respectively.
[TABLE="class: table table-striped table-bordered table-hover table-condensed, width: 1140"]
Table 1 - Cumulative numbers of positive influenza specimens by type, subtype and age-group reported through case-based laboratory reporting, Canada, weeks 2017-35 to 2018-18 [TR="class: bg-primary, bgcolor: #2572B4"]
Age groups (years) Cumulative (August 27, 2017 to May 5, 2018) [/TR]
[TR="class: bg-primary, bgcolor: #2572B4"]
Influenza A B Influenza A and B [/TR]
[TR="class: bg-primary, bgcolor: #2572B4"]
A Total A(H1N1) pdm09 A(H3N2) A (UnS)table 1 note1 Total # % [/TR]
[TR="bgcolor: #F5F5F5"]
[TD]0-4[/TD]
[TD="class: text-right"]3139[/TD]
[TD="class: text-right"]157[/TD]
[TD="class: text-right"]557[/TD]
[TD="class: text-right"]2425[/TD]
[TD="class: text-right"]1477[/TD]
[TD="class: text-right"]4616[/TD]
[TD="class: text-right"]9%[/TD]
[/TR]
[TR]
[TD]5-19[/TD]
[TD="class: text-right"]2298[/TD]
[TD="class: text-right"]129[/TD]
[TD="class: text-right"]539[/TD]
[TD="class: text-right"]1630[/TD]
[TD="class: text-right"]2548[/TD]
[TD="class: text-right"]4846[/TD]
[TD="class: text-right"]9%[/TD]
[/TR]
[TR="bgcolor: #F5F5F5"]
[TD]20-44[/TD]
[TD="class: text-right"]4226[/TD]
[TD="class: text-right"]256[/TD]
[TD="class: text-right"]1191[/TD]
[TD="class: text-right"]2779[/TD]
[TD="class: text-right"]2760[/TD]
[TD="class: text-right"]6986[/TD]
[TD="class: text-right"]14%[/TD]
[/TR]
[TR]
[TD]45-64[/TD]
[TD="class: text-right"]4654[/TD]
[TD="class: text-right"]236[/TD]
[TD="class: text-right"]1442[/TD]
[TD="class: text-right"]2976[/TD]
[TD="class: text-right"]4677[/TD]
[TD="class: text-right"]9331[/TD]
[TD="class: text-right"]18%[/TD]
[/TR]
[TR="bgcolor: #F5F5F5"]
[TD]65+[/TD]
[TD="class: text-right"]14975[/TD]
[TD="class: text-right"]155[/TD]
[TD="class: text-right"]5461[/TD]
[TD="class: text-right"]9359[/TD]
[TD="class: text-right"]10559[/TD]
[TD="class: text-right"]25534[/TD]
[TD="class: text-right"]50%[/TD]
[/TR]
[TR]
[TD]Total[/TD]
[TD="class: text-right"]29292[/TD]
[TD="class: text-right"]933[/TD]
[TD="class: text-right"]9190[/TD]
[TD="class: text-right"]19169[/TD]
[TD="class: text-right"]22021[/TD]
[TD="class: text-right"]51313[/TD]
[TD="class: text-right"]100%[/TD]
[/TR]
[TR]
[TD="colspan: 8"] [h=5]Table 1 Notes[/h] Table 1 Note 1 UnS: unsubtyped: The specimen was typed as influenza A, but no result for subtyping was available
Return to table 1 note1referrer

[/TD]
[/TR]
[/TABLE]
[h=2]Syndromic/Influenza-like Illness Surveillance[/h] [h=3]Healthcare Practitioners Sentinel Syndromic Surveillance[/h] In week 18, 1.5% of visits to healthcare professionals were due to influenza-like illness (ILI).
[h=3]Figure 4 - Percentage of visits for ILI reported by sentinels by report week, Canada, weeks 2017-35 to 2018-18[/h] Number of participants in week 18: 166
fig4-eng.jpg
The shaded area represents the maximum and minimum percentage of visits for ILI reported by week from seasons 2012-13 to 2016-17

Figure 4 - Text description [h=3]Participatory Syndromic Surveillance[/h] FluWatchers is a participatory ILI surveillance system that relies on weekly voluntary submissions of syndromic information from Canadians across Canada.
In week 18, 1,270 participants reported to FluWatchers, of which 1% reported symptoms of cough and fever, and 0% of these consulted a healthcare professional. Among participants who reported cough and fever, 75% reported days missed from work or school, resulting in a combined total of 36 missed days of work or school. FluWatchers surveillance has ended for the 2017-18 season.
[TABLE="class: table table-striped table-bordered table-hover table-condensed, width: 1140"]
Table 2 - Summary of influenza-like illness symptoms reported by participating Canadians, Canada, week 2018-18 [TR="class: bg-primary, bgcolor: #2572B4"]
Number of Participants Reporting Percentage participants reporting Cough and Fever Percentage of participants with cough and fever who consulted a healthcare professional Percentage of participants with cough and fever who reported missed days from work or school Number of missed days from work or school [/TR]
[TR="class: text-center, bgcolor: #F5F5F5"]
[TD]1270[/TD]
[TD]1%[/TD]
[TD]0%[/TD]
[TD]75%[/TD]
[TD]36[/TD]
[/TR]
[/TABLE]
[h=2]Influenza Outbreak Surveillance[/h] In week 18, 11 laboratory-confirmed outbreaks of influenza were reported. Among the reported influenza outbreaks, four were reported in long-term care facilities (LTC), three in hospitals and four in other settings. Among the ten outbreaks with influenza type/subtype reported, seven (70%) were associated with influenza A, two (20%) were associated with influenza B and one outbreak was associated with a mix or influenza A and B (10%).
To date this season, 1,789 influenza/ILI outbreaks have been reported, of which 1,102 (62%) occurred in LTC facilities. Among the 1,530 outbreaks for which the influenza type/subtype was reported, 843 (55%) were associated with influenza A and 617 (40%) were associated with influenza B, and 70 (5%) were associated with a mix of A and B.
[h=3]Figure 5 - Number of new outbreaks of laboratory-confirmed influenza by report week, Canada, weeks 2017-35 to 2018-18[/h]
fig5-eng.jpg

Figure 5 - Text description [h=2]Severe Outcomes Influenza Surveillance[/h] [h=3]Provincial/Territorial Influenza Hospitalizations and Deaths[/h] To date this season, 5,059 influenza-associated hospitalizations were reported by participating provinces and territoriesFootnote1. Among the hospitalizations, 3,373 (67%) were associated with influenza A, and 3,308 cases (65%) were in adults 65 years of age or older.
Additionally, 508 ICU admissions and 290 deaths have been reported to date. Adults aged 65 years of age or older accounted for the greatest proportion of ICU cases (44%), followed by adults aged 20-64 (40%). Adults aged 65 years of age or older accounted the majority of deaths (86%).
[h=3]Figure 6 - Cumulative numbers of hospitalizations by age-group reported by participating provinces and territoriesfigure 6 note1, weeks 2017-35 to 2018-18[/h]
fig6-eng.jpg

Figure 6 - Text description Figure 6 note 1 Influenza-associated hospitalizations are reported by NL, PE, NS, NB, MB, AB, YT and NT. Only hospitalizations that require intensive medical care are reported by SK.
Return to figure 6 note1referrer

[h=3]Pediatric Influenza Hospitalizations and Deaths[/h] In week 18, 10 laboratory-confirmed influenza-associated pediatric (≤16 years of age) hospitalizations were reported by the Immunization Monitoring Program Active (IMPACT) network. Influenza A accounted for 80% of the hospitalizations. Pediatric hospitalizations have been on a general decline since week 07. The number of weekly reported hospitalizations are below the seven-season average.
To date this season, 1,066 pediatric hospitalizations have been reported by the IMPACT network, 663 (62%) of which were associated with influenza A. Children 0-23 months accounted for the largest proportion of influenza A hospitalizations (39%). Among the 403 hospitalizations due to influenza B, children 5-9 years accounted for the largest proportion of cases (31%).
Additionally, 183 ICU admissions and nine deaths have been reported to date. Children aged 0-23 months accounted for the greatest proportion of ICU cases (31%), followed by children aged 5-9 years (26%). Among the ICU cases with available information, 63% were due to influenza A and approximately 46% had no reported previous or concurrent medical conditions. All but one reported deaths were among children over the age of two.
[h=3]Figure 7 - Cumulative numbers of pediatric hospitalizations (≤16 years of age) with influenza by type and age-group reported by the IMPACT network, Canada, weeks 2017-35 to 2018-18[/h]
fig7-eng.jpg

Figure 7 - Text description [h=3]Figure 8 - Number of pediatric hospitalizations (≤16 years of age) with influenza reported by the IMPACT network, by week, Canada, weeks 2017-35 to 2018-18[/h]
fig8-eng.jpg
The shaded area represents the maximum and minimum number of cases reported by week from seasons 2010-11 to 2016-18

Figure 8 - Text description [h=2]Influenza Strain Characterizations[/h] During the 2017-18 influenza season, the National Microbiology Laboratory (NML) has characterized 3,571 influenza viruses [1,478 A(H3N2), 287 A(H1N1)pdm09 and 1,806 B viruses] that were received from Canadian laboratories.
[h=3]Antigenic Characterization[/h] Among influenza viruses characterized by hemagglutination inhibition (HI) assay during the 2017-18 season, most viruses were antigenically similar to the cell-culture propagated reference strains recommended by WHO.
[TABLE="class: table table-striped table-bordered table-hover table-condensed, width: 1140"]
Table 3 - Influenza antigenic strain characterizations, Canada, weeks 2017-35 to 2018-18 [TR="class: bg-primary, bgcolor: #2572B4"]
Strain Characterization Results Count Description [/TR]
[TR="bgcolor: #F5F5F5"]
Influenza A (H3N2) [/TR]
[TR]
[TD]A/Hong Kong/4801/2014-like[/TD]
[TD]296[/TD]
[TD]Viruses antigenically similar to A/Hong Kong/4801/2014, the A(H3N2) component of the 2017-18 Northern Hemisphere's trivalent and quadrivalent vaccine.[/TD]
[/TR]
[TR="bgcolor: #F5F5F5"]
[TD]Reduced titer to A/Hong Kong/4801/2014[/TD]
[TD]88[/TD]
[TD]These A(H3N2) viruses reacted poorly with antisera raised against cell-propagated A/Hong Kong/4801/2014, suggesting some antigenic differences.[/TD]
[/TR]
[TR]
Influenza A (H1N1)pdm09 [/TR]
[TR="bgcolor: #F5F5F5"]
[TD]A/Michigan/45/2015-like[/TD]
[TD]287[/TD]
[TD]Viruses antigenically similar to A/Michigan/45/2015, the A(H1N1)pdm09 component of the 2017-18 Northern Hemisphere's trivalent and quadrivalent influenza vaccine.[/TD]
[/TR]
[TR]
Influenza B [/TR]
[TR="bgcolor: #F5F5F5"]
[TD]B/Brisbane/60/2008-like
(Victoria lineage)[/TD]
[TD]24[/TD]
[TD]Viruses antigenically similar to B/Brisbane/60/2008. B/Brisbane/60/2008 is the influenza B component of the 2017-18 Northern Hemisphere?s trivalent and quadrivalent influenza vaccine.[/TD]
[/TR]
[TR]
[TD]Reduced titer to B/Brisbane/60/2008
(Victoria lineage)[/TD]
[TD]54[/TD]
[TD]These B/Victoria lineage viruses reacted poorly with antisera raised against cell-propagated B/Brisbane/60/2008, suggesting some antigenic differences.[/TD]
[/TR]
[TR="bgcolor: #F5F5F5"]
[TD]B/Phuket/3073/2013-like
(Yamagata lineage)[/TD]
[TD]1728[/TD]
[TD]Viruses antigenically similar to B/Phuket/3073/2013, the additional influenza B component of the 2017-18 Northern Hemisphere quadrivalent influenza vaccine.[/TD]
[/TR]
[/TABLE]
[h=3]Genetic Characterization of A(H3N2) viruses[/h] During the 2017-18 season, 1,094 A(H3N2) viruses did not grow to sufficient titers for antigenic characterization by HI assay. Therefore, genetic characterization was performed to determine to which genetic group they belong. Sequence analysis showed that 981 A(H3N2) viruses belonged to genetic group 3C.2a, 111 viruses belonged to subclade 3C.2a1 and two viruses belonged to the clade 3C.3a.
Additionally, of the 384 influenza A(H3N2) viruses that were antigenically characterized , 267 belonged to genetic group 3C.2a and 26 viruses belonged to subclade 3C.2a1. The 88 viruses that showed reduced titer to A/Hong Kong/4801/2014 belonged to genetic clade 3C.3a. Sequencing is pending for the remaining three virus isolates.
A/Hong Kong/4801/2014-like virus belongs to genetic group 3C.2a and is the influenza A/H3N2 component of the 2017-18 Northern Hemisphere influenza vaccine.
[h=3]Genetic Characterization of Influenza B viruses[/h] Of the 78 influenza B viruses characterized as B/ B/Brisbane/60/2008-like, 24 viruses were antigenically similar to the vaccine strain B/Brisbane/60/2008. Among the viruses characterized antigenically as having reduced titer to ferret antisera produced against cell-propagated B/Brisbane/60/2008, sequence analysis showed that 49 viruses had a two amino acid deletion in the HA gene. Sequencing is pending for the remaining five virus isolates.
...

https://www.canada.ca/en/public-hea...tch/2017-2018/week18-april-29-may-5-2018.html

 
Back
Top