• FluTrackers.com Inc. does not provide medical advice. Information on this web site is collected from various internet resources, and the FluTrackers board of directors makes no warranty to the safety, efficacy, correctness or completeness of the information posted on this site by any author or poster. The information collated here is for instructional and/or discussion purposes only and is NOT intended to diagnose or treat any disease, illness, or other medical condition. Every individual reader or poster should seek advice from their personal physician/healthcare practitioner before considering or using any interventions that are discussed on this website. By continuing to access this website you agree to consult your personal physican before using any interventions posted on this website, and you agree to hold harmless FluTrackers.com Inc., the board of directors, the members, and all authors and posters for any effects from use of any medication, supplement, vitamin or other substance, device, intervention, etc. mentioned in posts on this website, or other internet venues referenced in posts on this website.
  • We are not asking for any donations. Do not donate to any entity who says they are raising funds for us.

Canada FluWatch Weekly Reports 2015-2016 Season Weeks 21-24

Pathfinder

Editor, Senior Moderator
FluWatch report: October 11 to October 17, 2015 (week 41)

Overall Summary
  • Overall, there is low influenza activity in Canada.
  • Influenza activity and detections decreased from the previous week.
  • In week 41, no new influenza outbreaks were reported.
  • So far this season, influenza A(H3N2) has been the most common subtype affecting Canadians.
  • For more information on the flu, see our Flu (influenza) web page.
pubpdf41-eng.gif
Download the alternative format
(PDF format, 757 KB, 7 pages)
Organization: Public Health Agency of Canada
Date published: 2015-10-23

Related Topics


Are you a primary health care practitioner (General Practitioner, Nurse Practitioner or Registered Nurse) interested in becoming a FluWatch sentinel for the 2015-16 influenza season? Contact us at FluWatch@phac-aspc.gc.ca


On this page
Influenza/Influenza-like Illness Activity (geographic spread)

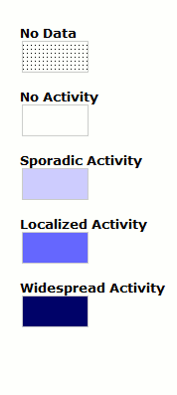
In week 41, sporadic influenza activity were reported in a few regions across Canada. One region in Ontario reported localized activity. Overall, the majority of regions in Canada have reported no influenza activity.
Figure 1. Map of overall influenza/ILI activity level by province and territory, Canada, Week 41

2015-w41-fg1-eng.gif

fg1-legend-eng.gif


Note: Influenza/ILI activity levels, as represented on this map, are assigned and reported by Provincial and Territorial Ministries of Health, based on laboratory confirmations, sentinel ILI rates and reported outbreaks. Please refer to detailed definitions at the end of the report. Maps from previous weeks, including any retrospective updates, are available on the Flu Activity website.
Figure 1 - Text Description Laboratory Confirmed Influenza Detections

The number of positive influenza tests decreased from the previous week. In week 41, the percent positive for influenza detections remained low at 1.4%; however, this is the highest recorded value compared the previous five seasons during the same period (Figure 2).
Figure 2. Number of positive influenza tests and percentage of tests positive, by type, subtype and report week, Canada, 2015-16

2015-w41-fg2-eng.gif
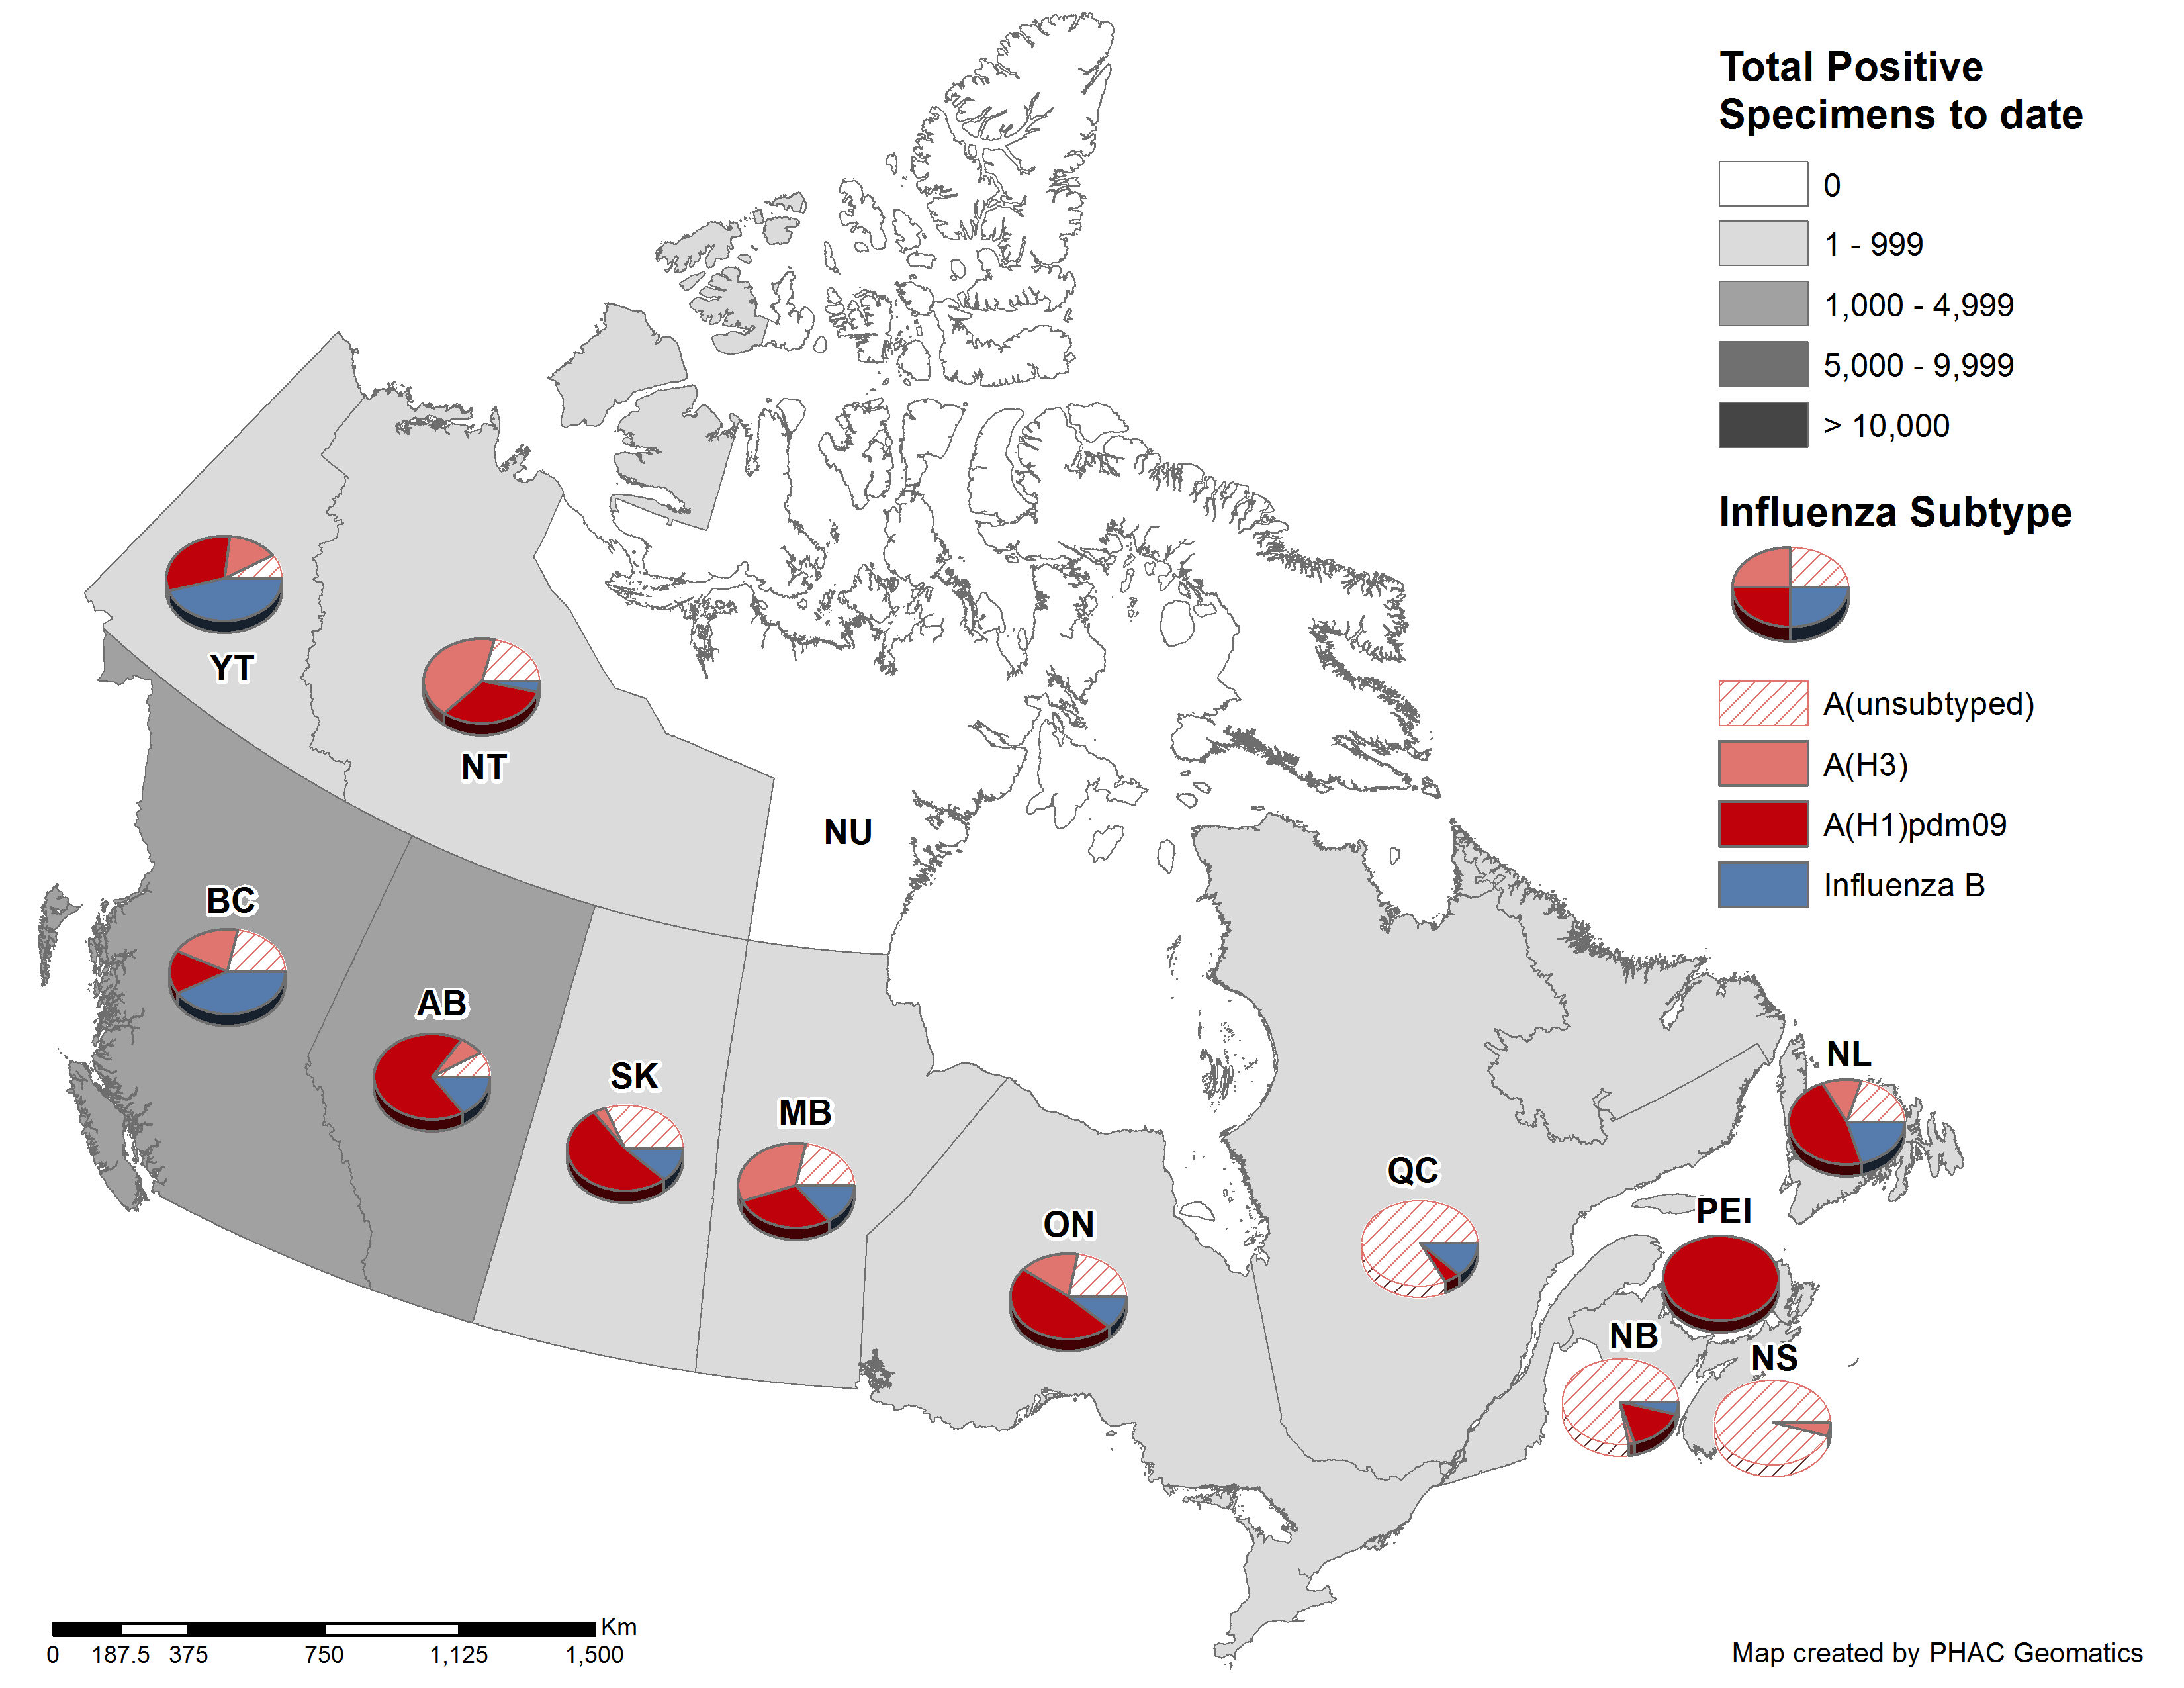
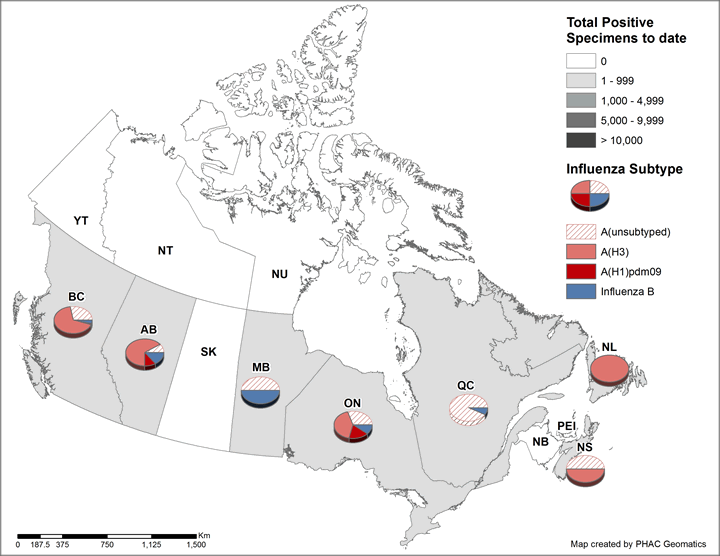
Figure 2 - Text Description In week 41, the majority of detections in Canada have been reported from BC, AB, and ON, accounting for 86% of the influenza detections in Canada. A total of six jurisdictions have yet to report any influenza cases. To date, 92% of influenza detections have been influenza A and the majority of those subtyped have been A(H3).
Figure 3. Cumulative numbers of positive influenza specimens by type/subtype and province, Canada, 2015-16
2015-w41-fg3-eng.gif
Note: Specimens from NT, YT, and NU are sent to reference laboratories in other provinces. Cumulative data includes updates to previous weeks.
Figure 3 - Text Description Among cases with reported age, the largest proportion was in those ≥65 years of age (48%) (Table 1). Compared to the previous year during the same period, a greater proportion of cases in the 20-44 and 45-64 age groups have been reported to date (39% this year vs 22% last year). [TABLE="class: table table-condensed table-striped table-hover table-bordered, width: 1140"]
[TR="class: bg-primary, bgcolor: #2572B4"]
[/TR]
[TR="class: bg-primary, bgcolor: #2572B4"]
[/TR]
[TR="class: bg-primary, bgcolor: #2572B4"]
[/TR]
[TR]
[TD="colspan: 13"]Table 1 - Footnote 1 Table 1 includes specimens for which demographic information was reported. These represent a subset of all positive influenza cases reported.
Return to Table 1 - Footnote1referrer
Table 1 - Footnote 2 Percentage of tests positive for sub-types of influenza A are a percentage of all influenza A detections.
Return to Table 1 - Footnote2referrer
Table 1 - Footnote UnS Unsubtyped: The specimen was typed as influenza A, but no result for subtyping was available.
Return to Table 1 - FootnoteUnSreferrer[/TD]
[/TR]
[TR="bgcolor: #F5F5F5"]
[TD="class: text-right"]1[/TD]
[TD="class: text-right"]0[/TD]
[TD="class: text-right"]1[/TD]
[TD="class: text-right"]0[/TD]
[TD="class: text-right"]0[/TD]
[TD="class: text-right"]7[/TD]
[TD="class: text-right"]1[/TD]
[TD="class: text-right"]6[/TD]
[TD="class: text-right"]0[/TD]
[TD="class: text-right"]1[/TD]
[TD="class: text-right"]8[/TD]
[TD="class: text-right"]4.4%[/TD]
[/TR]
[TR]
[TD="class: text-right"]0[/TD]
[TD="class: text-right"]0[/TD]
[TD="class: text-right"]0[/TD]
[TD="class: text-right"]0[/TD]
[TD="class: text-right"]0[/TD]
[TD="class: text-right"]9[/TD]
[TD="class: text-right"]1[/TD]
[TD="class: text-right"]5[/TD]
[TD="class: text-right"]3[/TD]
[TD="class: text-right"]4[/TD]
[TD="class: text-right"]13[/TD]
[TD="class: text-right"]7.1%[/TD]
[/TR]
[TR="bgcolor: #F5F5F5"]
[TD="class: text-right"]3[/TD]
[TD="class: text-right"]1[/TD]
[TD="class: text-right"]0[/TD]
[TD="class: text-right"]2[/TD]
[TD="class: text-right"]0[/TD]
[TD="class: text-right"]22[/TD]
[TD="class: text-right"]5[/TD]
[TD="class: text-right"]9[/TD]
[TD="class: text-right"]8[/TD]
[TD="class: text-right"]3[/TD]
[TD="class: text-right"]25[/TD]
[TD="class: text-right"]13.7%[/TD]
[/TR]
[TR]
[TD="class: text-right"]1[/TD]
[TD="class: text-right"]0[/TD]
[TD="class: text-right"]0[/TD]
[TD="class: text-right"]1[/TD]
[TD="class: text-right"]0[/TD]
[TD="class: text-right"]44[/TD]
[TD="class: text-right"]7[/TD]
[TD="class: text-right"]27[/TD]
[TD="class: text-right"]10[/TD]
[TD="class: text-right"]3[/TD]
[TD="class: text-right"]47[/TD]
[TD="class: text-right"]25.8%[/TD]
[/TR]
[TR="bgcolor: #F5F5F5"]
[TD="class: text-right"]11[/TD]
[TD="class: text-right"]0[/TD]
[TD="class: text-right"]6[/TD]
[TD="class: text-right"]5[/TD]
[TD="class: text-right"]2[/TD]
[TD="class: text-right"]84[/TD]
[TD="class: text-right"]2[/TD]
[TD="class: text-right"]59[/TD]
[TD="class: text-right"]23[/TD]
[TD="class: text-right"]4[/TD]
[TD="class: text-right"]88[/TD]
[TD="class: text-right"]48.4%[/TD]
[/TR]
[TR]
[TD="class: text-right"]0[/TD]
[TD="class: text-right"]0[/TD]
[TD="class: text-right"]0[/TD]
[TD="class: text-right"]0[/TD]
[TD="class: text-right"]0[/TD]
[TD="class: text-right"]1[/TD]
[TD="class: text-right"]0[/TD]
[TD="class: text-right"]1[/TD]
[TD="class: text-right"]0[/TD]
[TD="class: text-right"]0[/TD]
[TD="class: text-right"]1[/TD]
[TD="class: text-right"]0.5%[/TD]
[/TR]
[TR="bgcolor: #F5F5F5"]
[TD="class: text-right"]16[/TD]
[TD="class: text-right"]1[/TD]
[TD="class: text-right"]7[/TD]
[TD="class: text-right"]8[/TD]
[TD="class: text-right"]2[/TD]
[TD="class: text-right"]167[/TD]
[TD="class: text-right"]16[/TD]
[TD="class: text-right"]107[/TD]
[TD="class: text-right"]44[/TD]
[TD="class: text-right"]15[/TD]
[TD="class: text-right"]182[/TD]
[TD="class: text-right"]100.0%[/TD]
[/TR]
[TR]
[TD="class: text-right"]88.9%[/TD]
[TD="class: text-right"]6.3%[/TD]
[TD="class: text-right"]43.8%[/TD]
[TD="class: text-right"]50.0%[/TD]
[TD="class: text-right"]11.1%[/TD]
[TD="class: text-right"]91.8%[/TD]
[TD="class: text-right"]9.6%[/TD]
[TD="class: text-right"]64.1%[/TD]
[TD="class: text-right"]26.3%[/TD]
[TD="class: text-right"]8.2%[/TD]
[TD="class: text-right"] [/TD]
[TD="class: text-right"] [/TD]
[/TR]
[/TABLE]
For additional data on other respiratory virus detections see the Respiratory Virus Detections in Canada Report on the Public Health Agency of Canada website.
Influenza-like Illness Consultation Rate

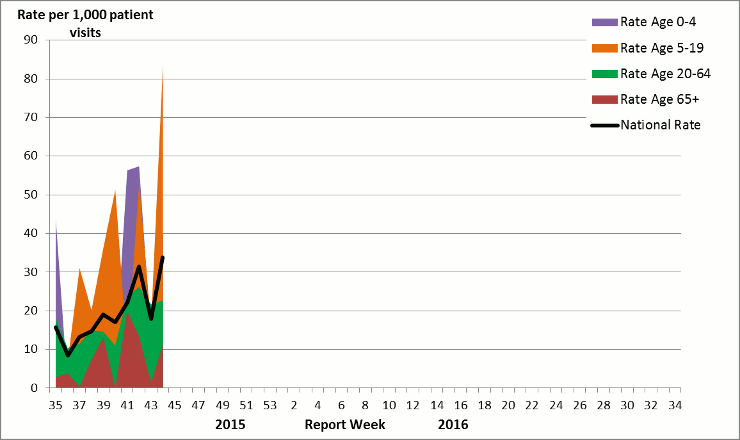
The national influenza-like-illness (ILI) consultation rate increased from 17.1 consultations per 1,000 patient visits in week 40 to 22.3 per 1,000 visits in week 41. In week 41, the highest ILI consultation rate was found in the 0-4 age group and the lowest was found in the 5-19 age group (Figure 4).
Figure 4. Influenza-like-illness (ILI) consultation rates by age group and week, Canada, 2015-16

2015-w41-fg4-eng.gif
Delays in the reporting of data may cause data to change retrospectively. In BC, AB, and SK, data is compiled by a provincial sentinel surveillance program for reporting to FluWatch. Not all sentinel physicians report every week.
Figure 4 - Text Description Influenza Outbreak Surveillance

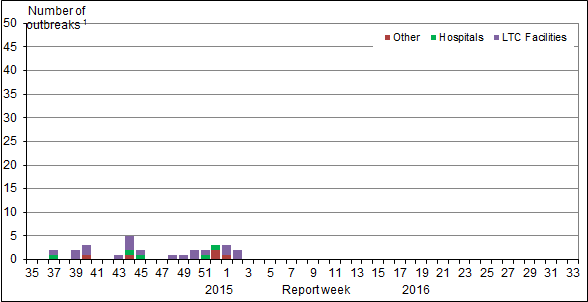
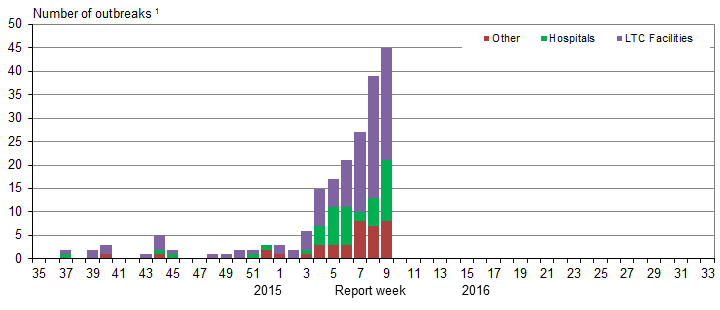
In week 41, no new outbreaks of influenza were reported (Figure 5).
Figure 5. Overall number of new laboratory-confirmed influenza outbreaksFigure 5 - Footnote1 by report week, Canada, 2015-2016

2015-w41-fg5-eng.gif
Figure 5 - Footnote 1 All provinces and territories except NU report influenza outbreaks in long-term care facilities. All provinces and territories with the exception of NU and QC report outbreaks in hospitals. Outbreaks of influenza or influenza-like-illness in other facilities are reported to FluWatch but reporting varies between jurisdictions. Outbreak definitions are included at the end of the report.
Return to Figure 5 - Footnote1referrer
Figure 5 - Text Description Sentinel Pediatric Hospital Influenza Surveillance

Paediatric Influenza Hospitalizations and Deaths (IMPACT)

To date, less than five laboratory-confirmed influenza-associated paediatric (≤16 years of age) hospitalizations have been reported by the Immunization Monitoring Program Active (IMPACT) network. All hospitalized cases were due to influenza A.
Figure 6. Percentage of hospitalizations, ICU admissions and deaths with influenza reported by age-group, Canada, 2015-16, Paediatric hospitalizations (≤16 years of age, IMPACT)

2015-w41-fg6-eng.gif
Figure 6 - Text Description Figure 7. Number of cases of influenza reported by sentinel hospital networks, by week, Canada, 2015-16 Paediatric hospitalizations (≤16 years of age, IMPACT)

2015-w41-fg7-eng.gif
Note: The number of hospitalizations reported through IMPACT represents a subset of all influenza-associated paediatric hospitalizations in Canada. Delays in the reporting of data may cause data to change retrospectively.
Figure 7 - Text Description Provincial/Territorial Influenza Hospitalizations and Deaths

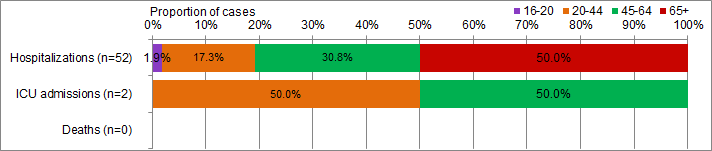
Since the start of the 2015-16 season, 30 laboratory-confirmed influenza-associated hospitalizations were reported from participating provinces and territoriesFootnote*. All but one hospitlaization was due to influenza A. The majority of were patients ≥65 years of age. Three ICU admissions have been reported.
Footnote * Note: Influenza-associated hospitalizations are not reported to PHAC by the following Provinces and Territory: BC, NU, and QC. Only hospitalizations that require intensive medical care are reported by Saskatchewan. ICU admissions are not distinguished among hospital admissions reported from Ontario. Data may also include cases reported by the IMPACT networks. The number of new influenza-associated hospitalizations and deaths reported for the current week may include cases from Ontario that occurred in previous weeks, as a result of retrospective updates to the cumulative total. It is important to note that the hospitalization or death does not have to be attributable to influenza, a positive laboratory test is sufficient for reporting.
Return to footnote*referrer
Figure 8. Percentage of hospitalizations, ICU admissions and deaths with influenza reported by age-group, Canada 2015-16

2015-w41-fg8-eng.gif
Figure 8 - Text Description See additional data on Reported Influenza Hospitalizations and Deaths in Canada: 2011-12 to 2015-16 on the Public Health Agency of Canada website.
Influenza Strain Characterizations

During the 2015-16 influenza season, the National Microbiology Laboratory (NML) has characterized eight influenza viruses [5 A(H3N2) and 3 influenza B].
Influenza A (H3N2): Sequence analysis of the H3N2 viruses showed that all five viruses belonged to a genetic group for which most viruses were antigenically related to A/Switzerland/9715293/2013, the A(H3N2) component of the Northern Hemisphere's vaccine.
Influenza B: The three influenza B viruses characterized were antigenically similar to the vaccine strain B/Phuket/3073/2013.
The recommended components for the 2015-2016 northern hemisphere trivalent influenza vaccine include: an A/California/7/2009(H1N1)pdm09-like virus, an /Switzerland/9715293/2013(H3N2)-like virus, and a B/Phuket/3073/2013 -like virus (Yamagata lineage). For quadrivalent vaccines, the addition of a B/Brisbane/60/2008-like virus is recommended.
The NML receives a proportion of the number of influenza positive specimens from provincial laboratories for strain characterization and antiviral resistance testing. Characterization data reflect the results of haemagglutination inhibition (HAI) testing compared to the reference influenza strains recommended by WHO.
Antiviral Resistance

During the 2015-16 season, the National Microbiology Laboratory (NML) as tested nine influenza viruses for resistance to oseltamivir and zanamivir. All viruses were sensitive to zanamivir and oseltamivir. All influenza A viruses tested were resistant to amantadine (Table 2). [TABLE="class: table table-condensed table-striped table-hover table-bordered, width: 1140"]
[TR="class: bg-primary, bgcolor: #2572B4"]
[/TR]
[TR="class: bg-primary, bgcolor: #2572B4"]
[/TR]
[TR]
[TD="colspan: 7"]Table 2 - Footnote * NA - not applicable

Return to Table 2 - Footnote*referrer[/TD]
[/TR]
[TR="bgcolor: #F5F5F5"]
[TD]6[/TD]
[TD]0[/TD]
[TD]6[/TD]
[TD]0[/TD]
[TD]7[/TD]
[TD]7 (100%)[/TD]
[/TR]
[TR]
[TD]0[/TD]
[TD]0[/TD]
[TD]0[/TD]
[TD]0[/TD]
[TD]0[/TD]
[TD]0[/TD]
[/TR]
[TR="bgcolor: #F5F5F5"]
[TD]3[/TD]
[TD]0[/TD]
[TD]3[/TD]
[TD]0[/TD]
[TD]NA Table 2 - Footnote*[/TD]
[TD]NA Table 2 - Footnote*[/TD]
[/TR]
[TR]
[TD]9[/TD]
[TD]0[/TD]
[TD]9[/TD]
[TD]0[/TD]
[TD]7[/TD]
[TD]7[/TD]
[/TR]
[/TABLE]
.../
http://www.healthycanadians.gc.ca/pu.../index-eng.php

Previous reports:
http://www.healthycanadians.gc.ca/d...orts-season-2015-2016-saison-rapports-eng.php
 
[h=1]FluWatch report: October 18 to October 24, 2015 (week 42)[/h] [h=2]Overall Summary[/h]
  • Overall, there is low influenza activity in Canada.
  • Influenza activity and detections decreased from the previous week.
  • No laboratory confirmed outbreaks have been reported in the last two weeks.
  • So far this season, influenza A(H3N2) has been the most common subtype affecting Canadians.
  • To date, the majority of influenza laboratory detections and hospitalizations have been in seniors greater than 65 years of age.
  • For more information on the flu, see our Flu (influenza) web page.

pubpdf42-eng.gif
Download the alternative format
(PDF format, 753 KB, 7 pages)
Organization: Public Health Agency of Canada
Date published: 2015-10-30

[h=2]Related Topics[/h]

Are you a primary health care practitioner (General Practitioner, Nurse Practitioner or Registered Nurse) interested in becoming a FluWatch sentinel for the 2015-16 influenza season? Contact us at FluWatch@phac-aspc.gc.ca


[h=2]On this page[/h]
[h=2]Influenza/Influenza-like Illness Activity (geographic spread)[/h] In week 42, sporadic influenza activity were reported in a few regions across Canada. One region in Ontario reported localized activity. The number of regions reporting influenza activity decreased from the previous week,from 12 regions reporting influenza activity in week 41 to 10 regions reporting influenza activity in week 42. Overall, the majority of regions in Canada reported no influenza activity.
[h=3]Figure 1. Map of overall influenza/ILI activity level by province and territory, Canada, Week 42[/h]
2015-w42-fg1-eng.gif

fg1-legend-eng.gif


Note: Influenza/ILI activity levels, as represented on this map, are assigned and reported by Provincial and Territorial Ministries of Health, based on laboratory confirmations, sentinel ILI rates and reported outbreaks. Please refer to detailed definitions at the end of the report. Maps from previous weeks, including any retrospective updates, are available on the Flu Activity website.
Figure 1 - Text Description [h=2]Laboratory Confirmed Influenza Detections[/h] In week 42, the percent positive for influenza detections remained low at 0.85%. The percent positive reported this week is lower than the percent positive reported the same week last season (1.96%). Since week 39, the percent positive for influenza detections have been decreasing (Figure 2).
[h=3]Figure 2. Number of positive influenza tests and percentage of tests positive, by type, subtype and report week, Canada, 2015-16[/h]
2015-w42-fg2-eng.gif
Figure 2 - Text Description In week 42, the majority of detections in Canada have been reported from BC and ON, accounting for 75% of the influenza detections in Canada. A total of six jurisdictions have not reported any influenza cases. To date, 92% of influenza detections have been influenza A and the majority of those subtyped have been A(H3).
[h=3]Figure 3. Cumulative numbers of positive influenza specimens by type/subtype and province, Canada, 2015-16[/h]
2015-w42-fg3-eng.gif
Note: Specimens from NT, YT, and NU are sent to reference laboratories in other provinces. Cumulative data includes updates to previous weeks.
Figure 3 - Text Description Among cases with reported age, the largest proportion was in those ≥65 years of age (48%) (Table 1). Compared to the previous year during the same period, a greater proportion of cases in the 20-44 and 45-64 age groups have been reported to date (40% this year vs 24% last year)
[TABLE="class: table table-condensed table-striped table-hover table-bordered, width: 1140"]
Table 1. Weekly and cumulative numbers of positive influenza specimens by type, subtype and age-group reported through case-based laboratory reportingTable 1 - Footnote1, Canada, 2015-16 [TR="class: bg-primary, bgcolor: #2572B4"]
Age groups (years) Weekly (October 18 to October 24, 2015) Cumulative (August 30, 2015 to October 24, 2015) [/TR]
[TR="class: bg-primary, bgcolor: #2572B4"]
Influenza A B Influenza A B Influenza A and B [/TR]
[TR="class: bg-primary, bgcolor: #2572B4"]
A Total A(H1) pdm09 A(H3) A Table 1 - FootnoteUnS Total A Total A(H1) pdm09 A(H3) A Table 1 - FootnoteUnS Total # % [/TR]
[TR]
[TD="colspan: 13"] Table 1 - Footnote 1 Table 1 includes specimens for which demographic information was reported. These represent a subset of all positive influenza cases reported.
Return to Table 1 - Footnote1referrer
Table 1 - Footnote 2 Percentage of tests positive for sub-types of influenza A are a percentage of all influenza A detections.
Return to Table 1 - Footnote2referrer
Table 1 - Footnote UnS Unsubtyped: The specimen was typed as influenza A, but no result for subtyping was available.
Return to Table 1 - FootnoteUnSreferrer
[/TD]
[/TR]
[TR="bgcolor: #F5F5F5"]
<5 [TD]0[/TD]
[TD]0[/TD]
[TD]0[/TD]
[TD]0[/TD]
[TD]0[/TD]
[TD]7[/TD]
[TD]1[/TD]
[TD]6[/TD]
[TD]0[/TD]
[TD]1[/TD]
[TD]8[/TD]
[TD]4.0%[/TD]
[/TR]
[TR]
5-19 [TD]1[/TD]
[TD]0[/TD]
[TD]0[/TD]
[TD]1[/TD]
[TD]0[/TD]
[TD]10[/TD]
[TD]1[/TD]
[TD]5[/TD]
[TD]4[/TD]
[TD]4[/TD]
[TD]14[/TD]
[TD]7.0%[/TD]
[/TR]
[TR="bgcolor: #F5F5F5"]
20-44 [TD]2[/TD]
[TD]0[/TD]
[TD]2[/TD]
[TD]0[/TD]
[TD]0[/TD]
[TD]25[/TD]
[TD]5[/TD]
[TD]12[/TD]
[TD]8[/TD]
[TD]3[/TD]
[TD]28[/TD]
[TD]14.0%[/TD]
[/TR]
[TR]
45-64 [TD]3[/TD]
[TD]0[/TD]
[TD]1[/TD]
[TD]2[/TD]
[TD]0[/TD]
[TD]48[/TD]
[TD]7[/TD]
[TD]29[/TD]
[TD]12[/TD]
[TD]3[/TD]
[TD]51[/TD]
[TD]25.5%[/TD]
[/TR]
[TR="bgcolor: #F5F5F5"]
65+ [TD]2[/TD]
[TD]0[/TD]
[TD]0[/TD]
[TD]2[/TD]
[TD]2[/TD]
[TD]92[/TD]
[TD]2[/TD]
[TD]71[/TD]
[TD]19[/TD]
[TD]6[/TD]
[TD]98[/TD]
[TD]49.0%[/TD]
[/TR]
[TR]
Unknown [TD]0[/TD]
[TD]0[/TD]
[TD]0[/TD]
[TD]0[/TD]
[TD]0[/TD]
[TD]1[/TD]
[TD]0[/TD]
[TD]1[/TD]
[TD]0[/TD]
[TD]0[/TD]
[TD]1[/TD]
[TD]0.5%[/TD]
[/TR]
[TR="bgcolor: #F5F5F5"]
Total [TD]8[/TD]
[TD]0[/TD]
[TD]3[/TD]
[TD]5[/TD]
[TD]2[/TD]
[TD]183[/TD]
[TD]16[/TD]
[TD]124[/TD]
[TD]43[/TD]
[TD]17[/TD]
[TD]200[/TD]
[TD]100.0%[/TD]
[/TR]
[TR]
PercentageTable 1 - Footnote2 [TD]80.0%[/TD]
[TD]0.0%[/TD]
[TD]37.5%[/TD]
[TD]62.5%[/TD]
[TD]20.0%[/TD]
[TD]91.5%[/TD]
[TD]8.7%[/TD]
[TD]67.8%[/TD]
[TD]23.5%[/TD]
[TD]8.5%[/TD]
[TD] [/TD]
[TD] [/TD]
[/TR]
[/TABLE]
For additional data on other respiratory virus detections see the Respiratory Virus Detections in Canada Report on the Public Health Agency of Canada website.
[h=2]Influenza-like Illness Consultation Rate[/h] The national influenza-like-illness (ILI) consultation rate increased from 22.3 consultations per 1,000 patient visits in week 41 to 31.4 per 1,000 visits in week 42. In week 42, the highest ILI consultation rate was found in the 0-4 age group and the lowest was found in the ≥65 years of age group (Figure 4).
[h=3]Figure 4. Influenza-like-illness (ILI) consultation rates by age group and week, Canada, 2015-16[/h]
2015-w42-fg4-eng.gif
Delays in the reporting of data may cause data to change retrospectively. In BC, AB, and SK, data is compiled by a provincial sentinel surveillance program for reporting to FluWatch. Not all sentinel physicians report every week.
Figure 4 - Text Description [h=2]Influenza Outbreak Surveillance[/h] In week 42, no new laboratory-confirmed outbreaks of influenza were reported (Figure 5). There was one outbreak of ILI reported in a school. To date this season, seven outbreaks have been reported, which is lower than the number of outbreaks reported last year at this time (n=11).
[h=3]Figure 5. Overall number of new laboratory-confirmed influenza outbreaksFigure 5 - Footnote1 by report week, Canada, 2015-2016[/h]
2015-w42-fg5-eng.gif
Figure 5 - Footnote 1 All provinces and territories except NU report influenza outbreaks in long-term care facilities. All provinces and territories with the exception of NU and QC report outbreaks in hospitals. Outbreaks of influenza or influenza-like-illness in other facilities are reported to FluWatch but reporting varies between jurisdictions. Outbreak definitions are included at the end of the report.
Return to Figure 5 - Footnote1referrer
Figure 5 - Text Description [h=2]Sentinel Pediatric Hospital Influenza Surveillance[/h] [h=3]Paediatric Influenza Hospitalizations and Deaths (IMPACT)[/h] To date this season, less than five laboratory-confirmed influenza-associated paediatric (≤16 years of age) hospitalizations have been reported by the Immunization Monitoring Program Active (IMPACT) network. All hospitalized cases were due to influenza A. To date, less than five ICU admissions have been reported.
[h=4]Figure 6. Percentage of hospitalizations, ICU admissions and deaths with influenza reported by age-group, Canada, 2015-16, Paediatric hospitalizations (≤16 years of age, IMPACT)[/h]
2015-w42-fg6-eng.gif
Figure 6 - Text Description [h=4]Figure 7. Number of cases of influenza reported by sentinel hospital networks, by week, Canada, 2015-16 Paediatric hospitalizations (≤16 years of age, IMPACT)[/h]
2015-w42-fg7-eng.gif
Note: The number of hospitalizations reported through IMPACT represents a subset of all influenza-associated paediatric hospitalizations in Canada. Delays in the reporting of data may cause data to change retrospectively.
Figure 7 - Text Description [h=2]Provincial/Territorial Influenza Hospitalizations and Deaths[/h] Since the start of the 2015-16 season, 37 laboratory-confirmed influenza-associated hospitalizations were reported from participating provinces and territoriesFootnote*. All but three hospitlaizations were due to influenza A. The majority (60%) of patients were ≥65 years of age. Four ICU admissions have been reported.
Footnote * Note: Influenza-associated hospitalizations are not reported to PHAC by the following Provinces and Territory: BC, NU, and QC. Only hospitalizations that require intensive medical care are reported by Saskatchewan. ICU admissions are not distinguished among hospital admissions reported from Ontario. Data may also include cases reported by the IMPACT networks. The number of new influenza-associated hospitalizations and deaths reported for the current week may include cases from Ontario that occurred in previous weeks, as a result of retrospective updates to the cumulative total. It is important to note that the hospitalization or death does not have to be attributable to influenza, a positive laboratory test is sufficient for reporting.
Return to footnote*referrer
[h=3]Figure 8. Percentage of hospitalizations, ICU admissions and deaths with influenza reported by age-group, Canada 2015-16[/h]
2015-w42-fg8-eng.gif
Figure 8 - Text Description See additional data on Reported Influenza Hospitalizations and Deaths in Canada: 2011-12 to 2015-16 on the Public Health Agency of Canada website.
[h=2]Influenza Strain Characterizations[/h] During the 2015-16 influenza season, the National Microbiology Laboratory (NML) has characterized 12 influenza viruses [8 A(H3N2), 1 A(H1N1) and 3 influenza B].
Influenza A (H3N2): When tested by hemagglutination inhibition (HI), one H3N2 virus was antigenically characterized as A/Switzerland/9715293/2013-like using antiserum raised against cell-propagated A/Switzerland/9715293/2013.
Sequence analysis was done on seven H3N2 viruses. All seven viruses belonged to a genetic group for which most viruses were antigenically related to A/Switzerland/9715293/2013.
A/Switzerland/9715293/2013 is the A(H3N2) component of the Northern Hemisphere's vaccine.
Influenza A (H1N1): One H1N1 virus characterized was antigenically similar to A/California/7/2009, the A(H1N1) component of the 2015-16 influenza vaccine.
Influenza B: The three influenza B viruses characterized were antigenically similar to the vaccine strain B/Phuket/3073/2013.
The recommended components for the 2015-2016 northern hemisphere trivalent influenza vaccine include: an A/California/7/2009(H1N1)pdm09-like virus, an /Switzerland/9715293/2013(H3N2)-like virus, and a B/Phuket/3073/2013 -like virus (Yamagata lineage). For quadrivalent vaccines, the addition of a B/Brisbane/60/2008-like virus is recommended.
The NML receives a proportion of the number of influenza positive specimens from provincial laboratories for strain characterization and antiviral resistance testing. Characterization data reflect the results of haemagglutination inhibition (HAI) testing compared to the reference influenza strains recommended by WHO.
[h=2]Antiviral Resistance[/h] During the 2015-16 season, the National Microbiology Laboratory (NML) has tested 17 influenza viruses for resistance to oseltamivir and zanamivir. All viruses were sensitive to zanamivir and oseltamivir. All influenza A viruses tested were resistant to amantadine (Table 2).
[TABLE="class: table table-condensed table-striped table-hover table-bordered, width: 1140"]
Table 2. Antiviral resistance by influenza virus type and subtype, Canada, 2015-16 [TR="class: bg-primary, bgcolor: #2572B4"]
Virus type and subtype Oseltamivir Zanamivir Amantadine [/TR]
[TR="class: bg-primary, bgcolor: #2572B4"]
# tested # resistant (%) # tested # resistant (%) # tested # resistant (%) [/TR]
[TR]
[TD="colspan: 7"] Table 2 - Footnote * NA - not applicable
Return to Table 2 - Footnote*referrer
[/TD]
[/TR]
[TR="bgcolor: #F5F5F5"]
A (H3N2) [TD]13[/TD]
[TD]0[/TD]
[TD]13[/TD]
[TD]0[/TD]
[TD]12[/TD]
[TD]12 (100%)[/TD]
[/TR]
[TR]
A (H1N1) [TD]1[/TD]
[TD]0[/TD]
[TD]1[/TD]
[TD]0[/TD]
[TD]1[/TD]
[TD]1 (100%)[/TD]
[/TR]
[TR="bgcolor: #F5F5F5"]
B [TD]3[/TD]
[TD]0[/TD]
[TD]3[/TD]
[TD]0[/TD]
[TD]NA Table 2 - Footnote*[/TD]
[TD]NA Table 2 - Footnote*[/TD]
[/TR]
[TR]
TOTAL [TD]17[/TD]
[TD]0[/TD]
[TD]17[/TD]
[TD]0[/TD]
[TD]13[/TD]
[TD]13[/TD]
[/TR]
[/TABLE]

.../
http://www.healthycanadians.gc.ca/p...-2016-42-surveillance-influenza/index-eng.php
 
[h=1]FluWatch report: October 25 to October 31, 2015 (week 43)[/h] [h=2]Overall Summary[/h]
  • Overall, Canada continues to experience low influenza activity, which is normally seen at this time of year
  • One new laboratory confirmed outbreak was reported in week 43.
  • So far this season, influenza A(H3N2) has been the most common subtype affecting Canadians ? it is too early in the season to know if this is likely to continue.
  • To date, the majority of influenza laboratory detections and hospitalizations have been in seniors greater than 65 years of age.
  • For more information on the flu, see our Flu (influenza) web page.

pubpdf43-eng.gif
Download the alternative format
(PDF format, 837 KB, 7 pages)
Organization: Public Health Agency of Canada
Date published: 2015-11-06

[h=2]Related Topics[/h]

Are you a primary health care practitioner (General Practitioner, Nurse Practitioner or Registered Nurse) interested in becoming a FluWatch sentinel for the 2015-16 influenza season? Contact us at FluWatch@phac-aspc.gc.ca


[h=2]On this page[/h]
[h=2]Influenza/Influenza-like Illness Activity (geographic spread)[/h] In week 43, sporadic influenza activity was reported in a few regions across Canada (NS, QC, ON, AB and BC). One region in Ontario and two regions in BC reported localized activity. Overall, the majority of regions in Canada reported no influenza activity.
[h=3]Figure 1. Map of overall influenza/ILI activity level by province and territory, Canada, Week 43[/h]
fg1-legend-eng.gif


Note: Influenza/ILI activity levels, as represented on this map, are assigned and reported by Provincial and Territorial Ministries of Health, based on laboratory confirmations, sentinel ILI rates and reported outbreaks. Please refer to detailed definitions at the end of the report. Maps from previous weeks, including any retrospective updates, are available on the Flu Activity website.
Figure 1 - Text Description [h=2]Laboratory Confirmed Influenza Detections[/h] The percent positive for influenza detections increased from 0.88% in week 42 to 1.0% in week 43 (Figure 2).
[h=3]Figure 2. Number of positive influenza tests and percentage of tests positive, by type, subtype and report week, Canada, 2015-16[/h]
2015-w43-fg2-eng.gif
Figure 2 - Text Description There were 28 laboratory cases of influenza reported in week 43. The majority of influenza detections have been reported from BC and ON, accounting for 79% of the influenza detections in Canada. To date, 90% of influenza detections have been influenza A and the majority of those subtyped have been A(H3) (88%).
[h=3]Figure 3. Cumulative numbers of positive influenza specimens by type/subtype and province, Canada, 2015-16[/h]
2015-w43-fg3-eng.gif
Note: Specimens from NT, YT, and NU are sent to reference laboratories in other provinces. Cumulative data includes updates to previous weeks.
Figure 3 - Text Description Among influenza cases with reported age, the largest proportion was in those ≥65 years of age (50%) (Table 1).
[TABLE="class: table table-condensed table-striped table-hover table-bordered, width: 1140"]
Table 1. Weekly and cumulative numbers of positive influenza specimens by type, subtype and age-group reported through case-based laboratory reportingTable 1 - Footnote1, Canada, 2015-16 [TR="class: bg-primary, bgcolor: #2572B4"]
Age groups (years) Weekly (October 25 to October 31, 2015) Cumulative (August 30, 2015 to October 31, 2015) [/TR]
[TR="class: bg-primary, bgcolor: #2572B4"]
Influenza A B Influenza A B Influenza A and B [/TR]
[TR="class: bg-primary, bgcolor: #2572B4"]
A Total A(H1) pdm09 A(H3) A Table 1 - FootnoteUnS Total A Total A(H1) pdm09 A(H3) A Table 1 - FootnoteUnS Total # % [/TR]
[TR]
[TD="colspan: 13"] Table 1 - Footnote 1 Table 1 includes specimens for which demographic information was reported. These represent a subset of all positive influenza cases reported.
Return to Table 1 - Footnote1referrer
Table 1 - Footnote 2 Percentage of tests positive for sub-types of influenza A are a percentage of all influenza A detections.
Return to Table 1 - Footnote2referrer
Table 1 - Footnote UnS Unsubtyped: The specimen was typed as influenza A, but no result for subtyping was available.
Return to Table 1 - FootnoteUnSreferrer
[/TD]
[/TR]
[TR="bgcolor: #F5F5F5"]
<5 [TD]1[/TD]
[TD]0[/TD]
[TD]0[/TD]
[TD]1[/TD]
[TD]0[/TD]
[TD]8[/TD]
[TD]1[/TD]
[TD]6[/TD]
[TD]1[/TD]
[TD]1[/TD]
[TD]9[/TD]
[TD]4.1%[/TD]
[/TR]
[TR]
5-19 [TD]1[/TD]
[TD]0[/TD]
[TD]1[/TD]
[TD]0[/TD]
[TD]1[/TD]
[TD]11[/TD]
[TD]1[/TD]
[TD]7[/TD]
[TD]3[/TD]
[TD]5[/TD]
[TD]16[/TD]
[TD]7.3%[/TD]
[/TR]
[TR="bgcolor: #F5F5F5"]
20-44 [TD]1[/TD]
[TD]0[/TD]
[TD]0[/TD]
[TD]1[/TD]
[TD]0[/TD]
[TD]26[/TD]
[TD]5[/TD]
[TD]12[/TD]
[TD]9[/TD]
[TD]3[/TD]
[TD]29[/TD]
[TD]13.2%[/TD]
[/TR]
[TR]
45-64 [TD]4[/TD]
[TD]0[/TD]
[TD]0[/TD]
[TD]4[/TD]
[TD]0[/TD]
[TD]53[/TD]
[TD]7[/TD]
[TD]31[/TD]
[TD]15[/TD]
[TD]3[/TD]
[TD]56[/TD]
[TD]25.5%[/TD]
[/TR]
[TR="bgcolor: #F5F5F5"]
65+ [TD]7[/TD]
[TD]0[/TD]
[TD]0[/TD]
[TD]7[/TD]
[TD]2[/TD]
[TD]101[/TD]
[TD]2[/TD]
[TD]72[/TD]
[TD]27[/TD]
[TD]8[/TD]
[TD]109[/TD]
[TD]49.5%[/TD]
[/TR]
[TR]
Unknown [TD]0[/TD]
[TD]0[/TD]
[TD]0[/TD]
[TD]0[/TD]
[TD]0[/TD]
[TD]1[/TD]
[TD]0[/TD]
[TD]1[/TD]
[TD]0[/TD]
[TD]0[/TD]
[TD]1[/TD]
[TD]0.5%[/TD]
[/TR]
[TR="bgcolor: #F5F5F5"]
Total [TD]14[/TD]
[TD]0[/TD]
[TD]1[/TD]
[TD]13[/TD]
[TD]3[/TD]
[TD]200[/TD]
[TD]16[/TD]
[TD]129[/TD]
[TD]55[/TD]
[TD]20[/TD]
[TD]220[/TD]
[TD]100.0%[/TD]
[/TR]
[TR]
PercentageTable 1 - Footnote2 [TD]82.4%[/TD]
[TD]0.0%[/TD]
[TD]7.1%[/TD]
[TD]92.9%[/TD]
[TD]17.6%[/TD]
[TD]90.9%[/TD]
[TD]8.0%[/TD]
[TD]64.5%[/TD]
[TD]27.5%[/TD]
[TD]9.1%[/TD]
[TD] [/TD]
[TD] [/TD]
[/TR]
[/TABLE]
For additional data on other respiratory virus detections see the Respiratory Virus Detections in Canada Report on the Public Health Agency of Canada website.
[h=2]Influenza-like Illness Consultation Rate[/h] The national influenza-like-illness (ILI) consultation rate decreased from 31.4 consultations per 1,000 patient visits in week 42 to 17.5 per 1,000 visits in week 43. In week 43, the highest ILI consultation rate was found in the 20-64 age group and the lowest was found in the ≥65 years of age group (Figure 4).
[h=3]Figure 4. Influenza-like-illness (ILI) consultation rates by age group and week, Canada, 2015-16[/h]
2015-w43-fg4-eng.gif
Delays in the reporting of data may cause data to change retrospectively. In BC, AB, and SK, data is compiled by a provincial sentinel surveillance program for reporting to FluWatch. Not all sentinel physicians report every week.
Figure 4 - Text Description [h=2]Influenza Outbreak Surveillance[/h] In week 43, one new laboratory-confirmed outbreak of influenza was reported in a long-term care facility (LTCF) (Figure 5). An additional two outbreaks of ILI were reported in schools. To date this season, eight outbreaks have been reported (6 of which occurred in LTCFs). Last year at this time, 14 outbreaks were reported (13 of which occurred in LTCFs).
[h=3]Figure 5. Overall number of new laboratory-confirmed influenza outbreaksFigure 5 - Footnote1 by report week, Canada, 2015-2016[/h]
2015-w43-fg5-eng.gif
Figure 5 - Footnote 1 All provinces and territories except NU report influenza outbreaks in long-term care facilities. All provinces and territories with the exception of NU and QC report outbreaks in hospitals. Outbreaks of influenza or influenza-like-illness in other facilities are reported to FluWatch but reporting varies between jurisdictions. Outbreak definitions are included at the end of the report.
Return to Figure 5 - Footnote1referrer
Figure 5 - Text Description [h=2]Sentinel Pediatric Hospital Influenza Surveillance[/h] [h=3]Paediatric Influenza Hospitalizations and Deaths (IMPACT)[/h] To date this season, six laboratory-confirmed influenza-associated paediatric (≤16 years of age) hospitalizations have been reported by the Immunization Monitoring Program Active (IMPACT) network. Four hospitalized cases were due to influenza A and 2 cases were due to influenza B. To date, less than five ICU admissions have been reported.
[h=4]Figure 6. Percentage of hospitalizations, ICU admissions and deaths with influenza reported by age-group, Canada, 2015-16, Paediatric hospitalizations (≤16 years of age, IMPACT)[/h]
2015-w42-fg6-eng.gif
Figure 6 - Text Description [h=4]Figure 7. Number of cases of influenza reported by sentinel hospital networks, by week, Canada, 2015-16 Paediatric hospitalizations (≤16 years of age, IMPACT)[/h]
2015-w42-fg7-eng.gif
Note: The number of hospitalizations reported through IMPACT represents a subset of all influenza-associated paediatric hospitalizations in Canada. Delays in the reporting of data may cause data to change retrospectively.
Figure 7 - Text Description [h=2]Provincial/Territorial Influenza Hospitalizations and Deaths[/h] Since the start of the 2015-16 season, 39 laboratory-confirmed influenza-associated hospitalizations were reported from participating provinces and territoriesFootnote*. All but four hospitlaizations were due to influenza A. The majority (56%) of patients were ≥65 years of age. Four ICU admissions have been reported.
Footnote * Note: Influenza-associated hospitalizations are not reported to PHAC by the following Provinces and Territory: BC, NU, and QC. Only hospitalizations that require intensive medical care are reported by Saskatchewan. ICU admissions are not distinguished among hospital admissions reported from Ontario. Data may also include cases reported by the IMPACT networks. The number of new influenza-associated hospitalizations and deaths reported for the current week may include cases from Ontario that occurred in previous weeks, as a result of retrospective updates to the cumulative total. It is important to note that the hospitalization or death does not have to be attributable to influenza, a positive laboratory test is sufficient for reporting.
Return to footnote*referrer
[h=3]Figure 8. Percentage of hospitalizations, ICU admissions and deaths with influenza reported by age-group, Canada 2015-16[/h]
2015-w43-fg8-eng.gif
Figure 8 - Text Description See additional data on Reported Influenza Hospitalizations and Deaths in Canada: 2011-12 to 2015-16 on the Public Health Agency of Canada website.
[h=2]Influenza Strain Characterizations[/h] During the 2015-16 influenza season, the National Microbiology Laboratory (NML) has characterized 22 influenza viruses [15 A(H3N2), 1 A(H1N1) and 6 influenza B].
Influenza A (H3N2):When tested by hemagglutination inhibition (HI), one H3N2 virus was antigenically characterized as A/Switzerland/9715293/2013-like using antiserum raised against cell-propagated A/Switzerland/9715293/2013.
Sequence analysis was done on 14 H3N2 viruses. All 14 viruses belonged to a genetic group for which most viruses were antigenically related to A/Switzerland/9715293/2013.
A/Switzerland/9715293/2013 is the A(H3N2) component of the Northern Hemisphere's vaccine.
Influenza A (H1N1): One H1N1 virus characterized was antigenically similar to A/California/7/2009, the A(H1N1) component of the 2015-16 influenza vaccine.
Influenza B: The six influenza B viruses characterized were antigenically similar to the vaccine strain B/Phuket/3073/2013.
The recommended components for the 2015-2016 northern hemisphere trivalent influenza vaccine include: an A/California/7/2009(H1N1)pdm09-like virus, an /Switzerland/9715293/2013(H3N2)-like virus, and a B/Phuket/3073/2013 -like virus (Yamagata lineage). For quadrivalent vaccines, the addition of a B/Brisbane/60/2008-like virus is recommended.
The NML receives a proportion of the number of influenza positive specimens from provincial laboratories for strain characterization and antiviral resistance testing. Characterization data reflect the results of haemagglutination inhibition (HAI) testing compared to the reference influenza strains recommended by WHO.

.../

http://healthycanadians.gc.ca/publi...-2016-43-surveillance-influenza/index-eng.php
 
[h=1]FluWatch report: November 1 to November 7, 2015 (week 44)[/h] [h=2]Overall Summary[/h]
  • Overall, Canada continues to experience low influenza activity.
  • Two new laboratory confirmed outbreaks in the Atlantic region were reported in week 44.
  • So far this season, influenza A(H3N2) has been the most common subtype affecting Canadians.
  • To date, the majority of influenza laboratory detections and hospitalizations have been in seniors greater than 65 years of age.
  • For more information on the flu, see our Flu (influenza) web page.

pubpdf44-eng.gif
Download the alternative format
(PDF format, 774 KB, 7 pages)
Organization: Public Health Agency of Canada
Date published: 2015-11-13

[h=2]Related Topics[/h]

Are you a primary health care practitioner (General Practitioner, Nurse Practitioner or Registered Nurse) interested in becoming a FluWatch sentinel for the 2015-16 influenza season? Contact us at FluWatch@phac-aspc.gc.ca


[h=2]On this page[/h]
[h=2]Influenza/Influenza-like Illness Activity (geographic spread)[/h] In week 44, sporadic influenza activity was reported in a few regions across Canada (NS, ON, AB and BC). Overall, the majority of regions in Canada reported no influenza activity.
[h=3]Figure 1. Map of overall influenza/ILI activity level by province and territory, Canada, Week 44[/h]
fg1-legend-eng.gif


Note: Influenza/ILI activity levels, as represented on this map, are assigned and reported by Provincial and Territorial Ministries of Health, based on laboratory confirmations, sentinel ILI rates and reported outbreaks. Please refer to detailed definitions at the end of the report. Maps from previous weeks, including any retrospective updates, are available in the mapping feature found in the Weekly Influenza Reports.
Figure 1 - Text Description [h=2]Laboratory Confirmed Influenza Detections[/h] The percent positive for influenza detections increased from 0.88% in week 43 to 1.2% in week 44 (Figure 2).
[h=3]Figure 2. Number of positive influenza tests and percentage of tests positive, by type, subtype and report week, Canada, 2015-16[/h]
2015-w44-fg2-eng.gif
Figure 2 - Text Description In week 44, there were 40 laboratory detections of influenza reported (up from 28 detections reported in week 43). BC accounted for 53% (n=21) of the influenza detections in Canada in week 44. To date, 91% of influenza detections have been influenza A and the majority of those subtyped have been A(H3) (87%).
[h=3]Figure 3. Cumulative numbers of positive influenza specimens by type/subtype and province, Canada, 2015-16[/h]
2015-w44-fg3-eng.gif
Note: Specimens from NT, YT, and NU are sent to reference laboratories in other provinces. Cumulative data includes updates to previous weeks.
Figure 3 - Text Description Among influenza cases with reported age, the largest proportion was in those ≥65 years of age (49%) (Table 1).
[TABLE="class: table table-condensed table-striped table-hover table-bordered, width: 1140"]
Table 1. Weekly and cumulative numbers of positive influenza specimens by type, subtype and age-group reported through case-based laboratory reportingTable 1 - Footnote1, Canada, 2015-16 [TR="class: bg-primary, bgcolor: #2572B4"]
Age groups (years) Weekly (November 1 to November 7, 2015) Cumulative (August 30, 2015 to November 7, 2015) [/TR]
[TR="class: bg-primary, bgcolor: #2572B4"]
Influenza A B Influenza A B Influenza A and B [/TR]
[TR="class: bg-primary, bgcolor: #2572B4"]
A Total A(H1) pdm09 A(H3) A Table 1 - FootnoteUnS Total A Total A(H1) pdm09 A(H3) A Table 1 - FootnoteUnS Total # % [/TR]
[TR]
[TD="colspan: 13"] Table 1 - Footnote 1 Table 1 includes specimens for which demographic information was reported. These represent a subset of all positive influenza cases reported.
Return to Table 1 - Footnote1referrer
Table 1 - Footnote 2 Percentage of tests positive for sub-types of influenza A are a percentage of all influenza A detections.
Return to Table 1 - Footnote2referrer
Table 1 - Footnote UnS Unsubtyped: The specimen was typed as influenza A, but no result for subtyping was available.
Return to Table 1 - FootnoteUnSreferrer
[/TD]
[/TR]
[TR="bgcolor: #F5F5F5"]
<5 [TD]2[/TD]
[TD]0[/TD]
[TD]0[/TD]
[TD]2[/TD]
[TD]1[/TD]
[TD]10[/TD]
[TD]1[/TD]
[TD]7[/TD]
[TD]2[/TD]
[TD]2[/TD]
[TD]12[/TD]
[TD]4.9%[/TD]
[/TR]
[TR]
5-19 [TD]3[/TD]
[TD]0[/TD]
[TD]1[/TD]
[TD]2[/TD]
[TD]1[/TD]
[TD]14[/TD]
[TD]1[/TD]
[TD]8[/TD]
[TD]5[/TD]
[TD]6[/TD]
[TD]20[/TD]
[TD]8.1%[/TD]
[/TR]
[TR="bgcolor: #F5F5F5"]
20-44 [TD]1[/TD]
[TD]0[/TD]
[TD]0[/TD]
[TD]1[/TD]
[TD]0[/TD]
[TD]28[/TD]
[TD]5[/TD]
[TD]14[/TD]
[TD]9[/TD]
[TD]4[/TD]
[TD]32[/TD]
[TD]13.0%[/TD]
[/TR]
[TR]
45-64 [TD]4[/TD]
[TD]1[/TD]
[TD]1[/TD]
[TD]2[/TD]
[TD]1[/TD]
[TD]58[/TD]
[TD]9[/TD]
[TD]36[/TD]
[TD]13[/TD]
[TD]4[/TD]
[TD]62[/TD]
[TD]25.1%[/TD]
[/TR]
[TR="bgcolor: #F5F5F5"]
65+ [TD]9[/TD]
[TD]2[/TD]
[TD]5[/TD]
[TD]2[/TD]
[TD]0[/TD]
[TD]112[/TD]
[TD]5[/TD]
[TD]86[/TD]
[TD]21[/TD]
[TD]8[/TD]
[TD]120[/TD]
[TD]48.6%[/TD]
[/TR]
[TR]
Unknown [TD]0[/TD]
[TD]0[/TD]
[TD]0[/TD]
[TD]0[/TD]
[TD]0[/TD]
[TD]1[/TD]
[TD]0[/TD]
[TD]1[/TD]
[TD]0[/TD]
[TD]0[/TD]
[TD]1[/TD]
[TD]0.4%[/TD]
[/TR]
[TR="bgcolor: #F5F5F5"]
Total [TD]19[/TD]
[TD]3[/TD]
[TD]7[/TD]
[TD]9[/TD]
[TD]3[/TD]
[TD]223[/TD]
[TD]21[/TD]
[TD]152[/TD]
[TD]50[/TD]
[TD]24[/TD]
[TD]247[/TD]
[TD]100.0%[/TD]
[/TR]
[TR]
PercentageTable 1 - Footnote2 [TD]86.4%[/TD]
[TD]15.8%[/TD]
[TD]36.8%[/TD]
[TD]47.4%[/TD]
[TD]13.6%[/TD]
[TD]90.3%[/TD]
[TD]9.4%[/TD]
[TD]68.2%[/TD]
[TD]22.4%[/TD]
[TD]9.7%[/TD]
[TD] [/TD]
[TD] [/TD]
[/TR]
[/TABLE]
For additional data on other respiratory virus detections see the Respiratory Virus Detections in Canada Report on the Public Health Agency of Canada website.
[h=2]Influenza-like Illness Consultation Rate[/h] The national influenza-like-illness (ILI) consultation rate increased from 17.8 consultations per 1,000 patient visits in week 43 to 33.9 per 1,000 visits in week 44. In week 44, the highest ILI consultation rate was found in the 5-19 age group and the lowest was found in the ≥65 years of age group (Figure 4).
[h=3]Figure 4. Influenza-like-illness (ILI) consultation rates by age group and week, Canada, 2015-16[/h]
2015-w44-fg4-eng.gif
Delays in the reporting of data may cause data to change retrospectively. In BC, AB, and SK, data are compiled by a provincial sentinel surveillance program for reporting to FluWatch. Not all sentinel physicians report every week.
Figure 4 - Text Description [h=2]Influenza Outbreak Surveillance[/h] In week 44, two new laboratory-confirmed outbreaks of influenza were reported. One outbreak was reported in a long-term care facility (LTCF) and the other in an institutional or community setting (Figure 5). An additional two outbreaks of ILI were reported in schools. To date this season, ten outbreaks have been reported (seven of which occurred in LTCFs). Last year at this time, 15 outbreaks were reported (14 of which occurred in LTCFs).
[h=3]Figure 5. Overall number of new laboratory-confirmed influenza outbreaksFigure 5 - Footnote1 by report week, Canada, 2015-2016[/h]
2015-w44-fg5-eng.gif
Figure 5 - Footnote 1 All provinces and territories except NU report influenza outbreaks in long-term care facilities. All provinces and territories with the exception of NU and QC report outbreaks in hospitals. Outbreaks of influenza or influenza-like-illness in other facilities are reported to FluWatch but reporting varies between jurisdictions. Outbreak definitions are included at the end of the report.
Return to Figure 5 - Footnote1referrer
Figure 5 - Text Description [h=2]Sentinel Pediatric Hospital Influenza Surveillance[/h] [h=3]Paediatric Influenza Hospitalizations and Deaths[/h] To date this season, nine laboratory-confirmed influenza-associated paediatric (≤16 years of age) hospitalizations have been reported by the Immunization Monitoring Program Active (IMPACT) network. Six hospitalized cases were due to influenza A and three cases were due to influenza B. To date, less than five intensive care unit (ICU) admissions have been reported.
[h=4]Figure 6. Percentage of hospitalizations, ICU admissions and deaths with influenza reported by age-group, Canada, 2015-16, Paediatric hospitalizations (≤16 years of age, IMPACT)[/h]
2015-w44-fg6-eng.gif
Figure 6 - Text Description [h=4]Figure 7. Number of cases of influenza reported by sentinel hospital networks, by week, Canada, 2015-16 paediatric hospitalizations (≤16 years of age, IMPACT)[/h]
2015-w44-fg7-eng.gif
Note: The number of hospitalizations reported through IMPACT represents a subset of all influenza-associated paediatric hospitalizations in Canada. Delays in the reporting of data may cause data to change retrospectively.
Figure 7 - Text Description [h=2]Provincial/Territorial Influenza Hospitalizations and Deaths[/h] Since the start of the 2015-16 season, 47 laboratory-confirmed influenza-associated hospitalizations were reported from participating provinces and territoriesFootnote*; all but 6 with influenza A. Among cases for which the subtype of influenza A was reported, 76% (16/21) were A(H3). The majority (55%) of patients were ≥65 years of age. Five ICU admissions and two deaths have been reported. Both deaths reported were in adults.
Footnote * Note: Influenza-associated hospitalizations are not reported to PHAC by the following Provinces and Territory: BC, NU, and QC. Only hospitalizations that require intensive medical care are reported by Saskatchewan. ICU admissions are not distinguished among hospital admissions reported from Ontario. Data may also include cases reported by the IMPACT networks. The number of new influenza-associated hospitalizations and deaths reported for the current week may include cases from Ontario that occurred in previous weeks, as a result of retrospective updates to the cumulative total. It is important to note that the hospitalization or death does not have to be attributable to influenza, a positive laboratory test is sufficient for reporting.
Return to footnote*referrer
[h=3]Figure 8. Percentage of hospitalizations, ICU admissions and deaths with influenza reported by age-group, Canada 2015-16[/h]
2015-w44-fg8-eng.gif
Figure 8 - Text Description See additional data on Reported Influenza Hospitalizations and Deaths in Canada: 2011-12 to 2015-16 on the Public Health Agency of Canada website.
[h=2]Influenza Strain Characterizations[/h] During the 2015-16 influenza season, the National Microbiology Laboratory (NML) has characterized 30 influenza viruses [22 A(H3N2), 1 A(H1N1) and 7 influenza B].
Influenza A (H3N2): When tested by hemagglutination inhibition (HI) assays, one H3N2 virus was antigenically characterized as A/Switzerland/9715293/2013-like using antiserum raised against cell-propagated A/Switzerland/9715293/2013.
Sequence analysis was done on 21 H3N2 viruses. All 21 viruses belonged to a genetic group for which most viruses were antigenically related to A/Switzerland/9715293/2013.
A/Switzerland/9715293/2013 is the A(H3N2) component of the 2015-16 Northern Hemisphere's vaccine.
Influenza A (H1N1): One H1N1 virus characterized was antigenically similar to A/California/7/2009, the A(H1N1) component of the 2015-16 influenza vaccine.
Influenza B: Six influenza B viruses characterized were antigenically similar to the vaccine strain B/Phuket/3073/2013. One influenza B virus was characterized as B/Brisbane/60/2008-like, one of the influenza B components of the 2015-16 Northern Hemisphere quadrivalent influenza vaccine.
The recommended components for the 2015-2016 northern hemisphere trivalent influenza vaccine include: an A/California/7/2009(H1N1)pdm09-like virus, an /Switzerland/9715293/2013(H3N2)-like virus, and a B/Phuket/3073/2013 -like virus (Yamagata lineage). For quadrivalent vaccines, the addition of a B/Brisbane/60/2008-like virus (Victoria lineage) is recommended.
The NML receives a proportion of the number of influenza positive specimens from provincial laboratories for strain characterization and antiviral resistance testing. Characterization data reflect the results of haemagglutination inhibition testing compared to the reference influenza strains recommended by WHO.


.../
http://healthycanadians.gc.ca/publi...-2016-44-surveillance-influenza/index-eng.php
 
--------------------------------------------------------------------------------------------------------------------------------------------------------------------------------------------------------

FluWatch report: January 3, 2016 - January 9, 2016 (week 01)

Overall Summary
  • Overall, in week 01, seasonal influenza activity increased in Canada.
  • Laboratory detections of influenza increased but remain below expected levels for this time of the year.
  • In week 01, there was an increase in the number of laboratory detections and hospitalizations associated with influenza A(H1N1).
  • To date, the majority of influenza laboratory detections and hospitalizations have been in seniors greater than 65 years of age.
  • For more information on the flu, see our Flu(influenza) web page.
pubpdf01-eng.gif
Download the alternative format
(PDF format, 1.01 MB, 8 pages)
Organization: Public Health Agency of Canada
Date published: 2016-01-15

Related Topics


Are you a primary health care practitioner (General Practitioner, Nurse Practitioner or Registered Nurse) interested in becoming a FluWatch sentinel for the 2015-16 influenza season? Contact us at FluWatch@phac-aspc.gc.ca


On this page
Influenza/Influenza-like Illness Activity (geographic spread)

In week 01, 25 regions across Canada reported sporadic influenza/ILI activity. Localized activity was reported in four regions in Canada (two in ON, one each in AB and NL).
Figure 1. Map of overall influenza/ILI activity level by province and territory, Canada, Week 01


fg1-legend-eng.gif


Note: Influenza/ILI activity levels, as represented on this map, are assigned and reported by Provincial and Territorial Ministries of Health, based on laboratory confirmations, sentinel ILI rates and reported outbreaks. Please refer to detailed definitions at the end of the report. Maps from previous weeks, including any retrospective updates, are available in the mapping feature found in the Weekly Influenza Reports.
Figure 1 - Text Description Laboratory Confirmed Influenza Detections

Laboratory confirmed influenza detections continue to increase steadily. The percent positive for influenza increased from 4.3% in week 52 to 6.0% in week 01 (Figure 2). Compared to the previous five seasons, the percent positive (6.0%) reported in week 01 was below the five year average for that week and below expected levels (range 14.3%-33.2%).
Figure 2. Number of positive influenza tests and percentage of tests positive, by type, subtype and report week, Canada, 2015-16

2016-w01-fg2-eng.gif
Figure 2 - Text Description In week 01, there were 306 positive influenza tests reported. Similar to the previous two weeks, the majority of subtyped influenza A viruses detected in Canada were influenza A(H1N1). Influenza A(H1N1) was the most common influenza A subtype detected in AB, SK, ON, NB, and PE in week 01. To date, 83% of influenza detections have been influenza A and among those subtyped approximately half have been influenza A(H3N2) [52% (344/659)].
Figure 3. Cumulative numbers of positive influenza specimens by type/subtype and province, Canada, 2015-16

2016-w01-fg3-eng.gif
Note: Specimens from NT, YT, and NU are sent to reference laboratories in other provinces. Cumulative data includes updates to previous weeks.
Figure 3 - Text Description To date this season, detailed information on age and type/subtype has been received for 864 cases. Adults aged 65 years and older accounted for 35% of reported influenza cases (Table 1). Adults aged 65 years and older also represented 47% of reported A(H3N2) cases. Adults aged 20-44 years represented 27% of reported influenza A(H1N1) cases and 24% of reported influenza B cases. [TABLE="class: table table-condensed table-striped table-hover table-bordered, width: 1140"]
[TR="class: bg-primary, bgcolor: #2572B4"]
[/TR]
[TR="class: bg-primary, bgcolor: #2572B4"]
[/TR]
[TR="class: bg-primary, bgcolor: #2572B4"]
[/TR]
[TR]
[TD="colspan: 13"]Table 1 - Footnote 1 Table 1 includes specimens for which demographic information was reported. These represent a subset of all positive influenza cases reported.
Return to Table 1 - Footnote1referrer
Table 1 - Footnote 2 Percentage of tests positive for sub-types of influenza A are a percentage of all influenza A detections.
Return to Table 1 - Footnote2referrer
Table 1 - Footnote UnS Unsubtyped: The specimen was typed as influenza A, but no result for subtyping was available.
Return to Table 1 - FootnoteUnSreferrer[/TD]
[/TR]
[TR="bgcolor: #F5F5F5"]
[TD]11[/TD]
[TD]3[/TD]
[TD]0[/TD]
[TD]8[/TD]
[TD]5[/TD]
[TD]80[/TD]
[TD]29[/TD]
[TD]24[/TD]
[TD]27[/TD]
[TD]20[/TD]
[TD]100[/TD]
[TD]11.6%[/TD]
[/TR]
[TR]
[TD]12[/TD]
[TD]1[/TD]
[TD]3[/TD]
[TD]8[/TD]
[TD]5[/TD]
[TD]60[/TD]
[TD]10[/TD]
[TD]30[/TD]
[TD]20[/TD]
[TD]44[/TD]
[TD]104[/TD]
[TD]12.0%[/TD]
[/TR]
[TR="bgcolor: #F5F5F5"]
[TD]26[/TD]
[TD]2[/TD]
[TD]3[/TD]
[TD]21[/TD]
[TD]12[/TD]
[TD]118[/TD]
[TD]33[/TD]
[TD]44[/TD]
[TD]41[/TD]
[TD]45[/TD]
[TD]163[/TD]
[TD]18.9%[/TD]
[/TR]
[TR]
[TD]18[/TD]
[TD]0[/TD]
[TD]1[/TD]
[TD]17[/TD]
[TD]9[/TD]
[TD]155[/TD]
[TD]31[/TD]
[TD]70[/TD]
[TD]54[/TD]
[TD]38[/TD]
[TD]193[/TD]
[TD]22.3%[/TD]
[/TR]
[TR="bgcolor: #F5F5F5"]
[TD]23[/TD]
[TD]1[/TD]
[TD]3[/TD]
[TD]19[/TD]
[TD]6[/TD]
[TD]260[/TD]
[TD]16[/TD]
[TD]147[/TD]
[TD]97[/TD]
[TD]40[/TD]
[TD]300[/TD]
[TD]34.7%[/TD]
[/TR]
[TR]
[TD]1[/TD]
[TD]1[/TD]
[TD]0[/TD]
[TD]0[/TD]
[TD]0[/TD]
[TD]3[/TD]
[TD]2[/TD]
[TD]1[/TD]
[TD]0[/TD]
[TD]1[/TD]
[TD]4[/TD]
[TD]0.5%[/TD]
[/TR]
[TR="bgcolor: #F5F5F5"]
[TD]91[/TD]
[TD]8[/TD]
[TD]10[/TD]
[TD]73[/TD]
[TD]37[/TD]
[TD]676[/TD]
[TD]121[/TD]
[TD]316[/TD]
[TD]239[/TD]
[TD]188[/TD]
[TD]864[/TD]
[TD]100.0%[/TD]
[/TR]
[TR]
[TD]71.1%[/TD]
[TD]8.8%[/TD]
[TD]11.0%[/TD]
[TD]80.2%[/TD]
[TD]28.9%[/TD]
[TD]78.2%[/TD]
[TD]17.9%[/TD]
[TD]46.7%[/TD]
[TD]35.4%[/TD]
[TD]21.8%[/TD]
[TD] [/TD]
[TD] [/TD]
[/TR]
[/TABLE]
For additional data on other respiratory virus detections see the Respiratory Virus Detections in Canada Report on the Public Health Agency of Canada website.
Influenza-like Illness Consultation Rate

The national ILI consultation rate decreased from the previous week from 41.5 per 1,000 patient visits in week 52, to 28.4 per 1,000 patient visits in week 01. In week 01, the highest ILI consultation rate was found in those 0-4 years (62.5 per 1,000) of age and the lowest was found in the ≥65 years age group (Figure 4).
Figure 4. Influenza-like-illness (ILI) consultation rates by age group and week, Canada, 2015-16

2016-w01-fg4-eng.gif
Delays in the reporting of data may cause data to change retrospectively. In BC, AB, and SK, data are compiled by a provincial sentinel surveillance program for reporting to FluWatch. Not all sentinel physicians report every week.
Figure 4 - Text Description Influenza Outbreak Surveillance

In week 01, three new laboratory confirmed influenza outbreaks were reported. Two outbreaks were reported in long-term care facilities (LTCF) and one was due to influenza A. The other outbreak was reported in a institutional or community setting. To date this season, 36 outbreaks have been reported (17 of which occurred in LTCFs). In comparison, at week 01 in the 2014-15 season, 601 outbreaks were reported (471 of which occurred in LTCFs) and in the 2013-14 season, 34 outbreaks were reported (28 of which occurred in LTCFs).
Figure 5. Overall number of new laboratory-confirmed influenza outbreaksFigure 5 - Footnote1 by report week, Canada, 2015-2016

2016-w01-fg5-eng.gif
Figure 5 - Footnote 1 All provinces and territories except NU report influenza outbreaks in long-term care facilities. All provinces and territories with the exception of NU and QC report outbreaks in hospitals. Outbreaks of influenza or influenza-like-illness in other facilities are reported to FluWatch but reporting varies between jurisdictions. Outbreak definitions are included at the end of the report.
Return to Figure 5 - Footnote1referrer
Figure 5 - Text Description Sentinel Pediatric Hospital Influenza Surveillance

Paediatric Influenza Hospitalizations and Deaths

In week 01, sixteen hospitalizations were reported by the the Immunization Monitoring Program Active (IMPACT) network (Figure 6). Eight hospitalizations were due to influenza A(H1N1) (50%).
To date this season, 54 laboratory-confirmed influenza-associated paediatric (≤16 years of age) hospitalizations have been reported by the IMPACT network. Forty-three hospitalized cases were due to influenza A and eleven cases were due to influenza B. The majority of hospitalized cases were among children aged 2-4 years (53%). Additionally, not included in Table 2 and Figure 6, two cases were due to co-infections of influenza A and B. To date, seven intensive care unit (ICU) admissions and less than five influenza-associated deaths have been reported.
Note: The number of hospitalizations reported through IMPACT represents a subset of all influenza-associated paediatric hospitalizations in Canada. Delays in the reporting of data may cause data to change retrospectively. [TABLE="class: table table-condensed table-striped table-hover table-bordered, width: 1140"]
[TR="class: bg-primary, bgcolor: #2572B4"]
[/TR]
[TR="class: bg-primary, bgcolor: #2572B4"]
[/TR]
[TR="class: bg-primary, bgcolor: #2572B4"]
[/TR]
[TR="bgcolor: #F5F5F5"]
[TD] [/TD]
[TD] [/TD]
[TD] [/TD]
[TD] [/TD]
[TD] [/TD]
[/TR]
[TR]
[TD] [/TD]
[TD] [/TD]
[TD] [/TD]
[TD] [/TD]
[TD] [/TD]
[/TR]
[TR="bgcolor: #F5F5F5"]
[TD] [/TD]
[TD="colspan: 3"]Data suppressed due to small values[/TD]
[TD] [/TD]
[/TR]
[TR]
[TD] [/TD]
[TD] [/TD]
[TD] [/TD]
[TD] [/TD]
[TD] [/TD]
[/TR]
[TR="bgcolor: #F5F5F5"]
[TD] [/TD]
[TD] [/TD]
[TD] [/TD]
[TD] [/TD]
[TD] [/TD]
[/TR]
[/TABLE]
Figure 6. Number of cases of influenza reported by sentinel hospital networks, by week, Canada, 2015-16, paediatric and adult hospitalizations (≤16 years of age, IMPACT; ≥16 years of age, CIRN-SOS)

2016-w01-fg6-eng.gif
Figure 6 - Text Description Adult Influenza Hospitalizations and Deaths

In week 01, sixteen hospitalizations were reported by the Canadian Immunization Research Network Serious Outcome Surveillance (CIRN-SOS),up from eight hospitalizations reported in week 52 (Figure 6). The majority of hospitalizations were in adults ≥65 years of age (63%) and due to influenza A (63%).
To date this season, 41 laboratory-confirmed influenza-associated adult (≥16 years of age) hospitalizations have been reported by CIRN-SOS. The majority of hospitalized cases were due to influenza A (78%) and were among adults ≥65 years of age (54%). One intensive care unit (ICU) admission has been reported. No deaths have been reported.
Note: The number of hospitalizations reported through IMPACT represents a subset of all influenza-associated paediatric hospitalizations in Canada. Delays in the reporting of data may cause data to change retrospectively. [TABLE="class: table table-condensed table-striped table-hover table-bordered, width: 1140"]
[TR="class: bg-primary, bgcolor: #2572B4"]
[/TR]
[TR="class: bg-primary, bgcolor: #2572B4"]
[/TR]
[TR="class: bg-primary, bgcolor: #2572B4"]
[/TR]
[TR="bgcolor: #F5F5F5"]
[TD]1[/TD]
[TD]1[/TD]
[TD]0[/TD]
[TD]0[/TD]
[TD]0[/TD]
[TD]1 (2%)[/TD]
[/TR]
[TR]
[TD]4[/TD]
[TD]1[/TD]
[TD]0[/TD]
[TD]3[/TD]
[TD]4[/TD]
[TD]8 (20%)[/TD]
[/TR]
[TR="bgcolor: #F5F5F5"]
[TD]8[/TD]
[TD]0[/TD]
[TD]1[/TD]
[TD]7[/TD]
[TD]2[/TD]
[TD]10 (24%)[/TD]
[/TR]
[TR]
[TD]19[/TD]
[TD]1[/TD]
[TD]7[/TD]
[TD]11[/TD]
[TD]3[/TD]
[TD]22 (54%)[/TD]
[/TR]
[TR="bgcolor: #F5F5F5"]
[TD]32[/TD]
[TD]3[/TD]
[TD]8[/TD]
[TD]21[/TD]
[TD]9[/TD]
[TD]41[/TD]
[/TR]
[TR]
[TD]78%[/TD]
[TD]9%[/TD]
[TD]25%[/TD]
[TD]66%[/TD]
[TD]22%[/TD]
[TD]100%[/TD]
[/TR]
[/TABLE]
Figure 7. Percentage of hospitalizations, ICU admissions and deaths with influenza reported by age-group (≥16 year of age), Canada 2015-16

2016-w01-fg7-eng.gif
Figure 7 - Text Description Provincial/Territorial Influenza Hospitalizations and Deaths

In week 01, 40 hospitalizations have been reported from participating provinces and territoriesFootnote*. The majority of hospitalizations were in adults ≥65 years of age (30%); however, the 0-4 age group and 45-64 age group followed closely representing 28% and 25% of hospitalizations respectively. Influenza A(H1N1) accounted for 60% of hospitalizations and among influenza A(H1N1) hospitalizations, nine (38%) were among children aged 0-4.
Since the start of the 2015-16 season, 201 laboratory-confirmed influenza-associated hospitalizations have been reported. One hundred and seventy-six hospitalizations (88%) were due to influenza A and twenty-five (12%) were due to influenza B. Among cases for which the subtype of influenza A was reported, 53% (40/96) were influenza A(H1N1). The majority (43%) of hospitalized cases were ≥65 years of age. Eighteen ICU admissions and ten deaths have been reported.
Figure 8. Percentage of hospitalizations, ICU admissions and deaths with influenza reported by age-group, Canada 2015-16

2016-w01-fg8-eng.gif
Figure 8 - Text Description Footnote * Note: Influenza-associated hospitalizations are not reported to PHAC by the following Provinces and Territory: BC, NU, and QC. Only hospitalizations that require intensive medical care are reported by Saskatchewan. ICU admissions are not distinguished among hospital admissions reported from Ontario. Data may also include cases reported by the IMPACT networks. The number of new influenza-associated hospitalizations and deaths reported for the current week may include cases from Ontario that occurred in previous weeks, as a result of retrospective updates to the cumulative total. It is important to note that the hospitalization or death does not have to be attributable to influenza, a positive laboratory test is sufficient for reporting.
Return to footnote*referrer
See additional data on Reported Influenza Hospitalizations and Deaths in Canada: 2011-12 to 2015-16 on the Public Health Agency of Canada website.
Influenza Strain Characterizations

During the 2015-16 influenza season, the National Microbiology Laboratory (NML) has characterized 156 influenza viruses [86 A(H3N2), 39 A(H1N1) and 31 influenza B].
Influenza A (H3N2): When tested by hemagglutination inhibition (HI) assays, eight H3N2 virus were antigenically characterized as A/Switzerland/9715293/2013-like using antiserum raised against cell-propagated A/Switzerland/9715293/2013.
Sequence analysis was done on 78 H3N2 viruses. All viruses belonged to a genetic group for which most viruses were antigenically related to A/Switzerland/9715293/2013.
A/Switzerland/9715293/2013 is the A(H3N2) component of the 2015-16 Northern Hemisphere's vaccine.
Influenza A (H1N1): Thirty-nine H1N1 viruses characterized were antigenically similar to A/California/7/2009, the A(H1N1) component of the 2015-16 influenza vaccine.
Influenza B: Twenty influenza B viruses characterized were antigenically similar to the vaccine strain B/Phuket/3073/2013. Eleven influenza B viruses were characterized as B/Brisbane/60/2008-like, one of the influenza B components of the 2015-16 Northern Hemisphere quadrivalent influenza vaccine.
The recommended components for the 2015-2016 northern hemisphere trivalent influenza vaccine include: an A/California/7/2009(H1N1)pdm09-like virus, an /Switzerland/9715293/2013(H3N2)-like virus, and a B/Phuket/3073/2013 -like virus (Yamagata lineage). For quadrivalent vaccines, the addition of a B/Brisbane/60/2008-like virus (Victoria lineage) is recommended.
The NML receives a proportion of the number of influenza positive specimens from provincial laboratories for strain characterization and antiviral resistance testing. Characterization data reflect the results of haemagglutination inhibition testing compared to the reference influenza strains recommended by WHO.
Antiviral Resistance

During the 2015-16 season, the National Microbiology Laboratory (NML) has tested 152 influenza viruses for resistance to oseltamivir and 151 influenza viruses for zanamivir. All viruses were sensitive to zanamivir and oseltamivir. A total of 113 influenza A viruses (99%) were resistant to amantadine (Table 4). [TABLE="class: table table-condensed table-striped table-hover table-bordered, width: 1140"]
[TR="class: bg-primary, bgcolor: #2572B4"]
[/TR]
[TR="class: bg-primary, bgcolor: #2572B4"]
[/TR]
[TR]
[TD="colspan: 7"]Table 4 - Footnote * NA - not applicable
Return to Table 4 - Footnote*referrer[/TD]
[/TR]
[TR="bgcolor: #F5F5F5"]
[TD]79[/TD]
[TD]0[/TD]
[TD]79[/TD]
[TD]0[/TD]
[TD]86[/TD]
[TD]85 (98.8%)[/TD]
[/TR]
[TR]
[TD]40[/TD]
[TD]0[/TD]
[TD]39[/TD]
[TD]0[/TD]
[TD]28[/TD]
[TD]28 (100%)[/TD]
[/TR]
[TR="bgcolor: #F5F5F5"]
[TD]33[/TD]
[TD]0[/TD]
[TD]33[/TD]
[TD]0[/TD]
[TD]NA Table 4 - Footnote*[/TD]
[TD]NA Table 4 - Footnote*[/TD]
[/TR]
[TR]
[TD]152[/TD]
[TD]0[/TD]
[TD]151[/TD]
[TD]0[/TD]
[TD]114[/TD]
[TD]113[/TD]
[/TR]
[/TABLE]
.../
http://healthycanadians.gc.ca/public.../index-eng.php
 
[h=1]FluWatch report: January 10, 2016 - January 16, 2016 (week 02)[/h] [h=2]Overall Summary[/h]
  • Overall in week 02, seasonal influenza activity was similar to the previous week.
  • Laboratory detections of influenza slightly increased but remain below expected levels for this time of the year.
  • To date, the majority of influenza laboratory detections and hospitalizations have been in seniors greater than 65 years of age.
  • During week 02, influenza A was the most frequently reported virus type reported, with influenza A(H1N1) predominating.
  • For more information on the flu, see our Flu(influenza) web page.

pubpdf02-eng.gif
Download the alternative format
(PDF format, 1.01 MB, 8 pages)
Organization: Public Health Agency of Canada
Date published: 2016-01-22

[h=2]Related Topics[/h]

Are you a primary health care practitioner (General Practitioner, Nurse Practitioner or Registered Nurse) interested in becoming a FluWatch sentinel for the 2015-16 influenza season? Contact us at FluWatch@phac-aspc.gc.ca


[h=2]On this page[/h]
[h=2]Influenza/Influenza-like Illness Activity (geographic spread)[/h] In week 02, 24 regions across Canada reported sporadic influenza/ILI activity. Localized activity was reported in three regions in Canada (AB and two in ON).
[h=3]Figure 1. Map of overall influenza/ILI activity level by province and territory, Canada, Week 02[/h]
fg1-legend-eng.gif


Note: Influenza/ILI activity levels, as represented on this map, are assigned and reported by Provincial and Territorial Ministries of Health, based on laboratory confirmations, sentinel ILI rates and reported outbreaks. Please refer to detailed definitions at the end of the report. Maps from previous weeks, including any retrospective updates, are available in the mapping feature found in the Weekly Influenza Reports.
Figure 1 - Text Description [h=2]Laboratory Confirmed Influenza Detections[/h] Laboratory confirmed influenza detections continue to increase steadily. The percent positive for influenza increased from 6.0% in week 01 to 7.2% in week 02 (Figure 2). Compared to the previous five seasons, the percent positive (7.2%) reported in week 02 was below the five year average for that week and below expected levels (range 13.5%-30.6%).
[h=3]Figure 2. Number of positive influenza tests and percentage of tests positive, by type, subtype and report week, Canada, 2015-16[/h]
2016-w02-fg2-eng.gif
Figure 2 - Text Description In week 02, there were 355 positive influenza tests reported. Similar to previous weeks, influenza A was the most frequently detected influenza type nationally with influenza A(H1N1) the most common subtype detected.The majority of influenza detections were reported from Western Canada, where BC and AB accounted for 71% of influenza detections in Canada in week 02. To date, 82% of influenza detections have been influenza A and among those subtyped over half have been influenza A(H1N1) [55% (473/859)].
[h=3]Figure 3. Cumulative numbers of positive influenza specimens by type/subtype and province, Canada, 2015-16[/h]
2016-w02-fg3-eng.gif
Note: Specimens from NT, YT, and NU are sent to reference laboratories in other provinces. Cumulative data includes updates to previous weeks.
Figure 3 - Text Description To date this season, detailed information on age and type/subtype has been received for 1,056 cases. Adults aged 65 years and older accounted for 31% of reported influenza cases (Table 1). Adults aged 65 years and older also represented 46% of reported A(H3N2) cases. Adults aged 20-44 years represented 26% of reported influenza A(H1N1) cases and 27% of reported influenza B cases.
[TABLE="class: table table-condensed table-striped table-hover table-bordered, width: 1140"]
Table 1. Weekly and cumulative numbers of positive influenza specimens by type, subtype and age-group reported through case-based laboratory reportingTable 1 - Footnote1, Canada, 2015-16 [TR="class: bg-primary, bgcolor: #2572B4"]
Age groups (years) Weekly (January 10 to January 16, 2016) Cumulative (August 30, 2015 to January 16, 2016) [/TR]
[TR="class: bg-primary, bgcolor: #2572B4"]
Influenza A B Influenza A B Influenza A and B [/TR]
[TR="class: bg-primary, bgcolor: #2572B4"]
A Total A(H1) pdm09 A(H3) A Table 1 - FootnoteUnS Total A Total A(H1) pdm09 A(H3) A Table 1 - FootnoteUnS Total # % [/TR]
[TR]
[TD="colspan: 13"] Table 1 - Footnote 1 Table 1 includes specimens for which demographic information was reported. These represent a subset of all positive influenza cases reported.
Return to Table 1 - Footnote1referrer
Table 1 - Footnote 2 Percentage of tests positive for sub-types of influenza A are a percentage of all influenza A detections.
Return to Table 1 - Footnote2referrer
Table 1 - Footnote UnS Unsubtyped: The specimen was typed as influenza A, but no result for subtyping was available.
Return to Table 1 - FootnoteUnSreferrer
[/TD]
[/TR]
[TR="bgcolor: #F5F5F5"]
<5 [TD]12[/TD]
[TD]4[/TD]
[TD]0[/TD]
[TD]8[/TD]
[TD]7[/TD]
[TD]93[/TD]
[TD]35[/TD]
[TD]25[/TD]
[TD]33[/TD]
[TD]28[/TD]
[TD]121[/TD]
[TD]11.5%[/TD]
[/TR]
[TR]
5-19 [TD]14[/TD]
[TD]1[/TD]
[TD]2[/TD]
[TD]11[/TD]
[TD]11[/TD]
[TD]77[/TD]
[TD]14[/TD]
[TD]37[/TD]
[TD]26[/TD]
[TD]59[/TD]
[TD]136[/TD]
[TD]12.9%[/TD]
[/TR]
[TR="bgcolor: #F5F5F5"]
20-44 [TD]35[/TD]
[TD]2[/TD]
[TD]2[/TD]
[TD]31[/TD]
[TD]20[/TD]
[TD]155[/TD]
[TD]39[/TD]
[TD]50[/TD]
[TD]66[/TD]
[TD]71[/TD]
[TD]226[/TD]
[TD]21.4%[/TD]
[/TR]
[TR]
45-64 [TD]25[/TD]
[TD]1[/TD]
[TD]2[/TD]
[TD]22[/TD]
[TD]12[/TD]
[TD]182[/TD]
[TD]35[/TD]
[TD]79[/TD]
[TD]68[/TD]
[TD]52[/TD]
[TD]234[/TD]
[TD]22.2%[/TD]
[/TR]
[TR="bgcolor: #F5F5F5"]
65+ [TD]16[/TD]
[TD]1[/TD]
[TD]6[/TD]
[TD]9[/TD]
[TD]12[/TD]
[TD]279[/TD]
[TD]25[/TD]
[TD]163[/TD]
[TD]91[/TD]
[TD]53[/TD]
[TD]332[/TD]
[TD]31.4%[/TD]
[/TR]
[TR]
Unknown [TD]3[/TD]
[TD]2[/TD]
[TD]1[/TD]
[TD]0[/TD]
[TD]0[/TD]
[TD]6[/TD]
[TD]4[/TD]
[TD]2[/TD]
[TD]0[/TD]
[TD]1[/TD]
[TD]7[/TD]
[TD]0.7%[/TD]
[/TR]
[TR="bgcolor: #F5F5F5"]
Total [TD]105[/TD]
[TD]11[/TD]
[TD]13[/TD]
[TD]81[/TD]
[TD]62[/TD]
[TD]792[/TD]
[TD]152[/TD]
[TD]356[/TD]
[TD]284[/TD]
[TD]264[/TD]
[TD]1056[/TD]
[TD]100.0%[/TD]
[/TR]
[TR]
PercentageTable 1 - Footnote2 [TD]62.9%[/TD]
[TD]10.5%[/TD]
[TD]12.4%[/TD]
[TD]77.1%[/TD]
[TD]37.1%[/TD]
[TD]75.0%[/TD]
[TD]19.2%[/TD]
[TD]44.9%[/TD]
[TD]35.9%[/TD]
[TD]25.0%[/TD]
[TD] [/TD]
[TD] [/TD]
[/TR]
[/TABLE]
For additional data on other respiratory virus detections see the Respiratory Virus Detections in Canada Report on the Public Health Agency of Canada website.
[h=2]Influenza-like Illness Consultation Rate[/h] The national ILI consultation rate decreased from the previous week from 28.4 per 1,000 patient visits in week 01, to 12.5 per 1,000 patient visits in week 02. In week 02, the highest ILI consultation rate was found in those 5-19 years of age (15.1 per 1,000) and the lowest was found in the ≥65 years age group (4.9 per 1,000) (Figure 4).
[h=3]Figure 4. Influenza-like-illness (ILI) consultation rates by age group and week, Canada, 2015-16[/h]
2016-w02-fg4-eng.gif
Delays in the reporting of data may cause data to change retrospectively. In BC, AB, and SK, data are compiled by a provincial sentinel surveillance program for reporting to FluWatch. Not all sentinel physicians report every week.
Figure 4 - Text Description [h=2]Influenza Outbreak Surveillance[/h] In week 02, two new laboratory confirmed influenza outbreaks were reported in long-term care facilities (LTCF). One outbreak was due to influenza A(H3N2) and the other was unknown. To date this season, 39 outbreaks have been reported (19 of which occurred in LTCFs). In comparison, at week 02 in the 2014-15 season, 796 outbreaks were reported (623 of which occurred in LTCFs) and in the 2013-14 season, 48 outbreaks were reported (28 of which occurred in LTCFs).
[h=3]Figure 5. Overall number of new laboratory-confirmed influenza outbreaksFigure 5 - Footnote1 by report week, Canada, 2015-2016[/h]
2016-w02-fg5-eng.gif
Figure 5 - Footnote 1 All provinces and territories except NU report influenza outbreaks in long-term care facilities. All provinces and territories with the exception of NU and QC report outbreaks in hospitals. Outbreaks of influenza or influenza-like-illness in other facilities are reported to FluWatch but reporting varies between jurisdictions. Outbreak definitions are included at the end of the report.
Return to Figure 5 - Footnote1referrer
Figure 5 - Text Description [h=2]Sentinel Pediatric Hospital Influenza Surveillance[/h] [h=3]Paediatric Influenza Hospitalizations and Deaths[/h] In week 02, fourteen hospitalizations were reported by the the Immunization Monitoring Program Active (IMPACT) network (Figure 6). Five hospitalizations were due to influenza A(H1N1) (36%) and seven were due to influenza B (50%).
To date this season, 70 laboratory-confirmed influenza-associated paediatric (≤16 years of age) hospitalizations have been reported by the IMPACT network. Fifty-one hospitalized cases were due to influenza A and nineteen cases were due to influenza B. Additionally, not included in Table 2 and Figure 6, two cases were due to co-infections of influenza A and B. The majority of hospitalized cases were among children aged 2-4 years (37%).To date, eight intensive care unit (ICU) admissions and less than five influenza-associated deaths have been reported.
Note: The number of hospitalizations reported through IMPACT represents a subset of all influenza-associated paediatric hospitalizations in Canada. Delays in the reporting of data may cause data to change retrospectively.
[TABLE="class: table table-condensed table-striped table-hover table-bordered, width: 1140"]
Table 2 - Cumulative numbers of peadiatric hospitalizations (≤16 years of age) with influenza reported by the IMPACT network, Canada, 2015-16 [TR="class: bg-primary, bgcolor: #2572B4"]
Age Groups Cumulative (30 Aug. 2015 to 16 January 2016) [/TR]
[TR="class: bg-primary, bgcolor: #2572B4"]
Influenza A Influenza B [/TR]
[TR="class: bg-primary, bgcolor: #2572B4"]
A Total A(H1) pdm09 A(H3) A (UnS) B Total [/TR]
[TR="bgcolor: #F5F5F5"]
0-5m [TD]7[/TD]
[TD]0[/TD]
[TD]1[/TD]
[TD]6[/TD]
[TD]3[/TD]
[/TR]
[TR]
6-23m [TD]12[/TD]
[TD]6[/TD]
[TD]3[/TD]
[TD]3[/TD]
[TD]4[/TD]
[/TR]
[TR="bgcolor: #F5F5F5"]
2-4y [TD]19[/TD]
[TD]8[/TD]
[TD]2[/TD]
[TD]9[/TD]
[TD]7[/TD]
[/TR]
[TR]
5-9y [TD]7[/TD]
[TD]4[/TD]
[TD]0[/TD]
[TD]3[/TD]
[TD]4[/TD]
[/TR]
[TR="bgcolor: #F5F5F5"]
10-16y [TD]6[/TD]
[TD]1[/TD]
[TD]1[/TD]
[TD]4[/TD]
[TD]1[/TD]
[/TR]
[/TABLE]
[h=4]Figure 6. Number of cases of influenza reported by sentinel hospital networks, by week, Canada, 2015-16, paediatric and adult hospitalizations (≤16 years of age, IMPACT; ≥16 years of age, CIRN-SOS)[/h]
2016-w02-fg6-eng.gif
Figure 6 - Text Description [h=3]Adult Influenza Hospitalizations and Deaths[/h] In week 02, ten hospitalizations were reported by the Canadian Immunization Research Network Serious Outcome Surveillance (CIRN-SOS) (Figure 6). The majority of hospitalizations were in adults 45-64 years of age (50%) and due to influenza A (90%).
To date this season, 53* laboratory-confirmed influenza-associated adult (≥16 years of age) hospitalizations have been reported by CIRN-SOS. The majority of hospitalized cases were due to influenza A (78%) and were among adults ≥65 years of age (49%). Two intensive care unit (ICU) admissions have been reported. No deaths have been reported.
Note: The number of hospitalizations reported through IMPACT represents a subset of all influenza-associated paediatric hospitalizations in Canada. Delays in the reporting of data may cause data to change retrospectively.
[TABLE="class: table table-condensed table-striped table-hover table-bordered, width: 1140"]
Table 3 - Cumulative numbers of adult hospitalizations (≥16 years of age) with influenza reported by the CIRN-SOS network, Canada, 2015-16 [TR="class: bg-primary, bgcolor: #2572B4"]
Age groups (years) Cumulative (1 Nov. 2015 to 16 Jan. 2016) [/TR]
[TR="class: bg-primary, bgcolor: #2572B4"]
Influenza A B Influenza A and B [/TR]
[TR="class: bg-primary, bgcolor: #2572B4"]
A Total A(H1) pdm09 A(H3) A(UnS) Total # (%) [/TR]
[TR="bgcolor: #F5F5F5"]
16-20 [TD]1[/TD]
[TD]1[/TD]
[TD]0[/TD]
[TD]0[/TD]
[TD]0[/TD]
[TD]1 (2%)[/TD]
[/TR]
[TR]
20-44 [TD]4[/TD]
[TD]1[/TD]
[TD]0[/TD]
[TD]3[/TD]
[TD]5[/TD]
[TD]9 (17%)[/TD]
[/TR]
[TR="bgcolor: #F5F5F5"]
45-64 [TD]13[/TD]
[TD]0[/TD]
[TD]1[/TD]
[TD]12[/TD]
[TD]3[/TD]
[TD]16 (31%)[/TD]
[/TR]
[TR]
65+ [TD]23[/TD]
[TD]1[/TD]
[TD]7[/TD]
[TD]15[/TD]
[TD]3[/TD]
[TD]26 (50%)[/TD]
[/TR]
[TR="bgcolor: #F5F5F5"]
Total [TD]41[/TD]
[TD]3[/TD]
[TD]8[/TD]
[TD]30[/TD]
[TD]11[/TD]
[TD]52[/TD]
[/TR]
[TR]
% [TD]79%[/TD]
[TD]7%[/TD]
[TD]20%[/TD]
[TD]73%[/TD]
[TD]21%[/TD]
[TD]100%[/TD]
[/TR]
[/TABLE]
[h=4]Figure 7. Percentage of hospitalizations, ICU admissions and deaths with influenza reported by age-group (≥16 year of age), Canada 2015-16[/h]
2016-w02-fg7-eng.gif
Figure 7 - Text Description [h=2]Provincial/Territorial Influenza Hospitalizations and Deaths[/h] In week 02, 36 hospitalizations have been reported from participating provinces and territoriesFootnote*. The majority of hospitalizations were in adults ≥65 years of age (40%). Influenza A(H1N1) accounted for 64% of hospitalizations and among influenza A(H1N1) hospitalizations, 30% of those were 20-44 yrs and ≥65 years of age.
Since the start of the 2015-16 season, 274 laboratory-confirmed influenza-associated hospitalizations have been reported. Two hundred and forty hospitalizations (88%) were due to influenza A and 34 (12%) were due to influenza B. Among cases for which the subtype of influenza A was reported, 65% (101/156) were influenza A(H1N1). The majority (40%) of hospitalized cases were ≥65 years of age. Twenty-eight ICU admissions and 12 deaths have been reported.
[h=3]Figure 8. Percentage of hospitalizations, ICU admissions and deaths with influenza reported by age-group, Canada 2015-16[/h]
2016-w02-fg8-eng.gif
Figure 8 - Text Description Footnote * Note: Influenza-associated hospitalizations are not reported to PHAC by the following Provinces and Territory: BC, NU, and QC. Only hospitalizations that require intensive medical care are reported by Saskatchewan. ICU admissions are not distinguished among hospital admissions reported from Ontario. Data may also include cases reported by the IMPACT networks. The number of new influenza-associated hospitalizations and deaths reported for the current week may include cases from Ontario that occurred in previous weeks, as a result of retrospective updates to the cumulative total. It is important to note that the hospitalization or death does not have to be attributable to influenza, a positive laboratory test is sufficient for reporting.
Return to footnote*referrer
See additional data on Reported Influenza Hospitalizations and Deaths in Canada: 2011-12 to 2015-16 on the Public Health Agency of Canada website.
[h=2]Influenza Strain Characterizations[/h] During the 2015-16 influenza season, the National Microbiology Laboratory (NML) has characterized 184 influenza viruses [95 A(H3N2), 55 A(H1N1) and 34 influenza B].
When tested by hemagglutination inhibition (HI) assays, twelve H3N2 virus were antigenically characterized as A/Switzerland/9715293/2013-like using antiserum raised against cell-propagated A/Switzerland/9715293/2013.
Sequence analysis was done on 83 H3N2 viruses. All viruses belonged to a genetic group for which most viruses were antigenically related to A/Switzerland/9715293/2013.
A/Switzerland/9715293/2013 is the A(H3N2) component of the 2015-16 Northern Hemisphere's vaccine.
Influenza A (H1N1): Fifty-five H1N1 viruses characterized were antigenically similar to A/California/7/2009, the A(H1N1) component of the 2015-16 influenza vaccine.
Influenza B: Twenty-two influenza B viruses characterized were antigenically similar to the vaccine strain B/Phuket/3073/2013. Twelve influenza B viruses were characterized as B/Brisbane/60/2008-like, one of the influenza B components of the 2015-16 Northern Hemisphere quadrivalent influenza vaccine.
The recommended components for the 2015-2016 northern hemisphere trivalent influenza vaccine include: an A/California/7/2009(H1N1)pdm09-like virus, an /Switzerland/9715293/2013(H3N2)-like virus, and a B/Phuket/3073/2013 -like virus (Yamagata lineage). For quadrivalent vaccines, the addition of a B/Brisbane/60/2008-like virus (Victoria lineage) is recommended.
The NML receives a proportion of the number of influenza positive specimens from provincial laboratories for strain characterization and antiviral resistance testing. Characterization data reflect the results of haemagglutination inhibition testing compared to the reference influenza strains recommended by WHO.

...
http://healthycanadians.gc.ca/publi...-2016-02-surveillance-influenza/index-eng.php
 
[h=1]FluWatch report: January 17, 2016 - January 23, 2016 (week 03)[/h] [h=2]Overall Summary[/h]
  • Overall in week 03, seasonal influenza activity increased from the previous week but remains below expected levels for this time of the year.
  • Hospitalizations among the pediatric population increased in week 03.
  • Influenza A(H1N1) is the most common influenza subtype circulating in Canada.
  • Influenza strains characterized by the National Microbiology Laboratory this season appear to be a good match to the World Health Organization's recommended vaccine strains.
  • For more information on the flu, see our Flu(influenza) web page.

pubpdf03-eng.gif
Download the alternative format
(PDF format, 897 KB, 8 pages)
Organization: Public Health Agency of Canada
Date published: 2016-01-29

[h=2]Related Topics[/h]

Are you a primary health care practitioner (General Practitioner, Nurse Practitioner or Registered Nurse) interested in becoming a FluWatch sentinel for the 2015-16 influenza season? Contact us at FluWatch@phac-aspc.gc.ca


[h=2]On this page[/h]
[h=2]Influenza/Influenza-like Illness Activity (geographic spread)[/h] In week 03, influenza/ILI activity increased in Canada. A total of 27 regions across Canada reported sporadic influenza/ILI activity. Localized activity was reported in six regions in Canada (one each in BC, AB and NS, and three in ON).
[h=3]Figure 1. Map of overall influenza/ILI activity level by province and territory, Canada, Week 03[/h]
fg1-legend-eng.gif


Note: Influenza/ILI activity levels, as represented on this map, are assigned and reported by Provincial and Territorial Ministries of Health, based on laboratory confirmations, sentinel ILI rates and reported outbreaks. Please refer to detailed definitions at the end of the report. Maps from previous weeks, including any retrospective updates, are available in the mapping feature found in the Weekly Influenza Reports.
Figure 1 - Text Description [h=2]Laboratory Confirmed Influenza Detections[/h] Laboratory confirmed influenza detections continue to increase steadily. The percent positive for influenza increased from 7.0% in week 02 to 12.4% in week 03 (Figure 2). Compared to the previous five seasons, the percent positive (12.4%) reported in week 03 was below the five year average for that week and below expected levels (range 13.2%-29.7%).
[h=3]Figure 2. Number of positive influenza tests and percentage of tests positive, by type, subtype and report week, Canada, 2015-16[/h]
2016-w03-fg2-eng.gif
Figure 2 - Text Description In week 03, there were 594 positive influenza tests reported. Influenza A(H1N1) was the most common subtype detected. The majority of influenza detections were reported from Western Canada, where BC and AB accounted for 69% of influenza detections in Canada in week 03. To date, 79% of influenza detections have been influenza A and among those subtyped, the majority have been influenza A(H1N1) [63% (744/1186)].
[h=3]Figure 3. Cumulative numbers of positive influenza specimens by type/subtype and province, Canada, 2015-16[/h]
2016-w03-fg3-eng.gif
Note: Specimens from NT, YT, and NU are sent to reference laboratories in other provinces. Cumulative data includes updates to previous weeks.
Figure 3 - Text Description To date this season, detailed information on age and type/subtype has been received for 1,435 cases. Adults aged 65 years and older accounted for 27% of reported influenza cases (Table 1). Adults aged 65 years and older also represented 44% of reported A(H3N2) cases. Adults aged 20-44 years represented 26% of reported influenza A(H1N1) cases and 29% of reported influenza B cases.
[TABLE="class: table table-condensed table-striped table-hover table-bordered, width: 1140"]
Table 1. Weekly and cumulative numbers of positive influenza specimens by type, subtype and age-group reported through case-based laboratory reportingTable 1 - Footnote1, Canada, 2015-16 [TR="class: bg-primary, bgcolor: #2572B4"]
Age groups (years) Weekly (January 17 to January 23, 2016) Cumulative (August 30, 2015 to January 23, 2016) [/TR]
[TR="class: bg-primary, bgcolor: #2572B4"]
Influenza A B Influenza A B Influenza A and B [/TR]
[TR="class: bg-primary, bgcolor: #2572B4"]
A Total A(H1) pdm09 A(H3) A Table 1 - FootnoteUnS Total A Total A(H1) pdm09 A(H3) A Table 1 - FootnoteUnS Total # % [/TR]
[TR]
[TD="colspan: 13"] Table 1 - Footnote 1 Table 1 includes specimens for which demographic information was reported. These represent a subset of all positive influenza cases reported.
Return to Table 1 - Footnote1referrer
Table 1 - Footnote 2 Percentage of tests positive for sub-types of influenza A are a percentage of all influenza A detections.
Return to Table 1 - Footnote2referrer
Table 1 - Footnote UnS Unsubtyped: The specimen was typed as influenza A, but no result for subtyping was available.
Return to Table 1 - FootnoteUnSreferrer
[/TD]
[/TR]
[TR="bgcolor: #F5F5F5"]
<5 [TD]43[/TD]
[TD]12[/TD]
[TD]2[/TD]
[TD]29[/TD]
[TD]7[/TD]
[TD]146[/TD]
[TD]58[/TD]
[TD]30[/TD]
[TD]58[/TD]
[TD]38[/TD]
[TD]184[/TD]
[TD]12.8%[/TD]
[/TR]
[TR]
5-19 [TD]21[/TD]
[TD]5[/TD]
[TD]1[/TD]
[TD]15[/TD]
[TD]44[/TD]
[TD]107[/TD]
[TD]30[/TD]
[TD]45[/TD]
[TD]32[/TD]
[TD]115[/TD]
[TD]222[/TD]
[TD]15.5%[/TD]
[/TR]
[TR="bgcolor: #F5F5F5"]
20-44 [TD]63[/TD]
[TD]13[/TD]
[TD]6[/TD]
[TD]44[/TD]
[TD]38[/TD]
[TD]219[/TD]
[TD]66[/TD]
[TD]65[/TD]
[TD]88[/TD]
[TD]117[/TD]
[TD]336[/TD]
[TD]23.4%[/TD]
[/TR]
[TR]
45-64 [TD]33[/TD]
[TD]5[/TD]
[TD]2[/TD]
[TD]26[/TD]
[TD]13[/TD]
[TD]230[/TD]
[TD]61[/TD]
[TD]89[/TD]
[TD]80[/TD]
[TD]68[/TD]
[TD]298[/TD]
[TD]20.8%[/TD]
[/TR]
[TR="bgcolor: #F5F5F5"]
65+ [TD]28[/TD]
[TD]3[/TD]
[TD]8[/TD]
[TD]17[/TD]
[TD]11[/TD]
[TD]316[/TD]
[TD]31[/TD]
[TD]180[/TD]
[TD]105[/TD]
[TD]71[/TD]
[TD]387[/TD]
[TD]27.0%[/TD]
[/TR]
[TR]
Unknown [TD]1[/TD]
[TD]1[/TD]
[TD]0[/TD]
[TD]0[/TD]
[TD]0[/TD]
[TD]7[/TD]
[TD]5[/TD]
[TD]2[/TD]
[TD]0[/TD]
[TD]1[/TD]
[TD]8[/TD]
[TD]0.6%[/TD]
[/TR]
[TR="bgcolor: #F5F5F5"]
Total [TD]189[/TD]
[TD]39[/TD]
[TD]19[/TD]
[TD]131[/TD]
[TD]113[/TD]
[TD]1025[/TD]
[TD]251[/TD]
[TD]411[/TD]
[TD]363[/TD]
[TD]410[/TD]
[TD]1435[/TD]
[TD]100.0%[/TD]
[/TR]
[TR]
PercentageTable 1 - Footnote2 [TD]62.6%[/TD]
[TD]20.6%[/TD]
[TD]10.1%[/TD]
[TD]69.3%[/TD]
[TD]37.4%[/TD]
[TD]71.4%[/TD]
[TD]24.5%[/TD]
[TD]40.1%[/TD]
[TD]35.4%[/TD]
[TD]28.6%[/TD]
[TD] [/TD]
[TD] [/TD]
[/TR]
[/TABLE]
For additional data on other respiratory virus detections see the Respiratory Virus Detections in Canada Report on the Public Health Agency of Canada website.
[h=2]Influenza-like Illness Consultation Rate[/h] The national ILI consultation rate increased from the previous week from 12.5 per 1,000 patient visits in week 02, to 15.6 per 1,000 patient visits in week 03. In week 03, the highest ILI consultation rate was found in those 0-4 years of age (26.9 per 1,000) and the lowest was found in the ≥65 years age group (2.7 per 1,000) (Figure 4).
[h=3]Figure 4. Influenza-like-illness (ILI) consultation rates by age group and week, Canada, 2015-16[/h]
2016-w03-fg4-eng.gif
Delays in the reporting of data may cause data to change retrospectively. In BC, AB, and SK, data are compiled by a provincial sentinel surveillance program for reporting to FluWatch. Not all sentinel physicians report every week.
Figure 4 - Text Description [h=2]Influenza Outbreak Surveillance[/h] In week 03, six new laboratory confirmed influenza outbreaks: four in long-term care facilities (LTCF), one in a hospital and one in an institutional or community setting. Two outbreaks were due to influenza B, one outbreak was due to influenza A (UnS) and the remainder were unknown. To date this season, 46 outbreaks have been reported (23 of which occurred in LTCFs). In comparison, at week 03 in the 2014-15 season, 941 outbreaks were reported (741 of which occurred in LTCFs) and in the 2013-14 season, 60 outbreaks were reported (33 of which occurred in LTCFs).
[h=3]Figure 5. Overall number of new laboratory-confirmed influenza outbreaksFigure 5 - Footnote1 by report week, Canada, 2015-2016[/h]
2016-w03-fg5-eng.gif
Figure 5 - Footnote 1 All provinces and territories except NU report influenza outbreaks in long-term care facilities. All provinces and territories with the exception of NU and QC report outbreaks in hospitals. Outbreaks of influenza or influenza-like-illness in other facilities are reported to FluWatch but reporting varies between jurisdictions. Outbreak definitions are included at the end of the report.
Return to Figure 5 - Footnote1referrer
Figure 5 - Text Description [h=2]Sentinel Pediatric Hospital Influenza Surveillance[/h] [h=3]Paediatric Influenza Hospitalizations and Deaths[/h] In week 03, 24 hospitalizations were reported by the the Immunization Monitoring Program Active (IMPACT) network (Figure 6). Nine hospitalizations were due to influenza A(H1N1) (38%), five were due to influenza B (21%) and the remainder were influenza A (UnS).
To date this season, 94 laboratory-confirmed influenza-associated paediatric (≤16 years of age) hospitalizations have been reported by the IMPACT network. Seventy-one hospitalized cases were due to influenza A and 23 cases were due to influenza B. The majority of hospitalized cases were among children aged 2-4 years (32%). To date, 13 intensive care unit (ICU) admissions have been reported. The majority of ICU admissions were reported in children 2-4 years (46%) and due to influenza A(H1N1) (38%). Less than five influenza-associated deaths have been reported.
[TABLE="class: table table-condensed table-striped table-hover table-bordered, width: 1140"]
Table 2 - Cumulative numbers of peadiatric hospitalizations (≤16 years of age) with influenza reported by the IMPACT network, Canada, 2015-16 [TR="class: bg-primary, bgcolor: #2572B4"]
Age Groups Cumulative (30 Aug. 2015 to 23 January 2016) [/TR]
[TR="class: bg-primary, bgcolor: #2572B4"]
Influenza A Influenza B Influenza A and B (#(%)) [/TR]
[TR="class: bg-primary, bgcolor: #2572B4"]
A Total A(H1) pdm09 A(H3) A (UnS) B Total [/TR]
[TR="bgcolor: #F5F5F5"]
0-5m [TD]11[/TD]
[TD]2[/TD]
[TD]2[/TD]
[TD]7[/TD]
[TD]5[/TD]
[TD]16 (17%)[/TD]
[/TR]
[TR]
6-23m [TD]17[/TD]
[TD]9[/TD]
[TD]3[/TD]
[TD]5[/TD]
[TD]4[/TD]
[TD]21 (22%)[/TD]
[/TR]
[TR="bgcolor: #F5F5F5"]
2-4y [TD]24[/TD]
[TD]10[/TD]
[TD]2[/TD]
[TD]12[/TD]
[TD]6[/TD]
[TD]30 (32%)[/TD]
[/TR]
[TR]
5-9y [TD]10[/TD]
[TD]4[/TD]
[TD]0[/TD]
[TD]6[/TD]
[TD]6[/TD]
[TD]16 (17%)[/TD]
[/TR]
[TR="bgcolor: #F5F5F5"]
10-16y [TD]10[/TD]
[TD]4[/TD]
[TD]0[/TD]
[TD]6[/TD]
[TD]6[/TD]
[TD]11 (12%)[/TD]
[/TR]
[TR]
Total [TD]71[/TD]
[TD]28[/TD]
[TD]8[/TD]
[TD]35[/TD]
[TD]23[/TD]
[TD]94 (100%)[/TD]
[/TR]
[/TABLE]
[h=4]Figure 6. Number of cases of influenza reported by sentinel hospital networks, by week, Canada, 2015-16, paediatric and adult hospitalizations (≤16 years of age, IMPACT; ≥16 years of age, CIRN-SOS)[/h]
2016-w03-fg6-eng.gif
Not included in Table 2 and Figure 6 are two IMPACT cases that were due to co-infections of influenza A and B.
Figure 6 - Text Description [h=3]Adult Influenza Hospitalizations and Deaths[/h] In week 03, 15 hospitalizations were reported by the Canadian Immunization Research Network Serious Outcome Surveillance (CIRN-SOS). The majority of hospitalizations were in adults 45-64 years of age (47%) and due to influenza A (73%).
To date this season, 71 laboratory-confirmed influenza-associated adult (≥16 years of age) hospitalizations have been reported by CIRN-SOS (Table 3). The majority of hospitalized cases were due to influenza A (77%) and were among adults ≥65 years of age (49%). Five intensive care unit (ICU) admissions have been reported and among those, four (80%) were due to influenza A. No deaths have been reported.
[TABLE="class: table table-condensed table-striped table-hover table-bordered, width: 1140"]
Table 3 - Cumulative numbers of adult hospitalizations (≥16 years of age) with influenza reported by the CIRN-SOS network, Canada, 2015-16 [TR="class: bg-primary, bgcolor: #2572B4"]
Age groups (years) Cumulative (1 Nov. 2015 to 16 Jan. 2016) [/TR]
[TR="class: bg-primary, bgcolor: #2572B4"]
Influenza A B Influenza A and B [/TR]
[TR="class: bg-primary, bgcolor: #2572B4"]
A Total A(H1) pdm09 A(H3) A(UnS) Total # (%) [/TR]
[TR="bgcolor: #F5F5F5"]
16-20 [TD]1[/TD]
[TD]1[/TD]
[TD]0[/TD]
[TD]0[/TD]
[TD]0[/TD]
[TD]1 (1%)[/TD]
[/TR]
[TR]
20-44 [TD]4[/TD]
[TD]1[/TD]
[TD]0[/TD]
[TD]3[/TD]
[TD]7[/TD]
[TD]11 (15%)[/TD]
[/TR]
[TR="bgcolor: #F5F5F5"]
45-64 [TD]17[/TD]
[TD]3[/TD]
[TD]2[/TD]
[TD]12[/TD]
[TD]5[/TD]
[TD]22 (31%)[/TD]
[/TR]
[TR]
65+ [TD]32[/TD]
[TD]2[/TD]
[TD]12[/TD]
[TD]18[/TD]
[TD]3[/TD]
[TD]35 (49%)[/TD]
[/TR]
[TR="bgcolor: #F5F5F5"]
Unknown [TD]1[/TD]
[TD]0[/TD]
[TD]0[/TD]
[TD]1[/TD]
[TD]1[/TD]
[TD]2 (3%)[/TD]
[/TR]
[TR]
Total [TD]55[/TD]
[TD]7[/TD]
[TD]14[/TD]
[TD]34[/TD]
[TD]16[/TD]
[TD]71[/TD]
[/TR]
[TR="bgcolor: #F5F5F5"]
% [TD]77%[/TD]
[TD]13%[/TD]
[TD]25%[/TD]
[TD]62%[/TD]
[TD]23%[/TD]
[TD]100%[/TD]
[/TR]
[/TABLE]
[h=4]Figure 7. Percentage of hospitalizations, ICU admissions and deaths with influenza reported by age-group (≥16 year of age), Canada 2015-16[/h]
2016-w03-fg7-eng.gif
Note: The number of hospitalizations reported through CIRN-SOS and IMPACT represents a subset of all influenza-associated adult and paediatric hospitalizations in Canada. Delays in the reporting of data may cause data to change retrospectively.
Figure 7 - Text Description [h=2]Provincial/Territorial Influenza Hospitalizations and Deaths[/h] In week 03, 51 hospitalizations have been reported from participating provinces and territoriesFootnote*. The majority of hospitalizations were due to influenza A (86%) and reported in the 0-4 years age group (35%).
Since the start of the 2015-16 season, 343 laboratory-confirmed influenza-associated hospitalizations have been reported. Two hundred and ninety-nine hospitalizations (87%) were due to influenza A and 44 (13%) were due to influenza B. Among cases for which the subtype of influenza A was reported, 69% (129/187) were influenza A(H1N1). The majority (37%) of hospitalized cases were ≥65 years of age. Thirty-two ICU admissions have been reported of which 26 (82%) were due to influenza A and 12 (38%) were in the 45-64 age group. A total of 14 deaths have been reported, all due to influenza A.
[h=3]Figure 8. Percentage of hospitalizations, ICU admissions and deaths with influenza reported by age-group, Canada 2015-16[/h]
2016-w03-fg8-eng.gif
Figure 8 - Text Description Footnote * Note: Influenza-associated hospitalizations are not reported to PHAC by the following Provinces and Territory: BC, NU, and QC. Only hospitalizations that require intensive medical care are reported by SK. ICU admissions are not distinguished among hospital admissions reported from ON. Data may also include cases reported by the IMPACT networks. The number of new influenza-associated hospitalizations and deaths reported for the current week may include cases from ON that occurred in previous weeks, as a result of retrospective updates to the cumulative total. It is important to note that the hospitalization or death does not have to be attributable to influenza, a positive laboratory test is sufficient for reporting.
Return to footnote*referrer
See additional data on Reported Influenza Hospitalizations and Deaths in Canada: 2011-12 to 2015-16 on the Public Health Agency of Canada website.
[h=2]Influenza Strain Characterizations[/h] During the 2015-16 influenza season, the National Microbiology Laboratory (NML) has characterized 234 influenza viruses [100 A(H3N2), 94 A(H1N1) and 40 influenza B].
Influenza A (H3N2): When tested by hemagglutination inhibition (HI) assays, twelve H3N2 virus were antigenically characterized as A/Switzerland/9715293/2013-like using antiserum raised against cell-propagated A/Switzerland/9715293/2013.
Sequence analysis was done on 88 H3N2 viruses. All viruses belonged to a genetic group for which most viruses were antigenically related to A/Switzerland/9715293/2013.
A/Switzerland/9715293/2013 is the A(H3N2) component of the 2015-16 Northern Hemisphere's vaccine.
Influenza A (H1N1): Ninety-four H1N1 viruses characterized were antigenically similar to A/California/7/2009, the A(H1N1) component of the 2015-16 influenza vaccine.
Influenza B: Twenty-five influenza B viruses characterized were antigenically similar to the vaccine strain B/Phuket/3073/2013. Fifteen influenza B viruses were characterized as B/Brisbane/60/2008-like, one of the influenza B components of the 2015-16 Northern Hemisphere quadrivalent influenza vaccine.
The recommended components for the 2015-2016 northern hemisphere trivalent influenza vaccine include: an A/California/7/2009(H1N1)pdm09-like virus, an /Switzerland/9715293/2013(H3N2)-like virus, and a B/Phuket/3073/2013 -like virus (Yamagata lineage). For quadrivalent vaccines, the addition of a B/Brisbane/60/2008-like virus (Victoria lineage) is recommended.
The NML receives a proportion of the number of influenza positive specimens from provincial laboratories for strain characterization and antiviral resistance testing. Characterization data reflect the results of haemagglutination inhibition testing compared to the reference influenza strains recommended by WHO.

.../

http://healthycanadians.gc.ca/publi...-2016-03-surveillance-influenza/index-eng.php
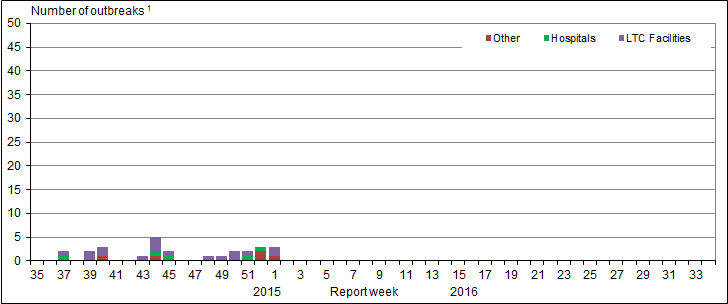
 
[h=1]FluWatch report: January 24, 2016 - January 30, 2016 (week 04)[/h] [h=2]Overall Summary[/h]
  • Overall in week 04, seasonal influenza activity increased from the previous week. Laboratory detections remain lower than average but are now within expected levels for this time of the year.
  • An increase in the number of outbreaks was reported in week 04 with the majority due to influenza A.
  • Influenza A(H1N1) is the most common influenza subtype circulating in Canada.
  • Influenza strains characterized by the National Microbiology Laboratory this season appear to be a good match to the World Health Organization?s recommended vaccine strains.
  • For more information on the flu, see our Flu(influenza) web page.

pubpdf04-eng.gif
Download the alternative format
(PDF format, 916 KB, 8 pages)
Organization: Public Health Agency of Canada
Date published: 2016-02-05

[h=2]Related Topics[/h]

Are you a primary health care practitioner (General Practitioner, Nurse Practitioner or Registered Nurse) interested in becoming a FluWatch sentinel for the 2015-16 influenza season? Contact us at FluWatch@phac-aspc.gc.ca


[h=2]On this page[/h]
[h=2]Influenza/Influenza-like Illness Activity (geographic spread)[/h] In week 04, influenza/ILI activity continued to increase in Canada. A total of 17 regions across Canada reported sporadic influenza/ILI activity. Localized activity was reported in 12 regions in Canada (one in YK, two in BC, three in AB, two in MB, three in ON and one in NS).
[h=3]Figure 1. Map of overall influenza/ILI activity level by province and territory, Canada, Week 04[/h]
fg1-legend-eng.gif


Note: Influenza/ILI activity levels, as represented on this map, are assigned and reported by Provincial and Territorial Ministries of Health, based on laboratory confirmations, sentinel ILI rates and reported outbreaks. Please refer to detailed definitions at the end of the report. Maps from previous weeks, including any retrospective updates, are available in the mapping feature found in the Weekly Influenza Reports.
Figure 1 - Text Description [h=2]Laboratory Confirmed Influenza Detections[/h] Laboratory confirmed influenza detections continued to increase. The percent positive for influenza increased from 12.1% in week 03 to 16.0% in week 04 (Figure 2). Compared to the previous five seasons, the percent positive (16.0%) reported in week 04 was below the five year average for that week but within expected levels (range 12.4%-26.4%).
[h=3]Figure 2. Number of positive influenza tests and percentage of tests positive, by type, subtype and report week, Canada, 2015-16[/h]
2016-w04-fg2-eng.gif
Figure 2 - Text Description In week 04, there were 895 positive influenza tests reported. Influenza A(H1N1) was the most common subtype detected. The majority of influenza detections were reported from Western Canada, where BC and AB accounted for 58% of influenza detections in Canada in week 04. To date, 79% of influenza detections have been influenza A and among those subtyped, the majority have been influenza A(H1N1) [71% (1202/1704)].
[h=3]Figure 3. Cumulative numbers of positive influenza specimens by type/subtype and province, Canada, 2015-16[/h]
2016-w04-fg3-eng.gif
Note: Specimens from NT, YT, and NU are sent to reference laboratories in other provinces. Cumulative data includes updates to previous weeks.
Figure 3 - Text Description To date this season, detailed information on age and type/subtype has been received for 2,056 cases. Adults aged 20-44 years and older accounted for the greatest proportion of influenza cases (Table 1). Adults aged 20-44 and 45-64 years accounted for 51% of reported influenza A(H1N1) cases. Adults aged 65 years and older represented 44% of all reported A(H3N2) cases.
[TABLE="class: table table-condensed table-striped table-hover table-bordered, width: 1140"]
Table 1. Weekly and cumulative numbers of positive influenza specimens by type, subtype and age-group reported through case-based laboratory reportingTable 1 - Footnote1, Canada, 2015-16 [TR="class: bg-primary, bgcolor: #2572B4"]
Age groups (years) Weekly (January 24 to January 30, 2016) Cumulative (August 30, 2015 to January 30, 2016) [/TR]
[TR="class: bg-primary, bgcolor: #2572B4"]
Influenza A B Influenza A B Influenza A and B [/TR]
[TR="class: bg-primary, bgcolor: #2572B4"]
A Total A(H1) pdm09 A(H3) A Table 1 - FootnoteUnS Total A Total A(H1) pdm09 A(H3) A Table 1 - FootnoteUnS Total # % [/TR]
[TR]
[TD="colspan: 13"] Table 1 - Footnote 1 Table 1 includes specimens for which demographic information was reported. These represent a subset of all positive influenza cases reported.
Return to Table 1 - Footnote1referrer
Table 1 - Footnote 2 Percentage of tests positive for sub-types of influenza A are a percentage of all influenza A detections.
Return to Table 1 - Footnote2referrer
Table 1 - Footnote UnS Unsubtyped: The specimen was typed as influenza A, but no result for subtyping was available.
Return to Table 1 - FootnoteUnSreferrer
[/TD]
[/TR]
[TR="bgcolor: #F5F5F5"]
<5 [TD]41[/TD]
[TD]7[/TD]
[TD]2[/TD]
[TD]32[/TD]
[TD]13[/TD]
[TD]207[/TD]
[TD]82[/TD]
[TD]35[/TD]
[TD]90[/TD]
[TD]57[/TD]
[TD]264[/TD]
[TD]12.8%[/TD]
[/TR]
[TR]
5-19 [TD]43[/TD]
[TD]9[/TD]
[TD]2[/TD]
[TD]32[/TD]
[TD]52[/TD]
[TD]159[/TD]
[TD]48[/TD]
[TD]48[/TD]
[TD]63[/TD]
[TD]183[/TD]
[TD]342[/TD]
[TD]16.6%[/TD]
[/TR]
[TR="bgcolor: #F5F5F5"]
20-44 [TD]104[/TD]
[TD]10[/TD]
[TD]5[/TD]
[TD]89[/TD]
[TD]47[/TD]
[TD]341[/TD]
[TD]97[/TD]
[TD]73[/TD]
[TD]171[/TD]
[TD]186[/TD]
[TD]527[/TD]
[TD]25.6%[/TD]
[/TR]
[TR]
45-64 [TD]84[/TD]
[TD]19[/TD]
[TD]7[/TD]
[TD]58[/TD]
[TD]18[/TD]
[TD]342[/TD]
[TD]98[/TD]
[TD]103[/TD]
[TD]141[/TD]
[TD]93[/TD]
[TD]435[/TD]
[TD]21.2%[/TD]
[/TR]
[TR="bgcolor: #F5F5F5"]
65+ [TD]46[/TD]
[TD]12[/TD]
[TD]8[/TD]
[TD]26[/TD]
[TD]19[/TD]
[TD]381[/TD]
[TD]54[/TD]
[TD]203[/TD]
[TD]124[/TD]
[TD]95[/TD]
[TD]476[/TD]
[TD]23.2%[/TD]
[/TR]
[TR]
Unknown [TD]3[/TD]
[TD]1[/TD]
[TD]2[/TD]
[TD]0[/TD]
[TD]0[/TD]
[TD]11[/TD]
[TD]7[/TD]
[TD]4[/TD]
[TD]0[/TD]
[TD]1[/TD]
[TD]12[/TD]
[TD]0.6%[/TD]
[/TR]
[TR="bgcolor: #F5F5F5"]
Total [TD]321[/TD]
[TD]58[/TD]
[TD]26[/TD]
[TD]237[/TD]
[TD]149[/TD]
[TD]1441[/TD]
[TD]386[/TD]
[TD]466[/TD]
[TD]589[/TD]
[TD]615[/TD]
[TD]2056[/TD]
[TD]100.0%[/TD]
[/TR]
[TR]
PercentageTable 1 - Footnote2 [TD]68.3%[/TD]
[TD]18.1%[/TD]
[TD]8.1%[/TD]
[TD]73.8%[/TD]
[TD]31.7%[/TD]
[TD]70.1%[/TD]
[TD]26.8%[/TD]
[TD]32.3%[/TD]
[TD]40.9%[/TD]
[TD]29.9%[/TD]
[TD] [/TD]
[TD] [/TD]
[/TR]
[/TABLE]
For additional data on other respiratory virus detections see the Respiratory Virus Detections in Canada Report on the Public Health Agency of Canada website.
[h=2]Influenza-like Illness Consultation Rate[/h] The national ILI consultation rate increased from the previous week from 16.0 per 1,000 patient visits in week 03, to 35.9 per 1,000 patient visits in week 04. In week 04, the highest ILI consultation rate was found in those 0-4 years of age (88.4 per 1,000) and the lowest was found in the ≥65 years age group (19.4 per 1,000) (Figure 4).
[h=3]Figure 4. Influenza-like-illness (ILI) consultation rates by age group and week, Canada, 2015-16[/h]
2016-w04-fg4-eng.gif
Delays in the reporting of data may cause data to change retrospectively. In BC, AB, and SK, data are compiled by a provincial sentinel surveillance program for reporting to FluWatch. Not all sentinel physicians report every week.
Figure 4 - Text Description [h=2]Influenza Outbreak Surveillance[/h] In week 04, 13 new laboratory confirmed influenza outbreaks were reported: six in long-term care facilities (LTCF), four in hospitals and three in an institutional or community setting. Of the outbreaks with known strains or subtypes, two outbreaks were due to Influenza A(H1N1), one was due to Influenza A(H3N2), three outbreaks were due to influenza A (UnS) and one outbreak was due to influenza B. Additionally, four ILI outbreaks were reported in schools.
To date this season, 63 outbreaks have been reported (29 of which occurred in LTCFs). In comparison, at week 04 in the 2014-15 season, 1,146 outbreaks were reported (589 of which occurred in LTCFs) and in the 2013-14 season, 67 outbreaks were reported (37 of which occurred in LTCFs).
[h=3]Figure 5. Overall number of new laboratory-confirmed influenza outbreaksFigure 5 - Footnote1 by report week, Canada, 2015-2016[/h]
2016-w04-fg5-eng.gif
Figure 5 - Footnote 1 All provinces and territories except NU report influenza outbreaks in long-term care facilities. All provinces and territories with the exception of NU and QC report outbreaks in hospitals. Outbreaks of influenza or influenza-like-illness in other facilities are reported to FluWatch but reporting varies between jurisdictions. Outbreak definitions are included at the end of the report.
Return to Figure 5 - Footnote1referrer
Figure 5 - Text Description [h=2]Sentinel Pediatric Hospital Influenza Surveillance[/h] [h=3]Paediatric Influenza Hospitalizations and Deaths[/h] In week 04, 38 hospitalizations were reported by the the Immunization Monitoring Program Active (IMPACT) network (Figure 6). Nineteen hospitalizations were due to influenza A(H1N1) (50%), one was due to A(H3N2) (2.7%) nine were due to influenza B (24%) and the remainder were influenza A (UnS).
To date this season, 134 laboratory-confirmed influenza-associated paediatric (≤16 years of age) hospitalizations have been reported by the IMPACT network: 102 hospitalized cases were due to influenza A and 32 cases were due to influenza B. The majority of hospitalized cases were among children aged 2-4 years (34%). To date, 15 intensive care unit (ICU) admissions have been reported. The majority of ICU admissions were reported in children 2-4 years (40%) and due to influenza A(H1N1) (27%). Less than five influenza-associated deaths have been reported.
[TABLE="class: table table-condensed table-striped table-hover table-bordered, width: 1140"]
Table 2 - Cumulative numbers of peadiatric hospitalizations (≤16 years of age) with influenza reported by the IMPACT network, Canada, 2015-16 [TR="class: bg-primary, bgcolor: #2572B4"]
Age Groups Cumulative (30 Aug. 2015 to 30 January 2016) [/TR]
[TR="class: bg-primary, bgcolor: #2572B4"]
Influenza A Influenza B Influenza A and B (#(%)) [/TR]
[TR="class: bg-primary, bgcolor: #2572B4"]
A Total A(H1) pdm09 A(H3) A (UnS) B Total [/TR]
[TR="bgcolor: #F5F5F5"]
0-5m [TD]13[/TD]
[TD]3[/TD]
[TD]2[/TD]
[TD]8[/TD]
[TD]5[/TD]
[TD]18 (13%)[/TD]
[/TR]
[TR]
6-23m [TD]26[/TD]
[TD]15[/TD]
[TD]3[/TD]
[TD]8[/TD]
[TD]4[/TD]
[TD]30 (22%)[/TD]
[/TR]
[TR="bgcolor: #F5F5F5"]
2-4y [TD]36[/TD]
[TD]17[/TD]
[TD]3[/TD]
[TD]16[/TD]
[TD]10[/TD]
[TD]46 (34%)[/TD]
[/TR]
[TR]
5-9y [TD]18[/TD]
[TD]9[/TD]
[TD]0[/TD]
[TD]9[/TD]
[TD]10[/TD]
[TD]28 (21%)[/TD]
[/TR]
[TR="bgcolor: #F5F5F5"]
10-16y [TD]18[/TD]
[TD]9[/TD]
[TD]0[/TD]
[TD]9[/TD]
[TD]10[/TD]
[TD]12 (9%)[/TD]
[/TR]
[TR]
Total [TD]102[/TD]
[TD]48[/TD]
[TD]9[/TD]
[TD]45[/TD]
[TD]32[/TD]
[TD]134 (100%)[/TD]
[/TR]
[/TABLE]
[h=4]Figure 6. Number of cases of influenza reported by sentinel hospital networks, by week, Canada, 2015-16, paediatric and adult hospitalizations (≤16 years of age, IMPACT; ≥16 years of age, CIRN-SOS)[/h]
2016-w04-fg6-eng.gif
Not included in Table 2 and Figure 6 are two IMPACT cases that were due to co-infections of influenza A and B.
Figure 6 - Text Description [h=3]Adult Influenza Hospitalizations and Deaths[/h] In week 04, 11 hospitalizations were reported by the Canadian Immunization Research Network Serious Outcome Surveillance (CIRN-SOS). The majority of hospitalizations were in adults 65+ years of age (64%) and due to influenza A (91%).
To date this season, 82 laboratory-confirmed influenza-associated adult (≥16 years of age) hospitalizations have been reported by CIRN-SOS (Table 3). The majority of hospitalized cases were due to influenza A (79%) and were among adults ≥65 years of age (54%). Six intensive care unit (ICU) admissions have been reported and among those, five (83%) were due to influenza A. Less than five deaths have been reported this season.
[TABLE="class: table table-condensed table-striped table-hover table-bordered, width: 1140"]
Table 3 - Cumulative numbers of adult hospitalizations (≥16 years of age) with influenza reported by the CIRN-SOS network, Canada, 2015-16 [TR="class: bg-primary, bgcolor: #2572B4"]
Age groups (years) Cumulative (1 Nov. 2015 to 30 Jan. 2016) [/TR]
[TR="class: bg-primary, bgcolor: #2572B4"]
Influenza A B Influenza A and B [/TR]
[TR="class: bg-primary, bgcolor: #2572B4"]
A Total A(H1) pdm09 A(H3) A(UnS) Total # (%) [/TR]
[TR="bgcolor: #F5F5F5"]
16-20 [TD]1[/TD]
[TD]1[/TD]
[TD]0[/TD]
[TD]0[/TD]
[TD]0[/TD]
[TD]1 (1%)[/TD]
[/TR]
[TR]
20-44 [TD]6[/TD]
[TD]1[/TD]
[TD]0[/TD]
[TD]5[/TD]
[TD]8[/TD]
[TD]14 (17%)[/TD]
[/TR]
[TR="bgcolor: #F5F5F5"]
45-64 [TD]18[/TD]
[TD]4[/TD]
[TD]2[/TD]
[TD]12[/TD]
[TD]5[/TD]
[TD]23 (28%)[/TD]
[/TR]
[TR]
65+ [TD]40[/TD]
[TD]5[/TD]
[TD]12[/TD]
[TD]23[/TD]
[TD]4[/TD]
[TD]44 (54%)[/TD]
[/TR]
[TR="bgcolor: #F5F5F5"]
Unknown [TD]0[/TD]
[TD]0[/TD]
[TD]0[/TD]
[TD]0[/TD]
[TD]0[/TD]
[TD]0 (%)[/TD]
[/TR]
[TR]
Total [TD]65[/TD]
[TD]11[/TD]
[TD]14[/TD]
[TD]40[/TD]
[TD]17[/TD]
[TD]82[/TD]
[/TR]
[TR="bgcolor: #F5F5F5"]
% [TD]79%[/TD]
[TD]17%[/TD]
[TD]22%[/TD]
[TD]62%[/TD]
[TD]21%[/TD]
[TD]100%[/TD]
[/TR]
[/TABLE]
[h=4]Figure 7. Percentage of hospitalizations, ICU admissions and deaths with influenza reported by age-group (≥16 year of age), Canada 2015-16[/h]
2016-w04-fg7-eng.gif
Note: The number of hospitalizations reported through CIRN-SOS and IMPACT represents a subset of all influenza-associated adult and paediatric hospitalizations in Canada. Delays in the reporting of data may cause data to change retrospectively.
Figure 7 - Text Description [h=2]Provincial/Territorial Influenza Hospitalizations and Deaths[/h] In week 04, 44 hospitalizations have been reported from participating provinces and territoriesFootnote*. The majority of hospitalizations were due to influenza A (82%). The largest proportion of cases reported in week 04 were in children 0-19 years (39%).
Since the start of the 2015-16 season, 421 laboratory-confirmed influenza-associated hospitalizations have been reported. A total of 365 hospitalizations (87%) were due to influenza A and 56 (13%) were due to influenza B. Among cases for which the subtype of influenza A was reported, 75% (176/235) were influenza A(H1N1). The majority (34%) of hospitalized cases were ≥65 years of age. Forty-one ICU admissions have been reported of which 35 (85%) were due to influenza A and 15 (37%) were in the 45-64 age group. A total of 14 deaths have been reported, all due to influenza A. The majority of deaths were reported in adults 65+ of age (57%).
[h=3]Figure 8. Percentage of hospitalizations, ICU admissions and deaths with influenza reported by age-group, Canada 2015-16[/h]
2016-w04-fg8-eng.gif
Figure 8 - Text Description Footnote * Note: Influenza-associated hospitalizations are not reported to PHAC by the following Provinces and Territory: BC, NU, and QC. Only hospitalizations that require intensive medical care are reported by SK. ICU admissions are not distinguished among hospital admissions reported from ON. Data may also include cases reported by the IMPACT networks. The number of new influenza-associated hospitalizations and deaths reported for the current week may include cases from ON that occurred in previous weeks, as a result of retrospective updates to the cumulative total. It is important to note that the hospitalization or death does not have to be attributable to influenza, a positive laboratory test is sufficient for reporting.
Return to footnote*referrer
See additional data on Reported Influenza Hospitalizations and Deaths in Canada: 2011-12 to 2015-16 on the Public Health Agency of Canada website.
[h=2]Influenza Strain Characterizations[/h] During the 2015-16 influenza season, the National Microbiology Laboratory (NML) has characterized 282 influenza viruses [106 A(H3N2), 132 A(H1N1) and 44 influenza B].
Influenza A (H3N2): When tested by hemagglutination inhibition (HI) assays, 15 H3N2 virus were antigenically characterized as A/Switzerland/9715293/2013-like using antiserum raised against cell-propagated A/Switzerland/9715293/2013.
Sequence analysis was done on 91 H3N2 viruses. All viruses belonged to a genetic group for which most viruses were antigenically related to A/Switzerland/9715293/2013.
A/Switzerland/9715293/2013 is the A(H3N2) component of the 2015-16 Northern Hemisphere's vaccine.
Influenza A (H1N1): One hundred and thrity-two H1N1 viruses characterized were antigenically similar to A/California/7/2009, the A(H1N1) component of the 2015-16 influenza vaccine.
Influenza B: Twenty-seven influenza B viruses characterized were antigenically similar to the vaccine strain B/Phuket/3073/2013. Seventeen influenza B viruses were characterized as B/Brisbane/60/2008-like, one of the influenza B components of the 2015-16 Northern Hemisphere quadrivalent influenza vaccine.
The recommended components for the 2015-2016 northern hemisphere trivalent influenza vaccine include: an A/California/7/2009(H1N1)pdm09-like virus, an /Switzerland/9715293/2013(H3N2)-like virus, and a B/Phuket/3073/2013 -like virus (Yamagata lineage). For quadrivalent vaccines, the addition of a B/Brisbane/60/2008-like virus (Victoria lineage) is recommended.
The NML receives a proportion of the number of influenza positive specimens from provincial laboratories for strain characterization and antiviral resistance testing. Characterization data reflect the results of haemagglutination inhibition testing compared to the reference influenza strains recommended by WHO.

.../
http://healthycanadians.gc.ca/publi...-2016-04-surveillance-influenza/index-eng.php
 
[h=1]FluWatch report: January 31, 2016 - February 6, 2016 (week 05)[/h] [h=2]Overall Summary[/h]
  • Overall in week 05, several seasonal influenza indicators increased from the previous week.
  • Laboratory detections reached expected levels for this time of the year.
  • An increase in the number of outbreaks was reported in week 05 with the majority due to influenza A.
  • In the past 3 weeks young/middle age adults are accounting for an increasing proportion of hospitalizations as reported by participating provinces and territories.
  • Influenza A(H1N1) is the most common influenza subtype circulating in Canada.
  • For more information on the flu, see our Flu(influenza) web page.

pubpdf05-eng.gif
Download the alternative format
(PDF format, 862 KB, 8 pages)
Organization: Public Health Agency of Canada
Date published: 2016-02-12

[h=2]Related Topics[/h]

Are you a primary health care practitioner (General Practitioner, Nurse Practitioner or Registered Nurse) interested in becoming a FluWatch sentinel for the 2015-16 influenza season? Contact us at FluWatch@phac-aspc.gc.ca


[h=2]On this page[/h]
[h=2]Influenza/Influenza-like Illness Activity (geographic spread)[/h] In week 05, influenza/ILI activity continued to increase in Canada. A total of 32 regions across Canada reported sporadic influenza/ILI activity. Localized activity was reported in 8 regions in Canada and widespread activity was reported in 2 regions of NL.
[h=3]Figure 1. Map of overall influenza/ILI activity level by province and territory, Canada, Week 05[/h]
fg1-legend-eng.gif


Note: Influenza/ILI activity levels, as represented on this map, are assigned and reported by Provincial and Territorial Ministries of Health, based on laboratory confirmations, sentinel ILI rates and reported outbreaks. Please refer to detailed definitions at the end of the report. Maps from previous weeks, including any retrospective updates, are available in the mapping feature found in the Weekly Influenza Reports.
Figure 1 - Text Description [h=2]Laboratory Confirmed Influenza Detections[/h] Laboratory confirmed influenza detections are on the rise in Canada. The percent positive for influenza increased from 16.0% in week 04 to 20.4% in week 05 (Figure 2). Compared to the previous five seasons, the percent positive (20.4%) reported in week 05 was above the five year average for that week but remained within expected levels (range 13.2%-24.4%).
[h=3]Figure 2. Number of positive influenza tests and percentage of tests positive, by type, subtype and report week, Canada, 2015-16[/h]
2016-w05-fg2-eng.gif
Figure 2 - Text Description In week 05, there were 1,271 positive influenza tests reported. Influenza A(H1N1) was the most common subtype detected. The majority of influenza detections were reported in the provinces of AB, ON and QC. To date, 80% of influenza detections have been influenza A and among those subtyped, the majority have been influenza A(H1N1) [77% (1834/2390)].
[h=3]Figure 3. Cumulative numbers of positive influenza specimens by type/subtype and province, Canada, 2015-16[/h]
2016-w05-fg3-eng.gif
Note: Specimens from NT, YT, and NU are sent to reference laboratories in other provinces. Cumulative data includes updates to previous weeks.
Figure 3 - Text Description To date this season, detailed information on age and type/subtype has been received for 3,694 cases. Adults aged 20-44 years accounted for the greatest proportion of influenza cases (Table 1). Adults aged 20-44 and 45-64 years accounted for 57% of reported influenza A(H1N1) cases. Children 5-19 years and adults 20-44 years accounted for 60% of all influenza B cases reported.
[TABLE="class: table table-condensed table-striped table-hover table-bordered, width: 1140"]
Table 1. Weekly and cumulative numbers of positive influenza specimens by type, subtype and age-group reported through case-based laboratory reportingTable 1 - Footnote1, Canada, 2015-16 [TR="class: bg-primary, bgcolor: #2572B4"]
Age groups (years) Weekly (January 31 to February 6, 2016) Cumulative (August 30, 2015 to February 6, 2016) [/TR]
[TR="class: bg-primary, bgcolor: #2572B4"]
Influenza A B Influenza A B Influenza A and B [/TR]
[TR="class: bg-primary, bgcolor: #2572B4"]
A Total A(H1) pdm09 A(H3) A Table 1 - FootnoteUnS Total A Total A(H1) pdm09 A(H3) A Table 1 - FootnoteUnS Total # % [/TR]
[TR]
[TD="colspan: 13"] Table 1 - Footnote 1 Table 1 includes specimens for which demographic information was reported. These represent a subset of all positive influenza cases reported.
Return to Table 1 - Footnote1referrer
Table 1 - Footnote 2 Percentage of tests positive for sub-types of influenza A are a percentage of all influenza A detections.
Return to Table 1 - Footnote2referrer
Table 1 - Footnote UnS Unsubtyped: The specimen was typed as influenza A, but no result for subtyping was available.
Return to Table 1 - FootnoteUnSreferrer
[/TD]
[/TR]
[TR="bgcolor: #F5F5F5"]
<5 [TD]114[/TD]
[TD]55[/TD]
[TD]0[/TD]
[TD]59[/TD]
[TD]10[/TD]
[TD]469[/TD]
[TD]294[/TD]
[TD]37[/TD]
[TD]138[/TD]
[TD]70[/TD]
[TD]539[/TD]
[TD]14.6%[/TD]
[/TR]
[TR]
5-19 [TD]74[/TD]
[TD]39[/TD]
[TD]2[/TD]
[TD]33[/TD]
[TD]24[/TD]
[TD]339[/TD]
[TD]208[/TD]
[TD]52[/TD]
[TD]79[/TD]
[TD]214[/TD]
[TD]553[/TD]
[TD]15.0%[/TD]
[/TR]
[TR="bgcolor: #F5F5F5"]
20-44 [TD]208[/TD]
[TD]100[/TD]
[TD]0[/TD]
[TD]108[/TD]
[TD]22[/TD]
[TD]838[/TD]
[TD]530[/TD]
[TD]78[/TD]
[TD]230[/TD]
[TD]212[/TD]
[TD]1050[/TD]
[TD]28.4%[/TD]
[/TR]
[TR]
45-64 [TD]220[/TD]
[TD]97[/TD]
[TD]6[/TD]
[TD]117[/TD]
[TD]10[/TD]
[TD]760[/TD]
[TD]421[/TD]
[TD]112[/TD]
[TD]227[/TD]
[TD]106[/TD]
[TD]866[/TD]
[TD]23.4%[/TD]
[/TR]
[TR="bgcolor: #F5F5F5"]
65+ [TD]86[/TD]
[TD]42[/TD]
[TD]2[/TD]
[TD]42[/TD]
[TD]16[/TD]
[TD]558[/TD]
[TD]196[/TD]
[TD]205[/TD]
[TD]157[/TD]
[TD]112[/TD]
[TD]670[/TD]
[TD]18.1%[/TD]
[/TR]
[TR]
Unknown [TD]4[/TD]
[TD]2[/TD]
[TD]2[/TD]
[TD]0[/TD]
[TD]0[/TD]
[TD]15[/TD]
[TD]9[/TD]
[TD]6[/TD]
[TD]0[/TD]
[TD]1[/TD]
[TD]16[/TD]
[TD]0.4%[/TD]
[/TR]
[TR="bgcolor: #F5F5F5"]
Total [TD]706[/TD]
[TD]335[/TD]
[TD]12[/TD]
[TD]359[/TD]
[TD]82[/TD]
[TD]2979[/TD]
[TD]1658[/TD]
[TD]490[/TD]
[TD]831[/TD]
[TD]715[/TD]
[TD]3694[/TD]
[TD]100.0%[/TD]
[/TR]
[TR]
PercentageTable 1 - Footnote2 [TD]89.6%[/TD]
[TD]47.5%[/TD]
[TD]1.7%[/TD]
[TD]50.8%[/TD]
[TD]10.4%[/TD]
[TD]80.6%[/TD]
[TD]55.7%[/TD]
[TD]16.4%[/TD]
[TD]27.9%[/TD]
[TD]19.4%[/TD]
[TD] [/TD]
[TD] [/TD]
[/TR]
[/TABLE]
For additional data on other respiratory virus detections see the Respiratory Virus Detections in Canada Report on the Public Health Agency of Canada website.
[h=2]Influenza-like Illness Consultation Rate[/h] The national ILI consultation rate increased from the previous week from 35.9 per 1,000 patient visits in week 04, to 75.4 per 1,000 patient visits in week 05. In week 05, the highest ILI consultation rate was found in those 0-4 years of age (136.4 per 1,000) and the lowest was found in the ≥65 years age group (11.2 per 1,000) (Figure 4).
[h=3]Figure 4. Influenza-like-illness (ILI) consultation rates by age group and week, Canada, 2015-16[/h]
2016-w05-fg4-eng.gif
Delays in the reporting of data may cause data to change retrospectively. In BC, AB, and SK, data are compiled by a provincial sentinel surveillance program for reporting to FluWatch. Not all sentinel physicians report every week.
Figure 4 - Text Description [h=2]Influenza Outbreak Surveillance[/h] In week 05, the number of outbreaks reported continued to increase. A total of 16 new laboratory confirmed influenza outbreaks were reported: nine in long-term care facilities (LTCF), four in hospitals and three in an institutional or community setting. Of the outbreaks with known strains or subtypes, one outbreak was due to Influenza A(H1N1). Additionally, one ILI outbreak was reported in a school.
To date this season, 80 outbreaks have been reported. In comparison, at week 05 in the 2014-15 season, 1,225 outbreaks were reported and in the 2013-14 season, 82 outbreaks were reported.
[h=3]Figure 5. Overall number of new laboratory-confirmed influenza outbreaksFigure 5 - Footnote1 by report week, Canada, 2015-2016[/h]
2016-w05-fg5-eng.gif
Figure 5 - Footnote 1 All provinces and territories except NU report influenza outbreaks in long-term care facilities. All provinces and territories with the exception of NU and QC report outbreaks in hospitals. Outbreaks of influenza or influenza-like-illness in other facilities are reported to FluWatch but reporting varies between jurisdictions. Outbreak definitions are included at the end of the report.
Return to Figure 5 - Footnote1referrer
Figure 5 - Text Description [h=2]Sentinel Pediatric Hospital Influenza Surveillance[/h] [h=3]Paediatric Influenza Hospitalizations and Deaths[/h] In week 05, 41 hospitalizations were reported by the the Immunization Monitoring Program Active (IMPACT) network (Figure 6). Eighteen hospitalizations were due to influenza A(H1N1) (44%), one was due to A(H3N2) (2.4%), eight were due to influenza B (20%) and the remainder were influenza A (UnS).
To date this season, 175 laboratory-confirmed influenza-associated paediatric (≤16 years of age) hospitalizations have been reported by the IMPACT network: 135 hospitalized cases were due to influenza A and 40 cases were due to influenza B. The highest proportion of hospitalizations was among children aged 2-4 years (34%). To date, 20 intensive care unit (ICU) admissions have been reported. The highest proportion of ICU admissions was reported in children 2-4 years (30%). Among ICU admissions for which the subtype of influenza A was reported, 75% were due to influenza A(H1N1). Less than five influenza-associated deaths have been reported.
[TABLE="class: table table-condensed table-striped table-hover table-bordered, width: 1140"]
Table 2 - Cumulative numbers of peadiatric hospitalizations (≤16 years of age) with influenza reported by the IMPACT network, Canada, 2015-16 [TR="class: bg-primary, bgcolor: #2572B4"]
Age Groups Cumulative (30 Aug. 2015 to 6 February 2016) [/TR]
[TR="class: bg-primary, bgcolor: #2572B4"]
Influenza A Influenza B Influenza A and B (#(%)) [/TR]
[TR="class: bg-primary, bgcolor: #2572B4"]
A Total A(H1) pdm09 A(H3) A (UnS) B Total [/TR]
[TR="bgcolor: #F5F5F5"]
0-5m [TD]15[/TD]
[TD]4[/TD]
[TD]3[/TD]
[TD]8[/TD]
[TD]6[/TD]
[TD]21 (12%)[/TD]
[/TR]
[TR]
6-23m [TD]33[/TD]
[TD]20[/TD]
[TD]3[/TD]
[TD]10[/TD]
[TD]5[/TD]
[TD]38 (22%)[/TD]
[/TR]
[TR="bgcolor: #F5F5F5"]
2-4y [TD]47[/TD]
[TD]22[/TD]
[TD]4[/TD]
[TD]21[/TD]
[TD]12[/TD]
[TD]59 (34%)[/TD]
[/TR]
[TR]
5-9y [TD]30[/TD]
[TD]18[/TD]
[TD]0[/TD]
[TD]12[/TD]
[TD]13[/TD]
[TD]43 (25%)[/TD]
[/TR]
[TR="bgcolor: #F5F5F5"]
10-16y [TD]30[/TD]
[TD]18[/TD]
[TD]0[/TD]
[TD]12[/TD]
[TD]13[/TD]
[TD]14 (8%)[/TD]
[/TR]
[TR]
Total [TD]135[/TD]
[TD]69[/TD]
[TD]11[/TD]
[TD]55[/TD]
[TD]40[/TD]
[TD]175 (100%)[/TD]
[/TR]
[/TABLE]
[h=4]Figure 6. Number of cases of influenza reported by sentinel hospital networks, by week, Canada, 2015-16, paediatric and adult hospitalizations (≤16 years of age, IMPACT; ≥16 years of age, CIRN-SOS)[/h]
2016-w05-fg6-eng.gif
Not included in Table 2 and Figure 6 are two IMPACT cases that were due to co-infections of influenza A and B.
Figure 6 - Text Description [h=3]Adult Influenza Hospitalizations and Deaths[/h] In week 05, 38 hospitalizations were reported by the Canadian Immunization Research Network Serious Outcome Surveillance (CIRN-SOS). The majority of hospitalizations were in adults 65+ years of age (58%) and have been due to influenza A (82%).
To date this season, 128 laboratory-confirmed influenza-associated adult (≥16 years of age) hospitalizations have been reported by CIRN-SOS (Table 3). The majority of hospitalized cases were due to influenza A (80%) and were among adults ≥65 years of age (54%). Ten intensive care unit (ICU) admissions have been reported and among those, nine (90%) were due to influenza A. Less than five deaths have been reported this season.
[TABLE="class: table table-condensed table-striped table-hover table-bordered, width: 1140"]
Table 3 - Cumulative numbers of adult hospitalizations (≥16 years of age) with influenza reported by the CIRN-SOS network, Canada, 2015-16 [TR="class: bg-primary, bgcolor: #2572B4"]
Age groups (years) Cumulative (1 Nov. 2015 to 6 Feb. 2016) [/TR]
[TR="class: bg-primary, bgcolor: #2572B4"]
Influenza A B Influenza A and B [/TR]
[TR="class: bg-primary, bgcolor: #2572B4"]
A Total A(H1) pdm09 A(H3) A(UnS) Total # (%) [/TR]
[TR="bgcolor: #F5F5F5"]
16-20 [TD]1[/TD]
[TD]1[/TD]
[TD]0[/TD]
[TD]0[/TD]
[TD]0[/TD]
[TD]1 (1%)[/TD]
[/TR]
[TR]
20-44 [TD]11[/TD]
[TD]2[/TD]
[TD]0[/TD]
[TD]9[/TD]
[TD]10[/TD]
[TD]21 (16%)[/TD]
[/TR]
[TR="bgcolor: #F5F5F5"]
45-64 [TD]32[/TD]
[TD]8[/TD]
[TD]2[/TD]
[TD]22[/TD]
[TD]5[/TD]
[TD]37 (29%)[/TD]
[/TR]
[TR]
65+ [TD]59[/TD]
[TD]10[/TD]
[TD]13[/TD]
[TD]36[/TD]
[TD]10[/TD]
[TD]69 (54%)[/TD]
[/TR]
[TR="bgcolor: #F5F5F5"]
Unknown [TD]0[/TD]
[TD]0[/TD]
[TD]0[/TD]
[TD]0[/TD]
[TD]0[/TD]
[TD]0 (%)[/TD]
[/TR]
[TR]
Total [TD]103[/TD]
[TD]21[/TD]
[TD]15[/TD]
[TD]67[/TD]
[TD]25[/TD]
[TD]128[/TD]
[/TR]
[TR="bgcolor: #F5F5F5"]
% [TD]80%[/TD]
[TD]20%[/TD]
[TD]15%[/TD]
[TD]65%[/TD]
[TD]20%[/TD]
[TD]100%[/TD]
[/TR]
[/TABLE]
[h=4]Figure 7. Percentage of hospitalizations, ICU admissions and deaths with influenza reported by age-group (≥16 year of age), Canada 2015-16[/h]
2016-w05-fg7-eng.gif
Note: The number of hospitalizations reported through CIRN-SOS and IMPACT represents a subset of all influenza-associated adult and paediatric hospitalizations in Canada. Delays in the reporting of data may cause data to change retrospectively.
Figure 7 - Text Description [h=2]Provincial/Territorial Influenza Hospitalizations and Deaths[/h] In week 05, 171 hospitalizations have been reported from participating provinces and territoriesFootnote*. The majority of hospitalizations were due to influenza A (93%). The largest proportion of cases reported in week 05 were in adults 20-64 years (44%).
Since the start of the 2015-16 season, 675 laboratory-confirmed influenza-associated hospitalizations have been reported. A total of 599 hospitalizations (89%) were due to influenza A and 76 (11%) were due to influenza B. Among cases for which the subtype of influenza A was reported, 83% (329/395) were influenza A(H1N1). The highest proportion (32%) of hospitalized cases of were among those aged ≥65 years. Sixty-eight ICU admissions have been reported of which 58 (85%) were due to influenza A and 29 (43%) were in the 45-64 age group. A total of 19 deaths have been reported, all due to influenza A. The majority of deaths were reported in adults 65+ of age (53%).
[h=3]Figure 8. Percentage of hospitalizations, ICU admissions and deaths with influenza reported by age-group, Canada 2015-16[/h]
2016-w05-fg8-eng.gif
Figure 8 - Text Description Footnote * Note: Influenza-associated hospitalizations are not reported to PHAC by the following Provinces and Territory: BC, NU, and QC. Only hospitalizations that require intensive medical care are reported by SK. ICU admissions are not distinguished among hospital admissions reported from ON. Data may also include cases reported by the IMPACT networks. The number of new influenza-associated hospitalizations and deaths reported for the current week may include cases from ON that occurred in previous weeks, as a result of retrospective updates to the cumulative total. It is important to note that the hospitalization or death does not have to be attributable to influenza, a positive laboratory test is sufficient for reporting.
Return to footnote*referrer
See additional data on Reported Influenza Hospitalizations and Deaths in Canada: 2011-12 to 2015-16 on the Public Health Agency of Canada website.
[h=2]Influenza Strain Characterizations[/h] During the 2015-16 influenza season, the National Microbiology Laboratory (NML) has characterized 330 influenza viruses [107 A(H3N2), 152 A(H1N1) and 71 influenza B].
Influenza A (H3N2): When tested by hemagglutination inhibition (HI) assays, 15 H3N2 virus were antigenically characterized as A/Switzerland/9715293/2013-like using antiserum raised against cell-propagated A/Switzerland/9715293/2013.
Sequence analysis was done on 92 H3N2 viruses. All viruses belonged to a genetic group for which most viruses were antigenically related to A/Switzerland/9715293/2013.
A/Switzerland/9715293/2013 is the A(H3N2) component of the 2015-16 Northern Hemisphere's vaccine.
Influenza A (H1N1): One hundred and fifty-two H1N1 viruses characterized were antigenically similar to A/California/7/2009, the A(H1N1) component of the 2015-16 influenza vaccine.
Influenza A (H1N1): One hundred and thrity-two H1N1 viruses characterized were antigenically similar to A/California/7/2009, the A(H1N1) component of the 2015-16 influenza vaccine.
Influenza B: Twenty-two influenza B viruses characterized were antigenically similar to the vaccine strain B/Phuket/3073/2013. Thirty-nine influenza B viruses were characterized as B/Brisbane/60/2008-like, one of the influenza B components of the 2015-16 Northern Hemisphere quadrivalent influenza vaccine.
The recommended components for the 2015-2016 northern hemisphere trivalent influenza vaccine include: an A/California/7/2009(H1N1)pdm09-like virus, an /Switzerland/9715293/2013(H3N2)-like virus, and a B/Phuket/3073/2013 -like virus (Yamagata lineage). For quadrivalent vaccines, the addition of a B/Brisbane/60/2008-like virus (Victoria lineage) is recommended.
The NML receives a proportion of the number of influenza positive specimens from provincial laboratories for strain characterization and antiviral resistance testing. Characterization data reflect the results of haemagglutination inhibition testing compared to the reference influenza strains recommended by WHO.

.../

http://healthycanadians.gc.ca/publi...-2016-05-surveillance-influenza/index-eng.php
 
[h=1]FluWatch report: February 7, 2016 - February 13, 2016 (week 06)[/h] [h=2]Overall Summary[/h]
  • Overall in week 06, influenza activity in Canada continues to increase.
  • An increase in laboratory detections and outbreaks of influenza were reported in week 06 with the majority due to influenza A.
  • Young/middle age adults are accounting for an increasing proportion of hospitalizations as reported by participating provinces and territories.
  • Pediatric hospitalizations reported by the IMPACT network have increased substantially over the past few weeks, reaching 76 hospitalizations in week 06.
  • Influenza A(H1N1) is the most common influenza subtype circulating in Canada.
  • With the late start to the influenza season, it is anticipated that influenza activity will continue to increase over the coming weeks.
  • For more information on the flu, see our Flu(influenza) web page.

pubpdf06-eng.jpg
Download the alternative format
(PDF format, 862 KB, 8 pages)
Organization: Public Health Agency of Canada
Date published: 2016-02-19

[h=2]Related Topics[/h]

Are you a primary health care practitioner (General Practitioner, Nurse Practitioner or Registered Nurse) interested in becoming a FluWatch sentinel for the 2015-16 influenza season? Contact us at FluWatch@phac-aspc.gc.ca


[h=2]On this page[/h]
[h=2]Influenza/Influenza-like Illness Activity (geographic spread)[/h] In week 06, influenza/ILI activity continued to increase in Canada. A total of 30 regions across Canada reported sporadic influenza/ILI activity. Localized activity was reported in 14 regions in Canada.
[h=3]Figure 1. Map of overall influenza/ILI activity level by province and territory, Canada, Week 06[/h]
fg1-legend-eng.gif


Note: Influenza/ILI activity levels, as represented on this map, are assigned and reported by Provincial and Territorial Ministries of Health, based on laboratory confirmations, sentinel ILI rates and reported outbreaks. Please refer to detailed definitions at the end of the report. Maps from previous weeks, including any retrospective updates, are available in the mapping feature found in the Weekly Influenza Reports.
Figure 1 - Text Description [h=2]Laboratory Confirmed Influenza Detections[/h] Laboratory confirmed influenza detections continue to increase. The percentage of tests positive for influenza increased from 20.6% in week 05 to 26.2% in week 06 (Figure 2). Compared to the previous five seasons, the percent positive (26.2%) reported in week 06 was above the five year average for that week and is above expected levels (range 12.9% - 21.5%) for this time of year. With the late start to the 2015-16 influenza season, these above normal levels are not unexpected and are typical of peak season levels.
[h=3]Figure 2. Number of positive influenza tests and percentage of tests positive, by type, subtype and report week, Canada, 2015-16[/h]
2016-w06-fg2-eng.jpg
Figure 2 - Text Description In week 06, there were 1,862 positive influenza tests reported. Influenza A(H1N1) was the most common subtype detected. To date, 82% of influenza detections have been influenza A and among those subtyped, the majority have been influenza A(H1N1) [82% (2819/3448)].
[h=3]Figure 3. Cumulative numbers of positive influenza specimens by type/subtype and province, Canada, 2015-16[/h]
2016-w06-fg3-eng.png
Note: Specimens from NT, YT, and NU are sent to reference laboratories in other provinces. Cumulative data includes updates to previous weeks.
Figure 3 - Text Description To date this season, detailed information on age and type/subtype has been received for 5,580 cases. Adults aged 20-44 years accounted for the greatest proportion of influenza cases (Table 1). Adults aged 20-44 and 45-64 years accounted for 58% of reported influenza A(H1N1) cases. Children 5-19 years and adults 20-44 years accounted for 61% of all influenza B cases reported.
[TABLE="class: table table-condensed table-striped table-hover table-bordered, width: 1140"]
Table 1. Weekly and cumulative numbers of positive influenza specimens by type, subtype and age-group reported through case-based laboratory reportingTable 1 - Footnote1, Canada, 2015-16 [TR="class: bg-primary, bgcolor: #2572B4"]
Age groups (years) Weekly (February 7 to February 13, 2016) Cumulative (August 30, 2015 to February 13, 2016) [/TR]
[TR="class: bg-primary, bgcolor: #2572B4"]
Influenza A B Influenza A B Influenza A and B [/TR]
[TR="class: bg-primary, bgcolor: #2572B4"]
A Total A(H1) pdm09 A(H3) A Table 1 - FootnoteUnS Total A Total A(H1) pdm09 A(H3) A Table 1 - FootnoteUnS Total # % [/TR]
[TR]
[TD="colspan: 13"] Table 1 - Footnote 1 Table 1 includes specimens for which demographic information was reported. These represent a subset of all positive influenza cases reported.
Return to Table 1 - Footnote1referrer
Table 1 - Footnote 2 Percentage of tests positive for sub-types of influenza A are a percentage of all influenza A detections.
Return to Table 1 - Footnote2referrer
Table 1 - Footnote UnS Unsubtyped: The specimen was typed as influenza A, but no result for subtyping was available.
Return to Table 1 - FootnoteUnSreferrer
[/TD]
[/TR]
[TR="bgcolor: #F5F5F5"]
<5 [TD]215[/TD]
[TD]96[/TD]
[TD]1[/TD]
[TD]118[/TD]
[TD]31[/TD]
[TD]747[/TD]
[TD]463[/TD]
[TD]39[/TD]
[TD]245[/TD]
[TD]112[/TD]
[TD]859[/TD]
[TD]15.4%[/TD]
[/TR]
[TR]
5-19 [TD]137[/TD]
[TD]63[/TD]
[TD]1[/TD]
[TD]73[/TD]
[TD]62[/TD]
[TD]528[/TD]
[TD]324[/TD]
[TD]58[/TD]
[TD]146[/TD]
[TD]307[/TD]
[TD]835[/TD]
[TD]15.0%[/TD]
[/TR]
[TR="bgcolor: #F5F5F5"]
20-44 [TD]365[/TD]
[TD]175[/TD]
[TD]5[/TD]
[TD]185[/TD]
[TD]50[/TD]
[TD]1304[/TD]
[TD]834[/TD]
[TD]91[/TD]
[TD]379[/TD]
[TD]298[/TD]
[TD]1602[/TD]
[TD]28.7%[/TD]
[/TR]
[TR]
45-64 [TD]320[/TD]
[TD]147[/TD]
[TD]12[/TD]
[TD]161[/TD]
[TD]28[/TD]
[TD]1172[/TD]
[TD]677[/TD]
[TD]131[/TD]
[TD]364[/TD]
[TD]139[/TD]
[TD]1311[/TD]
[TD]235%[/TD]
[/TR]
[TR="bgcolor: #F5F5F5"]
65+ [TD]198[/TD]
[TD]76[/TD]
[TD]15[/TD]
[TD]107[/TD]
[TD]20[/TD]
[TD]802[/TD]
[TD]302[/TD]
[TD]237[/TD]
[TD]263[/TD]
[TD]141[/TD]
[TD]943[/TD]
[TD]16.9%[/TD]
[/TR]
[TR]
Unknown [TD]10[/TD]
[TD]5[/TD]
[TD]2[/TD]
[TD]3[/TD]
[TD]0[/TD]
[TD]28[/TD]
[TD]17[/TD]
[TD]8[/TD]
[TD]3[/TD]
[TD]2[/TD]
[TD]30[/TD]
[TD]0.5%[/TD]
[/TR]
[TR="bgcolor: #F5F5F5"]
Total [TD]1245[/TD]
[TD]562[/TD]
[TD]36[/TD]
[TD]647[/TD]
[TD]191[/TD]
[TD]4581[/TD]
[TD]2617[/TD]
[TD]564[/TD]
[TD]1400[/TD]
[TD]999[/TD]
[TD]5580[/TD]
[TD]100.0%[/TD]
[/TR]
[TR]
PercentageTable 1 - Footnote2 [TD]86.7%[/TD]
[TD]45.1%[/TD]
[TD]2.9%[/TD]
[TD]52.0%[/TD]
[TD]13.3%[/TD]
[TD]82.1%[/TD]
[TD]57.1%[/TD]
[TD]12.3%[/TD]
[TD]30.6%[/TD]
[TD]17.9%[/TD]
[TD] [/TD]
[TD] [/TD]
[/TR]
[/TABLE]
For additional data on other respiratory virus detections see the Respiratory Virus Detections in Canada Report on the Public Health Agency of Canada website.
[h=2]Influenza-like Illness Consultation Rate[/h] The national ILI consultation rate decreased from the previous week from 75.4 per 1,000 patient visits in week 05, to 50.9 per 1,000 patient visits in week 06. In week 06, the highest ILI consultation rate was found in those 0-4 years of age (86.1 per 1,000) and the lowest was found in the ≥65 years age group (11.6 per 1,000) (Figure 4).
[h=3]Figure 4. Influenza-like-illness (ILI) consultation rates by age group and week, Canada, 2015-16[/h]
2016-w06-fg4-eng.jpg
Delays in the reporting of data may cause data to change retrospectively. In BC, AB, and SK, data are compiled by a provincial sentinel surveillance program for reporting to FluWatch. Not all sentinel physicians report every week.
Figure 4 - Text Description [h=2]Influenza Outbreak Surveillance[/h] In week 06, a total of 21 new laboratory confirmed influenza outbreaks were reported: ten in long-term care facilities (LTCF), eight in hospitals and three in institutional or community settings. Of the outbreaks with known strains or subtypes: seven outbreaks were due to influenza A (two due to influenza A(H3N2), one due to influenza A(H1N1) and four were due to influenza A(UnS)), one outbreak was due to influenza B and one outbreak was due to both influenza A and B.
To date this season, 102 outbreaks have been reported. In comparison at week 06 in the 2014-15 season 1,177 outbreaks were reported and in the 2013-14 season 101 outbreaks were reported. .
[h=3]Figure 5. Overall number of new laboratory-confirmed influenza outbreaksFigure 5 - Footnote1 by report week, Canada, 2015-2016[/h]
2016-w06-fg5-eng.jpg
Figure 5 - Footnote 1 All provinces and territories except NU report influenza outbreaks in long-term care facilities. All provinces and territories with the exception of NU and QC report outbreaks in hospitals. Outbreaks of influenza or influenza-like-illness in other facilities are reported to FluWatch but reporting varies between jurisdictions. Outbreak definitions are included at the end of the report.
Return to Figure 5 - Footnote1referrer
Figure 5 - Text Description [h=2]Sentinel Pediatric Hospital Influenza Surveillance[/h] [h=3]Paediatric Influenza Hospitalizations and Deaths[/h] In week 06, 76 hospitalizations were reported by the the Immunization Monitoring Program Active (IMPACT) network (Figure 6). Twenty-four hospitalizations were due to influenza A(H1N1), 11 were due to influenza B and the remainder were influenza A (UnS). The highest proportion of hospitalizations was among children aged 2-4 years (29%).
To date this season, 259 laboratory-confirmed influenza-associated paediatric (≤16 years of age) hospitalizations have been reported by the IMPACT network: 205 hospitalized cases were due to influenza A and 54 cases were due to influenza B. The highest proportion of hospitalizations was among children aged 2-4 years (33%). To date, 36 intensive care unit (ICU) admissions have been reported. The highest proportion of ICU admissions was reported in children 5-9 years (30%). Among ICU admissions for which the subtype of influenza A was reported, 86% were due to influenza A(H1N1). Among the ICU admissions, 19 (70%) were reported to have at least one comorbidity. Less than five influenza-associated deaths have been reported.
[TABLE="class: table table-condensed table-striped table-hover table-bordered, width: 1140"]
Table 2 - Cumulative numbers of peadiatric hospitalizations (≤16 years of age) with influenza reported by the IMPACT network, Canada, 2015-16 [TR="class: bg-primary, bgcolor: #2572B4"]
Age Groups Cumulative (30 Aug. 2015 to 13 February 2016) [/TR]
[TR="class: bg-primary, bgcolor: #2572B4"]
Influenza A Influenza B Influenza A and B (#(%)) [/TR]
[TR="class: bg-primary, bgcolor: #2572B4"]
A Total A(H1) pdm09 A(H3) A (UnS) B Total [/TR]
[TR="bgcolor: #F5F5F5"]
0-5m [TD]26[/TD]
[TD]10[/TD]
[TD]3[/TD]
[TD]13[/TD]
[TD]6[/TD]
[TD]32 (12%)[/TD]
[/TR]
[TR]
6-23m [TD]51[/TD]
[TD]28[/TD]
[TD]3[/TD]
[TD]20[/TD]
[TD]8[/TD]
[TD]59 (23%)[/TD]
[/TR]
[TR="bgcolor: #F5F5F5"]
2-4y [TD]70[/TD]
[TD]31[/TD]
[TD]4[/TD]
[TD]35[/TD]
[TD]15[/TD]
[TD]85 (33%)[/TD]
[/TR]
[TR]
5-9y [TD]41[/TD]
[TD]18[/TD]
[TD]0[/TD]
[TD]23[/TD]
[TD]18[/TD]
[TD]59 (23%)[/TD]
[/TR]
[TR="bgcolor: #F5F5F5"]
10-16y [TD]41[/TD]
[TD]18[/TD]
[TD]0[/TD]
[TD]23[/TD]
[TD]18[/TD]
[TD]24 (9%)[/TD]
[/TR]
[TR]
Total [TD]205[/TD]
[TD]97[/TD]
[TD]11[/TD]
[TD]97[/TD]
[TD]54[/TD]
[TD]259 (100%)[/TD]
[/TR]
[/TABLE]
[h=4]Figure 6. Number of cases of influenza reported by sentinel hospital networks, by week, Canada, 2015-16, paediatric and adult hospitalizations (≤16 years of age, IMPACT; ≥16 years of age, CIRN-SOS)[/h]
2016-w06-fg6-eng.jpg
Not included in Table 2 and Figure 6 are two IMPACT cases that were due to co-infections of influenza A and B.
Figure 6 - Text Description [h=3]Adult Influenza Hospitalizations and Deaths[/h] In week 06, 33 hospitalizations were reported by the Canadian Immunization Research Network Serious Outcome Surveillance (CIRN-SOS). The greatest proportion of hospitalizations in week 06 were in adults 65+ years of age (42%), followed by adults aged 45-64. The majority of hospitalizations were due to influenza A (81%).
To date this season, 166 laboratory-confirmed influenza-associated adult (≥16 years of age) hospitalizations have been reported by CIRN-SOS (Table 3). The majority of hospitalized cases were due to influenza A (81%) and were among adults ≥65 years of age (51%). Seventeen intensive care unit (ICU) admissions have been reported and among those, nine (88%) were due to influenza A. Less than five deaths have been reported this season.
[TABLE="class: table table-condensed table-striped table-hover table-bordered, width: 1140"]
Table 3 - Cumulative numbers of adult hospitalizations (≥16 years of age) with influenza reported by the CIRN-SOS network, Canada, 2015-16 [TR="class: bg-primary, bgcolor: #2572B4"]
Age groups (years) Cumulative (1 Nov. 2015 to 13 Feb. 2016) [/TR]
[TR="class: bg-primary, bgcolor: #2572B4"]
Influenza A B Influenza A and B [/TR]
[TR="class: bg-primary, bgcolor: #2572B4"]
A Total A(H1) pdm09 A(H3) A(UnS) Total # (%) [/TR]
[TR="bgcolor: #F5F5F5"]
16-20 [TD]1[/TD]
[TD]1[/TD]
[TD]0[/TD]
[TD]0[/TD]
[TD]0[/TD]
[TD]1 (1%)[/TD]
[/TR]
[TR]
20-44 [TD]6[/TD]
[TD]6[/TD]
[TD]0[/TD]
[TD]10[/TD]
[TD]12[/TD]
[TD]28 (17%)[/TD]
[/TR]
[TR="bgcolor: #F5F5F5"]
45-64 [TD]45[/TD]
[TD]12[/TD]
[TD]2[/TD]
[TD]31[/TD]
[TD]6[/TD]
[TD]51 (31%)[/TD]
[/TR]
[TR]
65+ [TD]71[/TD]
[TD]12[/TD]
[TD]14[/TD]
[TD]45[/TD]
[TD]14[/TD]
[TD]85 (51%)[/TD]
[/TR]
[TR="bgcolor: #F5F5F5"]
Unknown [TD]1[/TD]
[TD]0[/TD]
[TD]0[/TD]
[TD]1[/TD]
[TD]0[/TD]
[TD]1 (1%)[/TD]
[/TR]
[TR]
Total [TD]134[/TD]
[TD]31[/TD]
[TD]16[/TD]
[TD]87[/TD]
[TD]32[/TD]
[TD]166[/TD]
[/TR]
[TR="bgcolor: #F5F5F5"]
% [TD]81%[/TD]
[TD]23%[/TD]
[TD]12%[/TD]
[TD]65%[/TD]
[TD]19%[/TD]
[TD]100%[/TD]
[/TR]
[/TABLE]
[h=4]Figure 7. Percentage of hospitalizations, ICU admissions and deaths with influenza reported by age-group (≥16 year of age), Canada 2015-16[/h]
2016-w06-fg7-eng.jpg
Note: The number of hospitalizations reported through CIRN-SOS and IMPACT represents a subset of all influenza-associated adult and paediatric hospitalizations in Canada. Delays in the reporting of data may cause data to change retrospectively.
Figure 7 - Text Description [h=2]Provincial/Territorial Influenza Hospitalizations and Deaths[/h] In week 06, 125 hospitalizations have been reported from participating provinces and territoriesFootnote*. The majority of hospitalizations were due to influenza A (86%). The 0-4 and 45-64 age groups accounted for the largest proportion of cases reported in week 06, each representing 26% of hospitalized cases. The high proportion of hospitalizations reported in these age groups in week 06 were also reported in the sentinel hospital networks.
Since the start of the 2015-16 season, 867 laboratory-confirmed influenza-associated hospitalizations have been reported. A total of 767 hospitalizations (89%) were due to influenza A and 100 (11%) were due to influenza B. Among cases for which the subtype of influenza A was reported, 86% (433/502) were influenza A(H1N1). The highest proportion (30%) of hospitalized cases of were among those aged ≥65 years; however, the 45-64 and 0-4 age groups followed closely representing 26% and 21% of hospitalized cases respectively. Ninety-one ICU admissions have been reported.The highest proportion of ICU admissions was reported in the 45-64 age group (45%). Among ICU admissions for which the subtype of influenza A was reported, 92% were due to influenza A(H1N1). A total of 22 deaths have been reported, all due to influenza A. The majority of deaths were reported in adults 65+ of age (46%).
[h=3]Figure 8. Percentage of hospitalizations, ICU admissions and deaths with influenza reported by age-group, Canada 2015-16[/h]
2016-w06-fg8-eng.jpg
Figure 8 - Text Description Footnote * Note: Influenza-associated hospitalizations are not reported to PHAC by the following Provinces and Territory: BC, NU, and QC. Only hospitalizations that require intensive medical care are reported by SK. ICU admissions are not distinguished among hospital admissions reported from ON. Data may also include cases reported by the IMPACT networks. The number of new influenza-associated hospitalizations and deaths reported for the current week may include cases from ON that occurred in previous weeks, as a result of retrospective updates to the cumulative total. It is important to note that the hospitalization or death does not have to be attributable to influenza, a positive laboratory test is sufficient for reporting.
Return to footnote*referrer
See additional data on Reported Influenza Hospitalizations and Deaths in Canada: 2011-12 to 2015-16 on the Public Health Agency of Canada website.
[h=2]Influenza Strain Characterizations[/h] During the 2015-16 influenza season, the National Microbiology Laboratory (NML) has characterized 411 influenza viruses [118 A(H3N2), 206 A(H1N1) and 87 influenza B].
Influenza A (H3N2): When tested by hemagglutination inhibition (HI) assays, 23 H3N2 virus were antigenically characterized as A/Switzerland/9715293/2013-like using antiserum raised against cell-propagated A/Switzerland/9715293/2013.
Sequence analysis was done on 95 H3N2 viruses. All viruses belonged to a genetic group for which most viruses were antigenically related to A/Switzerland/9715293/2013.
A/Switzerland/9715293/2013 is the A(H3N2) component of the 2015-16 Northern Hemisphere's vaccine.
Influenza A (H1N1): 206 H1N1 viruses characterized were antigenically similar to A/California/7/2009, the A(H1N1) component of the 2015-16 influenza vaccine.
Influenza B: 36 influenza B viruses characterized were antigenically similar to the vaccine strain B/Phuket/3073/2013. 51 influenza B viruses were characterized as B/Brisbane/60/2008-like, one of the influenza B components of the 2015-16 Northern Hemisphere quadrivalent influenza vaccine. The recommended components for the 2015-2016 northern hemisphere trivalent influenza vaccine include: an A/California/7/2009(H1N1)pdm09-like virus, an /Switzerland/9715293/2013(H3N2)-like virus, and a B/Phuket/3073/2013 -like virus (Yamagata lineage). For quadrivalent vaccines, the addition of a B/Brisbane/60/2008-like virus (Victoria lineage) is recommended.
The NML receives a proportion of the number of influenza positive specimens from provincial laboratories for strain characterization and antiviral resistance testing. Characterization data reflect the results of haemagglutination inhibition testing compared to the reference influenza strains recommended by WHO.
...

http://healthycanadians.gc.ca/publi...-2016-06-surveillance-influenza/index-eng.php
 
[h=1]FluWatch report: February 14, 2016 - February 20, 2016 (week 07)[/h] [h=2]Overall Summary[/h]
  • Overall in week 07, influenza confirmations continued to increase slightly with greater geographic spread
  • Pediatric hospitalizations reported by the IMPACT network continue to substantially increase, reaching 94 hospitalizations in week 07.
  • Young/middle age adults are accounting for an increasing proportion of hospitalizations and laboratory confirmed cases as reported by participating provinces and territories.
  • An increase in the number of outbreaks was reported in week 07 with the majority of outbreaks reported in long-term care facilities.
  • Influenza A(H1N1) remains the most common influenza subtype circulating in Canada.
  • The World Health Organization has released their recommended composition of influenza virus vaccines for use in the 2016-2017 northern hemisphere influenza season.
  • For more information on the flu, see our Flu(influenza) web page.

pubpdf07-eng.jpg
Download the alternative format
(PDF format, 862 KB, 8 pages)
Organization: Public Health Agency of Canada
Date published: 2016-02-26

[h=2]Related Topics[/h]

Are you a primary health care practitioner (General Practitioner, Nurse Practitioner or Registered Nurse) interested in becoming a FluWatch sentinel for the 2015-16 influenza season? Contact us at FluWatch@phac-aspc.gc.ca


[h=2]On this page[/h]
[h=2]Influenza/Influenza-like Illness Activity (geographic spread)[/h] In week 07, a larger proportion of regions reported elevated activity levels. A total of 29 regions across Canada reported sporadic influenza/ILI activity. Localized activity was reported in 15 regions in Canada and widespread activity was reported in one region of Quebec.
[h=3]Figure 1. Map of overall influenza/ILI activity level by province and territory, Canada, Week 07[/h]
fg1-legend-eng.gif


Note: Influenza/ILI activity levels, as represented on this map, are assigned and reported by Provincial and Territorial Ministries of Health, based on laboratory confirmations, sentinel ILI rates and reported outbreaks. Please refer to detailed definitions at the end of the report. Maps from previous weeks, including any retrospective updates, are available in the mapping feature found in the Weekly Influenza Reports.
Figure 1 - Text Description [h=2]Laboratory Confirmed Influenza Detections[/h] Laboratory confirmed influenza detections continued to increase. The percent positive for influenza increased from 25% in week 06 to 29% in week 07 (Figure 2). Compared to the previous five seasons, the percent positive (29%) reported in week 07 was above the five year average for that week and exceeded the expected levels (range 13.0%-19.7%). With the late start to the 2015-16 influenza season, these above normal levels are not unexpected and are typical of peak season levels.
[h=3]Figure 2. Number of positive influenza tests and percentage of tests positive, by type, subtype and report week, Canada, 2015-16[/h]
2016-w07-fg2-eng.jpg
Figure 2 - Text Description In week 07, there were 2,453 positive influenza tests reported. Influenza A(H1N1) was the most common subtype detected. The majority of influenza detections were reported in the provinces of AB, ON and QC. Increased detections of influenza in the central and eastern provinces have been noted in the last few weeks. To date, 83% of influenza detections have been influenza A and among those subtyped, the majority have been influenza A(H1N1) [85% (3963/4654)].
[h=3]Figure 3. Cumulative numbers of positive influenza specimens by type/subtype and province, Canada, 2015-16[/h]
2016-w07-fg3-eng.png
Note: Specimens from NT, YT, and NU are sent to reference laboratories in other provinces. Cumulative data includes updates to previous weeks.
Figure 3 - Text Description To date this season, detailed information on age and type/subtype has been received for 7,622 cases. Adults aged 20-44 years accounted for the greatest proportion of influenza cases (Table 1). Adults aged 20-44 and 45-64 years accounted for 57% of reported influenza A(H1N1) cases. Children 5-19 years and adults 20-44 years accounted for 60% of all influenza B cases reported.

[TABLE="class: table-responsive table table-condensed table-striped table-hover table-bordered, width: 1140, height: 0"]
Table 1. Weekly and cumulative numbers of positive influenza specimens by type, subtype and age-group reported through case-based laboratory reportingTable 1 - Footnote1, Canada, 2015-16 [TR="class: bg-primary, bgcolor: #2572B4"]
Age groups (years) Weekly (February 14 to February 20, 2016) Cumulative (August 30, 2015 to February 20, 2016) [/TR]
[TR="class: bg-primary, bgcolor: #2572B4"]
Influenza A B Influenza A B Influenza A and B [/TR]
[TR="class: bg-primary, bgcolor: #2572B4"]
A Total A(H1) pdm09 A(H3) A UnSTable 1 - Footnote3 Total A Total A(H1) pdm09 A(H3) A UnSTable 1 - Footnote3 Total # % [/TR]
[TR]
[TD="colspan: 13"] Table 1 - Footnote 1 Table 1 includes specimens for which demographic information was reported. These represent a subset of all positive influenza cases reported.
Return to Table 1 - Footnote1referrer
Table 1 - Footnote 2 Percentage of tests positive for sub-types of influenza A are a percentage of all influenza A detections.
Return to Table 1 - Footnote2referrer
Table 1 - Footnote 3 Unsubtyped: The specimen was typed as influenza A, but no result for subtyping was available.
Return to Table 1 - Footnote3referrer
Table 1 - Footnote 4 x - Suppressed to prevent residual disclosure.
Return to Table 1 - Footnote4referrer
[/TD]
[/TR]
[TR="bgcolor: #F5F5F5"]
<5 [TD="class: text-right"]289[/TD]
[TD="class: text-right"]129[/TD]
[TD="class: text-right"]<5[/TD]
[TD="class: text-right"]xTable 1 - Footnote4[/TD]
[TD="class: text-right"]36[/TD]
[TD="class: text-right"]1089[/TD]
[TD="class: text-right"]681[/TD]
[TD="class: text-right"]42[/TD]
[TD="class: text-right"]366[/TD]
[TD="class: text-right"]157[/TD]
[TD="class: text-right"]1246[/TD]
[TD="class: text-right"]16.3%[/TD]
[/TR]
[TR]
5-19 [TD="class: text-right"]160[/TD]
[TD="class: text-right"]59[/TD]
[TD="class: text-right"]<5[/TD]
[TD="class: text-right"]xTable 1 - Footnote4[/TD]
[TD="class: text-right"]51[/TD]
[TD="class: text-right"]716[/TD]
[TD="class: text-right"]439[/TD]
[TD="class: text-right"]65[/TD]
[TD="class: text-right"]212[/TD]
[TD="class: text-right"]387[/TD]
[TD="class: text-right"]1103[/TD]
[TD="class: text-right"]14.5%[/TD]
[/TR]
[TR="bgcolor: #F5F5F5"]
20-44 [TD="class: text-right"]413[/TD]
[TD="class: text-right"]174[/TD]
[TD="class: text-right"]<5[/TD]
[TD="class: text-right"]xTable 1 - Footnote4[/TD]
[TD="class: text-right"]76[/TD]
[TD="class: text-right"]1812[/TD]
[TD="class: text-right"]1153[/TD]
[TD="class: text-right"]101[/TD]
[TD="class: text-right"]558[/TD]
[TD="class: text-right"]402[/TD]
[TD="class: text-right"]2214[/TD]
[TD="class: text-right"]29.0%[/TD]
[/TR]
[TR]
45-64 [TD="class: text-right"]357[/TD]
[TD="class: text-right"]142[/TD]
[TD="class: text-right"]<5[/TD]
[TD="class: text-right"]xTable 1 - Footnote4[/TD]
[TD="class: text-right"]37[/TD]
[TD="class: text-right"]1598[/TD]
[TD="class: text-right"]926[/TD]
[TD="class: text-right"]138[/TD]
[TD="class: text-right"]534[/TD]
[TD="class: text-right"]188[/TD]
[TD="class: text-right"]1786[/TD]
[TD="class: text-right"]23.4%[/TD]
[/TR]
[TR="bgcolor: #F5F5F5"]
65+ [TD="class: text-right"]239[/TD]
[TD="class: text-right"]82[/TD]
[TD="class: text-right"]10[/TD]
[TD="class: text-right"]147[/TD]
[TD="class: text-right"]33[/TD]
[TD="class: text-right"]1084[/TD]
[TD="class: text-right"]429[/TD]
[TD="class: text-right"]264[/TD]
[TD="class: text-right"]391[/TD]
[TD="class: text-right"]189[/TD]
[TD="class: text-right"]1273[/TD]
[TD="class: text-right"]16.7%[/TD]
[/TR]
[TR]
Total [TD="class: text-right"]1,458[/TD]
[TD="class: text-right"]586[/TD]
[TD="class: text-right"]17[/TD]
[TD="class: text-right"]855[/TD]
[TD="class: text-right"]233[/TD]
[TD="class: text-right"]6299[/TD]
[TD="class: text-right"]3628[/TD]
[TD="class: text-right"]610[/TD]
[TD="class: text-right"]2061[/TD]
[TD="class: text-right"]1323[/TD]
[TD="class: text-right"]7622[/TD]
[TD="class: text-right"]100.0%[/TD]
[/TR]
[TR="bgcolor: #F5F5F5"]
PercentageTable 1 - Footnote2 [TD="class: text-right"]86.2%[/TD]
[TD="class: text-right"]40.2%[/TD]
[TD="class: text-right"]1.2%[/TD]
[TD="class: text-right"]58.6%[/TD]
[TD="class: text-right"]13.8%[/TD]
[TD="class: text-right"]82.6%[/TD]
[TD="class: text-right"]57.6%[/TD]
[TD="class: text-right"]9.7%[/TD]
[TD="class: text-right"]32.7%[/TD]
[TD="class: text-right"]17.4%[/TD]
[TD="class: text-right"] [/TD]
[TD="class: text-right"] [/TD]
[/TR]
[/TABLE]
For data on other respiratory virus detections see the Respiratory Virus Detections in Canada Report on the Public Health Agency of Canada website.
[h=2]Influenza-like Illness Consultation Rate[/h] The national ILI consultation rate decreased from the previous week from 51.0 per 1,000 patient visits in week 06, to 41.6 per 1,000 patient visits in week 07. In week 07, the highest ILI consultation rate was found in adults 20-64 years of age (47.4 per 1,000) and the lowest was found in the ≥65 years age group (8.8 per 1,000) (Figure 4).
[h=3]Figure 4. Influenza-like-illness (ILI) consultation rates by age group and week, Canada, 2015-16[/h]
2016-w07-fg4-eng.jpg
Delays in the reporting of data may cause data to change retrospectively. In BC, AB, and SK, data are compiled by a provincial sentinel surveillance program for reporting to FluWatch. Not all sentinel physicians report every week.
Figure 4 - Text Description [h=2]Pharmacy Surveillance[/h] During week 07, the proportion of prescriptions for antivirals increased to 80.2 antiviral prescriptions per 100,000 total prescriptions, which is lower than the five year historical average (5). The rates were highest in children (173.1 per 100,000 total prescriptions).
[h=3]Figure 5. Influenza-like-illness (ILI) consultation rates by age group and week, Canada, 2015-16[/h]
2016-w07-fg5-eng.jpg
Note: Pharmacy sales data are provided to the Public Health Agency of Canada by Rx Canada Inc. and sourced from major retail drug chains representing over 3,000 stores nationwide (excluding Nunavut) in 85% of Health Regions. Data provided include the number of new antiviral prescriptions (for Tamiflu and Relenza) and the total number of new prescriptions dispensed by Province/Territory and age group.
* The average weekly proportion includes data from April 2011 to March 2015.
Figure 5 - Text Description [h=2]Influenza Outbreak Surveillance[/h] In week 07, 27 new laboratory confirmed influenza outbreaks were reported: 17 in long-term care facilities (LTCF), eight in institutions or community settings and two in hospitals. Of the outbreaks with known strains or subtypes, two outbreaks were due to Influenza A(H1N1) and one outbreak was due to influenza B. Additionally, two ILI outbreaks were reported in schools.
To date this season,131 outbreaks have been reported. At week 07 in the 2014-15 season, 1,367 outbreaks were reported and in the 2013-14 season,118 outbreaks were reported.
[h=3]Figure 6. Overall number of new laboratory-confirmed influenza outbreaksFigure 5 - Footnote1 by report week, Canada, 2015-2016[/h]
2016-w07-fg6-eng.jpg
Figure 5 - Footnote 1 All provinces and territories except NU report influenza outbreaks in long-term care facilities. All provinces and territories with the exception of NU and QC report outbreaks in hospitals. Outbreaks of influenza or influenza-like-illness in other facilities are reported to FluWatch but reporting varies between jurisdictions. Outbreak definitions are included at the end of the report.
Return to Figure 5 - Footnote1referrer
Figure 6 - Text Description [h=2]Sentinel Pediatric Hospital Influenza Surveillance[/h] [h=3]Paediatric Influenza Hospitalizations and Deaths[/h] In week 07, 94 hospitalizations were reported by the the Immunization Monitoring Program Active (IMPACT) network (Figure 7). Eighteen hospitalizations were due to influenza A(H1N1) (19%), 18 were due to influenza B (19%) and the remainder were influenza A (UnS).
To date this season, 350 laboratory-confirmed influenza-associated paediatric (≤16 years of age) hospitalizations have been reported by the IMPACT network: 281 hospitalized cases were due to influenza A and 69 cases were due to influenza B. The largest proportion of hospitalized cases were among children aged 2-4 years (31%). To date, 55 intensive care unit (ICU) admissions have been reported. The largest proportion of ICU admissions were reported in children 2-9 years (51%). Less than five influenza-associated deaths have been reported.

[TABLE="class: table table-condensed table-striped table-hover table-bordered, width: 1140"]
Table 2 - Cumulative numbers of peadiatric hospitalizations (≤16 years of age) with influenza reported by the IMPACT network, Canada, 2015-16 [TR="class: bg-primary, bgcolor: #2572B4"]
Age Groups Cumulative (30 Aug. 2015 to 20 February 2016) [/TR]
[TR="class: bg-primary, bgcolor: #2572B4"]
Influenza A Influenza B Influenza A and B (#(%)) [/TR]
[TR="class: bg-primary, bgcolor: #2572B4"]
A Total A(H1) pdm09 A(H3) A (UnS) B Total [/TR]
[TR="bgcolor: #F5F5F5"]
0-5m [TD="class: text-right"]37[/TD]
[TD="class: text-right"]11[/TD]
[TD="class: text-right"]<5[/TD]
[TD="class: text-right"]xTable 2 - Footnote1[/TD]
[TD="class: text-right"]6[/TD]
[TD="class: text-right"]43 (12%)[/TD]
[/TR]
[TR]
6-23m [TD="class: text-right"]74[/TD]
[TD="class: text-right"]34[/TD]
[TD="class: text-right"]<5[/TD]
[TD="class: text-right"]xTable 2 - Footnote1[/TD]
[TD="class: text-right"]13[/TD]
[TD="class: text-right"]87 (25%)[/TD]
[/TR]
[TR="bgcolor: #F5F5F5"]
2-4y [TD="class: text-right"]88[/TD]
[TD="class: text-right"]38[/TD]
[TD="class: text-right"]<5[/TD]
[TD="class: text-right"]xTable 2 - Footnote1[/TD]
[TD="class: text-right"]19[/TD]
[TD="class: text-right"]107 (31%)[/TD]
[/TR]
[TR]
5-9y [TD="class: text-right"]59[/TD]
[TD="class: text-right"]22[/TD]
[TD="class: text-right"]0[/TD]
[TD="class: text-right"]37[/TD]
[TD="class: text-right"]21[/TD]
[TD="class: text-right"]80 (23%)[/TD]
[/TR]
[TR="bgcolor: #F5F5F5"]
10-16y [TD="class: text-right"]23[/TD]
[TD="class: text-right"]10[/TD]
[TD="class: text-right"]<5[/TD]
[TD="class: text-right"]xTable 2 - Footnote1[/TD]
[TD="class: text-right"]10[/TD]
[TD="class: text-right"]33 (9%)[/TD]
[/TR]
[TR]
Total [TD="class: text-right"]281[/TD]
[TD="class: text-right"]115[/TD]
[TD="class: text-right"]11[/TD]
[TD="class: text-right"]155[/TD]
[TD="class: text-right"]69[/TD]
[TD="class: text-right"]350 (100%)[/TD]
[/TR]
[TR]
[TD="colspan: 13"] Table 2 - Footnote 1 x - Suppressed to prevent residual disclosure
Return to Table 1 - Footnote1referrer
[/TD]
[/TR]
[/TABLE]
[h=4]Figure 7. Number of cases of influenza reported by sentinel hospital networks, by week, Canada, 2015-16, paediatric and adult hospitalizations (≤16 years of age, IMPACT; ≥16 years of age, CIRN-SOS)[/h]
2016-w07-fg7-eng.jpg
Not included in Table 2 and Figure 7 are two IMPACT cases that were due to co-infections of influenza A and B.
Figure 7 - Text Description [h=3]Adult Influenza Hospitalizations and Deaths[/h] In week 07, 51 hospitalizations were reported by the Canadian Immunization Research Network Serious Outcome Surveillance (CIRN-SOS). The majority of hospitalizations were in adults 45-64 and 65+ years of age (84%) and due to influenza A (93%).
To date this season, 225 laboratory-confirmed influenza-associated adult (≥16 years of age) hospitalizations have been reported by CIRN-SOS (Table 3). The majority of hospitalized cases were due to influenza A (84%) and the largest reported proption were among adults ≥65 years of age (50%). Twenty-four intensive care unit (ICU) admissions have been reported and among those, 22 (92%) were due to influenza A. Six deaths have been reported this season.
[TABLE="class: table table-condensed table-striped table-hover table-bordered, width: 1140"]
Table 3 - Cumulative numbers of adult hospitalizations (≥16 years of age) with influenza reported by the CIRN-SOS network, Canada, 2015-16 [TR="class: bg-primary, bgcolor: #2572B4"]
Age groups (years) Cumulative (1 Nov. 2015 to 20 Feb. 2016) [/TR]
[TR="class: bg-primary, bgcolor: #2572B4"]
Influenza A B Influenza A and B [/TR]
[TR="class: bg-primary, bgcolor: #2572B4"]
A Total A(H1) pdm09 A(H3) A(UnS) Total # (%) [/TR]
[TR="bgcolor: #F5F5F5"]
16-20 [TD="class: text-right"]<5[/TD]
[TD="class: text-right"]<5[/TD]
[TD="class: text-right"]<5[/TD]
[TD="class: text-right"]<5[/TD]
[TD="class: text-right"]<5[/TD]
[TD="class: text-right"]<5 (x%)[/TD]
[/TR]
[TR]
20-44 [TD="class: text-right"]23[/TD]
[TD="class: text-right"]8[/TD]
[TD="class: text-right"]0[/TD]
[TD="class: text-right"]15[/TD]
[TD="class: text-right"]13[/TD]
[TD="class: text-right"]36 (16%)[/TD]
[/TR]
[TR="bgcolor: #F5F5F5"]
45-64 [TD="class: text-right"]66[/TD]
[TD="class: text-right"]19[/TD]
[TD="class: text-right"]<5[/TD]
[TD="class: text-right"]x[/TD]
[TD="class: text-right"]7[/TD]
[TD="class: text-right"]73 (32%)[/TD]
[/TR]
[TR]
65+ [TD="class: text-right"]97[/TD]
[TD="class: text-right"]16[/TD]
[TD="class: text-right"]14[/TD]
[TD="class: text-right"]67[/TD]
[TD="class: text-right"]15[/TD]
[TD="class: text-right"]112 (50%)[/TD]
[/TR]
[TR="bgcolor: #F5F5F5"]
Unknown [TD="class: text-right"]<5[/TD]
[TD="class: text-right"]<5[/TD]
[TD="class: text-right"]<5[/TD]
[TD="class: text-right"]<5[/TD]
[TD="class: text-right"]<5[/TD]
[TD="class: text-right"]<5 (x%)[/TD]
[/TR]
[TR]
Total [TD="class: text-right"]189[/TD]
[TD="class: text-right"]44[/TD]
[TD="class: text-right"]16[/TD]
[TD="class: text-right"]129[/TD]
[TD="class: text-right"]36[/TD]
[TD="class: text-right"]225[/TD]
[/TR]
[TR="bgcolor: #F5F5F5"]
% [TD="class: text-right"]84%[/TD]
[TD="class: text-right"]23%[/TD]
[TD="class: text-right"]8%[/TD]
[TD="class: text-right"]68%[/TD]
[TD="class: text-right"]16%[/TD]
[TD="class: text-right"]100%[/TD]
[/TR]
[TR]
[TD="colspan: 13"] x - Suppressed to prevent residual disclosure
[/TD]
[/TR]
[/TABLE]
[h=4]Figure 8. Percentage of hospitalizations, ICU admissions and deaths with influenza reported by age-group (≥16 year of age), Canada 2015-16[/h]
2016-w07-fg8-eng.jpg
Note: The number of hospitalizations reported through CIRN-SOS and IMPACT represents a subset of all influenza-associated adult and paediatric hospitalizations in Canada. Delays in the reporting of data may cause data to change retrospectively.
Figure 8 - Text Description [h=2]Provincial/Territorial Influenza Hospitalizations and Deaths[/h] In week 07, 222 hospitalizations have been reported from participating provinces and territoriesFootnote*. The majority of hospitalizations were due to influenza A (89%). The largest proportion of cases reported in week 07 were in children 0-19 years (39%).
Since the start of the 2015-16 season, 1,235 laboratory-confirmed influenza-associated hospitalizations have been reported. A total of 1,105 hospitalizations (90%) were due to influenza A and 56 (10%) were due to influenza B. Among cases for which the subtype of influenza A was reported, 89% (650/727) were influenza A(H1N1). The majority (29%) of hospitalized cases were ≥65 years of age. One hundred thirty-one ICU admissions have been reported of which 118 (90%) were due to influenza A and 57 (44%) were in the 45-64 age group. A total of 30 deaths have been reported, all due to influenza A. The largest proportion of deaths were reported in adults 45-64 and 65+ of age,representing 86% of deaths).
[h=3]Figure 9. Percentage of hospitalizations, ICU admissions and deaths with influenza reported by age-group, Canada 2015-16[/h]
2016-w07-fg9-eng.jpg
Figure 9 - Text Description Footnote * Note: Influenza-associated hospitalizations are not reported to PHAC by the following Provinces and Territory: BC, NU, and QC. Only hospitalizations that require intensive medical care are reported by SK. ICU admissions are not distinguished among hospital admissions reported from ON. Data may also include cases reported by the IMPACT networks. The number of new influenza-associated hospitalizations and deaths reported for the current week may include cases from ON that occurred in previous weeks, as a result of retrospective updates to the cumulative total. It is important to note that the hospitalization or death does not have to be attributable to influenza, a positive laboratory test is sufficient for reporting.
x - Suppressed to prevent residual disclosure
Return to footnote*referrer
See additional data on Reported Influenza Hospitalizations and Deaths in Canada: 2011-12 to 2015-16 on the Public Health Agency of Canada website.
[h=2]Influenza Strain Characterizations[/h] During the 2015-16 influenza season, the National Microbiology Laboratory (NML) has characterized 521 influenza viruses [122 A(H3N2), 268 A(H1N1) and 131 influenza B].
Influenza A (H3N2): When tested by hemagglutination inhibition (HI) assays, 27 H3N2 virus were antigenically characterized as A/Switzerland/9715293/2013-like using antiserum raised against cell-propagated A/Switzerland/9715293/2013.
Sequence analysis was done on 95 H3N2 viruses. All viruses belonged to a genetic group for which most viruses were antigenically related to A/Switzerland/9715293/2013. A/Switzerland/9715293/2013 is the A(H3N2) component of the 2015-16 Northern Hemisphere's vaccine.
Influenza A (H1N1): Two hundred and sixty-eight H1N1 viruses characterized were antigenically similar to A/California/7/2009, the A(H1N1) component of the 2015-16 influenza vaccine.
Influenza B:Forty-six influenza B viruses characterized were antigenically similar to the vaccine strain B/Phuket/3073/2013. Eighty-five influenza B viruses were characterized as B/Brisbane/60/2008-like, one of the influenza B components of the 2015-16 Northern Hemisphere quadrivalent influenza vaccine.
The WHO has released the recommended composition of the northern hemisphere influenza vaccine for the 2016-2017 season. Trivalent vaccines are recommended to contain 1) an A/California/7/2009 (H1N1)pdm09-like virus 2) an A/HongKong/4801/2014 (H3N2)-like virus, and 3) a B/Brisbane/60/2008-like virus (Victoria lineage). Quadrivalent vaccines are recommended to additionally contain a B/Phuket/30732013-like virus (Yamagata lineage).
The recommended components for the 2015-2016 northern hemisphere trivalent influenza vaccine include: an A/California/7/2009(H1N1)pdm09-like virus, an /Switzerland/9715293/2013(H3N2)-like virus, and a B/Phuket/3073/2013 -like virus (Yamagata lineage). For quadrivalent vaccines, the addition of a B/Brisbane/60/2008-like virus (Victoria lineage) is recommended.
The NML receives a proportion of the number of influenza positive specimens from provincial laboratories for strain characterization and antiviral resistance testing. Characterization data reflect the results of haemagglutination inhibition testing compared to the reference influenza strains recommended by WHO.

.../

http://healthycanadians.gc.ca/publi...-2016-07-surveillance-influenza/index-eng.php
 
[h=1]FluWatch report: February 21, 2016 - February 27, 2016 (week 08)[/h] [h=2]Overall Summary[/h]
  • Overall in week 08, influenza activity continued to increase; the Eastern provinces of Canada accounted for the majority of influenza laboratory confirmations.
  • In week 08, adults 65+ years of age accounted for the largest proportion of hospitalizations
  • The number of outbreaks reported in week 08 increased sharply from the previous week with the majority of outbreaks reported in long-term care facilities.
  • Influenza A(H1N1) remains the most common influenza subtype circulating in Canada.
  • For more information on the flu, see our Flu(influenza) web page.

pubpdf08-eng.gif
Download the alternative format
(PDF format, 847 KB, 9 pages)
Organization: Public Health Agency of Canada
Date published: 2016-03-04

[h=2]Related Topics[/h]

Are you a primary health care practitioner (General Practitioner, Nurse Practitioner or Registered Nurse) interested in becoming a FluWatch sentinel for the 2015-16 influenza season? Contact us at FluWatch@phac-aspc.gc.ca


[h=2]On this page[/h]
[h=2]Influenza/Influenza-like Illness Activity (geographic spread)[/h] In week 08, a larger proportion of regions reported elevated activity levels in the Eastern regions of Canada. A total of 20 regions across Canada reported sporadic influenza/ILI activity. Localized activity was reported in 20 regions in Canada and widespread activity was reported in one region of PE.
[h=3]Figure 1. Map of overall influenza/ILI activity level by province and territory, Canada, week 08[/h]
fg1-legend-eng.gif


Note: Influenza/ILI activity levels, as represented on this map, are assigned and reported by Provincial and Territorial Ministries of Health, based on laboratory confirmations, sentinel ILI rates and reported outbreaks. Please refer to detailed definitions at the end of the report. Maps from previous weeks, including any retrospective updates, are available in the mapping feature found in the Weekly Influenza Reports.
Figure 1 - Text Description [h=2]Laboratory Confirmed Influenza Detections[/h] Laboratory confirmed influenza detections continued to increase. The percent positive for influenza increased from 29% in week 07 to 33% in week 08 (Figure 2). Compared to the previous five seasons, the percent positive (33%) reported in week 08 was above the five year average for that week and exceeded the expected levels (range 13.0%-17.4%). With the late start to the 2015-16 influenza season, these above normal levels are not unexpected and are typical of peak season levels.
[h=3]Figure 2. Number of positive influenza tests and percentage of tests positive, by type, subtype and report week, Canada, 2015-16[/h]
2016-w08-fg2-eng.gif
Figure 2 - Text Description In week 08, there were 3,411 positive influenza tests reported. Influenza A(H1N1) continues to be the most common subtype detected. Increased detections of influenza in the central and eastern provinces have been noted in the last few weeks. In week 08, the majority of influenza detections were reported in the provinces of ON and QC (69%). To date, 87% of influenza detections have been influenza A and among those subtyped, the majority have been influenza A(H1N1) [85% (5272/6204)].
[h=3]Figure 3. Cumulative numbers of positive influenza specimens by type/subtype and province, Canada, 2015-16[/h]
2016-w08-fg3-eng.gif
Note: Specimens from NT, YT, and NU are sent to reference laboratories in other provinces. Cumulative data includes updates to previous weeks.
Figure 3 - Text Description To date this season, detailed information on age and type/subtype has been received for 10,686 cases. Adults aged 20-44 years accounted for the greatest proportion of influenza cases (Table 1). In week 8, children (aged 0-19 years) accounted for 41% of A(H1N1). Additionally, children aged 0-19 years accounted for 42% of influenza B confirmed cases to date this this season.
[TABLE="class: table-responsive table table-condensed table-striped table-hover table-bordered, width: 1140, height: 0"]
Table 1. Weekly and cumulative numbers of positive influenza specimens by type, subtype and age-group reported through case-based laboratory reportingTable 1 - Footnote1, Canada, 2015-16 [TR="class: bg-primary, bgcolor: #2572B4"]
Age groups (years) Weekly (February 21 to February 27, 2016) Cumulative (August 30, 2015 to February 27, 2016) [/TR]
[TR="class: bg-primary, bgcolor: #2572B4"]
Influenza A B Influenza A B Influenza A and B [/TR]
[TR="class: bg-primary, bgcolor: #2572B4"]
A Total A(H1) pdm09 A(H3) A UnSTable 1 - Footnote3 Total A Total A(H1) pdm09 A(H3) A UnSTable 1 - Footnote3 Total # % [/TR]
[TR]
[TD="colspan: 13"] Table 1 - Footnote 1 Table 1 includes specimens for which demographic information was reported. These represent a subset of all positive influenza cases reported.
Return to Table 1 - Footnote1referrer
Table 1 - Footnote 2 Percentage of tests positive for sub-types of influenza A are a percentage of all influenza A detections.
Return to Table 1 - Footnote2referrer
Table 1 - Footnote 3 Unsubtyped: The specimen was typed as influenza A, but no result for subtyping was available.
Return to Table 1 - Footnote3referrer
x - Suppressed to prevent residual disclosure.
[/TD]
[/TR]
[TR="bgcolor: #F5F5F5"]
<5 [TD]379[/TD]
[TD]112[/TD]
[TD]0[/TD]
[TD]267[/TD]
[TD]47[/TD]
[TD]1650[/TD]
[TD]932[/TD]
[TD]45[/TD]
[TD]673[/TD]
[TD]215[/TD]
[TD]1865[/TD]
[TD]17.5%[/TD]
[/TR]
[TR]
5-19 [TD]264[/TD]
[TD]124[/TD]
[TD]0[/TD]
[TD]140[/TD]
[TD]78[/TD]
[TD]1026[/TD]
[TD]587[/TD]
[TD]69[/TD]
[TD]370[/TD]
[TD]492[/TD]
[TD]1518[/TD]
[TD]14.2%[/TD]
[/TR]
[TR="bgcolor: #F5F5F5"]
20-44 [TD]499[/TD]
[TD]161[/TD]
[TD]<5[/TD]
[TD]x[/TD]
[TD]59[/TD]
[TD]2497[/TD]
[TD]1505[/TD]
[TD]107[/TD]
[TD]885[/TD]
[TD]484[/TD]
[TD]2981[/TD]
[TD]27.9%[/TD]
[/TR]
[TR]
45-64 [TD]450[/TD]
[TD]129[/TD]
[TD]<5[/TD]
[TD]x[/TD]
[TD]36[/TD]
[TD]2266[/TD]
[TD]1254[/TD]
[TD]146[/TD]
[TD]866[/TD]
[TD]237[/TD]
[TD]2503[/TD]
[TD]23.4%[/TD]
[/TR]
[TR="bgcolor: #F5F5F5"]
65+ [TD]338[/TD]
[TD]50[/TD]
[TD]9[/TD]
[TD]279[/TD]
[TD]38[/TD]
[TD]1577[/TD]
[TD]605[/TD]
[TD]288[/TD]
[TD]684[/TD]
[TD]242[/TD]
[TD]1819[/TD]
[TD]17.0%[/TD]
[/TR]
[TR]
Total [TD]1930[/TD]
[TD]576[/TD]
[TD]14[/TD]
[TD]1,340[/TD]
[TD]258[/TD]
[TD]9016[/TD]
[TD]4883[/TD]
[TD]655[/TD]
[TD]3478[/TD]
[TD]1670[/TD]
[TD]10686[/TD]
[TD]100.0%[/TD]
[/TR]
[TR="bgcolor: #F5F5F5"]
PercentageTable 1 - Footnote2 [TD]88.2%[/TD]
[TD]29.8%[/TD]
[TD]0.7%[/TD]
[TD]69.4%[/TD]
[TD]11.8%[/TD]
[TD]84.4%[/TD]
[TD]54.2%[/TD]
[TD]7.3%[/TD]
[TD]38.6%[/TD]
[TD]15.6%[/TD]
[TD] [/TD]
[TD] [/TD]
[/TR]
[/TABLE]
For data on other respiratory virus detections see the Respiratory Virus Detections in Canada Report on the Public Health Agency of Canada website.
[h=2]Influenza-like Illness Consultation Rate[/h] The national ILI consultation rate increased from the previous week from 41.6 per 1,000 patient visits in week 07, to 51.7 per 1,000 patient visits in week 08. In week 08, the highest ILI consultation rate was found in children 5-19 years of age (69.0 per 1,000) and the lowest was found in the ≥65 years age group (11.4 per 1,000) (Figure 4).
[h=3]Figure 4. Influenza-like-illness (ILI) consultation rates by age group and week, Canada, 2015-16[/h]
2016-w08-fg4-eng.gif
Delays in the reporting of data may cause data to change retrospectively. In BC, AB, and SK, data are compiled by a provincial sentinel surveillance program for reporting to FluWatch. Not all sentinel physicians report every week.
Figure 4 - Text Description [h=2]Pharmacy Surveillance[/h] During week 08, the proportion of prescriptions for antivirals increased to 88.4 antiviral prescriptions per 100,000 total prescriptions, which is lower than the five year historical average. The proportions were highest in children aged 2-18 years (233.4 per 100,000 total prescriptions).
[h=3]Figure 5. Influenza-like-illness (ILI) consultation rates by age group and week, Canada, 2015-16[/h]
2016-w08-fg5-eng.gif
Note: Pharmacy sales data are provided to the Public Health Agency of Canada by Rx Canada Inc. and sourced from major retail drug chains representing over 3,000 stores nationwide (excluding Nunavut) in 85% of Health Regions. Data provided include the number of new antiviral prescriptions (for Tamiflu and Relenza) and the total number of new prescriptions dispensed by Province/Territory and age group.
* The average weekly proportion includes data from April 2011 to March 2015.
Figure 5 - Text Description [h=2]Influenza Outbreak Surveillance[/h] In week 08, 38 new laboratory confirmed influenza outbreaks were reported: 25 in long-term care facilities (LTCF), seven in institutions or community settings and six in hospitals. Of the outbreaks with known strains or subtypes, one outbreak was due to Influenza A(H3N2) and three outbreaks were due to influenza B. Additionally, five ILI outbreaks were reported in schools.
To date this season,176 outbreaks have been reported. At week 08 in the 2014-15 season, 1,398 outbreaks were reported and in the 2013-14 season,134 outbreaks were reported.
[h=3]Figure 6. Overall number of new laboratory-confirmed influenza outbreaksFigure 5 - Footnote1 by report week, Canada, 2015-2016[/h]
2016-w08-fg6-eng.gif
Figure 6 - Footnote 1 All provinces and territories except NU report influenza outbreaks in long-term care facilities. All provinces and territories with the exception of NU and QC report outbreaks in hospitals. Outbreaks of influenza or influenza-like-illness in other facilities are reported to FluWatch but reporting varies between jurisdictions. Outbreak definitions are included at the end of the report.
Return to Figure 5 - Footnote1referrer
Figure 6 - Text Description [h=2]Sentinel Pediatric Hospital Influenza Surveillance[/h] [h=3]Paediatric Influenza Hospitalizations and Deaths[/h] In week 08, 121 hospitalizations were reported by the the Immunization Monitoring Program Active (IMPACT) network (Figure 7). Thirty-five hospitalizations were due to influenza A(H1N1) (29.0%), 18 were due to influenza B (15%) and the remainder were influenza A (UnS).
To date this season, 480 laboratory-confirmed influenza-associated paediatric (≤16 years of age) hospitalizations have been reported by the IMPACT network: 390 hospitalized cases were due to influenza A and 90 cases were due to influenza B. The largest proportion of hospitalized cases were among children under the age of 2 years (37%). To date, 73 intensive care unit (ICU) admissions have been reported. ICU admissions were approximately equally distributed across ages with slightly smaller proportions of children 10-16 years admitted. Less than five influenza-associated deaths have been reported.
[TABLE="class: table table-condensed table-striped table-hover table-bordered, width: 1140"]
Table 2 - Cumulative numbers of peadiatric hospitalizations (≤16 years of age) with influenza reported by the IMPACT network, Canada, 2015-16 [TR="class: bg-primary, bgcolor: #2572B4"]
Age Groups Cumulative (30 Aug. 2015 to 27 February 2016) [/TR]
[TR="class: bg-primary, bgcolor: #2572B4"]
Influenza A Influenza B Influenza A and B (#(%)) [/TR]
[TR="class: bg-primary, bgcolor: #2572B4"]
A Total A(H1) pdm09 A(H3) A (UnS) B Total [/TR]
[TR]
[TD="colspan: 7"] x - Suppressed to prevent residual disclosure.
[/TD]
[/TR]
[TR="bgcolor: #F5F5F5"]
0-5m [TD]42[/TD]
[TD]13[/TD]
[TD]<5[/TD]
[TD]x[/TD]
[TD]7[/TD]
[TD]49 (10%)[/TD]
[/TR]
[TR]
6-23m [TD]113[/TD]
[TD]47[/TD]
[TD]7[/TD]
[TD]59[/TD]
[TD]18[/TD]
[TD]131 (27%)[/TD]
[/TR]
[TR="bgcolor: #F5F5F5"]
2-4y [TD]117[/TD]
[TD]50[/TD]
[TD]<5[/TD]
[TD]x[/TD]
[TD]25[/TD]
[TD]142 (30%)[/TD]
[/TR]
[TR]
5-9y [TD]85[/TD]
[TD]29[/TD]
[TD]<5[/TD]
[TD]x[/TD]
[TD]26[/TD]
[TD]111 (23%)[/TD]
[/TR]
[TR="bgcolor: #F5F5F5"]
10-16y [TD]85[/TD]
[TD]29[/TD]
[TD]<5[/TD]
[TD]x[/TD]
[TD]26[/TD]
[TD]47 (10%)[/TD]
[/TR]
[TR]
Total [TD]390[/TD]
[TD]153[/TD]
[TD]18[/TD]
[TD]219[/TD]
[TD]90[/TD]
[TD]480 (100%)[/TD]
[/TR]
[/TABLE]
[h=4]Figure 7. Number of cases of influenza reported by sentinel hospital networks, by week, Canada, 2015-16, paediatric and adult hospitalizations (≤16 years of age, IMPACT; ≥16 years of age, CIRN-SOS)[/h]
2016-w08-fg7-eng.gif
Not included in Table 2 and Figure 7 are two IMPACT cases that were due to co-infections of influenza A and B.
Figure 7 - Text Description [h=3]Adult Influenza Hospitalizations and Deaths[/h] In week 08, 88 hospitalizations were reported by the Canadian Immunization Research Network Serious Outcome Surveillance (CIRN-SOS). The largest proportion of hospitalizations were in adults 65+ years of age (45%) and due to influenza A (88%).
To date this season, 347 laboratory-confirmed influenza-associated adult (≥16 years of age) hospitalizations have been reported by CIRN-SOS (Table 3). The majority of hospitalized cases were due to influenza A (86%) and the largest reported proption were among adults ≥65 years of age (50%). Forty-four intensive care unit (ICU) admissions have been reported and among those, 40 (91%) were due to influenza A. Twelve deaths have been reported this season.
[TABLE="class: table table-condensed table-striped table-hover table-bordered, width: 1140"]
Table 3 - Cumulative numbers of adult hospitalizations (≥16 years of age) with influenza reported by the CIRN-SOS network, Canada, 2015-16 [TR="class: bg-primary, bgcolor: #2572B4"]
Age groups (years) Cumulative (1 Nov. 2015 to 27 Feb. 2016) [/TR]
[TR="class: bg-primary, bgcolor: #2572B4"]
Influenza A B Influenza A and B [/TR]
[TR="class: bg-primary, bgcolor: #2572B4"]
A Total A(H1) pdm09 A(H3) A(UnS) Total # (%) [/TR]
[TR]
[TD="colspan: 7"] x - Suppressed to prevent residual disclosure.
[/TD]
[/TR]
[TR="bgcolor: #F5F5F5"]
16-20 [TD]<5[/TD]
[TD]<5[/TD]
[TD]x[/TD]
[TD]<5[/TD]
[TD]x[/TD]
[TD]3 (1%)[/TD]
[/TR]
[TR]
20-44 [TD]43[/TD]
[TD]14[/TD]
[TD]0[/TD]
[TD]29[/TD]
[TD]15[/TD]
[TD]58 (17%)[/TD]
[/TR]
[TR="bgcolor: #F5F5F5"]
45-64 [TD]103[/TD]
[TD]25[/TD]
[TD]<5[/TD]
[TD]x[/TD]
[TD]9[/TD]
[TD]112 (32%)[/TD]
[/TR]
[TR]
65+ [TD]149[/TD]
[TD]24[/TD]
[TD]16[/TD]
[TD]109[/TD]
[TD]22[/TD]
[TD]171 (49%)[/TD]
[/TR]
[TR="bgcolor: #F5F5F5"]
Unknown [TD]<5[/TD]
[TD]x[/TD]
[TD]x[/TD]
[TD]<5[/TD]
[TD]<5[/TD]
[TD]3 (1%)[/TD]
[/TR]
[TR]
Total [TD]300[/TD]
[TD]65[/TD]
[TD]18[/TD]
[TD]217[/TD]
[TD]47[/TD]
[TD]347[/TD]
[/TR]
[TR="bgcolor: #F5F5F5"]
% [TD]86%[/TD]
[TD]22%[/TD]
[TD]6%[/TD]
[TD]72%[/TD]
[TD]14%[/TD]
[TD]100%[/TD]
[/TR]
[/TABLE]
[h=4]Figure 8. Percentage of hospitalizations, ICU admissions and deaths with influenza reported by age-group (≥16 year of age), Canada 2015-16[/h]
2016-w08-fg8-eng.gif
Note: The number of hospitalizations reported through CIRN-SOS and IMPACT represents a subset of all influenza-associated adult and paediatric hospitalizations in Canada. Delays in the reporting of data may cause data to change retrospectively.
x - Suppressed to prevent residual disclosure.
Figure 8 - Text Description [h=2]Provincial/Territorial Influenza Hospitalizations and Deaths[/h] In week 08, 276 hospitalizations have been reported from participating provinces and territoriesFootnote*. The majority of hospitalizations were due to influenza A (88%). The largest proportion of cases reported in week 08 were in adults 65+ years of age (29%) followed by adults 45-64 years (18%)
Since the start of the 2015-16 season, 1,632 laboratory-confirmed influenza-associated hospitalizations have been reported. A total of 1,451 hospitalizations (89%) were due to influenza A and 181 (11%) were due to influenza B. Among cases for which the subtype of influenza A was reported, 91% (834/921) were influenza A(H1N1). The largest proportion (28%) of hospitalized cases were ≥65 years of age. One hundred seventy-eight ICU admissions have been reported of which 161 (90%) were due to influenza A and 78 (44%) were in the 45-64 age group. A total of 36 deaths have been reported, all due to influenza A. The largest proportion of deaths were reported in adults 65+ years of age,representing 47% of deaths.
[h=3]Figure 9. Percentage of hospitalizations, ICU admissions and deaths with influenza reported by age-group, Canada 2015-16[/h]
2016-w08-fg9-eng.gif
Figure 9 - Text Description Footnote * Note: Influenza-associated hospitalizations are not reported to PHAC by the following Provinces and Territory: BC, NU, and QC. Only hospitalizations that require intensive medical care are reported by SK. ICU admissions are not distinguished among hospital admissions reported from ON. Data may also include cases reported by the IMPACT networks. The number of new influenza-associated hospitalizations and deaths reported for the current week may include cases from ON that occurred in previous weeks, as a result of retrospective updates to the cumulative total. It is important to note that the hospitalization or death does not have to be attributable to influenza, a positive laboratory test is sufficient for reporting.
Return to footnote*referrer
See additional data on Reported Influenza Hospitalizations and Deaths in Canada: 2011-12 to 2015-16 on the Public Health Agency of Canada website.
[h=2]Influenza Strain Characterizations[/h] During the 2015-16 influenza season, the National Microbiology Laboratory (NML) has characterized 588 influenza viruses [129 A(H3N2), 307 A(H1N1) and 152 influenza B].
Influenza A (H3N2): When tested by hemagglutination inhibition (HI) assays, 28 H3N2 virus were antigenically characterized as A/Switzerland/9715293/2013-like using antiserum raised against cell-propagated A/Switzerland/9715293/2013.
Sequence analysis was done on 101 H3N2 viruses. All viruses belonged to a genetic group for which most viruses were antigenically related to A/Switzerland/9715293/2013. A/Switzerland/9715293/2013 is the A(H3N2) component of the 2015-16 Northern Hemisphere's vaccine.
Influenza A (H1N1): A total of 307 H1N1 viruses characterized were antigenically similar to A/California/7/2009, the A(H1N1) component of the 2015-16 influenza vaccine.
Influenza B: A total of 53 influenza B viruses characterized were antigenically similar to the vaccine strain B/Phuket/3073/2013. Ninety-nine influenza B viruses were characterized as B/Brisbane/60/2008-like, one of the influenza B components of the 2015-16 Northern Hemisphere quadrivalent influenza vaccine.
The WHO has released the recommended composition of the northern hemisphere influenza vaccine for the 2016-2017 season. Trivalent vaccines are recommended to contain 1) an A/California/7/2009 (H1N1)pdm09-like virus 2) an A/HongKong/4801/2014 (H3N2)-like virus, and 3) a B/Brisbane/60/2008-like virus (Victoria lineage). Quadrivalent vaccines are recommended to additionally contain a B/Phuket/30732013-like virus (Yamagata lineage).
The recommended components for the 2015-2016 northern hemisphere trivalent influenza vaccine include: an A/California/7/2009(H1N1)pdm09-like virus, an A/Switzerland/9715293/2013(H3N2)-like virus, and a B/Phuket/3073/2013 -like virus (Yamagata lineage). For quadrivalent vaccines, the addition of a B/Brisbane/60/2008-like virus (Victoria lineage) is recommended.
The NML receives a proportion of the influenza positive specimens from provincial laboratories for strain characterization and antiviral resistance testing. Characterization data reflect the results of haemagglutination inhibition testing compared to the reference influenza strains recommended by WHO.
.../

http://healthycanadians.gc.ca/publi...-2016-08-surveillance-influenza/index-eng.php
 
[h=1]FluWatch report: February 28, 2016 - March 5, 2016 (week 09)[/h] [h=2]Overall Summary[/h]
  • Influenza activity continues to increase and is typical of peak season levels.
  • For a second week in a row, the Eastern provinces of Canada accounted for the majority of influenza activity nationally. Nearly all reporting regions now have sporadic or localized activity.
  • In week 09, 45 outbreaks were reported with the majority of outbreaks reported in long-term care facilities.
  • Adults greater than 45 years of age accounted for the majority of hospitalizations in week 09.
  • Influenza A(H1N1) remains the most common influenza subtype circulating in Canada.
  • For more information on the flu, see our Flu(influenza) web page.

pubpdf09-eng.gif
Download the alternative format
(PDF format, 858 KB, 9 pages)
Organization: Public Health Agency of Canada
Date published: 2016-03-11

[h=2]Related Topics[/h]

Are you a primary health care practitioner (General Practitioner, Nurse Practitioner or Registered Nurse) interested in becoming a FluWatch sentinel for the 2015-16 influenza season? Contact us at FluWatch@phac-aspc.gc.ca


[h=2]On this page[/h]
[h=2]Influenza/Influenza-like Illness Activity (geographic spread)[/h] In week 09, influenza activity was present in almost every reporting region in Canada. A total of 19 regions reported localized activity levels with the majority in the central and eastern regions of Canada. Sporadic influenza/ILI activity was reported in 27 regions across Canada.
[h=3]Figure 1. Map of overall influenza/ILI activity level by province and territory, Canada, week 09[/h]
fg1-legend-eng.gif


Note: Influenza/ILI activity levels, as represented on this map, are assigned and reported by Provincial and Territorial Ministries of Health, based on laboratory confirmations, sentinel ILI rates and reported outbreaks. Please refer to detailed definitions at the end of the report. Maps from previous weeks, including any retrospective updates, are available in the mapping feature found in the Weekly Influenza Reports.
Figure 1 - Text Description [h=2]Laboratory Confirmed Influenza Detections[/h] The percent positive for influenza increased slightly from 33% in week 08 to 34% in week 09 (Figure 2). This small increase from the previous week may suggest that the influenza season is near its peak. Compared to the previous five seasons, the percent positive (34%) reported in week 09 was above the five year average for that week and exceeded the expected levels (range 14.1%-17.1%). With the late start to the 2015-16 influenza season, these above normal levels are not unexpected and are typical of peak season levels.
[h=3]Figure 2. Number of positive influenza tests and percentage of tests positive, by type, subtype and report week, Canada, 2015-16[/h]
2016-w09-fg2-eng.gif
Figure 2 - Text Description In week 09, there were 4,129 positive influenza tests reported. Increased detections of influenza in the central and eastern provinces have been noted in the last few weeks. In week 09, the majority of influenza detections were reported in the provinces of ON and QC (67%). To date, 84% of influenza detections have been influenza A and among those subtyped, the vast majority have been influenza A(H1N1) [89% (6514/7325)].
[h=3]Figure 3. Cumulative numbers of positive influenza specimens by type/subtype and province, Canada, 2015-16[/h]
2016-w09-fg3-eng.gif
Note: Specimens from NT, YT, and NU are sent to reference laboratories in other provinces. Cumulative data includes updates to previous weeks.
Figure 3 - Text Description To date this season, detailed information on age and type/subtype has been received for 14,493 cases. Adults aged 20-44 years accounted for the greatest proportion of influenza cases (Table 1). Adults aged 20-44 and 45-64 years accounted for 56% of reported influenza A(H1N1) cases. Children 5-19 years and adults 20-44 years accounted for 58% of all influenza B cases reported.
[TABLE="class: table-responsive table table-condensed table-striped table-hover table-bordered, width: 1140, height: 0"]
Table 1. Weekly and cumulative numbers of positive influenza specimens by type, subtype and age-group reported through case-based laboratory reportingTable 1 - Footnote1, Canada, 2015-16 [TR="class: bg-primary, bgcolor: #2572B4"]
Age groups (years) Weekly (February 28 to March 5, 2016) Cumulative (August 30, 2015 to March 5, 2016) [/TR]
[TR="class: bg-primary, bgcolor: #2572B4"]
Influenza A B Influenza A B Influenza A and B [/TR]
[TR="class: bg-primary, bgcolor: #2572B4"]
A Total A(H1) pdm09 A(H3) A UnSTable 1 - Footnote3 Total A Total A(H1) pdm09 A(H3) A UnSTable 1 - Footnote3 Total # % [/TR]
[TR]
[TD="colspan: 13"] Table 1 - Footnote 1 Table 1 includes specimens for which demographic information was reported. These represent a subset of all positive influenza cases reported.
Return to Table 1 - Footnote1referrer
Table 1 - Footnote 2 Percentage of tests positive for sub-types of influenza A are a percentage of all influenza A detections.
Return to Table 1 - Footnote2referrer
Table 1 - Footnote 3 Unsubtyped: The specimen was typed as influenza A, but no result for subtyping was available.
Return to Table 1 - Footnote3referrer
Table 1 - Footnote x Suppressed to prevent residual disclosure.
Return to Table 1 - Footnotexreferrer
[/TD]
[/TR]
[TR="bgcolor: #F5F5F5"]
<5 [TD="class: text-right"]488[/TD]
[TD="class: text-right"]114[/TD]
[TD="class: text-right"]<5[/TD]
[TD="class: text-right"]Table 1 - Footnotex[/TD]
[TD="class: text-right"]67[/TD]
[TD="class: text-right"]2319[/TD]
[TD="class: text-right"]1155[/TD]
[TD="class: text-right"]50[/TD]
[TD="class: text-right"]1114[/TD]
[TD="class: text-right"]308[/TD]
[TD="class: text-right"]2627[/TD]
[TD="class: text-right"]18.1%[/TD]
[/TR]
[TR]
5-19 [TD="class: text-right"]254[/TD]
[TD="class: text-right"]74[/TD]
[TD="class: text-right"]<5[/TD]
[TD="class: text-right"]Table 1 - Footnotex[/TD]
[TD="class: text-right"]107[/TD]
[TD="class: text-right"]1369[/TD]
[TD="class: text-right"]722[/TD]
[TD="class: text-right"]72[/TD]
[TD="class: text-right"]575[/TD]
[TD="class: text-right"]651[/TD]
[TD="class: text-right"]2020[/TD]
[TD="class: text-right"]13.9%[/TD]
[/TR]
[TR="bgcolor: #F5F5F5"]
20-44 [TD="class: text-right"]554[/TD]
[TD="class: text-right"]170[/TD]
[TD="class: text-right"]5[/TD]
[TD="class: text-right"]379[/TD]
[TD="class: text-right"]93[/TD]
[TD="class: text-right"]3288[/TD]
[TD="class: text-right"]1829[/TD]
[TD="class: text-right"]123[/TD]
[TD="class: text-right"]1336[/TD]
[TD="class: text-right"]630[/TD]
[TD="class: text-right"]3918[/TD]
[TD="class: text-right"]27.0%[/TD]
[/TR]
[TR]
45-64 [TD="class: text-right"]618[/TD]
[TD="class: text-right"]154[/TD]
[TD="class: text-right"]<5[/TD]
[TD="class: text-right"]Table 1 - Footnotex[/TD]
[TD="class: text-right"]40[/TD]
[TD="class: text-right"]3123[/TD]
[TD="class: text-right"]1575[/TD]
[TD="class: text-right"]150[/TD]
[TD="class: text-right"]1398[/TD]
[TD="class: text-right"]292[/TD]
[TD="class: text-right"]3415[/TD]
[TD="class: text-right"]23.6%[/TD]
[/TR]
[TR="bgcolor: #F5F5F5"]
65+ [TD="class: text-right"]445[/TD]
[TD="class: text-right"]113[/TD]
[TD="class: text-right"]6[/TD]
[TD="class: text-right"]326[/TD]
[TD="class: text-right"]67[/TD]
[TD="class: text-right"]2180[/TD]
[TD="class: text-right"]826[/TD]
[TD="class: text-right"]322[/TD]
[TD="class: text-right"]1032[/TD]
[TD="class: text-right"]333[/TD]
[TD="class: text-right"]2513[/TD]
[TD="class: text-right"]17.3%[/TD]
[/TR]
[TR]
Total [TD="class: text-right"]2359[/TD]
[TD="class: text-right"]625[/TD]
[TD="class: text-right"]14[/TD]
[TD="class: text-right"]1720[/TD]
[TD="class: text-right"]374[/TD]
[TD="class: text-right"]12279[/TD]
[TD="class: text-right"]6107[/TD]
[TD="class: text-right"]717[/TD]
[TD="class: text-right"]5455[/TD]
[TD="class: text-right"]2214[/TD]
[TD="class: text-right"]14493[/TD]
[TD="class: text-right"]100.0%[/TD]
[/TR]
[TR="bgcolor: #F5F5F5"]
PercentageTable 1 - Footnote2 [TD="class: text-right"]86.3%[/TD]
[TD="class: text-right"]26.5%[/TD]
[TD="class: text-right"]0.6%[/TD]
[TD="class: text-right"]72.9%[/TD]
[TD="class: text-right"]13.7%[/TD]
[TD="class: text-right"]84.7%[/TD]
[TD="class: text-right"]49.7%[/TD]
[TD="class: text-right"]5.8%[/TD]
[TD="class: text-right"]44.4%[/TD]
[TD="class: text-right"]15.3%[/TD]
[TD="class: text-right"] [/TD]
[TD="class: text-right"] [/TD]
[/TR]
[/TABLE]

For data on other respiratory virus detections see the Respiratory Virus Detections in Canada Report on the Public Health Agency of Canada website.
[h=2]Influenza-like Illness Consultation Rate[/h] The national ILI consultation rate increased from the previous week from 51.7 per 1,000 patient visits in week 08, to 63.3 per 1,000 patient visits in week 09. In week 09, the highest ILI consultation rate was found in children 0-4 years of age (137.0 per 1,000) and the lowest was found in the ≥65 years age group (25.2 per 1,000) (Figure 4).
[h=3]Figure 4. Influenza-like-illness (ILI) consultation rates by age group and week, Canada, 2015-16[/h]
2016-w09-fg4-eng.gif
Delays in the reporting of data may cause data to change retrospectively. In BC, AB, and SK, data are compiled by a provincial sentinel surveillance program for reporting to FluWatch. Not all sentinel physicians report every week.
Figure 4 - Text Description [h=2]Pharmacy Surveillance[/h] During week 09, the proportion of prescriptions for antivirals increased to 89.4 antiviral prescriptions per 100,000 total prescriptions, which is lower than the five year historical average. Since week 02, the highest proportion of prescriptions for antivirals has been reported among children. In week 09, the proportion reported among children was 329.1 per 100,000 total prescriptions.
[h=3]Figure 5. Proportion of prescription sales for influenza antivirals by age group and week, Canada, 2015-16[/h]
2016-w09-fg5-eng.gif
Note: Pharmacy sales data are provided to the Public Health Agency of Canada by Rx Canada Inc. and sourced from major retail drug chains representing over 3,000 stores nationwide (excluding Nunavut) in 85% of Health Regions. Data provided include the number of new antiviral prescriptions (for Tamiflu[oseltamivir] and Relenza [zanamivir]) and the total number of new prescriptions dispensed by Province/Territory and age group.
* The average weekly proportion includes data from April 2011 to March 2015.
Figure 5 - Text Description [h=2]Influenza Outbreak Surveillance[/h] In week 09, 45 new laboratory confirmed influenza outbreaks were reported: 24 in long-term care facilities (LTC), 13 in hospitals and eight in institutions or community settings. Of the outbreaks with known strains or subtypes, 12 outbreaks were due to influenza A and six outbreaks were due to influenza B. Additionally, four ILI outbreaks were reported in schools.
To date this season, 226 outbreaks have been reported. At week 09 in the 2014-15 season, 1,338 outbreaks were reported and in the 2013-14 season,140 outbreaks were reported.
[h=3]Figure 6. Overall number of new laboratory-confirmed influenza outbreaksFigure 5 - Footnote1 by report week, Canada, 2015-2016[/h]
2016-w09-fg6-eng.gif
Figure 6 - Footnote 1 All provinces and territories except NU report influenza outbreaks in long-term care facilities. All provinces and territories with the exception of NU and QC report outbreaks in hospitals. Outbreaks of influenza or influenza-like-illness in other facilities are reported to FluWatch but reporting varies between jurisdictions. Outbreak definitions are included at the end of the report.
Return to Figure 5 - Footnote1referrer
Figure 6 - Text Description [h=2]Sentinel Pediatric Hospital Influenza Surveillance[/h] [h=3]Paediatric Influenza Hospitalizations and Deaths[/h] In week 09, 132 hospitalizations were reported by the the Immunization Monitoring Program Active (IMPACT) network (Figure 7). The largest proportion of hospitalizations were in children aged 2-4 years (33%) and the majority of hospitalizations were due to influenza A (87%).
To date this season, 642 laboratory-confirmed influenza-associated pediatric (≤16 years of age) hospitalizations have been reported by the IMPACT network: 531 hospitalized cases were due to influenza A and 111 cases were due to influenza B. Children aged less than 2 years of age accounted for the greatest proportion of hosptalizations cases (37%). To date, 103 intensive care unit (ICU) admissions have been reported. Children aged 2 to 4 years accounted for 29% of ICU admissions. Less than five influenza-associated deaths have been reported.
[TABLE="class: table table-condensed table-striped table-hover table-bordered, width: 1140"]
Table 2 - Cumulative numbers of peadiatric hospitalizations (≤16 years of age) with influenza reported by the IMPACT network, Canada, 2015-16 [TR="class: bg-primary, bgcolor: #2572B4"]
Age Groups Cumulative (30 Aug. 2015 to 5 March 2016) [/TR]
[TR="class: bg-primary, bgcolor: #2572B4"]
Influenza A Influenza B Influenza A and B (#(%)) [/TR]
[TR="class: bg-primary, bgcolor: #2572B4"]
A Total A(H1) pdm09 A(H3) A (UnS) B Total [/TR]
[TR]
[TD="colspan: 7"] Table 2 - Footnote x Suppressed to prevent residual disclosure.
Return to Table 2 - Footnotexreferrer
[/TD]
[/TR]
[TR="bgcolor: #F5F5F5"]
0-5m [TD="class: text-right"]64[/TD]
[TD="class: text-right"]18[/TD]
[TD="class: text-right"]<5[/TD]
[TD="class: text-right"]Table 2 - Footnotex[/TD]
[TD="class: text-right"]7[/TD]
[TD="class: text-right"]71 (11%)[/TD]
[/TR]
[TR]
6-23m [TD="class: text-right"]148[/TD]
[TD="class: text-right"]53[/TD]
[TD="class: text-right"]7[/TD]
[TD="class: text-right"]88[/TD]
[TD="class: text-right"]21[/TD]
[TD="class: text-right"]169 (26%)[/TD]
[/TR]
[TR="bgcolor: #F5F5F5"]
2-4y [TD="class: text-right"]161[/TD]
[TD="class: text-right"]62[/TD]
[TD="class: text-right"]<5[/TD]
[TD="class: text-right"]Table 2 - Footnotex[/TD]
[TD="class: text-right"]29[/TD]
[TD="class: text-right"]190 (30%)[/TD]
[/TR]
[TR]
5-9y [TD="class: text-right"]116[/TD]
[TD="class: text-right"]34[/TD]
[TD="class: text-right"]<5[/TD]
[TD="class: text-right"]Table 2 - Footnotex[/TD]
[TD="class: text-right"]36[/TD]
[TD="class: text-right"]152 (24%)[/TD]
[/TR]
[TR="bgcolor: #F5F5F5"]
10-16y [TD="class: text-right"]42[/TD]
[TD="class: text-right"]16[/TD]
[TD="class: text-right"]<5[/TD]
[TD="class: text-right"]Table 2 - Footnotex[/TD]
[TD="class: text-right"]18[/TD]
[TD="class: text-right"]60 (9%)[/TD]
[/TR]
[TR]
Total [TD="class: text-right"]531[/TD]
[TD="class: text-right"]183[/TD]
[TD="class: text-right"]19[/TD]
[TD="class: text-right"]329[/TD]
[TD="class: text-right"]111[/TD]
[TD="class: text-right"]642 (100%)[/TD]
[/TR]
[/TABLE]
[h=4]Figure 7. Number of cases of influenza reported by sentinel hospital networks, by week, Canada, 2015-16, paediatric and adult hospitalizations (≤16 years of age, IMPACT; ≥16 years of age, CIRN-SOS)[/h]
2016-w09-fg7-eng.gif
Not included in Table 2 and Figure 7 are two IMPACT cases that were due to co-infections of influenza A and B.
Figure 7 - Text Description [h=3]Adult Influenza Hospitalizations and Deaths[/h] In week 09, 69 hospitalizations were reported by the Canadian Immunization Research Network Serious Outcome Surveillance (CIRN-SOS). The largest proportion of hospitalizations were in adults 65+ years of age (52%) and due to influenza A (88%).
To date this season, 453 laboratory-confirmed influenza-associated adult (≥16 years of age) hospitalizations have been reported by CIRN-SOS (Table 3). The majority of hospitalized cases were due to influenza A (88%) and the largest reported proption were among adults ≥65 years of age (49%). Fifty-eight intensive care unit (ICU) admissions have been reported and among those, 51 (88%) were due to influenza A. A total of 29 ICU cases (50%) reported to have at least one underlying condition or comorbidity. Fifteen deaths have been reported this season.
[TABLE="class: table table-condensed table-striped table-hover table-bordered, width: 1140"]
Table 3 - Cumulative numbers of adult hospitalizations (≥16 years of age) with influenza reported by the CIRN-SOS network, Canada, 2015-16 [TR="class: bg-primary, bgcolor: #2572B4"]
Age groups (years) Cumulative (1 Nov. 2015 to 5 March 2016) [/TR]
[TR="class: bg-primary, bgcolor: #2572B4"]
Influenza A B Influenza A and B [/TR]
[TR="class: bg-primary, bgcolor: #2572B4"]
A Total A(H1) pdm09 A(H3) A(UnS) Total # (%) [/TR]
[TR]
[TD="colspan: 7"] Table 3 - Footnote x Suppressed to prevent residual disclosure.
Return to Table 3 - Footnotexreferrer
[/TD]
[/TR]
[TR="bgcolor: #F5F5F5"]
16-20 [TD="class: text-right"]<5[/TD]
[TD="class: text-right"]<5[/TD]
[TD="class: text-right"]0[/TD]
[TD="class: text-right"]<5[/TD]
[TD="class: text-right"]0[/TD]
[TD="class: text-right"]<5[/TD]
[/TR]
[TR]
20-44 [TD="class: text-right"]64[/TD]
[TD="class: text-right"]20[/TD]
[TD="class: text-right"]<5[/TD]
[TD="class: text-right"]Table 3 - Footnotex[/TD]
[TD="class: text-right"]16[/TD]
[TD="class: text-right"]80 (18%)[/TD]
[/TR]
[TR="bgcolor: #F5F5F5"]
45-64 [TD="class: text-right"]133[/TD]
[TD="class: text-right"]32[/TD]
[TD="class: text-right"]<5[/TD]
[TD="class: text-right"]Table 3 - Footnotex[/TD]
[TD="class: text-right"]12[/TD]
[TD="class: text-right"]145 (32%)[/TD]
[/TR]
[TR]
65+ [TD="class: text-right"]193[/TD]
[TD="class: text-right"]32[/TD]
[TD="class: text-right"]16[/TD]
[TD="class: text-right"]145[/TD]
[TD="class: text-right"]27[/TD]
[TD="class: text-right"]220 (49%)[/TD]
[/TR]
[TR="bgcolor: #F5F5F5"]
Unknown [TD="class: text-right"]<5[/TD]
[TD="class: text-right"]Table 3 - Footnotex[/TD]
[TD="class: text-right"]0[/TD]
[TD="class: text-right"]<5[/TD]
[TD="class: text-right"]0[/TD]
[TD="class: text-right"]<5[/TD]
[/TR]
[TR]
Total [TD="class: text-right"]398[/TD]
[TD="class: text-right"]87[/TD]
[TD="class: text-right"]20[/TD]
[TD="class: text-right"]291[/TD]
[TD="class: text-right"]55[/TD]
[TD="class: text-right"]453[/TD]
[/TR]
[TR="bgcolor: #F5F5F5"]
% [TD="class: text-right"]88%[/TD]
[TD="class: text-right"]22%[/TD]
[TD="class: text-right"]5%[/TD]
[TD="class: text-right"]73%[/TD]
[TD="class: text-right"]12%[/TD]
[TD="class: text-right"]100%[/TD]
[/TR]
[/TABLE]
[h=4]Figure 8. Percentage of hospitalizations, ICU admissions and deaths with influenza reported by age-group (≥16 year of age), Canada 2015-16[/h]
2016-w09-fg8-eng.gif
Note: The number of hospitalizations reported through CIRN-SOS and IMPACT represents a subset of all influenza-associated adult and paediatric hospitalizations in Canada. Delays in the reporting of data may cause data to change retrospectively. x - Suppressed to prevent residual disclosure.
Figure 8 - Text Description [h=2]Provincial/Territorial Influenza Hospitalizations and Deaths[/h] In week 09, 417 hospitalizations have been reported from participating provinces and territoriesFootnote*. The majority of hospitalizations were due to influenza A (86%). The largest proportion of cases reported in week 09 were in adults 65+ years of age (29%) followed closely by adults 45-64 years of age (28%).
Since the start of the 2015-16 season, 2,081Footnote1 laboratory-confirmed influenza-associated hospitalizations have been reported. A total of 1,832 hospitalizations (88%) were due to influenza A and 249 (12%) were due to influenza B. Among cases for which the subtype of influenza A was reported, 91% (1022/1117) were influenza A(H1N1). The largest proportion (28%) of hospitalized cases were ≥65 years of age, followed closely by adults 45-64 years of age (26%). Two hundred and twenty-five ICU admissions have been reported of which 206 (92%) were due to influenza A and 78 (44%) were in the 45-64 age group. A total of 59 deaths have been reported, all due to influenza A. The largest proportion of deaths were reported in adults 45-64 years of age, representing 49% of deaths.
[h=3]Figure 9. Percentage of hospitalizations, ICU admissions and deaths with influenza reported by age-group, Canada 2015-16[/h]
2016-w09-fg9-eng.gif
Figure 9 - Text Description Footnote * Note: Influenza-associated hospitalizations are not reported to PHAC by the following Provinces and Territory: BC, NU, and QC. Only hospitalizations that require intensive medical care are reported by SK. ICU admissions are not distinguished among hospital admissions reported from ON. Data may also include cases reported by the IMPACT networks. The number of new influenza-associated hospitalizations and deaths reported for the current week may include cases from ON that occurred in previous weeks, as a result of retrospective updates to the cumulative total. It is important to note that the hospitalization or death does not have to be attributable to influenza, a positive laboratory test is sufficient for reporting.
Return to footnote*referrer
Footnote * Includes three hospitalizations for which age is unknown.
Return to footnote1referrer
See additional data on Reported Influenza Hospitalizations and Deaths in Canada: 2011-12 to 2015-16 on the Public Health Agency of Canada website.
[h=2]Influenza Strain Characterizations[/h] During the 2015-16 influenza season, the National Microbiology Laboratory (NML) has characterized 766 influenza viruses [132 A(H3N2), 436 A(H1N1) and 198 influenza B].
Influenza A (H3N2): When tested by hemagglutination inhibition (HI) assays, 28 H3N2 virus were antigenically characterized as A/Switzerland/9715293/2013-like using antiserum raised against cell-propagated A/Switzerland/9715293/2013.
Sequence analysis was done on 104 H3N2 viruses. All viruses belonged to a genetic group for which most viruses were antigenically related to A/Switzerland/9715293/2013. A/Switzerland/9715293/2013 is the A(H3N2) component of the 2015-16 Northern Hemisphere's vaccine.
Influenza A (H1N1): A total of 436 H1N1 viruses characterized were antigenically similar to A/California/7/2009, the A(H1N1) component of the 2015-16 influenza vaccine.
Influenza B: A total of 66 influenza B viruses characterized were antigenically similar to the vaccine strain B/Phuket/3073/2013. A total of 132 influenza B viruses were characterized as B/Brisbane/60/2008-like, one of the influenza B components of the 2015-16 Northern Hemisphere quadrivalent influenza vaccine.
The recommended components for the 2015-2016 northern hemisphere trivalent influenza vaccine include: an A/California/7/2009(H1N1)pdm09-like virus, an A/Switzerland/9715293/2013(H3N2)-like virus, and a B/Phuket/3073/2013 -like virus (Yamagata lineage). For quadrivalent vaccines, the addition of a B/Brisbane/60/2008-like virus (Victoria lineage) is recommended.
The NML receives a proportion of the influenza positive specimens from provincial laboratories for strain characterization and antiviral resistance testing. Characterization data reflect the results of haemagglutination inhibition testing compared to the reference influenza strains recommended by WHO.
.../

http://healthycanadians.gc.ca/publi...-2016-09-surveillance-influenza/index-eng.php
 
[h=1]FluWatch report: March 6 to March 12, 2016 (week 10)[/h] [h=2]Overall Summary[/h]
  • Influenza activity continues to increase and is typical of peak season levels. The Eastern provinces of Canada accounted for the majority of influenza activity nationally.
  • Nearly all regions in Canada are reporting sporadic or localized influenza activity.
  • In week 10, 46 outbreaks were reported and the majority of outbreaks were in long-term care facilities.
  • Adults greater than 45 years of age accounted for the majority of hospitalizations in week 10.
  • Hospitalizations and ICU admissions among the pediatric population continue to be above typical peak season levels.
  • A Canadian study reported an interim estimate of vaccine effectiveness of 64% against influenza A(H1N1) in Canada. This estimate suggests that the 2015-16 northern hemisphere vaccine has provided good protection against the influenza A(H1N1) virus, the most common circulating influenza virus.
  • For more information on the flu, see our Flu(influenza) web page.

pubpdf10-eng.gif
Download the alternative format
(PDF format, 858 KB, 9 pages)
Organization: Public Health Agency of Canada
Date published: 2016-03-11

[h=2]Related Topics[/h]

Are you a primary health care practitioner (General Practitioner, Nurse Practitioner or Registered Nurse) interested in becoming a FluWatch sentinel for the 2015-16 influenza season? Contact us at FluWatch@phac-aspc.gc.ca


[h=2]On this page[/h]
[h=2]Influenza/Influenza-like Illness Activity (geographic spread)[/h] In week 10, influenza activity was present in almost every region in Canada. A total of 24 regions reported localized activity levels with the majority in the eastern regions of Canada. Sporadic influenza/ILI activity was reported in 27 regions across Canada.
[h=3]Figure 1. Map of overall influenza/ILI activity level by province and territory, Canada, week 10[/h]
fg1-legend-eng.gif


Note: Influenza/ILI activity levels, as represented on this map, are assigned and reported by Provincial and Territorial Ministries of Health, based on laboratory confirmations, sentinel ILI rates and reported outbreaks. Please refer to detailed definitions at the end of the report. Maps from previous weeks, including any retrospective updates, are available in the mapping feature found in the Weekly Influenza Reports.
Figure 1 - Text Description [h=2]Laboratory Confirmed Influenza Detections[/h] The percent positive for influenza increased slightly from the previous week [from 34% in week 09 to 36% in week 10 (Figure 2)]. This small increase from the previous week may suggest that the influenza season is near its peak. Compared to the previous five seasons, the percent positive (36%) reported in week 10 was above the five year average for that week and exceeded the expected levels (range 12.8%-18.3%). With the late start to the 2015-16 influenza season, these above normal levels are not unexpected and are typical of peak season levels.
[h=3]Figure 2. Number of positive influenza tests and percentage of tests positive, by type, subtype and report week, Canada, 2015-16[/h]
2016-w10-fg2-eng.gif
Figure 2 - Text Description In week 10, there were 4,359 positive influenza tests reported. The Atlantic provinces reported the greatest percent increase (37%) in the number of positive influenza tests compared to the previous week. To date, 84% of influenza detections have been influenza A and among those subtyped, the vast majority have been influenza A(H1N1) [90% (7818/8679)].
[h=3]Figure 3. Cumulative numbers of positive influenza specimens by type/subtype and province, Canada, 2015-16[/h]
2016-w10-fg3-eng.gif
Note: Specimens from NT, YT, and NU are sent to reference laboratories in other provinces. Cumulative data includes updates to previous weeks.
Figure 3 - Text Description To date this season, detailed information on age and type/subtype has been received for 18,729 cases. Adults aged 20-44 years accounted for the greatest proportion of influenza cases, followed closely by adults aged 45-64 (Table 1). Adults aged 20-44 and 45-64 years accounted for 55% of reported influenza A(H1N1) cases. Children 5-19 years and adults 20-44 years accounted for 57% of all influenza B cases reported.
[TABLE="class: table-responsive table table-condensed table-striped table-hover table-bordered, width: 1140, height: 0"]
Table 1. Weekly and cumulative numbers of positive influenza specimens by type, subtype and age-group reported through case-based laboratory reportingTable 1 - Footnote1, Canada, 2015-16 [TR="class: bg-primary, bgcolor: #2572B4"]
Age groups (years) Weekly (March 6 to March 12, 2016) Cumulative (August 30, 2015 to March 12, 2016)) [/TR]
[TR="class: bg-primary, bgcolor: #2572B4"]
Influenza A B Influenza A B Influenza A and B [/TR]
[TR="class: bg-primary, bgcolor: #2572B4"]
A Total A(H1) pdm09 A(H3) A UnSTable 1 - Footnote3 Total A Total A(H1) pdm09 A(H3) A UnSTable 1 - Footnote3 Total # % [/TR]
[TR]
[TD="colspan: 13"] Table 1 - Footnote 1 Table 1 includes specimens for which demographic information was reported. These represent a subset of all positive influenza cases reported.
Return to Table 1 - Footnote1referrer
Table 1 - Footnote 2 Percentage of tests positive for sub-types of influenza A are a percentage of all influenza A detections.
Return to Table 1 - Footnote2referrer
Table 1 - Footnote 3 Unsubtyped: The specimen was typed as influenza A, but no result for subtyping was available.
Return to Table 1 - Footnote3referrer
Table 1 - Footnote x Suppressed to prevent residual disclosure.
Return to Table 1 - Footnotexreferrer
[/TD]
[/TR]
[TR="bgcolor: #F5F5F5"]
<5 [TD="class: text-right"]489[/TD]
[TD="class: text-right"]118[/TD]
[TD="class: text-right"]0[/TD]
[TD="class: text-right"]371[/TD]
[TD="class: text-right"]106[/TD]
[TD="class: text-right"]2973[/TD]
[TD="class: text-right"]1392[/TD]
[TD="class: text-right"]52[/TD]
[TD="class: text-right"]1529[/TD]
[TD="class: text-right"]457[/TD]
[TD="class: text-right"]3430[/TD]
[TD="class: text-right"]18%[/TD]
[/TR]
[TR]
5-19 [TD="class: text-right"]169[/TD]
[TD="class: text-right"]44[/TD]
[TD="class: text-right"]<5[/TD]
[TD="class: text-right"]Table 1 - Footnotex[/TD]
[TD="class: text-right"]167[/TD]
[TD="class: text-right"]1671[/TD]
[TD="class: text-right"]851[/TD]
[TD="class: text-right"]77[/TD]
[TD="class: text-right"]743[/TD]
[TD="class: text-right"]901[/TD]
[TD="class: text-right"]2572[/TD]
[TD="class: text-right"]14%[/TD]
[/TR]
[TR="bgcolor: #F5F5F5"]
20-44 [TD="class: text-right"]587[/TD]
[TD="class: text-right"]180[/TD]
[TD="class: text-right"]<5[/TD]
[TD="class: text-right"]Table 1 - Footnotex[/TD]
[TD="class: text-right"]133[/TD]
[TD="class: text-right"]4112[/TD]
[TD="class: text-right"]2175[/TD]
[TD="class: text-right"]130[/TD]
[TD="class: text-right"]1907[/TD]
[TD="class: text-right"]809[/TD]
[TD="class: text-right"]4921[/TD]
[TD="class: text-right"]26%[/TD]
[/TR]
[TR]
45-64 [TD="class: text-right"]722[/TD]
[TD="class: text-right"]211[/TD]
[TD="class: text-right"]<5[/TD]
[TD="class: text-right"]Table 1 - Footnotex[/TD]
[TD="class: text-right"]61[/TD]
[TD="class: text-right"]4087[/TD]
[TD="class: text-right"]1963[/TD]
[TD="class: text-right"]159[/TD]
[TD="class: text-right"]1965[/TD]
[TD="class: text-right"]385[/TD]
[TD="class: text-right"]4472[/TD]
[TD="class: text-right"]24%[/TD]
[/TR]
[TR="bgcolor: #F5F5F5"]
65+ [TD="class: text-right"]549[/TD]
[TD="class: text-right"]140[/TD]
[TD="class: text-right"]18[/TD]
[TD="class: text-right"]391[/TD]
[TD="class: text-right"]81[/TD]
[TD="class: text-right"]2899[/TD]
[TD="class: text-right"]1085[/TD]
[TD="class: text-right"]354[/TD]
[TD="class: text-right"]1400[/TD]
[TD="class: text-right"]435[/TD]
[TD="class: text-right"]3334[/TD]
[TD="class: text-right"]18%[/TD]
[/TR]
[TR]
Total [TD="class: text-right"]2516[/TD]
[TD="class: text-right"]693[/TD]
[TD="class: text-right"]29[/TD]
[TD="class: text-right"]1794[/TD]
[TD="class: text-right"]548[/TD]
[TD="class: text-right"]15742[/TD]
[TD="class: text-right"]7466[/TD]
[TD="class: text-right"]772[/TD]
[TD="class: text-right"]7504[/TD]
[TD="class: text-right"]2987[/TD]
[TD="class: text-right"]18729[/TD]
[TD="class: text-right"]100%[/TD]
[/TR]
[TR="bgcolor: #F5F5F5"]
PercentageTable 1 - Footnote2 [TD="class: text-right"]82%[/TD]
[TD="class: text-right"]28%[/TD]
[TD="class: text-right"]1%[/TD]
[TD="class: text-right"]71%[/TD]
[TD="class: text-right"]18%[/TD]
[TD="class: text-right"]84%[/TD]
[TD="class: text-right"]47%[/TD]
[TD="class: text-right"]5%[/TD]
[TD="class: text-right"]48%[/TD]
[TD="class: text-right"]16%[/TD]
[TD="class: text-right"] [/TD]
[TD="class: text-right"] [/TD]
[/TR]
[/TABLE]

For data on other respiratory virus detections see the Respiratory Virus Detections in Canada Report on the Public Health Agency of Canada website.
[h=2]Influenza-like Illness Consultation Rate[/h] The national ILI consultation rate increased from the previous week from 63.3 per 1,000 patient visits in week 09, to 75.6 per 1,000 patient visits in week 10.The highest ILI consultation rate was found in the 5-19 years of age group (151.5 per 1,000) and the lowest was found in the ≥65 years age group (21.8 per 1,000) (Figure 4).
[h=3]Figure 4. Influenza-like-illness (ILI) consultation rates by age group and week, Canada, 2015-16[/h]
2016-w10-fg4-eng.gif
Delays in the reporting of data may cause data to change retrospectively. In BC, AB, and SK, data are compiled by a provincial sentinel surveillance program for reporting to FluWatch. Not all sentinel physicians report every week.
Figure 4 - Text Description [h=2]Pharmacy Surveillance[/h] During week 10, the proportion of prescriptions for antivirals increased to 144.7 antiviral prescriptions per 100,000 total prescriptions, which is higher than the five year historical average for week 10. The proportion of antiviral prescriptions among infants more than doubled from week 09. The highest proportion of prescriptions for antivirals remains highest among children. In week 10, the proportion reported among children was 341.8 per 100,000 total prescriptions.
[h=3]Figure 5. Proportion of prescription sales for influenza antivirals by age group and week, Canada, 2015-16[/h]
2016-w10-fg5-eng.gif
Note: Pharmacy sales data are provided to the Public Health Agency of Canada by Rx Canada Inc. and sourced from major retail drug chains representing over 3,000 stores nationwide (excluding Nunavut) in 85% of Health Regions. Data provided include the number of new antiviral prescriptions (for Tamiflu[oseltamivir] and Relenza [zanamivir]) and the total number of new prescriptions dispensed by Province/Territory and age group.
* The average weekly proportion includes data from April 2011 to March 2015.
Figure 5 - Text Description [h=2]Influenza Outbreak Surveillance[/h] In week 10, 46 new laboratory confirmed influenza outbreaks were reported: 23 in long-term care facilities (LTCF), nine in hospitals and 14 in institutions or community settings. Of the reported LTCF outbreaks, 13 were due to influenza A(UnS), six due to influenza A(H1N1), one due to influenza A(H3N2) and three due to influenza B. For the remaining outbreaks in hospitals and community settings: two were due to influenza A(H3N2), one due to influenza A(H1N1), seven due to influenza A(UnS) and three due to influenza B. Additionally, three ILI outbreaks were reported in schools.
To date this season, 274 outbreaks have been reported. At week 10 in the 2014-15 season, 1,376 outbreaks were reported and in the 2013-14 season,147 outbreaks were reported.
[h=3]Figure 6. Overall number of new laboratory-confirmed influenza outbreaksFigure 5 - Footnote1 by report week, Canada, 2015-2016[/h]
2016-w10-fg6-eng.gif
Figure 6 - Footnote 1 All provinces and territories except NU report influenza outbreaks in long-term care facilities. All provinces and territories with the exception of NU and QC report outbreaks in hospitals. Outbreaks of influenza or influenza-like-illness in other facilities are reported to FluWatch but reporting varies between jurisdictions. Outbreak definitions are included at the end of the report.
Return to Figure 5 - Footnote1referrer
Figure 6 - Text Description [h=2]Sentinel Pediatric Hospital Influenza Surveillance[/h] [h=3]Paediatric Influenza Hospitalizations and Deaths[/h] In week 10, 134 hospitalizations were reported by the the Immunization Monitoring Program Active (IMPACT) network, down slightly from the previous two weeks (Figure 7). The largest proportion of hospitalizations were in children aged 6-23 months (34%) and the majority of hospitalizations were due to influenza A (72%).
To date this season, 792 laboratory-confirmed influenza-associated pediatric (≤16 years of age) hospitalizations have been reported by the IMPACT network: 641 hospitalized cases were due to influenza A and 151 cases were due to influenza B. The greatest proportion of hosptalizations cases were in children aged 6-23 months and children 2-4 years, each accounting for 28% of hospitalizations. To date, 136 intensive care unit (ICU) admissions have been reported. Children aged 2 to 4 years accounted for 28% of ICU admissions. A total of 71 ICU cases (52%) reported to have at least one underlying condition or comorbidity. Less than five influenza-associated deaths have been reported.
[TABLE="class: table table-condensed table-striped table-hover table-bordered, width: 1140"]
Table 2 - Cumulative numbers of peadiatric hospitalizations (≤16 years of age) with influenza reported by the IMPACT network, Canada, 2015-16 [TR="class: bg-primary, bgcolor: #2572B4"]
Age Groups Cumulative (30 Aug. 2015 to 12 March 2016) [/TR]
[TR="class: bg-primary, bgcolor: #2572B4"]
Influenza A Influenza B Influenza A and B (#(%)) [/TR]
[TR="class: bg-primary, bgcolor: #2572B4"]
A Total A(H1) pdm09 A(H3) A (UnS) B Total [/TR]
[TR]
[TD="colspan: 7"] Table 2 - Footnote x Suppressed to prevent residual disclosure.
Return to Table 2 - Footnotexreferrer
[/TD]
[/TR]
[TR="bgcolor: #F5F5F5"]
0-5m [TD="class: text-right"]85[/TD]
[TD="class: text-right"]27[/TD]
[TD="class: text-right"]<5[/TD]
[TD="class: text-right"]Table 2 - Footnotex[/TD]
[TD="class: text-right"]11[/TD]
[TD="class: text-right"]96 (12%)[/TD]
[/TR]
[TR]
6-23m [TD="class: text-right"]186[/TD]
[TD="class: text-right"]59[/TD]
[TD="class: text-right"]7[/TD]
[TD="class: text-right"]120[/TD]
[TD="class: text-right"]35[/TD]
[TD="class: text-right"]221 (28%)[/TD]
[/TR]
[TR="bgcolor: #F5F5F5"]
2-4y [TD="class: text-right"]188[/TD]
[TD="class: text-right"]68[/TD]
[TD="class: text-right"]<5[/TD]
[TD="class: text-right"]Table 2 - Footnotex[/TD]
[TD="class: text-right"]37[/TD]
[TD="class: text-right"]225 (28%)[/TD]
[/TR]
[TR]
5-9y [TD="class: text-right"]135[/TD]
[TD="class: text-right"]42[/TD]
[TD="class: text-right"]<5[/TD]
[TD="class: text-right"]Table 2 - Footnotex[/TD]
[TD="class: text-right"]47[/TD]
[TD="class: text-right"]182 (23%)[/TD]
[/TR]
[TR="bgcolor: #F5F5F5"]
10-16y [TD="class: text-right"]47[/TD]
[TD="class: text-right"]16[/TD]
[TD="class: text-right"]<5[/TD]
[TD="class: text-right"]Table 2 - Footnotex[/TD]
[TD="class: text-right"]21[/TD]
[TD="class: text-right"]68 (9%)[/TD]
[/TR]
[TR]
Total [TD="class: text-right"]641[/TD]
[TD="class: text-right"]212[/TD]
[TD="class: text-right"]19[/TD]
[TD="class: text-right"]410[/TD]
[TD="class: text-right"]151[/TD]
[TD="class: text-right"]792 (100%)[/TD]
[/TR]
[/TABLE]
[h=4]Figure 7. Number of cases of influenza reported by sentinel hospital networks, by week, Canada, 2015-16, paediatric and adult hospitalizations (≤16 years of age, IMPACT; ≥16 years of age, CIRN-SOS)[/h]
2016-w10-fg7-eng.gif
Not included in Table 2 and Figure 7 are two IMPACT cases that were due to co-infections of influenza A and B.
Figure 7 - Text Description [h=3]Adult Influenza Hospitalizations and Deaths[/h] In week 10, 79 hospitalizations were reported by the Canadian Immunization Research Network Serious Outcome Surveillance (CIRN-SOS) (Figure 7). The largest proportion of hospitalizations were in adults 65+ years of age (56%) and due to influenza A (88%).
To date this season, 566 laboratory-confirmed influenza-associated adult (≥16 years of age) hospitalizations have been reported by CIRN-SOS (Table 3). The majority of hospitalized cases were due to influenza A (88%) and the largest reported proportion were among adults ≥65 years of age (48%). Seventy-four intensive care unit (ICU) admissions have been reported and among those, 64 (86%) were due to influenza A. A total of 38 ICU cases (51%) reported to have at least one underlying condition or comorbidity. Nineteen deaths have been reported this season.
[TABLE="class: table table-condensed table-striped table-hover table-bordered, width: 1140"]
Table 3 - Cumulative numbers of adult hospitalizations (≥16 years of age) with influenza reported by the CIRN-SOS network, Canada, 2015-16 [TR="class: bg-primary, bgcolor: #2572B4"]
Age groups (years) Cumulative (1 Nov. 2015 to 12 March 2016) [/TR]
[TR="class: bg-primary, bgcolor: #2572B4"]
Influenza A B Influenza A and B [/TR]
[TR="class: bg-primary, bgcolor: #2572B4"]
A Total A(H1) pdm09 A(H3) A(UnS) Total # (%) [/TR]
[TR]
[TD="colspan: 7"] Table 3 - Footnote x Suppressed to prevent residual disclosure.
Return to Table 3 - Footnotexreferrer
[/TD]
[/TR]
[TR="bgcolor: #F5F5F5"]
16-20 [TD="class: text-right"]<5[/TD]
[TD="class: text-right"]<5[/TD]
[TD="class: text-right"]0[/TD]
[TD="class: text-right"]<5[/TD]
[TD="class: text-right"]0[/TD]
[TD="class: text-right"]<5[/TD]
[/TR]
[TR]
20-44 [TD="class: text-right"]81[/TD]
[TD="class: text-right"]22[/TD]
[TD="class: text-right"]<5[/TD]
[TD="class: text-right"]Table 3 - Footnotex[/TD]
[TD="class: text-right"]18[/TD]
[TD="class: text-right"]99 (17%)[/TD]
[/TR]
[TR="bgcolor: #F5F5F5"]
45-64 [TD="class: text-right"]166[/TD]
[TD="class: text-right"]37[/TD]
[TD="class: text-right"]<5[/TD]
[TD="class: text-right"]Table 3 - Footnotex[/TD]
[TD="class: text-right"]17[/TD]
[TD="class: text-right"]183 (32%)[/TD]
[/TR]
[TR]
65+ [TD="class: text-right"]240[/TD]
[TD="class: text-right"]40[/TD]
[TD="class: text-right"]17[/TD]
[TD="class: text-right"]183[/TD]
[TD="class: text-right"]34[/TD]
[TD="class: text-right"]274 (48%)[/TD]
[/TR]
[TR="bgcolor: #F5F5F5"]
Unknown [TD="class: text-right"]Table 3 - Footnotex[/TD]
[TD="class: text-right"]<5[/TD]
[TD="class: text-right"]0[/TD]
[TD="class: text-right"]<5[/TD]
[TD="class: text-right"]0[/TD]
[TD="class: text-right"]<5[/TD]
[/TR]
[TR]
Total [TD="class: text-right"]497[/TD]
[TD="class: text-right"]105[/TD]
[TD="class: text-right"]21[/TD]
[TD="class: text-right"]371[/TD]
[TD="class: text-right"]69[/TD]
[TD="class: text-right"]566[/TD]
[/TR]
[TR="bgcolor: #F5F5F5"]
% [TD="class: text-right"]88%[/TD]
[TD="class: text-right"]21%[/TD]
[TD="class: text-right"]4%[/TD]
[TD="class: text-right"]75%[/TD]
[TD="class: text-right"]12%[/TD]
[TD="class: text-right"]100%[/TD]
[/TR]
[/TABLE]
[h=4]Figure 8. Percentage of hospitalizations, ICU admissions and deaths with influenza reported by age-group (≥16 year of age), Canada 2015-16[/h]
2016-w10-fg8-eng.gif
Note: The number of hospitalizations reported through CIRN-SOS and IMPACT represents a subset of all influenza-associated adult and paediatric hospitalizations in Canada. Delays in the reporting of data may cause data to change retrospectively. x - Suppressed to prevent residual disclosure.
Figure 8 - Text Description [h=2]Provincial/Territorial Influenza Hospitalizations and Deaths[/h] In week 10, 399 hospitalizations were reported from participating provinces and territoriesFootnote*. The majority of hospitalizations were due to influenza A (89%). The largest proportion of cases reported in week 10 were in adults 65+ years of age (32%).
Since the start of the 2015-16 season, 2,598 laboratory-confirmed influenza-associated hospitalizations have been reported. A total of 2,291 hospitalizations (88%) were due to influenza A and 307 (12%) were due to influenza B. Among cases for which the subtype of influenza A was reported, 92% (1166/1270) were influenza A(H1N1). The largest proportion (29%) of hospitalized cases were ≥65 years of age, followed closely by adults 45-64 years of age (26%). Two hundred and ninety ICU admissions have been reported of which 181 (62%) were due to influenza A(H1N1) and 128 (44%) were in the 45-64 age group. A total of 89 deaths have been reported, all but two were due to influenza A. Adults 45-64 and ≥65 years of age each represented 40% of reported deaths.
[h=3]Figure 9. Percentage of hospitalizations, ICU admissions and deaths with influenza reported by age-group, Canada 2015-16[/h]
2016-w10-fg9-eng.gif
Figure 9 - Text Description Footnote * Note: Influenza-associated hospitalizations are not reported to PHAC by the following Provinces and Territory: BC, NU, and QC. Only hospitalizations that require intensive medical care are reported by SK. ICU admissions are not distinguished among hospital admissions reported from ON. Data may also include cases reported by the IMPACT networks. The number of new influenza-associated hospitalizations and deaths reported for the current week may include cases from ON that occurred in previous weeks, as a result of retrospective updates to the cumulative total. It is important to note that the hospitalization or death does not have to be attributable to influenza, a positive laboratory test is sufficient for reporting.
Return to footnote*referrer
Footnote * Includes three hospitalizations for which age is unknown.
Return to footnote1referrer
See additional data on Reported Influenza Hospitalizations and Deaths in Canada: 2011-12 to 2015-16 on the Public Health Agency of Canada website.
[h=2]Influenza Strain Characterizations[/h] During the 2015-16 influenza season, the National Microbiology Laboratory (NML) has characterized 994 influenza viruses [140 A(H3N2), 611 A(H1N1) and 243 influenza B].
Influenza A (H3N2): When tested by hemagglutination inhibition (HI) assays, 29 H3N2 virus were antigenically characterized as A/Switzerland/9715293/2013-like using antiserum raised against cell-propagated A/Switzerland/9715293/2013.
Sequence analysis was done on 111 H3N2 viruses. All viruses belonged to a genetic group for which most viruses were antigenically related to A/Switzerland/9715293/2013. A/Switzerland/9715293/2013 is the A(H3N2) component of the 2015-16 Northern Hemisphere's vaccine.
Influenza A (H1N1): A total of 611 H1N1 viruses characterized were antigenically similar to A/California/7/2009, the A(H1N1) component of the 2015-16 influenza vaccine.
Influenza B: A total of 77 influenza B viruses characterized were antigenically similar to the vaccine strain B/Phuket/3073/2013. A total of 166 influenza B viruses were characterized as B/Brisbane/60/2008-like, one of the influenza B components of the 2015-16 Northern Hemisphere quadrivalent influenza vaccine.
The recommended components for the 2015-2016 northern hemisphere trivalent influenza vaccine include: an A/California/7/2009(H1N1)pdm09-like virus, an A/Switzerland/9715293/2013(H3N2)-like virus, and a B/Phuket/3073/2013 -like virus (Yamagata lineage). For quadrivalent vaccines, the addition of a B/Brisbane/60/2008-like virus (Victoria lineage) is recommended.
The NML receives a proportion of the influenza positive specimens from provincial laboratories for strain characterization and antiviral resistance testing. Characterization data reflect the results of haemagglutination inhibition testing compared to the reference influenza strains recommended by WHO.

.../

http://healthycanadians.gc.ca/publi...-2016-10-surveillance-influenza/index-eng.php
 
FluWatch report: March 13 to March 19, 2016 (week 11)

http://healthycanadians.gc.ca/public.../index-eng.php

-------------------------------------------------------------------------------------------------------------------------------------
FluWatch report: March 20 to March 26, 2016 (week 12)

Overall Summary
  • For the second consecutive week, influenza activity continued to decrease across Canada.
  • All regions of Canada reported sporadic or localized influenza activity.
  • The number of positive influenza B tests reported continues to increase, but still accounted for only 30% of positive influenza tests in week 12
  • Adults greater than 65 years of age accounted for the majority of hospitalizations in week 12 and account for the largest proportion of hospitalizations to date this season.
  • Hospitalizations, ICU admissions and deaths among the pediatric population, while declining, remain above expected levels based on the past several influenza seasons.
  • For more information on the flu, see our Flu(influenza) web page.
pub-eng.gif
Download the alternative format
(PDF format, 480 KB, 9 pages)
Organization: Public Health Agency of Canada
Date published: 2016-04-01

Related Topics


Are you a primary health care practitioner (General Practitioner, Nurse Practitioner or Registered Nurse) interested in becoming a FluWatch sentinel for the 2015-16 influenza season? Contact us at FluWatch@phac-aspc.gc.ca


On this page
Influenza/Influenza-like Illness Activity (geographic spread)

In week 12, influenza activity was present in all regions of Canada. A total of 21 regions reported localized activity levels across the country. Sporadic influenza/ILI activity was reported in 32 regions across Canada.
Figure 1. Map of overall influenza/ILI activity level by province and territory, Canada, week 12


fg1-legend-eng.gif


Note: Influenza/ILI activity levels, as represented on this map, are assigned and reported by Provincial and Territorial Ministries of Health, based on laboratory confirmations, sentinel ILI rates and reported outbreaks. Please refer to detailed definitions at the end of the report. Maps from previous weeks, including any retrospective updates, are available in the mapping feature found in the Weekly Influenza Reports.
Figure 1 - Text Description Laboratory Confirmed Influenza Detections

In week 12, the percent positive for influenza continued to decrease from the previous week [from 31% in week 11 to 30% in week 12 (Figure 2)]. Compared to the previous five seasons, the percent positive (30%) reported in week 12 was above the five year average for that week and exceeded the expected levels (range 11.3%-19.8%). With the late start to the 2015-16 influenza season, these above normal levels are not unexpected.
Figure 2. Number of positive influenza tests and percentage of tests positive, by type, subtype and report week, Canada, 2015-16

2016-w12-fg2-eng.gif
Figure 2 - Text Description In week 12, there were 2,882 positive influenza tests reported. To date, 81% of influenza detections have been influenza A and among those subtyped, the vast majority have been influenza A(H1N1) [91% (9630/10584]. The number of positive influenza B tests reported is accounting for an increasing proportion of all positive influenza tests reported; this week, influenza B positive tests accounted for 30% of all positive tests.
Figure 3. Cumulative numbers of positive influenza specimens by type/subtype and province, Canada, 2015-16

2016-w12-fg3-eng.gif
Note: Specimens from NT, YT, and NU are sent to reference laboratories in other provinces. Cumulative data includes updates to previous weeks.
Figure 3 - Text Description To date this season, detailed information on age and type/subtype has been received for 24,173 cases. Adults aged 20-44 years accounted for the greatest proportion of influenza cases, followed closely by adults aged 45-64 (Table 1). Adults aged 20-44 and 45-64 years accounted for 55% of reported influenza A(H1N1) cases. Children 5-19 years and adults 20-44 years accounted for 57% of all influenza B cases reported. [TABLE="class: table-responsive table table-condensed table-striped table-hover table-bordered, width: 1140, height: 0"]
[TR="class: bg-primary, bgcolor: #2572B4"]
[/TR]
[TR="class: bg-primary, bgcolor: #2572B4"]
[/TR]
[TR="class: bg-primary, bgcolor: #2572B4"]
[/TR]
[TR]
[TD="class: wb-fnote small wb-init wb-fnote-inited, colspan: 13"]Table 1 - Footnote 1 Table 1 includes specimens for which demographic information was reported. These represent a subset of all positive influenza cases reported.
Return to Table 1 - Footnote1referrer
Table 1 - Footnote 2 Percentage of tests positive for sub-types of influenza A are a percentage of all influenza A detections.
Return to Table 1 - Footnote2referrer
Table 1 - Footnote 3 Unsubtyped: The specimen was typed as influenza A, but no result for subtyping was available.
Return to Table 1 - Footnote3referrer
Table 1 - Footnote x Suppressed to prevent residual disclosure.
Return to Table 1 - Footnotexreferrer[/TD]
[/TR]
[TR="bgcolor: #F5F5F5"]
[TD="class: text-center"]259[/TD]
[TD="class: text-center"]15[/TD]
[TD="class: text-center"]<5[/TD]
[TD="class: text-center"]Table 1 - Footnotex[/TD]
[TD="class: text-center"]112[/TD]
[TD="class: text-center"]3794[/TD]
[TD="class: text-center"]1564[/TD]
[TD="class: text-center"]62[/TD]
[TD="class: text-center"]2168[/TD]
[TD="class: text-center"]710[/TD]
[TD="class: text-center"]4511[/TD]
[TD="class: text-center"]19%[/TD]
[/TR]
[TR]
[TD="class: text-center"]83[/TD]
[TD="class: text-center"]11[/TD]
[TD="class: text-center"]<5[/TD]
[TD="class: text-center"]Table 1 - Footnotex[/TD]
[TD="class: text-center"]148[/TD]
[TD="class: text-center"]2055[/TD]
[TD="class: text-center"]931[/TD]
[TD="class: text-center"]89[/TD]
[TD="class: text-center"]1035[/TD]
[TD="class: text-center"]1351[/TD]
[TD="class: text-center"]3417[/TD]
[TD="class: text-center"]14%[/TD]
[/TR]
[TR="bgcolor: #F5F5F5"]
[TD="class: text-center"]235[/TD]
[TD="class: text-center"]26[/TD]
[TD="class: text-center"]<5[/TD]
[TD="class: text-center"]Table 1 - Footnotex[/TD]
[TD="class: text-center"]122[/TD]
[TD="class: text-center"]4893[/TD]
[TD="class: text-center"]2404[/TD]
[TD="class: text-center"]138[/TD]
[TD="class: text-center"]2351[/TD]
[TD="class: text-center"]1146[/TD]
[TD="class: text-center"]6048[/TD]
[TD="class: text-center"]25%[/TD]
[/TR]
[TR]
[TD="class: text-center"]303[/TD]
[TD="class: text-center"]38[/TD]
[TD="class: text-center"]<5[/TD]
[TD="class: text-center"]Table 1 - Footnotex[/TD]
[TD="class: text-center"]62[/TD]
[TD="class: text-center"]5172[/TD]
[TD="class: text-center"]2310[/TD]
[TD="class: text-center"]172[/TD]
[TD="class: text-center"]2690[/TD]
[TD="class: text-center"]521[/TD]
[TD="class: text-center"]5698[/TD]
[TD="class: text-center"]24%[/TD]
[/TR]
[TR="bgcolor: #F5F5F5"]
[TD="class: text-center"]293[/TD]
[TD="class: text-center"]38[/TD]
[TD="class: text-center"]7[/TD]
[TD="class: text-center"]248[/TD]
[TD="class: text-center"]90[/TD]
[TD="class: text-center"]3827[/TD]
[TD="class: text-center"]1301[/TD]
[TD="class: text-center"]368[/TD]
[TD="class: text-center"]2158[/TD]
[TD="class: text-center"]667[/TD]
[TD="class: text-center"]4499[/TD]
[TD="class: text-center"]19%[/TD]
[/TR]
[TR]
[TD="class: text-center"]1173[/TD]
[TD="class: text-center"]128[/TD]
[TD="class: text-center"]15[/TD]
[TD="class: text-center"]1030[/TD]
[TD="class: text-center"]534[/TD]
[TD="class: text-center"]19741[/TD]
[TD="class: text-center"]8510[/TD]
[TD="class: text-center"]829[/TD]
[TD="class: text-center"]10402[/TD]
[TD="class: text-center"]4395[/TD]
[TD="class: text-center"]24173[/TD]
[TD="class: text-center"]100%[/TD]
[/TR]
[TR="bgcolor: #F5F5F5"]
[TD="class: text-center"]69%[/TD]
[TD="class: text-center"]11%[/TD]
[TD="class: text-center"]1%[/TD]
[TD="class: text-center"]88%[/TD]
[TD="class: text-center"]31%[/TD]
[TD="class: text-center"]82%[/TD]
[TD="class: text-center"]43%[/TD]
[TD="class: text-center"]4%[/TD]
[TD="class: text-center"]53%[/TD]
[TD="class: text-center"]18%[/TD]
[TD="class: text-center"] [/TD]
[TD="class: text-center"] [/TD]
[/TR]
[/TABLE]
For data on other respiratory virus detections see the Respiratory Virus Detections in Canada Report on the Public Health Agency of Canada website.
Influenza-like Illness Consultation Rate

The national ILI consultation rate decreased from the previous week from 53.6 per 1,000 patient visits in week 11, to 43.6 per 1,000 patient visits in week 12.The highest ILI consultation rate was found in the 5-19 years age group (84.2 per 1,000) and the lowest was found in the ≥65 years age group (14.7 per 1,000) (Figure 4).
Figure 4. Influenza-like-illness (ILI) consultation rates by age group and week, Canada, 2015-16

2016-w12-fg4-eng.gif
Delays in the reporting of data may cause data to change retrospectively. In BC, AB, and SK, data are compiled by a provincial sentinel surveillance program for reporting to FluWatch. Not all sentinel physicians report every week.
Figure 4 - Text Description Pharmacy Surveillance

During week 12, the proportion of prescriptions for antivirals decreased to 72.9 antiviral prescriptions per 100,000 total prescriptions, which is slightly higher than the five year historical average for week 12. The proportion of prescriptions for antivirals remains highest among children. In week 12, the proportion reported among children was 199.3 per 100,000 total prescriptions.
Figure 5. Proportion of prescription sales for influenza antivirals by age group and week, Canada, 2015-16

2016-w12-fg5-eng.gif
Note: Pharmacy sales data are provided to the Public Health Agency of Canada by Rx Canada Inc. and sourced from major retail drug chains representing over 3,000 stores nationwide (excluding Nunavut) in 85% of Health Regions. Data provided include the number of new antiviral prescriptions (for Tamiflu[oseltamivir] and Relenza [zanamivir]) and the total number of new prescriptions dispensed by Province/Territory and age group.
* The average weekly proportion includes data from April 2011 to March 2015.
Figure 5 - Text Description Influenza Outbreak Surveillance

In week 12, 27 new laboratory confirmed influenza outbreaks were reported: 13 in long-term care facilities (LTCF), nine in hospitals and 5 in institutions or community settings. Of the outbreaks with known strains or subtypes, one outbreak was due to influenza B, three outbreaks were due to influenza A(H1N1) and three were due to influenza A(Uns). Additionally, one ILI outbreak was reported in a school.
To date this season, 330 outbreaks have been reported. At week 12 in the 2014-15 season, 1,587 outbreaks were reported and in the 2013-14 season,170 outbreaks were reported.
Figure 6. Overall number of new laboratory-confirmed influenza outbreaksFigure 5 - Footnote1 by report week, Canada, 2015-2016

2016-w12-fg6-eng.gif
Figure 6 - Footnote 1 All provinces and territories except NU report influenza outbreaks in long-term care facilities. All provinces and territories with the exception of NU and QC report outbreaks in hospitals. Outbreaks of influenza or influenza-like-illness in other facilities are reported to FluWatch but reporting varies between jurisdictions. Outbreak definitions are included at the end of the report.
Return to Figure 5 - Footnote1referrer
Figure 6 - Text Description Sentinel Pediatric Hospital Influenza Surveillance

Paediatric Influenza Hospitalizations and Deaths

In week 12, 85 hospitalizations were reported by the the Immunization Monitoring Program Active (IMPACT) network, a decrease from the previous three weeks (Figure 7). The largest proportion of hospitalizations were in children aged 5-9 years, accounting for 27% of the hospitalizations. The majority of hospitalizations were due to influenza A (65%).
To date this season, 1007 laboratory-confirmed influenza-associated pediatric (≤16 years of age) hospitalizations have been reported by the IMPACT network: 783 hospitalized cases were due to influenza A and 224 cases were due to influenza B. The greatest proportion of hosptalization cases were in children aged 6-23 months and children 2-4 years, each accounting for 28% of hospitalizations. To date, 169 intensive care unit (ICU) admissions have been reported. Children aged 2 to 4 and 5 to 9 years each accounted for 27% of ICU admissions. A total of 135 ICU cases (80%) reported to have at least one underlying condition or comorbidity. Seven influenza-associated deaths have been reported. [TABLE="class: table table-condensed table-striped table-hover table-bordered, width: 1140"]
[TR="class: bg-primary, bgcolor: #2572B4"]
[/TR]
[TR="class: bg-primary, bgcolor: #2572B4"]
[/TR]
[TR="class: bg-primary, bgcolor: #2572B4"]
[/TR]
[TR]
[TD="class: wb-fnote small wb-init wb-fnote-inited, colspan: 7"]Table 2 - Footnote x Suppressed to prevent residual disclosure.
Return to Table 2 - Footnotexreferrer[/TD]
[/TR]
[TR="bgcolor: #F5F5F5"]
[TD="class: text-center"]106[/TD]
[TD="class: text-center"]32[/TD]
[TD="class: text-center"]<5[/TD]
[TD="class: text-center"]Table 2 - Footnotex[/TD]
[TD="class: text-center"]17[/TD]
[TD="class: text-center"]123 (12%)[/TD]
[/TR]
[TR]
[TD="class: text-center"]233[/TD]
[TD="class: text-center"]69[/TD]
[TD="class: text-center"]7[/TD]
[TD="class: text-center"]157[/TD]
[TD="class: text-center"]49[/TD]
[TD="class: text-center"]282 (28%)[/TD]
[/TR]
[TR="bgcolor: #F5F5F5"]
[TD="class: text-center"]226[/TD]
[TD="class: text-center"]75[/TD]
[TD="class: text-center"]<5[/TD]
[TD="class: text-center"]Table 2 - Footnotex[/TD]
[TD="class: text-center"]53[/TD]
[TD="class: text-center"]279 (28%)[/TD]
[/TR]
[TR]
[TD="class: text-center"]166[/TD]
[TD="class: text-center"]45[/TD]
[TD="class: text-center"]<5[/TD]
[TD="class: text-center"]Table 2 - Footnotex[/TD]
[TD="class: text-center"]73[/TD]
[TD="class: text-center"]239 (24%)[/TD]
[/TR]
[TR="bgcolor: #F5F5F5"]
[TD="class: text-center"]52[/TD]
[TD="class: text-center"]18[/TD]
[TD="class: text-center"]<5[/TD]
[TD="class: text-center"]Table 2 - Footnotex[/TD]
[TD="class: text-center"]32[/TD]
[TD="class: text-center"]84 (8%)[/TD]
[/TR]
[TR]
[TD="class: text-center"]783[/TD]
[TD="class: text-center"]239[/TD]
[TD="class: text-center"]19[/TD]
[TD="class: text-center"]525[/TD]
[TD="class: text-center"]224[/TD]
[TD="class: text-center"]1007 (100%)[/TD]
[/TR]
[/TABLE]
Figure 7. Number of cases of influenza reported by sentinel hospital networks, by week, Canada, 2015-16, paediatric and adult hospitalizations (≤16 years of age, IMPACT; ≥16 years of age, CIRN-SOS)

2016-w12-fg7-eng.gif
Not included in Table 2 and Figure 7 are two IMPACT cases that were due to co-infections of influenza A and B.
Figure 7 - Text Description Adult Influenza Hospitalizations and Deaths

In week 12, 57 hospitalizations were reported by the Canadian Immunization Research Network Serious Outcome Surveillance (CIRN-SOS) (Figure 7). The largest proportion of hospitalizations were in adults 65+ years of age (53%) and due to influenza A (81%).
To date this season, 791 laboratory-confirmed influenza-associated adult (≥16 years of age) hospitalizations have been reported by CIRN-SOS (Table 3). The majority of hospitalized cases were due to influenza A (86%) and the largest reported proportion were among adults ≥65 years of age (48%). One hundred and twelve intensive care unit (ICU) admissions have been reported and among those, 101 (90%) were due to influenza A. A total of 69 ICU cases (62%) reported to have at least one underlying condition or comorbidity. Twenty-seven deaths have been reported this season with the majority of deaths reported in adults ≥65 years of age (67%). [TABLE="class: table table-condensed table-striped table-hover table-bordered, width: 1140"]
[TR="class: bg-primary, bgcolor: #2572B4"]
[/TR]
[TR="class: bg-primary, bgcolor: #2572B4"]
[/TR]
[TR="class: bg-primary, bgcolor: #2572B4"]
[/TR]
[TR]
[TD="class: wb-fnote small wb-init wb-fnote-inited, colspan: 7"]Table 3 - Footnote x Suppressed to prevent residual disclosure.
Return to Table 3 - Footnotexreferrer[/TD]
[/TR]
[TR="bgcolor: #F5F5F5"]
[TD="class: text-center"]<5[/TD]
[TD="class: text-center"]<5[/TD]
[TD="class: text-center"]0[/TD]
[TD="class: text-center"]<5[/TD]
[TD="class: text-center"]0[/TD]
[TD="class: text-center"]4 (1%)[/TD]
[/TR]
[TR]
[TD="class: text-center"]106[/TD]
[TD="class: text-center"]33[/TD]
[TD="class: text-center"]<5[/TD]
[TD="class: text-center"]Table 3 - Footnotex[/TD]
[TD="class: text-center"]21[/TD]
[TD="class: text-center"]127 (16%)[/TD]
[/TR]
[TR="bgcolor: #F5F5F5"]
[TD="class: text-center"]245[/TD]
[TD="class: text-center"]69[/TD]
[TD="class: text-center"]<5[/TD]
[TD="class: text-center"]Table 3 - Footnotex[/TD]
[TD="class: text-center"]25[/TD]
[TD="class: text-center"]270 (34%)[/TD]
[/TR]
[TR]
[TD="class: text-center"]321[/TD]
[TD="class: text-center"]73[/TD]
[TD="class: text-center"]21[/TD]
[TD="class: text-center"]227[/TD]
[TD="class: text-center"]62[/TD]
[TD="class: text-center"]383 (48%)[/TD]
[/TR]
[TR="bgcolor: #F5F5F5"]
[TD="class: text-center"]6[/TD]
[TD="class: text-center"]<5[/TD]
[TD="class: text-center"]0[/TD]
[TD="class: text-center"]<5[/TD]
[TD="class: text-center"]<5[/TD]
[TD="class: text-center"]7 (1%)[/TD]
[/TR]
[TR]
[TD="class: text-center"]682[/TD]
[TD="class: text-center"]182[/TD]
[TD="class: text-center"]25[/TD]
[TD="class: text-center"]475[/TD]
[TD="class: text-center"]109[/TD]
[TD="class: text-center"]791[/TD]
[/TR]
[TR="bgcolor: #F5F5F5"]
[TD="class: text-center"]86%[/TD]
[TD="class: text-center"]27%[/TD]
[TD="class: text-center"]4%[/TD]
[TD="class: text-center"]70%[/TD]
[TD="class: text-center"]14%[/TD]
[TD="class: text-center"]100%[/TD]
[/TR]
[/TABLE]
Figure 8. Percentage of hospitalizations, ICU admissions and deaths with influenza reported by age-group (≥16 year of age), Canada 2015-16

2016-w12-fg8-eng.gif
Note: The number of hospitalizations reported through CIRN-SOS and IMPACT represents a subset of all influenza-associated adult and paediatric hospitalizations in Canada. Delays in the reporting of data may cause data to change retrospectively.
x - Suppressed to prevent residual disclosure.
Figure 8 - Text Description Provincial/Territorial Influenza Hospitalizations and Deaths

In week 12, 273 hospitalizations were reported from participating provinces and territoriesFootnote*. The majority of hospitalizations were due to influenza A (78%). The largest proportion of cases reported in week 12 were in adults 65+ years of age (31%).
Since the start of the 2015-16 season, 3,491 laboratory-confirmed influenza-associated hospitalizations have been reported. A total of 3,024 hospitalizations (87%) were due to influenza A and 467 (13%) were due to influenza B. Among cases for which the subtype of influenza A was reported, 93% (1442/1554) were influenza A(H1N1). The largest proportion (30%) of hospitalized cases were ≥65 years of age, followed closely by adults 45-64 years of age (27%). Three hundred and eighty nine ICU admissions have been reported of which 225 (58%) were due to influenza A(H1N1) and 175 (45%) were in the 45-64 age group. A total of 140 deaths have been reported; all but 10 were associated with influenza A. Adults ≥65 years of age each represented 46% of reported deaths.
Figure 9. Percentage of hospitalizations, ICU admissions and deaths with influenza reported by age-group, Canada 2015-16

2016-w12-fg9-eng.gif
x - Suppressed to prevent residual disclosure.
Figure 9 - Text Description Footnote * Note: Influenza-associated hospitalizations are not reported to PHAC by the following Provinces and Territory: BC, NU, and QC. Only hospitalizations that require intensive medical care are reported by SK. ICU admissions are not distinguished among hospital admissions reported from ON. Data may also include cases reported by the IMPACT networks. The number of new influenza-associated hospitalizations and deaths reported for the current week may include cases from ON that occurred in previous weeks, as a result of retrospective updates to the cumulative total. It is important to note that the hospitalization or death does not have to be attributable to influenza, a positive laboratory test is sufficient for reporting.
Return to footnote*referrer
Footnote * Includes three hospitalizations for which age is unknown.
Return to footnote1referrer
See additional data on Reported Influenza Hospitalizations and Deaths in Canada: 2011-12 to 2015-16 on the Public Health Agency of Canada website.
Influenza Strain Characterizations

During the 2015-16 influenza season, the National Microbiology Laboratory (NML) has characterized 1312 influenza viruses [149 A(H3N2), 775 A(H1N1) and 388 influenza B].
Influenza A (H3N2): When tested by hemagglutination inhibition (HI) assays, 35 H3N2 virus were antigenically characterized as A/Switzerland/9715293/2013-like using antiserum raised against cell-propagated A/Switzerland/9715293/2013.
Sequence analysis was done on 114 H3N2 viruses. All viruses belonged to a genetic group for which most viruses were antigenically related to A/Switzerland/9715293/2013. A/Switzerland/9715293/2013 is the A(H3N2) component of the 2015-16 Northern Hemisphere's vaccine.
Influenza A (H1N1): A total of 775 H1N1 viruses characterized were antigenically similar to A/California/7/2009, the A(H1N1) component of the 2015-16 influenza vaccine.
Influenza B: A total of 104 influenza B viruses characterized were antigenically similar to the vaccine strain B/Phuket/3073/2013. A total of 284 influenza B viruses were characterized as B/Brisbane/60/2008-like, one of the influenza B components of the 2015-16 Northern Hemisphere quadrivalent influenza vaccine.
The recommended components for the 2015-2016 northern hemisphere trivalent influenza vaccine include: an A/California/7/2009(H1N1)pdm09-like virus, an A/Switzerland/9715293/2013(H3N2)-like virus, and a B/Phuket/3073/2013 -like virus (Yamagata lineage). For quadrivalent vaccines, the addition of a B/Brisbane/60/2008-like virus (Victoria lineage) is recommended.
The NML receives a proportion of the influenza positive specimens from provincial laboratories for strain characterization and antiviral resistance testing. Characterization data reflect the results of haemagglutination inhibition testing compared to the reference influenza strains recommended by WHO.

.../
http://healthycanadians.gc.ca/public.../index-eng.php
 
[h=1]FluWatch report: March 27 to April 2, 2016 (week 13)[/h] [h=2]Overall Summary[/h]
  • Influenza activity peaked nationally in week 10; however, lower but sustained activity is being reported throughout the country.
  • Most regions of Canada reported sporadic or localized influenza activity.
  • Compared to the previous two weeks, there was an increase in the number of provincial and territorial hospitalizations reported in week 13 but the number reported (353) remains below the week 10 peak.
  • The number of influenza B detections is increasing, while influenza A detections are decreasing. Overall, laboratory detections of influenza are steadily decreasing.
  • Hospitalizations, ICU admissions and deaths among the pediatric population, while declining, remain above expected levels based on the past several influenza seasons.
  • For more information on the flu, see our Flu(influenza) web page.

pub-eng.gif
Download the alternative format
(PDF format, 863 KB, 9 pages)
Organization: Public Health Agency of Canada
Date published: 2016-04-08

[h=2]Related Topics[/h]

Are you a primary health care practitioner (General Practitioner, Nurse Practitioner or Registered Nurse) interested in becoming a FluWatch sentinel for the 2015-16 influenza season? Contact us at FluWatch@phac-aspc.gc.ca


[h=2]On this page[/h]
[h=2]Influenza/Influenza-like Illness Activity (geographic spread)[/h] In week 13, influenza activity was reported in all but four regions of Canada. A total of 23 regions reported localized activity levels across the country. Sporadic influenza/ILI activity was reported in 26 regions across Canada.
[h=3]Figure 1. Map of overall influenza/ILI activity level by province and territory, Canada, week 13[/h]
fg1-legend-eng.gif


Note: Influenza/ILI activity levels, as represented on this map, are assigned and reported by Provincial and Territorial Ministries of Health, based on laboratory confirmations, sentinel ILI rates and reported outbreaks. Please refer to detailed definitions at the end of the report. Maps from previous weeks, including any retrospective updates, are available in the mapping feature found in the Weekly Influenza Reports.
Figure 1 - Text Description [h=2]Laboratory Confirmed Influenza Detections[/h] In week 13, the percent positive for influenza continued to decrease from the previous week [from 30% in week 12 to 28% in week 13] (Figure 2). Compared to the previous five seasons, the percent positive (28%) reported in week 13 was above the five year average for that week and exceeded the expected levels (range 12.0%-17.9%). With the late start to the 2015-16 influenza season, these above normal levels are not unexpected.
[h=3]Figure 2. Number of positive influenza tests and percentage of tests positive, by type, subtype and report week, Canada, 2015-16[/h]
2016-w13-fg2-eng.gif
Figure 2 - Text Description In week 13, there were 2,837 positive influenza tests reported. The number of positive influenza B tests reported is accounting for an increasing proportion of all positive influenza tests reported. This week, influenza B accounted for 36% of all positive tests. To date, 80% of influenza detections have been influenza A and among those subtyped, the vast majority have been influenza A(H1N1) [91% (10155/11124)].
[h=3]Figure 3. Cumulative numbers of positive influenza specimens by type/subtype and province, Canada, 2015-16[/h]
2016-w13-fg3-eng.gif
Note: Specimens from NT, YT, and NU are sent to reference laboratories in other provinces. Cumulative data includes updates to previous weeks.
Figure 3 - Text Description To date this season, detailed information on age and type/subtype has been received for 27,158 cases. Children and teenagers (0-19 years of age) accounted for almost one third of all influenza cases (32%). Children (0-19), young adults (20-44) and middle-aged adults (45-64) accounted for approximately an equal proportion of influenza A(H1N1) cases (28%).
[TABLE="class: table-responsive table table-condensed table-striped table-hover table-bordered, width: 1140, height: 0"]
Table 1. Weekly and cumulative numbers of positive influenza specimens by type, subtype and age-group reported through case-based laboratory reportingTable 1 - Footnote1, Canada, 2015-16 [TR="class: bg-primary, bgcolor: #2572B4"]
Age groups (years) Weekly (March 27 to April 2, 2016) Cumulative (August 30, 2015 to April 2, 2016) [/TR]
[TR="class: bg-primary, bgcolor: #2572B4"]
Influenza A B Influenza A B Influenza A and B [/TR]
[TR="class: bg-primary, bgcolor: #2572B4"]
A Total A(H1) pdm09 A(H3) A UnSTable 1 - Footnote3 Total A Total A(H1) pdm09 A(H3) A UnSTable 1 - Footnote3 Total # % [/TR]
[TR]
[TD="class: wb-fnote small wb-init wb-fnote-inited, colspan: 13"] Table 1 - Footnote 1 Table 1 includes specimens for which demographic information was reported. These represent a subset of all positive influenza cases reported.
Return to Table 1 - Footnote1referrer
Table 1 - Footnote 2 Percentage of tests positive for sub-types of influenza A are a percentage of all influenza A detections.
Return to Table 1 - Footnote2referrer
Table 1 - Footnote 3 Unsubtyped: The specimen was typed as influenza A, but no result for subtyping was available.
Return to Table 1 - Footnote3referrer
Table 1 - Footnote x Suppressed to prevent residual disclosure.
Return to Table 1 - Footnotexreferrer
[/TD]
[/TR]
[TR="bgcolor: #F5F5F5"]
<5 [TD]171[/TD]
[TD]30[/TD]
[TD]<5[/TD]
[TD]Table 1 - Footnotex[/TD]
[TD]129[/TD]
[TD]4127[/TD]
[TD]1650[/TD]
[TD]63[/TD]
[TD]2414[/TD]
[TD]895[/TD]
[TD]5023[/TD]
[TD]18%[/TD]
[/TR]
[TR]
5-19 [TD]56[/TD]
[TD]9[/TD]
[TD]0[/TD]
[TD]47[/TD]
[TD]196[/TD]
[TD]2226[/TD]
[TD]984[/TD]
[TD]92[/TD]
[TD]1150[/TD]
[TD]1660[/TD]
[TD]3887[/TD]
[TD]14%[/TD]
[/TR]
[TR="bgcolor: #F5F5F5"]
20-44 [TD]209[/TD]
[TD]52[/TD]
[TD]<5[/TD]
[TD]Table 1 - Footnotex[/TD]
[TD]155[/TD]
[TD]5387[/TD]
[TD]2595[/TD]
[TD]146[/TD]
[TD]2646[/TD]
[TD]1403[/TD]
[TD]6790[/TD]
[TD]25%[/TD]
[/TR]
[TR]
45-64 [TD]287[/TD]
[TD]79[/TD]
[TD]0[/TD]
[TD]208[/TD]
[TD]73[/TD]
[TD]5747[/TD]
[TD]2549[/TD]
[TD]175[/TD]
[TD]3023[/TD]
[TD]646[/TD]
[TD]6393[/TD]
[TD]24%[/TD]
[/TR]
[TR="bgcolor: #F5F5F5"]
65+ [TD]262[/TD]
[TD]60[/TD]
[TD]<5[/TD]
[TD]Table 1 - Footnotex[/TD]
[TD]118[/TD]
[TD]4233[/TD]
[TD]1437[/TD]
[TD]376[/TD]
[TD]2420[/TD]
[TD]832[/TD]
[TD]5065[/TD]
[TD]19%[/TD]
[/TR]
[TR]
Total [TD]985[/TD]
[TD]230[/TD]
[TD]6[/TD]
[TD]749[/TD]
[TD]671[/TD]
[TD]21720[/TD]
[TD]9215[/TD]
[TD]852[/TD]
[TD]11653[/TD]
[TD]5436[/TD]
[TD]27158[/TD]
[TD]100%[/TD]
[/TR]
[TR="bgcolor: #F5F5F5"]
PercentageTable 1 - Footnote2 [TD]59%[/TD]
[TD]23%[/TD]
[TD]1%[/TD]
[TD]76%[/TD]
[TD]41%[/TD]
[TD]80%[/TD]
[TD]42%[/TD]
[TD]4%[/TD]
[TD]54%[/TD]
[TD]20%[/TD]
[TD] [/TD]
[TD] [/TD]
[/TR]
[/TABLE]

For data on other respiratory virus detections see the Respiratory Virus Detections in Canada Report on the Public Health Agency of Canada website.
[h=2]Influenza-like Illness Consultation Rate[/h] The national ILI consultation rate increased slightly from the previous week from 43.6 per 1,000 patient visits in week 12, to 45.2 per 1,000 patient visits in week 13. The highest ILI consultation rate was found in the 0-4 years age group (69.7 per 1,000) and the lowest was found in the ≥65 years age group (35.2 per 1,000) (Figure 4).
[h=3]Figure 4. Influenza-like-illness (ILI) consultation rates by age group and week, Canada, 2015-16[/h]
2016-w13-fg4-eng.gif
Delays in the reporting of data may cause data to change retrospectively. In BC, AB, and SK, data are compiled by a provincial sentinel surveillance program for reporting to FluWatch. Not all sentinel physicians report every week.
Figure 4 - Text Description [h=2]Pharmacy Surveillance[/h] During week 13, the proportion of prescriptions for antivirals increased slightly to 78.6 antiviral prescriptions per 100,000 total prescriptions, which is slightly higher than the five year historical average for week 13. The proportion of prescriptions for antivirals remains highest among children. In week 13, the proportion reported among children was 162.4 per 100,000 total prescriptions.
[h=3]Figure 5. Proportion of prescription sales for influenza antivirals by age group and week, Canada, 2015-16[/h]
2016-w13-fg5-eng.gif
Note: Pharmacy sales data are provided to the Public Health Agency of Canada by Rx Canada Inc. and sourced from major retail drug chains representing over 3,000 stores nationwide (excluding Nunavut) in 85% of Health Regions. Data provided include the number of new antiviral prescriptions (for Tamiflu[oseltamivir] and Relenza [zanamivir]) and the total number of new prescriptions dispensed by Province/Territory and age group.
* The average weekly proportion includes data from April 2011 to March 2015.
Figure 5 - Text Description [h=2]Influenza Outbreak Surveillance[/h] In week 13, 21 new laboratory confirmed influenza outbreaks were reported: 12 in long-term care facilities (LTCF), five in hospitals and four in institutions or community settings. Of the outbreaks with known strains or subtypes, three outbreaks were due to influenza B, two outbreaks were due to influenza A(H1N1), one outbreak was due to influenza A(H3N2) and three were due to influenza A(UnS). Additionally, one ILI outbreak was reported in a school.
To date this season, 354 outbreaks have been reported. At week 13 in the 2014-15 season, 1,527 outbreaks were reported and in the 2013-14 season,184 outbreaks were reported.
[h=3]Figure 6. Overall number of new laboratory-confirmed influenza outbreaksFigure 5 - Footnote1 by report week, Canada, 2015-2016[/h]
2016-w13-fg6-eng.gif
Figure 6 - Footnote 1 All provinces and territories except NU report influenza outbreaks in long-term care facilities. All provinces and territories with the exception of NU and QC report outbreaks in hospitals. Outbreaks of influenza or influenza-like-illness in other facilities are reported to FluWatch but reporting varies between jurisdictions. Outbreak definitions are included at the end of the report.
Return to Figure 5 - Footnote1referrer
Figure 6 - Text Description [h=2]Sentinel Pediatric Hospital Influenza Surveillance[/h] [h=3]Paediatric Influenza Hospitalizations and Deaths[/h] Hospitalizations reported by the the Immunization Monitoring Program Active (IMPACT) network continue to decrease (Figure 7). In week 13, 61 hospitalizations were reported. The largest proportion of hospitalizations were in children aged 0-2 years, accounting for 38% of the hospitalizations. The majority of hospitalizations in week 13 were due to influenza A (57%); however, the proportion of weekly hospitalizations due to influenza B has been increasing steadily since week 08.
To date this season, 1,075 laboratory-confirmed influenza-associated pediatric (≤16 years of age) hospitalizations have been reported by the IMPACT network: 822 hospitalized cases (76%) were due to influenza A and 253 cases (24%) were due to influenza B. The greatest proportion of hospitalized cases were in children aged 0-2 years (41 %). To date, 180 intensive care unit (ICU) admissions have been reported. Children aged 2 to 4 and 5 to 9 years each accounted for 27% of ICU admissions. A total of 113 ICU cases (62%) reported at least one underlying condition or comorbidity. Eight influenza-associated deaths have been reported.
[TABLE="class: table table-condensed table-striped table-hover table-bordered, width: 1140"]
Table 2 - Cumulative numbers of peadiatric hospitalizations (≤16 years of age) with influenza reported by the IMPACT network, Canada, 2015-16 [TR="class: bg-primary, bgcolor: #2572B4"]
Age Groups Cumulative (30 Aug. 2015 to 2 April 2016) [/TR]
[TR="class: bg-primary, bgcolor: #2572B4"]
Influenza A Influenza B Influenza A and B (#(%)) [/TR]
[TR="class: bg-primary, bgcolor: #2572B4"]
A Total A(H1) pdm09 A(H3) A (UnS) B Total [/TR]
[TR]
[TD="class: wb-fnote small wb-init wb-fnote-inited, colspan: 7"] Table 2 - Footnote x Suppressed to prevent residual disclosure.
Return to Table 2 - Footnotexreferrer
[/TD]
[/TR]
[TR="bgcolor: #F5F5F5"]
0-5m [TD]110[/TD]
[TD]32[/TD]
[TD]5[/TD]
[TD]73[/TD]
[TD]19[/TD]
[TD]129 (12%)[/TD]
[/TR]
[TR]
6-23m [TD]251[/TD]
[TD]72[/TD]
[TD]7[/TD]
[TD]172[/TD]
[TD]57[/TD]
[TD]308 (29%)[/TD]
[/TR]
[TR="bgcolor: #F5F5F5"]
2-4y [TD]236[/TD]
[TD]76[/TD]
[TD]<5[/TD]
[TD]Table 2 - Footnotex[/TD]
[TD]61[/TD]
[TD]297 (28%)[/TD]
[/TR]
[TR]
5-9y [TD]172[/TD]
[TD]46[/TD]
[TD]<5[/TD]
[TD]Table 2 - Footnotex[/TD]
[TD]81[/TD]
[TD]253 (24%)[/TD]
[/TR]
[TR="bgcolor: #F5F5F5"]
10-16y [TD]53[/TD]
[TD]18[/TD]
[TD]<5[/TD]
[TD]Table 2 - Footnotex[/TD]
[TD]35[/TD]
[TD]88 (8%)[/TD]
[/TR]
[TR]
Total [TD]822[/TD]
[TD]244[/TD]
[TD]20[/TD]
[TD]558[/TD]
[TD]253[/TD]
[TD]1075 (100%)[/TD]
[/TR]
[/TABLE]
[h=4]Figure 7. Number of cases of influenza reported by sentinel hospital networks, by week, Canada, 2015-16, paediatric and adult hospitalizations (≤16 years of age, IMPACT; ≥16 years of age, CIRN-SOS)[/h]
2016-w13-fg7-eng.gif
Not included in Table 2 and Figure 7 are two IMPACT cases that were due to co-infections of influenza A and B.
Figure 7 - Text Description [h=3]Adult Influenza Hospitalizations and Deaths[/h] In week 13, 73 hospitalizations were reported by the Canadian Immunization Research Network Serious Outcome Surveillance (CIRN-SOS) (Figure 7). The largest proportion of hospitalizations was in adults 65+ years of age (51%) and due to influenza A (73%).
To date this season, 898 laboratory-confirmed influenza-associated adult (≥16 years of age) hospitalizations have been reported by CIRN-SOS (Table 3). The majority of hospitalized cases were due to influenza A (85%) and the largest reported proportion was among adults ≥65 years of age (49%). One hundred and thirty intensive care unit (ICU) admissions have been reported. A total of 69 ICU cases reported to have at least one underlying condition or comorbidity. A total of 32 deaths have been reported this season with the majority of deaths reported in adults ≥65 years of age (63%).
[TABLE="class: table table-condensed table-striped table-hover table-bordered, width: 1140"]
Table 3 - Cumulative numbers of adult hospitalizations (≥16 years of age) with influenza reported by the CIRN-SOS network, Canada, 2015-16 [TR="class: bg-primary, bgcolor: #2572B4"]
Age groups (years) Cumulative (1 Nov. 2015 to 2 April 2016) [/TR]
[TR="class: bg-primary, bgcolor: #2572B4"]
Influenza A B Influenza A and B [/TR]
[TR="class: bg-primary, bgcolor: #2572B4"]
A Total A(H1) pdm09 A(H3) A(UnS) Total # (%) [/TR]
[TR]
[TD="class: wb-fnote small wb-init wb-fnote-inited, colspan: 7"] Table 3 - Footnote x Suppressed to prevent residual disclosure.
Return to Table 3 - Footnotexreferrer
[/TD]
[/TR]
[TR="bgcolor: #F5F5F5"]
16-20 [TD]Table 3 - Footnotex[/TD]
[TD]<5[/TD]
[TD]0[/TD]
[TD]<5[/TD]
[TD]<5[/TD]
[TD]6 (1%)[/TD]
[/TR]
[TR]
20-44 [TD]118[/TD]
[TD]35[/TD]
[TD]<5[/TD]
[TD]Table 3 - Footnotex[/TD]
[TD]27[/TD]
[TD]145 (16%)[/TD]
[/TR]
[TR="bgcolor: #F5F5F5"]
45-64 [TD]274[/TD]
[TD]78[/TD]
[TD]<5[/TD]
[TD]Table 3 - Footnotex[/TD]
[TD]29[/TD]
[TD]303 (34%)[/TD]
[/TR]
[TR]
65+ [TD]363[/TD]
[TD]81[/TD]
[TD]21[/TD]
[TD]261[/TD]
[TD]76[/TD]
[TD]439 (49%)[/TD]
[/TR]
[TR="bgcolor: #F5F5F5"]
Unknown [TD]<5[/TD]
[TD]0[/TD]
[TD]0[/TD]
[TD]<5[/TD]
[TD]<5[/TD]
[TD]5 (1%)[/TD]
[/TR]
[TR]
Total [TD]764[/TD]
[TD]200[/TD]
[TD]25[/TD]
[TD]539[/TD]
[TD]134[/TD]
[TD]898[/TD]
[/TR]
[TR="bgcolor: #F5F5F5"]
% [TD]85%[/TD]
[TD]26%[/TD]
[TD]3%[/TD]
[TD]71%[/TD]
[TD]15%[/TD]
[TD]100%[/TD]
[/TR]
[/TABLE]
[h=4]Figure 8. Percentage of hospitalizations, ICU admissions and deaths with influenza reported by age-group (≥16 year of age), Canada 2015-16[/h]
2016-w13-fg8-eng.gif
Note: The number of hospitalizations reported through CIRN-SOS and IMPACT represents a subset of all influenza-associated adult and paediatric hospitalizations in Canada. Delays in the reporting of data may cause data to change retrospectively.
x - Suppressed to prevent residual disclosure.
Figure 8 - Text Description [h=2]Provincial/Territorial Influenza Hospitalizations and Deaths[/h] In week 13, 353 hospitalizations were reported by participating provinces and territoriesFootnote*. The majority of hospitalizations were due to influenza A (78%). The largest proportion of cases reported in week 13 was in adults 65+ years of age (35%).
Since the start of the 2015-16 season, 3,990 laboratory-confirmed influenza-associated hospitalizations have been reported. A total of 3,401 hospitalizations (85%) were due to influenza A and 589 (15%) were due to influenza B. Among cases for which the subtype of influenza A was reported, 93% (1601/1715) were influenza A(H1N1). The largest proportion (30%) of hospitalized cases were ≥65 years of age, followed closely by adults 45-64 years of age (27%). Three hundred and ninety-four ICU admissions have been reported of which 225 (57%) were due to influenza A(H1N1) and 183 (46%) were in the 45-64 age group. A total of 161 deaths have been reported; all but 14 were associated with influenza A. Adults ≥65 years of age represent 49% of reported deaths.
[h=3]Figure 9. Percentage of hospitalizations, ICU admissions and deaths with influenza reported by age-group, Canada 2015-16[/h]
2016-w13-fg9-eng.gif
Figure 9 - Text Description Footnote * Note: Influenza-associated hospitalizations are not reported to PHAC by the following Provinces and Territory: BC, NU, and QC. Only hospitalizations that require intensive medical care are reported by SK. ICU admissions are not distinguished among hospital admissions reported from ON. Data may also include cases reported by the IMPACT networks. The number of new influenza-associated hospitalizations and deaths reported for the current week may include cases from ON that occurred in previous weeks, as a result of retrospective updates to the cumulative total. It is important to note that the hospitalization or death does not have to be attributable to influenza, a positive laboratory test is sufficient for reporting.
Return to footnote*referrer
Footnote * Includes three hospitalizations for which age is unknown.
Return to footnote1referrer
See additional data on Reported Influenza Hospitalizations and Deaths in Canada: 2011-12 to 2015-16 on the Public Health Agency of Canada website.
[h=2]Influenza Strain Characterizations[/h] During the 2015-16 influenza season, the National Microbiology Laboratory (NML) has characterized 1442 influenza viruses [159 A(H3N2), 857 A(H1N1) and 426 influenza B].
Influenza A (H3N2): When tested by hemagglutination inhibition (HI) assays, 40 H3N2 viruses were antigenically characterized as A/Switzerland/9715293/2013-like using antiserum raised against cell-propagated A/Switzerland/9715293/2013.
Sequence analysis was done on 119 H3N2 viruses. All viruses belonged to a genetic group for which most viruses were antigenically related to A/Switzerland/9715293/2013. A/Switzerland/9715293/2013 is the A(H3N2) component of the 2015-16 Northern Hemisphere's vaccine.
Influenza A (H1N1): A total of 857 H1N1 viruses characterized were antigenically similar to A/California/7/2009, the A(H1N1) component of the 2015-16 influenza vaccine.
Influenza B: A total of 112 influenza B viruses characterized were antigenically similar to the vaccine strain B/Phuket/3073/2013. A total of 314 influenza B viruses were characterized as B/Brisbane/60/2008-like, one of the influenza B components of the 2015-16 Northern Hemisphere quadrivalent influenza vaccine.
The recommended components for the 2015-2016 northern hemisphere trivalent influenza vaccine include: an A/California/7/2009(H1N1)pdm09-like virus, an A/Switzerland/9715293/2013(H3N2)-like virus, and a B/Phuket/3073/2013 -like virus (Yamagata lineage). For quadrivalent vaccines, the addition of a B/Brisbane/60/2008-like virus (Victoria lineage) is recommended.
The NML receives a proportion of the influenza positive specimens from provincial laboratories for strain characterization and antiviral resistance testing. Characterization data reflect the results of haemagglutination inhibition testing compared to the reference influenza strains recommended by WHO.

.../
http://healthycanadians.gc.ca/publi...-2016-13-surveillance-influenza/index-eng.php
 
[h=1]FluWatch report: April 3 to April 9, 2016 (week 14)[/h] [h=2]Overall Summary[/h]
  • Influenza activity peaked nationally in in the second week of March; however, lower but sustained activity is being reported throughout the country.
  • All regions of Canada reported sporadic or localized influenza activity.
  • Both influenza B and influenza A detections decreased in week 14. To date this season, a total of 34,105 positive influenza tests have been reported.
  • Hospitalizations, ICU admissions and deaths among the pediatric population, while declining, remain above expected levels based on the past several influenza seasons.
  • Despite higher pediatric hospitalizations reported, the pediatric population account for the smallest proportion of all deaths reported.
  • For more information on the flu, see our Flu(influenza) web page.

pub-eng.gif
Download the alternative format
(PDF format, 869 KB, 9 pages)
Organization: Public Health Agency of Canada
Date published: 2016-04-15

[h=2]Related Topics[/h]

Are you a primary health care practitioner (General Practitioner, Nurse Practitioner or Registered Nurse) interested in becoming a FluWatch sentinel for the 2015-16 influenza season? Contact us at FluWatch@phac-aspc.gc.ca


[h=2]On this page[/h]
[h=2]Influenza/Influenza-like Illness Activity (geographic spread)[/h] In week 14, influenza activity was reported in 50 regions across Canada. A total of 30 regions reported sporadic activity levels, while the remaining 20 reported localized activity levels.
[h=3]Figure 1. Map of overall influenza/ILI activity level by province and territory, Canada, week 14[/h]
fg1-legend-eng.gif


Note: Influenza/ILI activity levels, as represented on this map, are assigned and reported by Provincial and Territorial Ministries of Health, based on laboratory confirmations, sentinel ILI rates and reported outbreaks. Please refer to detailed definitions at the end of the report. Maps from previous weeks, including any retrospective updates, are available in the mapping feature found in the Weekly Influenza Reports.
Figure 1 - Text Description [h=2]Laboratory Confirmed Influenza Detections[/h] In week 14, the percentage of tests positive for influenza continued to decrease from the previous week [from 28% in week 13 to 23% in week 14] (Figure 2). Compared to the previous five seasons, the percent positive (23%) reported in week 14 was above the five year average for that week and exceeded the expected levels (range 11.1%-16.7%). With the late start to the 2015-16 influenza season, these elevated levels are not unexpected.
[h=3]Figure 2. Number of positive influenza tests and percentage of tests positive, by type, subtype and report week, Canada, 2015-16[/h]
2016-w14-fg2-eng.gif
Figure 2 - Text Description In week 14, there were 1,914 positive influenza tests reported. The number of positive influenza B tests accounted for an increasing proportion of all positive influenza tests reported. Both influenza B and influenza A detections decreased in week 14. This week, influenza B accounted for 41% of all positive tests. To date, 79% of influenza detections have been influenza A and among those subtyped, the vast majority have been influenza A(H1N1) [91% (10510/11511)].
[h=3]Figure 3. Cumulative numbers of positive influenza specimens by type/subtype and province, Canada, 2015-16[/h]
2016-w14-fg3-eng.gif
Note: Specimens from NT, YT, and NU are sent to reference laboratories in other provinces. Cumulative data includes updates to previous weeks.
Figure 3 - Text Description To date this season, detailed information on age and type/subtype has been received for 28,818 cases. Children and teenagers (0-19 years of age) accounted for one third of all influenza cases (33%). Children (0-19), young adults (20-44) and middle-aged adults (45-64) accounted for approximately an equal proportion of influenza A(H1N1) cases (28%).
[TABLE="class: table-responsive table table-condensed table-striped table-hover table-bordered, width: 1140, height: 0"]
Table 1. Weekly and cumulative numbers of positive influenza specimens by type, subtype and age-group reported through case-based laboratory reportingTable 1 - Footnote1, Canada, 2015-16 [TR="class: bg-primary, bgcolor: #2572B4"]
Age groups (years) Weekly (April 3 to April 9, 2016) Cumulative (August 30, 2015 to April 9, 2016) [/TR]
[TR="class: bg-primary, bgcolor: #2572B4"]
Influenza A B Influenza A B Influenza A and B [/TR]
[TR="class: bg-primary, bgcolor: #2572B4"]
A Total A(H1) pdm09 A(H3) A UnSTable 1 - Footnote3 Total A Total A(H1) pdm09 A(H3) A UnSTable 1 - Footnote3 Total # % [/TR]
[TR]
[TD="class: wb-fnote small wb-init wb-fnote-inited, colspan: 13"] Table 1 - Footnote 1 Table 1 includes specimens for which demographic information was reported. These represent a subset of all positive influenza cases reported.
Return to Table 1 - Footnote1referrer
Table 1 - Footnote 2 Percentage of tests positive for sub-types of influenza A are a percentage of all influenza A detections.
Return to Table 1 - Footnote2referrer
Table 1 - Footnote 3 Unsubtyped: The specimen was typed as influenza A, but no result for subtyping was available.
Return to Table 1 - Footnote3referrer
Table 1 - Footnote x Suppressed to prevent residual disclosure.
Return to Table 1 - Footnotexreferrer
[/TD]
[/TR]
[TR="bgcolor: #F5F5F5"]
<5 [TD]125[/TD]
[TD]15[/TD]
[TD]0[/TD]
[TD]110[/TD]
[TD]124[/TD]
[TD]4287[/TD]
[TD]1674[/TD]
[TD]63[/TD]
[TD]2550[/TD]
[TD]1044[/TD]
[TD]5333[/TD]
[TD]19%[/TD]
[/TR]
[TR]
5-19 [TD]46[/TD]
[TD]7[/TD]
[TD]<5[/TD]
[TD]Table 1 - Footnotex[/TD]
[TD]138[/TD]
[TD]2302[/TD]
[TD]997[/TD]
[TD]95[/TD]
[TD]1210[/TD]
[TD]1832[/TD]
[TD]4136[/TD]
[TD]14%[/TD]
[/TR]
[TR="bgcolor: #F5F5F5"]
20-44 [TD]118[/TD]
[TD]30[/TD]
[TD]<5[/TD]
[TD]Table 1 - Footnotex[/TD]
[TD]120[/TD]
[TD]5566[/TD]
[TD]2655[/TD]
[TD]150[/TD]
[TD]2761[/TD]
[TD]1574[/TD]
[TD]7140[/TD]
[TD]25%[/TD]
[/TR]
[TR]
45-64 [TD]171[/TD]
[TD]37[/TD]
[TD]<5[/TD]
[TD]Table 1 - Footnotex[/TD]
[TD]75[/TD]
[TD]5994[/TD]
[TD]2639[/TD]
[TD]178[/TD]
[TD]3177[/TD]
[TD]763[/TD]
[TD]6757[/TD]
[TD]23%[/TD]
[/TR]
[TR="bgcolor: #F5F5F5"]
65+ [TD]175[/TD]
[TD]31[/TD]
[TD]6[/TD]
[TD]138[/TD]
[TD]100[/TD]
[TD]4477[/TD]
[TD]1506[/TD]
[TD]396[/TD]
[TD]2575[/TD]
[TD]974[/TD]
[TD]5452[/TD]
[TD]19%[/TD]
[/TR]
[TR]
Total [TD]635[/TD]
[TD]120[/TD]
[TD]10[/TD]
[TD]505[/TD]
[TD]557[/TD]
[TD]22626[/TD]
[TD]9471[/TD]
[TD]882[/TD]
[TD]12273[/TD]
[TD]6187[/TD]
[TD]28818[/TD]
[TD]100%[/TD]
[/TR]
[TR="bgcolor: #F5F5F5"]
PercentageTable 1 - Footnote2 [TD]53%[/TD]
[TD]19%[/TD]
[TD]2%[/TD]
[TD]80%[/TD]
[TD]47%[/TD]
[TD]79%[/TD]
[TD]42%[/TD]
[TD]4%[/TD]
[TD]54%[/TD]
[TD]21%[/TD]
[TD] [/TD]
[TD] [/TD]
[/TR]
[/TABLE]

For data on other respiratory virus detections see the Respiratory Virus Detections in Canada Report on the Public Health Agency of Canada website.
[h=2]Influenza-like Illness Consultation Rate[/h] The national ILI consultation rate decreased from the previous week from 45.2 per 1,000 patient visits in week 13, to 26.8 per 1,000 patient visits in week 14. The highest ILI consultation rate was found in the 0-4 years age group (55.9 per 1,000) and the lowest was found in the ≥65 years age group (5.5 per 1,000) (Figure 4).
[h=3]Figure 4. Influenza-like-illness (ILI) consultation rates by age group and week, Canada, 2015-16[/h]
2016-w14-fg4-eng.gif
Delays in the reporting of data may cause data to change retrospectively. In BC, AB, and SK, data are compiled by a provincial sentinel surveillance program for reporting to FluWatch. Not all sentinel physicians report every week.
Figure 4 - Text Description [h=2]Pharmacy Surveillance[/h] During week 14, the proportion of prescriptions for antivirals dereaesd to 50.4 antiviral prescriptions per 100,000 total prescriptions, which is lower than the five year historical average for week 14. The proportion of prescriptions for antivirals remains highest among children. In week 14, the proportion reported among children was 102.4 per 100,000 total prescriptions.
[h=3]Figure 5. Proportion of prescription sales for influenza antivirals by age group and week, Canada, 2015-16[/h]
2016-w14-fg5-eng.gif
Note: Pharmacy sales data are provided to the Public Health Agency of Canada by Rx Canada Inc. and sourced from major retail drug chains representing over 3,000 stores nationwide (excluding Nunavut) in 85% of Health Regions. Data provided include the number of new antiviral prescriptions (for Tamiflu[oseltamivir] and Relenza [zanamivir]) and the total number of new prescriptions dispensed by Province/Territory and age group.
* The average weekly proportion includes data from April 2011 to March 2015.
Figure 5 - Text Description [h=2]Influenza Outbreak Surveillance[/h] In week 14, 17 new laboratory confirmed influenza outbreaks were reported: 14 in long-term care facilities (LTCF), two in hospitals and one in institutions or community settings. Of the outbreaks with known strains or subtypes, three outbreaks were due to influenza B, one outbreak was due to influenza A(H1N1), two outbreaks were due to influenza A(H3N2) and eight were due to influenza A(UnS). Additionally, three ILI outbreaks were reported schools.
To date this season, 374 outbreaks have been reported. At week 14 in the 2014-15 season, 1646 outbreaks were reported and in the 2013-14 season,198 outbreaks were reported.
[h=3]Figure 6. Overall number of new laboratory-confirmed influenza outbreaksFigure 5 - Footnote1 by report week, Canada, 2015-2016[/h]
2016-w14-fg6-eng.gif
Figure 6 - Footnote 1 All provinces and territories except NU report influenza outbreaks in long-term care facilities. All provinces and territories with the exception of NU and QC report outbreaks in hospitals. Outbreaks of influenza or influenza-like-illness in other facilities are reported to FluWatch but reporting varies between jurisdictions. Outbreak definitions are included at the end of the report.
Return to Figure 5 - Footnote1referrer
Figure 6 - Text Description [h=2]Sentinel Pediatric Hospital Influenza Surveillance[/h] [h=3]Paediatric Influenza Hospitalizations and Deaths[/h] Hospitalizations reported by the the Immunization Monitoring Program Active (IMPACT) network continue to decrease (Figure 7). In week 14, 58 hospitalizations were reported. The largest proportion of hospitalizations were in children aged 2-4 years, accounting for 46.5% of the hospitalizations. For the first time this season, more influenza B cases were reported than influenza A cases (31 vs. 27 respectively).
To date this season, 1,138 laboratory-confirmed influenza-associated pediatric (≤16 years of age) hospitalizations have been reported by the IMPACT network: 853 hospitalized cases (75%) were due to influenza A and 285 cases (25%) were due to influenza B. The greatest proportion of hospitalized cases were in children aged 0-2 years (40 %). To date,190 intensive care unit (ICU) admissions have been reported. Children aged 2 to 4 and 5 to 9 years accounted for 28% and 26% respectively of ICU admissions. A total of 113 ICU cases (59%) reported at least one underlying condition or comorbidity. Eight influenza-associated deaths have been reported.
[TABLE="class: table table-condensed table-striped table-hover table-bordered, width: 1140"]
Table 2 - Cumulative numbers of peadiatric hospitalizations (≤16 years of age) with influenza reported by the IMPACT network, Canada, 2015-16 [TR="class: bg-primary, bgcolor: #2572B4"]
Age Groups Cumulative (30 Aug. 2015 to 9 April 2016) [/TR]
[TR="class: bg-primary, bgcolor: #2572B4"]
Influenza A Influenza B Influenza A and B (#(%)) [/TR]
[TR="class: bg-primary, bgcolor: #2572B4"]
A Total A(H1) pdm09 A(H3) A (UnS) B Total [/TR]
[TR]
[TD="class: wb-fnote small wb-init wb-fnote-inited, colspan: 7"] Table 2 - Footnote x Suppressed to prevent residual disclosure.
Return to Table 2 - Footnotexreferrer
[/TD]
[/TR]
[TR="bgcolor: #F5F5F5"]
0-5m [TD]112[/TD]
[TD]32[/TD]
[TD]5[/TD]
[TD]75[/TD]
[TD]21[/TD]
[TD]133 (12%)[/TD]
[/TR]
[TR]
6-23m [TD]261[/TD]
[TD]73[/TD]
[TD]7[/TD]
[TD]181[/TD]
[TD]59[/TD]
[TD]320 (28%)[/TD]
[/TR]
[TR="bgcolor: #F5F5F5"]
2-4y [TD]246[/TD]
[TD]78[/TD]
[TD]<5[/TD]
[TD]Table 2 - Footnotex[/TD]
[TD]78[/TD]
[TD]324 (28%)[/TD]
[/TR]
[TR]
5-9y [TD]177[/TD]
[TD]47[/TD]
[TD]<5[/TD]
[TD]Table 2 - Footnotex[/TD]
[TD]89[/TD]
[TD]266 (23%)[/TD]
[/TR]
[TR="bgcolor: #F5F5F5"]
10-16y [TD]57[/TD]
[TD]18[/TD]
[TD]<5[/TD]
[TD]Table 2 - Footnotex[/TD]
[TD]38[/TD]
[TD]95 (8%)[/TD]
[/TR]
[TR]
Total [TD]853[/TD]
[TD]248[/TD]
[TD]21[/TD]
[TD]584[/TD]
[TD]285[/TD]
[TD]1138 (100%)[/TD]
[/TR]
[/TABLE]
[h=4]Figure 7. Number of cases of influenza reported by sentinel hospital networks, by week, Canada, 2015-16, paediatric and adult hospitalizations (≤16 years of age, IMPACT; ≥16 years of age, CIRN-SOS)[/h]
2016-w14-fg7-eng.gif
Not included in Table 2 and Figure 7 are two IMPACT cases that were due to co-infections of influenza A and B.
Figure 7 - Text Description [h=3]Adult Influenza Hospitalizations and Deaths[/h] In week 14, 36 hospitalizations were reported by the Canadian Immunization Research Network Serious Outcome Surveillance (CIRN-SOS) (Figure 7). The largest proportion of hospitalizations was in adults 65+ years of age (50%) and due to influenza A (75%).
To date this season, 956 laboratory-confirmed influenza-associated adult (≥16 years of age) hospitalizations have been reported by CIRN-SOS (Table 3). The majority of hospitalized cases were due to influenza A (85%) and the largest reported proportion was among adults ≥65 years of age (49%). One hundred and thirty-seven intensive care unit (ICU) admissions have been reported. A total of 88 ICU cases reported at least one underlying condition or comorbidity. A total of 38 deaths have been reported this season with the majority of deaths reported in adults ≥65 years of age (63%).
[TABLE="class: table table-condensed table-striped table-hover table-bordered, width: 1140"]
Table 3 - Cumulative numbers of adult hospitalizations (≥16 years of age) with influenza reported by the CIRN-SOS network, Canada, 2015-16 [TR="class: bg-primary, bgcolor: #2572B4"]
Age groups (years) Cumulative (1 Nov. 2015 to 9 April 2016) [/TR]
[TR="class: bg-primary, bgcolor: #2572B4"]
Influenza A B Influenza A and B [/TR]
[TR="class: bg-primary, bgcolor: #2572B4"]
A Total A(H1) pdm09 A(H3) A(UnS) Total # (%) [/TR]
[TR]
[TD="class: wb-fnote small wb-init wb-fnote-inited, colspan: 7"] Table 3 - Footnote x Suppressed to prevent residual disclosure.
Return to Table 3 - Footnotexreferrer
[/TD]
[/TR]
[TR="bgcolor: #F5F5F5"]
16-20 [TD]5[/TD]
[TD]<5[/TD]
[TD]0[/TD]
[TD]<5[/TD]
[TD]<5[/TD]
[TD]6 (1%)[/TD]
[/TR]
[TR]
20-44 [TD]127[/TD]
[TD]38[/TD]
[TD]<5[/TD]
[TD]Table 3 - Footnotex[/TD]
[TD]28[/TD]
[TD]155 (16%)[/TD]
[/TR]
[TR="bgcolor: #F5F5F5"]
45-64 [TD]286[/TD]
[TD]84[/TD]
[TD]3[/TD]
[TD]199[/TD]
[TD]30[/TD]
[TD]316 (33%)[/TD]
[/TR]
[TR]
65+ [TD]388[/TD]
[TD]96[/TD]
[TD]21[/TD]
[TD]271[/TD]
[TD]84[/TD]
[TD]472 (49%)[/TD]
[/TR]
[TR="bgcolor: #F5F5F5"]
Unknown [TD]6[/TD]
[TD]0[/TD]
[TD]<5[/TD]
[TD]<5[/TD]
[TD]<5[/TD]
[TD]7 (1%)[/TD]
[/TR]
[TR]
Total [TD]812[/TD]
[TD]225[/TD]
[TD]26[/TD]
[TD]561[/TD]
[TD]144[/TD]
[TD]956[/TD]
[/TR]
[TR="bgcolor: #F5F5F5"]
% [TD]85%[/TD]
[TD]28%[/TD]
[TD]3%[/TD]
[TD]69%[/TD]
[TD]15%[/TD]
[TD]100%[/TD]
[/TR]
[/TABLE]
[h=4]Figure 8. Percentage of hospitalizations, ICU admissions and deaths with influenza reported by age-group (≥16 year of age), Canada 2015-16[/h]
2016-w14-fg8-eng.gif
Note: The number of hospitalizations reported through CIRN-SOS and IMPACT represents a subset of all influenza-associated adult and paediatric hospitalizations in Canada. Delays in the reporting of data may cause data to change retrospectively.
x - Suppressed to prevent residual disclosure.
Figure 8 - Text Description [h=2]Provincial/Territorial Influenza Hospitalizations and Deaths[/h] In week 14, 311 hospitalizations were reported by participating provinces and territoriesFootnote*. The majority of hospitalizations were due to influenza A (61%), however a marked increase in the proportion of influenza B cases has been noted in week 14. Influenza B accounted for 39% of all influenza hospitalizations in week 14 compared to 22% in week 13. The largest proportion of cases reported in week 14 was in adults 65+ years of age (35%).
Since the start of the 2015-16 season, 4,371 laboratory-confirmed influenza-associated hospitalizations have been reported. A total of 3,637 hospitalizations (83%) were due to influenza A and 734 (17%) were due to influenza B. Of the 473 ICU admissions reported, 245 (58%) were due to influenza A(H1N1) A total of 193 deaths have been reported; all but 22 were associated with influenza A.
Overall this season, hospitalizations have been reported more frequently among adults ≥65 years of age. The largest proportion of ICU admissions were reported in adults 45-64 years of age and the highest proportion of fatal cases was reported in adults ≥65 years of age. Pediatric (0-19 years) and young to middle-aged adults (20-44 years) accounted for 42% of all hospitalizations and 15% of all deaths reported to date this season.
[h=3]Figure 9. Percentage of hospitalizations, ICU admissions and deaths with influenza reported by age-group, Canada 2015-16[/h]
2016-w14-fg9-eng.gif
Figure 9 - Text Description Footnote * Note: Influenza-associated hospitalizations are not reported to PHAC by the following Provinces and Territory: BC, NU, and QC. Only hospitalizations that require intensive medical care are reported by SK. ICU admissions are not distinguished among hospital admissions reported from ON. Data may also include cases reported by the IMPACT networks. The number of new influenza-associated hospitalizations and deaths reported for the current week may include cases from ON that occurred in previous weeks, as a result of retrospective updates to the cumulative total. It is important to note that the hospitalization or death does not have to be attributable to influenza, a positive laboratory test is sufficient for reporting.
Return to footnote*referrer
Footnote * Includes three hospitalizations for which age is unknown.
Return to footnote1referrer
See additional data on Reported Influenza Hospitalizations and Deaths in Canada: 2011-12 to 2015-16 on the Public Health Agency of Canada website.
[h=2]Influenza Strain Characterizations[/h] During the 2015-16 influenza season, the National Microbiology Laboratory (NML) has characterized 1580 influenza viruses [179 A(H3N2), 889 A(H1N1) and 512 influenza B].
Influenza A (H3N2): When tested by hemagglutination inhibition (HI) assays, 42 A(H3N2) viruses were antigenically characterized as A/Switzerland/9715293/2013-like using antiserum raised against cell-propagated A/Switzerland/9715293/2013.
Sequence analysis was done on 137 A(H3N2) viruses. All viruses belonged to a genetic group for which most viruses were antigenically related to A/Switzerland/9715293/2013. A/Switzerland/9715293/2013 is the A(H3N2) component of the 2015-16 Northern Hemisphere's vaccine.
Influenza A (H1N1): All of the 889 A(H1N1) viruses characterized were antigenically similar to A/California/7/2009, the A(H1N1) component of the 2015-16 influenza vaccine.
Influenza B: A total of 125 influenza B viruses characterized were antigenically similar to the vaccine strain B/Phuket/3073/2013. A total of 387 influenza B viruses were characterized as B/Brisbane/60/2008-like, one of the influenza B components of the 2015-16 Northern Hemisphere quadrivalent influenza vaccine.
The recommended components for the 2015-2016 northern hemisphere trivalent influenza vaccine include: an A/California/7/2009(H1N1)pdm09-like virus, an A/Switzerland/9715293/2013(H3N2)-like virus, and a B/Phuket/3073/2013 -like virus (Yamagata lineage). For quadrivalent vaccines, the addition of a B/Brisbane/60/2008-like virus (Victoria lineage) is recommended.
The NML receives a proportion of the influenza positive specimens from provincial laboratories for strain characterization and antiviral resistance testing. Characterization data reflect the results of haemagglutination inhibition testing compared to the reference influenza strains recommended by WHO.
.../


http://healthycanadians.gc.ca/publi...-2016-14-surveillance-influenza/index-eng.php
 
[h=1]FluWatch report: April 10 to April 16, 2016 (week 15)[/h] [h=2]Overall Summary[/h]
  • Influenza activity peaked nationally in the second week of March; however, lower but sustained activity continues to be reported throughout the country.
  • Many regions across Canada are reporting a greater number of influenza B detections; however, in British Columbia and the Atlantic Region, detections remain predominantly influenza A.
  • Hospitalizations, ICU admissions and deaths among the pediatric population, while declining, remain above expected levels based on the past several influenza seasons.
  • Despite higher pediatric hospitalizations reported, the pediatric population accounts for the smallest proportion of all deaths reported.
  • For more information on the flu, see our Flu(influenza) web page.

pub-eng.gif
Download the alternative format
(PDF format, 908 KB, 9 pages)
Organization: Public Health Agency of Canada
Date published: 2016-04-22

[h=2]Related Topics[/h]

Are you a primary health care practitioner (General Practitioner, Nurse Practitioner or Registered Nurse) interested in becoming a FluWatch sentinel for the 2015-16 influenza season? Contact us at FluWatch@phac-aspc.gc.ca


[h=2]On this page[/h]
[h=2]Influenza/Influenza-like Illness Activity (geographic spread)[/h] Influenza activity continues to be reported in the majority of regions in Canada. Localized activity was reported in a total of 14 regions across seven provinces. Sporadic activity levels were reported in 31 regions.
[h=3]Figure 1. Map of overall influenza/ILI activity level by province and territory, Canada, week 15[/h]
fg1-legend-eng.gif


Note: Influenza/ILI activity levels, as represented on this map, are assigned and reported by Provincial and Territorial Ministries of Health, based on laboratory confirmations, sentinel ILI rates and reported outbreaks. Please refer to detailed definitions at the end of the report. Maps from previous weeks, including any retrospective updates, are available in the mapping feature found in the Weekly Influenza Reports.
Figure 1 - Text Description [h=2]Laboratory Confirmed Influenza Detections[/h] In week 15, the percentage of tests positive for influenza continued to decrease from the previous week [from 23% in week 14 to 21% in week 15] (Figure 2). Compared to the previous five seasons, the percent positive (21%) reported in week 15 was above the five year average for that week and exceeded the expected levels (range 11.7%-16.9%). With the late start to the 2015-16 influenza season, these elevated levels are not unexpected.
[h=3]Figure 2. Number of positive influenza tests and percentage of tests positive, by type, subtype and report week, Canada, 2015-16[/h]
2016-w15-fg2-eng.gif
Figure 2 - Text Description Nationally in week 15, there were 1,522 positive influenza tests reported. The number of influenza A and influenza B detections were roughly equal in week 15. Many of regions across Canada reported more influenza B detections than influenza A; however, in British Columbia and the Atlantic Region, detections remain predominantly influenza A. To date, 78% of influenza detections have been influenza A and among those subtyped, the vast majority have been influenza A(H1N1) [86% (10715/12443)].
[h=3]Figure 3. Cumulative numbers of positive influenza specimens by type/subtype and province, Canada, 2015-16[/h]
2016-w15-fg3-eng.gif
Note: Specimens from NT, YT, and NU are sent to reference laboratories in other provinces. Cumulative data includes updates to previous weeks.
Figure 3 - Text Description In week 15, individuals under the age of 44 accounted for 74% of influenza B detections. To date this season, detailed information on age and type/subtype has been received for 30,052 cases. Children and teenagers (0-19) accounted for 47% of influenza B cases and approximately one third of all influenza cases. Children and teenagers (0-19), young adults (20-44) and middle-aged adults (45-64) accounted for approximately an equal proportion of influenza A(H1N1) cases (28%).
[TABLE="class: table-responsive table table-condensed table-striped table-hover table-bordered, width: 1140, height: 0"]
Table 1. Weekly and cumulative numbers of positive influenza specimens by type, subtype and age-group reported through case-based laboratory reportingTable 1 - Footnote1, Canada, 2015-16 [TR="class: bg-primary, bgcolor: #2572B4"]
Age groups (years) Weekly (April 10 to April 16, 2016) Cumulative (August 30, 2015 to April 16, 2016) [/TR]
[TR="class: bg-primary, bgcolor: #2572B4"]
Influenza A B Influenza A B Influenza A and B [/TR]
[TR="class: bg-primary, bgcolor: #2572B4"]
A Total A(H1) pdm09 A(H3) A UnSTable 1 - Footnote3 Total A Total A(H1) pdm09 A(H3) A UnSTable 1 - Footnote3 Total # % [/TR]
[TR]
[TD="class: wb-fnote small wb-init wb-fnote-inited, colspan: 13"] Table 1 - Footnote 1 Table 1 includes specimens for which demographic information was reported. These represent a subset of all positive influenza cases reported.
Return to Table 1 - Footnote1referrer
Table 1 - Footnote 2 Percentage of tests positive for sub-types of influenza A are a percentage of all influenza A detections.
Return to Table 1 - Footnote2referrer
Table 1 - Footnote 3 Unsubtyped: The specimen was typed as influenza A, but no result for subtyping was available.
Return to Table 1 - Footnote3referrer
Table 1 - Footnote x Suppressed to prevent residual disclosure.
Return to Table 1 - Footnotexreferrer
[/TD]
[/TR]
[TR="bgcolor: #F5F5F5"]
<5 [TD]80[/TD]
[TD]6[/TD]
[TD]<5[/TD]
[TD]Table 1 - Footnotex[/TD]
[TD]118[/TD]
[TD]4396[/TD]
[TD]1690[/TD]
[TD]67[/TD]
[TD]2639[/TD]
[TD]1179[/TD]
[TD]5577[/TD]
[TD]19%[/TD]
[/TR]
[TR]
5-19 [TD]37[/TD]
[TD]<5[/TD]
[TD]0[/TD]
[TD]Table 1 - Footnotex[/TD]
[TD]160[/TD]
[TD]2346[/TD]
[TD]1011[/TD]
[TD]97[/TD]
[TD]1238[/TD]
[TD]2043[/TD]
[TD]4391[/TD]
[TD]15%[/TD]
[/TR]
[TR="bgcolor: #F5F5F5"]
20-44 [TD]74[/TD]
[TD]17[/TD]
[TD]0[/TD]
[TD]57[/TD]
[TD]110[/TD]
[TD]5669[/TD]
[TD]2699[/TD]
[TD]151[/TD]
[TD]2819[/TD]
[TD]1726[/TD]
[TD]7395[/TD]
[TD]25%[/TD]
[/TR]
[TR]
45-64 [TD]121[/TD]
[TD]28[/TD]
[TD]<5[/TD]
[TD]Table 1 - Footnotex[/TD]
[TD]47[/TD]
[TD]6165[/TD]
[TD]2709[/TD]
[TD]181[/TD]
[TD]3275[/TD]
[TD]827[/TD]
[TD]6992[/TD]
[TD]23%[/TD]
[/TR]
[TR="bgcolor: #F5F5F5"]
65+ [TD]101[/TD]
[TD]17[/TD]
[TD]7[/TD]
[TD]77[/TD]
[TD]91[/TD]
[TD]4608[/TD]
[TD]1558[/TD]
[TD]410[/TD]
[TD]2640[/TD]
[TD]1088[/TD]
[TD]5697[/TD]
[TD]19%[/TD]
[/TR]
[TR]
Total [TD]413[/TD]
[TD]72[/TD]
[TD]11[/TD]
[TD]330[/TD]
[TD]526[/TD]
[TD]23184[/TD]
[TD]9667[/TD]
[TD]906[/TD]
[TD]12611[/TD]
[TD]6863[/TD]
[TD]30052[/TD]
[TD]100%[/TD]
[/TR]
[TR="bgcolor: #F5F5F5"]
PercentageTable 1 - Footnote2 [TD]44%[/TD]
[TD]17%[/TD]
[TD]3%[/TD]
[TD]80%[/TD]
[TD]56%[/TD]
[TD]77%[/TD]
[TD]42%[/TD]
[TD]4%[/TD]
[TD]54%[/TD]
[TD]23%[/TD]
[TD] [/TD]
[TD] [/TD]
[/TR]
[/TABLE]

For data on other respiratory virus detections see the Respiratory Virus Detections in Canada Report on the Public Health Agency of Canada website.
[h=2]Influenza-like Illness Consultation Rate[/h] The national ILI consultation rate increased from the previous week from 26.1 per 1,000 patient visits in week 14, to 56.4 per 1,000 patient visits in week 15. The highest ILI consultation rate was found in the 5-19 years age group (107.7 per 1,000) and the lowest was found in the ≥65 years age group (14.2 per 1,000) (Figure 4).
[h=3]Figure 4. Influenza-like-illness (ILI) consultation rates by age group and week, Canada, 2015-16[/h]
2016-w15-fg4-eng.gif
Delays in the reporting of data may cause data to change retrospectively. In BC, AB, and SK, data are compiled by a provincial sentinel surveillance program for reporting to FluWatch. Not all sentinel physicians report every week.
Figure 4 - Text Description [h=2]Pharmacy Surveillance[/h] During week 15, the proportion of prescriptions for antivirals remained similar to the previous week at 50.6 antiviral prescriptions per 100,000 total prescriptions, which is lower than the five year historical average for week 15. The proportion of prescriptions for antivirals remains highest among children. In week 15, the proportion reported among children was 100.1 per 100,000 total prescriptions.
[h=3]Figure 5. Proportion of prescription sales for influenza antivirals by age group and week, Canada, 2015-16[/h]
2016-w15-fg5-eng.gif
Note: Pharmacy sales data are provided to the Public Health Agency of Canada by Rx Canada Inc. and sourced from major retail drug chains representing over 3,000 stores nationwide (excluding Nunavut) in 85% of Health Regions. Data provided include the number of new antiviral prescriptions (for Tamiflu[oseltamivir] and Relenza [zanamivir]) and the total number of new prescriptions dispensed by Province/Territory and age group.
* The average weekly proportion includes data from April 2011 to March 2015.
Figure 5 - Text Description [h=2]Influenza Outbreak Surveillance[/h] In week 15, 12 new laboratory confirmed influenza outbreaks were reported: 11 in long-term care facilities (LTCF) and one in a hospital. Of the seven outbreaks with known strains or subtypes, four outbreaks were due to influenza B (three in LTCFs and one in a hospital), one outbreak each was due to influenza A(H1N1) and influenza A(H3N2) (both in LTCFs), and one outbreak in a LTCF was due to influenza A(UnS). Additionally, one ILI outbreak was reported in a school.
To date this season, 387 outbreaks have been reported. At week 15 in the 2014-15 season, 1,586 outbreaks were reported and in the 2013-14 season, 210 outbreaks were reported.
[h=3]Figure 6. Overall number of new laboratory-confirmed influenza outbreaksFigure 5 - Footnote1 by report week, Canada, 2015-2016[/h]
2016-w15-fg6-eng.gif
Figure 6 - Footnote 1 All provinces and territories except NU report influenza outbreaks in long-term care facilities. All provinces and territories with the exception of NU and QC report outbreaks in hospitals. Outbreaks of influenza or influenza-like-illness in other facilities are reported to FluWatch but reporting varies between jurisdictions. Outbreak definitions are included at the end of the report.
Return to Figure 5 - Footnote1referrer
Figure 6 - Text Description [h=2]Sentinel Pediatric Hospital Influenza Surveillance[/h] [h=3]Paediatric Influenza Hospitalizations and Deaths[/h] In week 15, 63 laboratory-confirmed influenza-associated pediatric (≤16 years of age) hospitalizations were reported by the Immunization Monitoring Program Active (IMPACT) network (Figure 7). The largest proportion of hospitalizations were in children aged 5-9 years, accounting for 33% of the hospitalizations. Similar to the previous week, more influenza B cases were reported than influenza A cases (41 vs. 22 respectively).
To date this season, 1,207 hospitalizations have been reported by the IMPACT network: 874 hospitalized cases (72%) were due to influenza A and 333 cases (28%) were due to influenza B. The greatest proportion of hospitalized cases were in children aged 0-2 years (40%). To date,192 intensive care unit (ICU) admissions have been reported. Children aged 2 to 4 and 5 to 9 years accounted for 28% and 26% respectively of ICU admissions. A total of 122 ICU cases (64%) reported at least one underlying condition or comorbidity. Eight influenza-associated deaths have been reported.
[TABLE="class: table table-condensed table-striped table-hover table-bordered, width: 1140"]
Table 2 - Cumulative numbers of peadiatric hospitalizations (≤16 years of age) with influenza reported by the IMPACT network, Canada, 2015-16 [TR="class: bg-primary, bgcolor: #2572B4"]
Age Groups Cumulative (30 Aug. 2015 to 16 April 2016) [/TR]
[TR="class: bg-primary, bgcolor: #2572B4"]
Influenza A Influenza B Influenza A and B (#(%)) [/TR]
[TR="class: bg-primary, bgcolor: #2572B4"]
A Total A(H1) pdm09 A(H3) A (UnS) B Total [/TR]
[TR]
[TD="class: wb-fnote small wb-init wb-fnote-inited, colspan: 7"] Table 2 - Footnote x Suppressed to prevent residual disclosure.
Return to Table 2 - Footnotexreferrer
[/TD]
[/TR]
[TR="bgcolor: #F5F5F5"]
0-5m [TD]116[/TD]
[TD]32[/TD]
[TD]5[/TD]
[TD]79[/TD]
[TD]26[/TD]
[TD]142 (12%)[/TD]
[/TR]
[TR]
6-23m [TD]270[/TD]
[TD]73[/TD]
[TD]7[/TD]
[TD]190[/TD]
[TD]66[/TD]
[TD]336 (28%)[/TD]
[/TR]
[TR="bgcolor: #F5F5F5"]
2-4y [TD]251[/TD]
[TD]79[/TD]
[TD]<5[/TD]
[TD]Table 2 - Footnotex[/TD]
[TD]93[/TD]
[TD]344 (29%)[/TD]
[/TR]
[TR]
5-9y [TD]179[/TD]
[TD]47[/TD]
[TD]<5[/TD]
[TD]Table 2 - Footnotex[/TD]
[TD]106[/TD]
[TD]285 (24%)[/TD]
[/TR]
[TR="bgcolor: #F5F5F5"]
10-16y [TD]58[/TD]
[TD]18[/TD]
[TD]<5[/TD]
[TD]Table 2 - Footnotex[/TD]
[TD]42[/TD]
[TD]100 (8%)[/TD]
[/TR]
[TR]
Total [TD]874[/TD]
[TD]249[/TD]
[TD]21[/TD]
[TD]604[/TD]
[TD]333[/TD]
[TD]1207 (100%)[/TD]
[/TR]
[/TABLE]
[h=4]Figure 7. Number of cases of influenza reported by sentinel hospital networks, by week, Canada, 2015-16, paediatric and adult hospitalizations (≤16 years of age, IMPACT; ≥16 years of age, CIRN-SOS)[/h]
2016-w15-fg7-eng.gif
Not included in Table 2 and Figure 7 are two IMPACT cases that were due to co-infections of influenza A and B.
Figure 7 - Text Description [h=3]Adult Influenza Hospitalizations and Deaths[/h] In week 15, 39 laboratory-confirmed influenza-associated adult (≥16 years of age) hospitalizations were reported by the Canadian Immunization Research Network Serious Outcome Surveillance (CIRN-SOS) (Figure 7). The largest proportion of hospitalizations was in adults 65+ years of age (54%) and due to influenza A (62%). In recent weeks, the weekly number of hospitalizations reported by CIRN has been decreasing and an increasing proportion of hospitalizations have been due to influenza B.
To date this season, 1,077 hospitalizations have been reported by CIRN-SOS (Table 3). The majority of hospitalized cases were due to influenza A (83%) and the largest reported proportion was among adults ≥65 years of age (50%). One hundred and sixty-five intensive care unit (ICU) admissions have been reported. A total of 112 ICU cases reported at least one underlying condition or comorbidity. A total of 45 deaths have been reported this season with the majority of deaths reported in adults ≥65 years of age (64%).
[TABLE="class: table table-condensed table-striped table-hover table-bordered, width: 1140"]
Table 3 - Cumulative numbers of adult hospitalizations (≥16 years of age) with influenza reported by the CIRN-SOS network, Canada, 2015-16 [TR="class: bg-primary, bgcolor: #2572B4"]
Age groups (years) Cumulative (1 Nov. 2015 to 16 April 2016) [/TR]
[TR="class: bg-primary, bgcolor: #2572B4"]
Influenza A B Influenza A and B [/TR]
[TR="class: bg-primary, bgcolor: #2572B4"]
A Total A(H1) pdm09 A(H3) A(UnS) Total # (%) [/TR]
[TR]
[TD="class: wb-fnote small wb-init wb-fnote-inited, colspan: 7"] Table 3 - Footnote x Suppressed to prevent residual disclosure.
Return to Table 3 - Footnotexreferrer
[/TD]
[/TR]
[TR="bgcolor: #F5F5F5"]
16-20 [TD]Table 3 - Footnotex[/TD]
[TD]<5[/TD]
[TD]0[/TD]
[TD]<5[/TD]
[TD]<5[/TD]
[TD]7 (1%)[/TD]
[/TR]
[TR]
20-44 [TD]140[/TD]
[TD]45[/TD]
[TD]<5[/TD]
[TD]Table 3 - Footnotex[/TD]
[TD]36[/TD]
[TD]176 (16%)[/TD]
[/TR]
[TR="bgcolor: #F5F5F5"]
45-64 [TD]312[/TD]
[TD]94[/TD]
[TD]<5[/TD]
[TD]Table 3 - Footnotex[/TD]
[TD]39[/TD]
[TD]351 (33%)[/TD]
[/TR]
[TR]
65+ [TD]434[/TD]
[TD]119[/TD]
[TD]23[/TD]
[TD]292[/TD]
[TD]103[/TD]
[TD]537 (50%)[/TD]
[/TR]
[TR="bgcolor: #F5F5F5"]
Unknown [TD]<5[/TD]
[TD]0[/TD]
[TD]0[/TD]
[TD]<5[/TD]
[TD]<5[/TD]
[TD]6 (1%)[/TD]
[/TR]
[TR]
Total [TD]895[/TD]
[TD]264[/TD]
[TD]27[/TD]
[TD]604[/TD]
[TD]182[/TD]
[TD]1077[/TD]
[/TR]
[TR="bgcolor: #F5F5F5"]
% [TD]83%[/TD]
[TD]29%[/TD]
[TD]3%[/TD]
[TD]67%[/TD]
[TD]17%[/TD]
[TD]100%[/TD]
[/TR]
[/TABLE]
[h=4]Figure 8. Percentage of hospitalizations, ICU admissions and deaths with influenza reported by age-group (≥16 year of age), Canada 2015-16[/h]
2016-w15-fg8-eng.gif
Note: The number of hospitalizations reported through CIRN-SOS and IMPACT represents a subset of all influenza-associated adult and paediatric hospitalizations in Canada. Delays in the reporting of data may cause data to change retrospectively.
x - Suppressed to prevent residual disclosure.
Figure 8 - Text Description [h=2]Provincial/Territorial Influenza Hospitalizations and Deaths[/h] In week 15, 182 hospitalizations were reported by participating provinces and territoriesFootnote*. The majority of reported hospitalizations continue to be due to influenza A, accounting for 63% of hospitalizations reported in week 15. The largest proportion of cases reported in week 15 was in adults 65+ years of age (43%).
Since the start of the 2015-16 season, 4,606 laboratory-confirmed influenza-associated hospitalizations have been reported. A total of 3,802 hospitalizations (83%) were due to influenza A and 804 (17%) were due to influenza B. Of the 486 ICU admissions reported, 258 (53%) were due to influenza A(H1N1). A total of 193 deaths have been reported; all but 24 were associated with influenza A.
Overall this season, hospitalizations have been reported more frequently among adults ≥65 years of age. The largest proportion of ICU admissions was reported in adults 45-64 years of age and the highest proportion of fatal cases was reported in adults ≥65 years of age. Pediatric (0-19 years) and young to middle-aged adults (20-44 years) accounted for 42% of all hospitalizations and 14% of all deaths reported to date this season. There have been more pediatric hospitalizations reported to date compared to the year-end totals in each of the previous four influenza seasons.
[h=3]Figure 9. Percentage of hospitalizations, ICU admissions and deaths with influenza reported by age-group, Canada 2015-16[/h]
2016-w15-fg9-eng.gif
Figure 9 - Text Description Footnote * Note: Influenza-associated hospitalizations are not reported to PHAC by the following Provinces and Territory: BC, NU, and QC. Only hospitalizations that require intensive medical care are reported by SK. ICU admissions are not distinguished among hospital admissions reported from ON. Data may also include cases reported by the IMPACT networks. The number of new influenza-associated hospitalizations and deaths reported for the current week may include cases from ON that occurred in previous weeks, as a result of retrospective updates to the cumulative total. It is important to note that the hospitalization or death does not have to be attributable to influenza, a positive laboratory test is sufficient for reporting.
Return to footnote*referrer
Footnote * Includes three hospitalizations for which age is unknown.
Return to footnote1referrer
See additional data on Reported Influenza Hospitalizations and Deaths in Canada: 2011-12 to 2015-16 on the Public Health Agency of Canada website.
[h=2]Influenza Strain Characterizations[/h] During the 2015-16 influenza season, the National Microbiology Laboratory (NML) has characterized 1,901 influenza viruses [189 A(H3N2), 1,099 A(H1N1) and 613 influenza B].
Influenza A (H3N2): When tested by hemagglutination inhibition (HI) assays, 48 A(H3N2) viruses were antigenically characterized as A/Switzerland/9715293/2013-like using antiserum raised against cell-propagated A/Switzerland/9715293/2013.
Sequence analysis was done on 141 A(H3N2) viruses. All viruses belonged to a genetic group for which most viruses were antigenically related to A/Switzerland/9715293/2013. A/Switzerland/9715293/2013 is the A(H3N2) component of the 2015-16 Northern Hemisphere's vaccine.
Influenza A (H1N1): All of the 1,099 A(H1N1) viruses characterized were antigenically similar to A/California/7/2009, the A(H1N1) component of the 2015-16 influenza vaccine.
Influenza B: A total of 142 influenza B viruses characterized were antigenically similar to the vaccine strain B/Phuket/3073/2013. A total of 471 influenza B viruses were characterized as B/Brisbane/60/2008-like, one of the influenza B components of the 2015-16 Northern Hemisphere quadrivalent influenza vaccine.
The recommended components for the 2015-2016 northern hemisphere trivalent influenza vaccine include: an A/California/7/2009(H1N1)pdm09-like virus, an A/Switzerland/9715293/2013(H3N2)-like virus, and a B/Phuket/3073/2013 -like virus (Yamagata lineage). For quadrivalent vaccines, the addition of a B/Brisbane/60/2008-like virus (Victoria lineage) is recommended.
The NML receives a proportion of the influenza positive specimens from provincial laboratories for strain characterization and antiviral resistance testing. Characterization data reflect the results of haemagglutination inhibition testing compared to the reference influenza strains recommended by WHO.
.../


http://healthycanadians.gc.ca/publi...-2016-15-surveillance-influenza/index-eng.php
 
[h=1]FluWatch report: April 17 to April 23, 2016 (week 16)[/h] [h=2]Overall Summary[/h]
  • In week 16, all influenza indicators remained similar to, or declined from the previous week.
  • Elevated influenza activity was mostly reported in the Ontario, Quebec and Atlantic provinces.
  • Many regions across Canada are reporting a greater proportion of influenza B detections. This increase in influenza B is expected as influenza B often shows up later in the flu season.
  • Influenza B continues to account for a increasing proportion of hospitalizations among children and adults.
  • Hospitalizations, ICU admissions and deaths among the pediatric population, while declining, continue to remain above expected levels based on the past several influenza seasons.
  • For more information on the flu, see our Flu(influenza) web page.

pub-eng.gif
Download the alternative format
(PDF format, 911 KB, 9 pages)
Organization: Public Health Agency of Canada
Date published: 2016-04-29

[h=2]Related Topics[/h]

Are you a primary health care practitioner (General Practitioner, Nurse Practitioner or Registered Nurse) interested in becoming a FluWatch sentinel for the 2015-16 influenza season? Contact us at FluWatch@phac-aspc.gc.ca


[h=2]On this page[/h]
[h=2]Influenza/Influenza-like Illness Activity (geographic spread)[/h] Influenza activity continues to be reported in the majority of regions in Canada; however, the number of regions reporting influenza activity decreased in week 16. Localized activity was reported in a total of 13 regions across five provinces. Sporadic activity levels were reported in 30 regions across all provinces and territories.
[h=3]Figure 1. Map of overall influenza/ILI activity level by province and territory, Canada, week 16[/h]
fg1-legend-eng.gif


Note: Influenza/ILI activity levels, as represented on this map, are assigned and reported by Provincial and Territorial Ministries of Health, based on laboratory confirmations, sentinel ILI rates and reported outbreaks. Please refer to detailed definitions at the end of the report. Maps from previous weeks, including any retrospective updates, are available in the mapping feature found in the Weekly Influenza Reports.
Figure 1 - Text Description [h=2]Laboratory Confirmed Influenza Detections[/h] In week 16, the percentage of tests positive for influenza continued to decrease from the previous week [from 21% in week 15 to 19% in week 16], driven by the decline in influenza A. Compared to the previous five seasons, the percent positive (19%) reported in week 16 was above the five year average for that week and exceeded the expected levels (range 10.1%-16.2%). With the late start to the 2015-16 influenza season, these elevated levels are not unexpected.
[h=3]Figure 2. Number of positive influenza tests and percentage of tests positive, by type, subtype and report week, Canada, 2015-16[/h]
2016-w16-fg2-eng.gif
Figure 2 - Text Description Nationally in week 16, there were 1,140 positive influenza tests reported. Influenza B continues to account for an increasing proportion of influenza detections accounting for 64% of detections in week 16. Detections remain predominantly influenza A in British Columbia and the Atlantic Region. To date, 76% of influenza detections have been influenza A and among those subtyped, the vast majority have been influenza A(H1N1) [92% (10866/11855)].
[h=3]Figure 3. Cumulative numbers of positive influenza specimens by type/subtype and province, Canada, 2015-16[/h]
2016-w16-fg3-eng.gif
Note: Specimens from NT, YT, and NU are sent to reference laboratories in other provinces. Cumulative data includes updates to previous weeks.
Figure 3 - Text Description In week 16, individuals under the age of 44 accounted for 69% of influenza B detections.
To date this season, detailed information on age and type/subtype has been received for 31,063 cases. Children and teenagers (0-19) accounted for 47% of influenza B cases and approximately one third of all influenza cases. Children and teenagers (0-19), young adults (20-44) and middle-aged adults (45-64) accounted for approximately an equal proportion of influenza A(H1N1) cases (28%).
[TABLE="class: table-responsive table table-condensed table-striped table-hover table-bordered, width: 1140, height: 0"]
Table 1. Weekly and cumulative numbers of positive influenza specimens by type, subtype and age-group reported through case-based laboratory reportingTable 1 - Footnote1, Canada, 2015-16 [TR="class: bg-primary, bgcolor: #2572B4"]
Age groups (years) Weekly (April 17 to April 23, 2016) Cumulative (August 30, 2015 to April 23, 2016) [/TR]
[TR="class: bg-primary, bgcolor: #2572B4"]
Influenza A B Influenza A B Influenza A and B [/TR]
[TR="class: bg-primary, bgcolor: #2572B4"]
A Total A(H1) pdm09 A(H3) A UnSTable 1 - Footnote3 Total A Total A(H1) pdm09 A(H3) A UnSTable 1 - Footnote3 Total # % [/TR]
[TR]
[TD="class: wb-fnote small wb-init wb-fnote-inited, colspan: 13"] Table 1 - Footnote 1 Table 1 includes specimens for which demographic information was reported. These represent a subset of all positive influenza cases reported.
Return to Table 1 - Footnote1referrer
Table 1 - Footnote 2 Percentage of tests positive for sub-types of influenza A are a percentage of all influenza A detections.
Return to Table 1 - Footnote2referrer
Table 1 - Footnote 3 Unsubtyped: The specimen was typed as influenza A, but no result for subtyping was available.
Return to Table 1 - Footnote3referrer
Table 1 - Footnote x Suppressed to prevent residual disclosure.
Return to Table 1 - Footnotexreferrer
[/TD]
[/TR]
[TR="bgcolor: #F5F5F5"]
<5 [TD]41[/TD]
[TD]<5[/TD]
[TD]<5[/TD]
[TD]34[/TD]
[TD]112[/TD]
[TD]4450[/TD]
[TD]1698[/TD]
[TD]69[/TD]
[TD]2683[/TD]
[TD]1309[/TD]
[TD]5761[/TD]
[TD]19%[/TD]
[/TR]
[TR]
5-19 [TD]14[/TD]
[TD]<5[/TD]
[TD]Table 1 - Footnotex[/TD]
[TD]12[/TD]
[TD]153[/TD]
[TD]2373[/TD]
[TD]1017[/TD]
[TD]99[/TD]
[TD]1257[/TD]
[TD]2231[/TD]
[TD]4606[/TD]
[TD]15%[/TD]
[/TR]
[TR="bgcolor: #F5F5F5"]
20-44 [TD]51[/TD]
[TD]10[/TD]
[TD]0[/TD]
[TD]41[/TD]
[TD]114[/TD]
[TD]5735[/TD]
[TD]2717[/TD]
[TD]154[/TD]
[TD]2864[/TD]
[TD]1876[/TD]
[TD]7611[/TD]
[TD]25%[/TD]
[/TR]
[TR]
45-64 [TD]65[/TD]
[TD]13[/TD]
[TD]<5[/TD]
[TD]Table 1 - Footnotex[/TD]
[TD]66[/TD]
[TD]6255[/TD]
[TD]2739[/TD]
[TD]185[/TD]
[TD]3331[/TD]
[TD]905[/TD]
[TD]7160[/TD]
[TD]23%[/TD]
[/TR]
[TR="bgcolor: #F5F5F5"]
65+ [TD]82[/TD]
[TD]18[/TD]
[TD]<5[/TD]
[TD]Table 1 - Footnotex[/TD]
[TD]105[/TD]
[TD]4712[/TD]
[TD]1587[/TD]
[TD]417[/TD]
[TD]2708[/TD]
[TD]1212[/TD]
[TD]5925[/TD]
[TD]19%[/TD]
[/TR]
[TR]
Total [TD]253[/TD]
[TD]47[/TD]
[TD]<5[/TD]
[TD]202[/TD]
[TD]550[/TD]
[TD]23525[/TD]
[TD]9758[/TD]
[TD]924[/TD]
[TD]12843[/TD]
[TD]7533[/TD]
[TD]31063[/TD]
[TD]100%[/TD]
[/TR]
[TR="bgcolor: #F5F5F5"]
PercentageTable 1 - Footnote2 [TD]32%[/TD]
[TD]19%[/TD]
[TD]2%[/TD]
[TD]80%[/TD]
[TD]68%[/TD]
[TD]76%[/TD]
[TD]41%[/TD]
[TD]4%[/TD]
[TD]55%[/TD]
[TD]24%[/TD]
[TD] [/TD]
[TD] [/TD]
[/TR]
[/TABLE]

For data on other respiratory virus detections see the Respiratory Virus Detections in Canada Report on the Public Health Agency of Canada website.
[h=2]Influenza-like Illness Consultation Rate[/h] The national ILI consultation rate decreased from the previous week from 56.4 per 1,000 patient visits in week 15, to 36.1 per 1,000 patient visits in week 16. The highest ILI consultation rate was found in the 0-4 years age group (104.4 per 1,000) and the lowest was found in the ≥65 years age group (18.8 per 1,000) (Figure 4).
[h=3]Figure 4. Influenza-like-illness (ILI) consultation rates by age group and week, Canada, 2015-16[/h]
2016-w16-fg4-eng.gif
Delays in the reporting of data may cause data to change retrospectively. In BC, AB, and SK, data are compiled by a provincial sentinel surveillance program for reporting to FluWatch. Not all sentinel physicians report every week.
Figure 4 - Text Description [h=2]Pharmacy Surveillance[/h] During week 16, the proportion of prescriptions for antivirals decreased from the previous week to 27.7 antiviral prescriptions per 100,000 total prescriptions, which is lower than the five year historical average for week 16. The proportion of prescriptions for antivirals remains highest among children. In week 16, the proportion reported among children was 71.5 per 100,000 total prescriptions.
[h=3]Figure 5. Proportion of prescription sales for influenza antivirals by age group and week, Canada, 2015-16[/h]
2016-w16-fg5-eng.gif
Note: Pharmacy sales data are provided to the Public Health Agency of Canada by Rx Canada Inc. and sourced from major retail drug chains representing over 3,000 stores nationwide (excluding Nunavut) in 85% of Health Regions. Data provided include the number of new antiviral prescriptions (for Tamiflu[oseltamivir] and Relenza [zanamivir]) and the total number of new prescriptions dispensed by Province/Territory and age group.
* The average weekly proportion includes data from April 2011 to March 2015.
Figure 5 - Text Description [h=2]Influenza Outbreak Surveillance[/h] In week 16, 13 new laboratory confirmed influenza outbreaks were reported: nine in long-term care facilities (LTCF). three in hospitals and one in an institution or community setting. Of the outbreaks with known strains or subtypes, all three outbreaks were due to influenza B (two in LTCFs and one in an institution or community setting). Additionally, one ILI outbreak was reported in a school.
To date this season, 401 outbreaks have been reported. At week 16 in the 2014-15 season, 1,607 outbreaks were reported and in the 2013-14 season, 218 outbreaks were reported.
[h=3]Figure 6. Overall number of new laboratory-confirmed influenza outbreaksFigure 5 - Footnote1 by report week, Canada, 2015-2016[/h]
2016-w16-fg6-eng.gif
Figure 6 - Footnote 1 All provinces and territories except NU report influenza outbreaks in long-term care facilities. All provinces and territories with the exception of NU and QC report outbreaks in hospitals. Outbreaks of influenza or influenza-like-illness in other facilities are reported to FluWatch but reporting varies between jurisdictions. Outbreak definitions are included at the end of the report.
Return to Figure 5 - Footnote1referrer
Figure 6 - Text Description [h=2]Sentinel Pediatric Hospital Influenza Surveillance[/h] [h=3]Paediatric Influenza Hospitalizations and Deaths[/h] In week 16, 33 laboratory-confirmed influenza-associated pediatric (≤16 years of age) hospitalizations were reported by the Immunization Monitoring Program Active (IMPACT) network (Figure 7). The largest proportion of hospitalizations were in children aged 5-9 years, accounting for 30% of the hospitalizations. Similar to the trend of increased laboratory detections of influenza B, 82% of pediatric hospitalizations reported in week 16 were due to influenza B.
To date this season, 1,233 hospitalizations have been reported by the IMPACT network: 878 hospitalized cases (71%) were due to influenza A and 355 cases (29%) were due to influenza B. This season's count of pediatric hospitalizations is nearly double that reported up to week 16 (667) in the 2015-16 season. The current year total number of cases also exceeds the total number of cases reported in the past five seasons.
A total of 193 intensive care unit (ICU) admissions have been reported. Children aged 2 to 4 and 5 to 9 years accounted for 29% and 26% respectively of ICU admissions. A total of 128 ICU cases (66%) reported at least one underlying condition or comorbidity. Eight influenza-associated deaths have been reported.
[TABLE="class: table table-condensed table-striped table-hover table-bordered, width: 1140"]
Table 2 - Cumulative numbers of peadiatric hospitalizations (≤16 years of age) with influenza reported by the IMPACT network, Canada, 2015-16 [TR="class: bg-primary, bgcolor: #2572B4"]
Age Groups Cumulative (30 Aug. 2015 to 23 April 2016) [/TR]
[TR="class: bg-primary, bgcolor: #2572B4"]
Influenza A Influenza B Influenza A and B (#(%)) [/TR]
[TR="class: bg-primary, bgcolor: #2572B4"]
A Total A(H1) pdm09 A(H3) A (UnS) B Total [/TR]
[TR]
[TD="class: wb-fnote small wb-init wb-fnote-inited, colspan: 7"] Table 2 - Footnote x Suppressed to prevent residual disclosure.
Return to Table 2 - Footnotexreferrer
[/TD]
[/TR]
[TR="bgcolor: #F5F5F5"]
0-5m [TD]118[/TD]
[TD]32[/TD]
[TD]5[/TD]
[TD]81[/TD]
[TD]29[/TD]
[TD]147 (12%)[/TD]
[/TR]
[TR]
6-23m [TD]271[/TD]
[TD]73[/TD]
[TD]7[/TD]
[TD]191[/TD]
[TD]71[/TD]
[TD]342 (28%)[/TD]
[/TR]
[TR="bgcolor: #F5F5F5"]
2-4y [TD]250[/TD]
[TD]79[/TD]
[TD]<5[/TD]
[TD]Table 2 - Footnotex[/TD]
[TD]96[/TD]
[TD]346 (28%)[/TD]
[/TR]
[TR]
5-9y [TD]181[/TD]
[TD]47[/TD]
[TD]<5[/TD]
[TD]Table 2 - Footnotex[/TD]
[TD]115[/TD]
[TD]296 (24%)[/TD]
[/TR]
[TR="bgcolor: #F5F5F5"]
10-16y [TD]58[/TD]
[TD]18[/TD]
[TD]<5[/TD]
[TD]Table 2 - Footnotex[/TD]
[TD]44[/TD]
[TD]102 (8%)[/TD]
[/TR]
[TR]
Total [TD]878[/TD]
[TD]249[/TD]
[TD]21[/TD]
[TD]608[/TD]
[TD]355[/TD]
[TD]1233 (100%)[/TD]
[/TR]
[/TABLE]
[h=4]Figure 7. Number of cases of influenza reported by sentinel hospital networks, by week, Canada, 2015-16, paediatric and adult hospitalizations (≤16 years of age, IMPACT; ≥16 years of age, CIRN-SOS)[/h]
2016-w16-fg7-eng.gif
Not included in Table 2 and Figure 7 are two IMPACT cases that were due to co-infections of influenza A and B.
Figure 7 - Text Description [h=3]Adult Influenza Hospitalizations and Deaths[/h] In week 16, 28 laboratory-confirmed influenza-associated adult (≥16 years of age) hospitalizations were reported by the Canadian Immunization Research Network Serious Outcome Surveillance (CIRN-SOS) (Figure 7). The largest proportion of hospitalizations was in adults 65+ years of age (53%) and due to influenza A (53%). In recent weeks, the weekly number of hospitalizations reported by CIRN has been decreasing and an increasing proportion of hospitalizations have been due to influenza B.
To date this season, 1,108 hospitalizations have been reported by CIRN-SOS (Table 3). The majority of hospitalized cases were due to influenza A (82%) and the largest reported proportion was among adults ≥65 years of age (50%). One hundred and seventy-four intensive care unit (ICU) admissions have been reported of which 118 cases reported at least one underlying condition or comorbidity. A total of 48 deaths have been reported this season with the majority of deaths reported in adults ≥65 years of age (67%).
[TABLE="class: table table-condensed table-striped table-hover table-bordered, width: 1140"]
Table 3 - Cumulative numbers of adult hospitalizations (≥16 years of age) with influenza reported by the CIRN-SOS network, Canada, 2015-16 [TR="class: bg-primary, bgcolor: #2572B4"]
Age groups (years) Cumulative (1 Nov. 2015 to 23 April 2016) [/TR]
[TR="class: bg-primary, bgcolor: #2572B4"]
Influenza A B Influenza A and B [/TR]
[TR="class: bg-primary, bgcolor: #2572B4"]
A Total A(H1) pdm09 A(H3) A(UnS) Total # (%) [/TR]
[TR]
[TD="class: wb-fnote small wb-init wb-fnote-inited, colspan: 7"] Table 3 - Footnote x Suppressed to prevent residual disclosure.
Return to Table 3 - Footnotexreferrer
[/TD]
[/TR]
[TR="bgcolor: #F5F5F5"]
16-20 [TD]Table 3 - Footnotex[/TD]
[TD]<5[/TD]
[TD]0[/TD]
[TD]<5[/TD]
[TD]<5[/TD]
[TD]7 (1%)[/TD]
[/TR]
[TR]
20-44 [TD]140[/TD]
[TD]48[/TD]
[TD]<5[/TD]
[TD]Table 3 - Footnotex[/TD]
[TD]39[/TD]
[TD]179 (16%)[/TD]
[/TR]
[TR="bgcolor: #F5F5F5"]
45-64 [TD]321[/TD]
[TD]97[/TD]
[TD]<5[/TD]
[TD]Table 3 - Footnotex[/TD]
[TD]40[/TD]
[TD]361 (33%)[/TD]
[/TR]
[TR]
65+ [TD]443[/TD]
[TD]123[/TD]
[TD]23[/TD]
[TD]297[/TD]
[TD]113[/TD]
[TD]556 (50%)[/TD]
[/TR]
[TR="bgcolor: #F5F5F5"]
Unknown [TD]<5[/TD]
[TD]0[/TD]
[TD]0[/TD]
[TD]<5[/TD]
[TD]<5[/TD]
[TD]5 (%)[/TD]
[/TR]
[TR]
Total [TD]912[/TD]
[TD]273[/TD]
[TD]27[/TD]
[TD]612[/TD]
[TD]196[/TD]
[TD]1108[/TD]
[/TR]
[TR="bgcolor: #F5F5F5"]
% [TD]82%[/TD]
[TD]30%[/TD]
[TD]3%[/TD]
[TD]67%[/TD]
[TD]18%[/TD]
[TD]100%[/TD]
[/TR]
[/TABLE]
[h=4]Figure 8. Percentage of hospitalizations, ICU admissions and deaths with influenza reported by age-group (≥16 year of age), Canada 2015-16[/h]
2016-w16-fg8-eng.gif
Note: The number of hospitalizations reported through CIRN-SOS and IMPACT represents a subset of all influenza-associated adult and paediatric hospitalizations in Canada. Delays in the reporting of data may cause data to change retrospectively.
x - Suppressed to prevent residual disclosure.
Figure 8 - Text Description [h=2]Provincial/Territorial Influenza Hospitalizations and Deaths[/h] In week 16, 129 hospitalizations were reported by participating provinces and territoriesFootnote*. Influenza B accounted for the greatest proportion of hospitalizations, accounting for 55% of hospitalizations reported in week 16. The largest proportion of cases reported was in adults 65+ years of age (37%). Among hospitalizations for influenza B, children represented 35% of cases.
Since the start of the 2015-16 season, 4,840 laboratory-confirmed influenza-associated hospitalizations have been reported. A total of 3,929 hospitalizations (81%) were due to influenza A and 911 (19%) were due to influenza B. Of the 510 ICU admissions reported, 267 (52%) were due to influenza A(H1N1). A total of 229 deaths have been reported; all but 30 were associated with influenza A.
Overall this season, hospitalizations have been reported more frequently among adults ≥65 years of age. The largest proportion of ICU admissions was reported in adults 45-64 years of age and the highest proportion of fatal cases was reported in adults ≥65 years of age. Pediatric (0-19 years) and young to middle-aged adults (20-44 years) accounted for 42% of all hospitalizations and 14% of all deaths reported to date this season. Similar to findings from the IMPACT network, there have been more pediatric hospitalizations reported to date compared to the year-end totals in each of the previous four influenza seasons.
[h=3]Figure 9. Percentage of hospitalizations, ICU admissions and deaths with influenza reported by age-group, Canada 2015-16[/h]
2016-w16-fg9-eng.gif
Figure 9 - Text Description Footnote * Note: Influenza-associated hospitalizations are not reported to PHAC by the following Provinces and Territory: BC, NU, and QC. Only hospitalizations that require intensive medical care are reported by SK. ICU admissions are not distinguished among hospital admissions reported from ON. Data may also include cases reported by the IMPACT networks. The number of new influenza-associated hospitalizations and deaths reported for the current week may include cases from ON that occurred in previous weeks, as a result of retrospective updates to the cumulative total. It is important to note that the hospitalization or death does not have to be attributable to influenza, a positive laboratory test is sufficient for reporting.
Return to footnote*referrer
Footnote * Includes three hospitalizations for which age is unknown.
Return to footnote1referrer
See additional data on Reported Influenza Hospitalizations and Deaths in Canada: 2011-12 to 2015-16 on the Public Health Agency of Canada website.
[h=2]Influenza Strain Characterizations[/h] During the 2015-16 influenza season, the National Microbiology Laboratory (NML) has characterized 2,117 influenza viruses [194 A(H3N2), 1,188 A(H1N1) and 735 influenza B].
Influenza A (H3N2): When tested by hemagglutination inhibition (HI) assays, 50 A(H3N2) viruses were antigenically characterized as A/Switzerland/9715293/2013-like using antiserum raised against cell-propagated A/Switzerland/9715293/2013.
Sequence analysis was done on 144 A(H3N2) viruses. All viruses belonged to a genetic group for which most viruses were antigenically related to A/Switzerland/9715293/2013. A/Switzerland/9715293/2013 is the A(H3N2) component of the 2015-16 Northern Hemisphere's vaccine.
Influenza A (H1N1): All of the 1,188 A(H1N1) viruses characterized were antigenically similar to A/California/7/2009, the A(H1N1) component of the 2015-16 influenza vaccine.
Influenza B: A total of 154 influenza B viruses characterized were antigenically similar to the vaccine strain B/Phuket/3073/2013. A total of 581 influenza B viruses were characterized as B/Brisbane/60/2008-like, one of the influenza B components of the 2015-16 Northern Hemisphere quadrivalent influenza vaccine.
The recommended components for the 2015-2016 northern hemisphere trivalent influenza vaccine include: an A/California/7/2009(H1N1)pdm09-like virus, an A/Switzerland/9715293/2013(H3N2)-like virus, and a B/Phuket/3073/2013 -like virus (Yamagata lineage). For quadrivalent vaccines, the addition of a B/Brisbane/60/2008-like virus (Victoria lineage) is recommended.
The NML receives a proportion of the influenza positive specimens from provincial laboratories for strain characterization and antiviral resistance testing. Characterization data reflect the results of haemagglutination inhibition testing compared to the reference influenza strains recommended by WHO.
../

http://healthycanadians.gc.ca/publi...-2016-16-surveillance-influenza/index-eng.php
 
[h=1]FluWatch report: April 24 to April 30, 2016 (week 17)[/h] [h=2]Overall Summary[/h]
  • In week 17, all influenza indicators declined from the previous week.
  • Elevated influenza B activity persisited in many regions across Canada: influenza B accounted for the majority of influenza detections in week 17. Additionally, all outbreaks reported this week were due to Influenza B. This increase in influenza B is expected as influenza B often shows up later in the flu season.
  • Hospitalizations, ICU admissions and deaths among the pediatric population, while declining, continue to remain above expected levels based on the past several influenza seasons.
  • For more information on the flu, see our Flu(influenza) web page.
  • The current FluWatch report is the last weekly report for the 2015-2016 season. During the summer, monthly reports will be published starting on May 27, 2016. We will continue to monitor influenza and other respiratory infections via the RVDSS report, published every Thursday.

pub-eng.gif
Download the alternative format
(PDF format, 911 KB, 9 pages)
Organization: Public Health Agency of Canada
Date published: 2016-05-06

[h=2]Related Topics[/h]

Are you a primary health care practitioner (General Practitioner, Nurse Practitioner or Registered Nurse) interested in becoming a FluWatch sentinel for the 2015-16 influenza season? Contact us at FluWatch@phac-aspc.gc.ca


[h=2]On this page[/h]
[h=2]Influenza/Influenza-like Illness Activity (geographic spread)[/h] Influenza activity continues to be reported in the majority of regions in Canada; however, the number of regions reporting influenza activity decreased in week 17. Localized activity was reported in a total of 12 regions across six provinces. Sporadic activity levels were reported in 28 regions across all provinces and territories. A total of 10 regions reported no influenza activity in week 17.
[h=3]Figure 1. Map of overall influenza/ILI activity level by province and territory, Canada, week 17[/h]
fg1-legend-eng.gif


Note: Influenza/ILI activity levels, as represented on this map, are assigned and reported by Provincial and Territorial Ministries of Health, based on laboratory confirmations, sentinel ILI rates and reported outbreaks. Please refer to detailed definitions at the end of the report. Maps from previous weeks, including any retrospective updates, are available in the mapping feature found in the Weekly Influenza Reports.
Figure 1 - Text Description [h=2]Laboratory Confirmed Influenza Detections[/h] In week 17, the percentage of tests positive for influenza continued to decrease from the previous week [from 18% in week 16 to 17% in week 17], driven by the decline in influenza A. Compared to the previous five seasons, the percent positive (17%) reported in week 17 was above the five year average for that week and exceeded the range of expected levels (9.8%-14.0%). With the late start to the 2015-16 influenza season, these elevated levels are not unexpected.
[h=3]Figure 2. Number of positive influenza tests and percentage of tests positive, by type, subtype and report week, Canada, 2015-16[/h]
2016-w17-fg2-eng.gif
Figure 2 - Text Description Nationally in week 17, there were 881 positive influenza tests reported. Influenza B continues to account for an increasing proportion of influenza detections accounting for 70% of detections in week 17. Detections remain predominantly influenza A in British Columbia and the Atlantic Region. To date, 75% of influenza detections have been influenza A and among those subtyped, the vast majority have been influenza A(H1N1) [91% (10933/11990)].
[h=3]Figure 3. Cumulative numbers of positive influenza specimens by type/subtype and province, Canada, 2015-16[/h]
2016-w17-fg3-eng.gif
Note: Specimens from NT, YT, and NU are sent to reference laboratories in other provinces. Cumulative data includes updates to previous weeks.
Figure 3 - Text Description In week 17, individuals under the age of 45 accounted for 64% of influenza B detections.
To date this season, detailed information on age and type/subtype has been received for 31,858 cases. Children and teenagers (0-19) accounted for 47% of influenza B cases and approximately one third of all influenza cases. Children and teenagers (0-19), young adults (20-44) and middle-aged adults (45-64) accounted for approximately an equal proportion of influenza A(H1N1) cases (28%).
[TABLE="class: table-responsive table table-condensed table-striped table-hover table-bordered, width: 1140, height: 0"]
Table 1. Weekly and cumulative numbers of positive influenza specimens by type, subtype and age-group reported through case-based laboratory reportingTable 1 - Footnote1, Canada, 2015-16 [TR="class: bg-primary, bgcolor: #2572B4"]
Age groups (years) Weekly (April 24 to April 30, 2016) Cumulative (August 30, 2015 to April 30, 2016) [/TR]
[TR="class: bg-primary, bgcolor: #2572B4"]
Influenza A B Influenza A B Influenza A and B [/TR]
[TR="class: bg-primary, bgcolor: #2572B4"]
A Total A(H1) pdm09 A(H3) A UnSTable 1 - Footnote3 Total A Total A(H1) pdm09 A(H3) A UnSTable 1 - Footnote3 Total # % [/TR]
[TR]
[TD="class: wb-fnote small wb-init wb-fnote-inited, colspan: 13"] Table 1 - Footnote 1 Table 1 includes specimens for which demographic information was reported. These represent a subset of all positive influenza cases reported.
Return to Table 1 - Footnote1referrer
Table 1 - Footnote 2 Percentage of tests positive for sub-types of influenza A are a percentage of all influenza A detections.
Return to Table 1 - Footnote2referrer
Table 1 - Footnote 3 Unsubtyped: The specimen was typed as influenza A, but no result for subtyping was available.
Return to Table 1 - Footnote3referrer
Table 1 - Footnote x Suppressed to prevent residual disclosure.
Return to Table 1 - Footnotexreferrer
[/TD]
[/TR]
[TR="bgcolor: #F5F5F5"]
<5 [TD="class: text-right"]23[/TD]
[TD="class: text-right"]<5[/TD]
[TD="class: text-right"]Table 1 - Footnotex[/TD]
[TD="class: text-right"]20[/TD]
[TD="class: text-right"]106[/TD]
[TD="class: text-right"]4491[/TD]
[TD="class: text-right"]1708[/TD]
[TD="class: text-right"]72[/TD]
[TD="class: text-right"]2711[/TD]
[TD="class: text-right"]1432[/TD]
[TD="class: text-right"]5925[/TD]
[TD="class: text-right"]19%[/TD]
[/TR]
[TR]
5-19 [TD="class: text-right"]12[/TD]
[TD="class: text-right"]<5[/TD]
[TD="class: text-right"]<5[/TD]
[TD="class: text-right"]10[/TD]
[TD="class: text-right"]117[/TD]
[TD="class: text-right"]2393[/TD]
[TD="class: text-right"]1026[/TD]
[TD="class: text-right"]100[/TD]
[TD="class: text-right"]1267[/TD]
[TD="class: text-right"]2371[/TD]
[TD="class: text-right"]4766[/TD]
[TD="class: text-right"]15%[/TD]
[/TR]
[TR="bgcolor: #F5F5F5"]
20-44 [TD="class: text-right"]19[/TD]
[TD="class: text-right"]6[/TD]
[TD="class: text-right"]<5[/TD]
[TD="class: text-right"]12[/TD]
[TD="class: text-right"]82[/TD]
[TD="class: text-right"]5769[/TD]
[TD="class: text-right"]2750[/TD]
[TD="class: text-right"]155[/TD]
[TD="class: text-right"]2864[/TD]
[TD="class: text-right"]1986[/TD]
[TD="class: text-right"]7755[/TD]
[TD="class: text-right"]24%[/TD]
[/TR]
[TR]
45-64 [TD="class: text-right"]39[/TD]
[TD="class: text-right"]7[/TD]
[TD="class: text-right"]<5[/TD]
[TD="class: text-right"]Table 1 - Footnotex[/TD]
[TD="class: text-right"]48[/TD]
[TD="class: text-right"]6312[/TD]
[TD="class: text-right"]2772[/TD]
[TD="class: text-right"]190[/TD]
[TD="class: text-right"]3350[/TD]
[TD="class: text-right"]970[/TD]
[TD="class: text-right"]7282[/TD]
[TD="class: text-right"]23%[/TD]
[/TR]
[TR="bgcolor: #F5F5F5"]
65+ [TD="class: text-right"]51[/TD]
[TD="class: text-right"]6[/TD]
[TD="class: text-right"]<5[/TD]
[TD="class: text-right"]Table 1 - Footnotex[/TD]
[TD="class: text-right"]120[/TD]
[TD="class: text-right"]4778[/TD]
[TD="class: text-right"]1612[/TD]
[TD="class: text-right"]420[/TD]
[TD="class: text-right"]2746[/TD]
[TD="class: text-right"]1351[/TD]
[TD="class: text-right"]6130[/TD]
[TD="class: text-right"]19%[/TD]
[/TR]
[TR]
Total [TD="class: text-right"]144[/TD]
[TD="class: text-right"]23[/TD]
[TD="class: text-right"]6[/TD]
[TD="class: text-right"]115[/TD]
[TD="class: text-right"]473[/TD]
[TD="class: text-right"]23743[/TD]
[TD="class: text-right"]9868[/TD]
[TD="class: text-right"]937[/TD]
[TD="class: text-right"]12938[/TD]
[TD="class: text-right"]8110[/TD]
[TD="class: text-right"]31858[/TD]
[TD="class: text-right"]100%[/TD]
[/TR]
[TR="bgcolor: #F5F5F5"]
PercentageTable 1 - Footnote2 [TD="class: text-right"]23%[/TD]
[TD="class: text-right"]16%[/TD]
[TD="class: text-right"]4%[/TD]
[TD="class: text-right"]80%[/TD]
[TD="class: text-right"]77%[/TD]
[TD="class: text-right"]75%[/TD]
[TD="class: text-right"]42%[/TD]
[TD="class: text-right"]4%[/TD]
[TD="class: text-right"]54%[/TD]
[TD="class: text-right"]25%[/TD]
[TD="class: text-right"] [/TD]
[TD="class: text-right"] [/TD]
[/TR]
[/TABLE]

For data on other respiratory virus detections see the Respiratory Virus Detections in Canada Report on the Public Health Agency of Canada website.
[h=2]Influenza-like Illness Consultation Rate[/h] The national ILI consultation rate decreased from the previous week from 36.1 per 1,000 patient visits in week 16, to 31.1 per 1,000 patient visits in week 17. The highest ILI consultation rate was found in the 5-19 years age group (53.8 per 1,000) and the lowest was found in the 20-64 years age group (24.4 per 1,000) (Figure 4).
[h=3]Figure 4. Influenza-like-illness (ILI) consultation rates by age group and week, Canada, 2015-16[/h]
2016-w17-fg4-eng.gif
Delays in the reporting of data may cause data to change retrospectively. In BC, AB, and SK, data are compiled by a provincial sentinel surveillance program for reporting to FluWatch. Not all sentinel physicians report every week.
Figure 4 - Text Description [h=2]Pharmacy Surveillance[/h] During week 17, the proportion of prescriptions for antivirals decreased from the previous week to 21.2 antiviral prescriptions per 100,000 total prescriptions, which is lower than the five year historical average for week 17. The proportion of prescriptions for antivirals remains highest among children. In week 17, the proportion reported among children was 62.5 per 100,000 total prescriptions.
[h=3]Figure 5. Proportion of prescription sales for influenza antivirals by age group and week, Canada, 2015-16[/h]
2016-w17-fg5-eng.gif
Note: Pharmacy sales data are provided to the Public Health Agency of Canada by Rx Canada Inc. and sourced from major retail drug chains representing over 3,000 stores nationwide (excluding Nunavut) in 85% of Health Regions. Data provided include the number of new antiviral prescriptions (for Tamiflu[oseltamivir] and Relenza [zanamivir]) and the total number of new prescriptions dispensed by Province/Territory and age group.
* The average weekly proportion includes data from April 2011 to March 2015.
Figure 5 - Text Description [h=2]Influenza Outbreak Surveillance[/h] In week 17, eight new laboratory confirmed influenza outbreaks were reported: seven in long-term care facilities (LTCF) and one in an institution or community setting. Of the seven outbreaks with known strains or subtypes, all were due to influenza B.
To date this season, 409 outbreaks have been reported. At week 17 in the 2014-15 season, 1,696 outbreaks were reported and in the 2013-14 season, 226 outbreaks were reported.
[h=3]Figure 6. Overall number of new laboratory-confirmed influenza outbreaksFigure 5 - Footnote1 by report week, Canada, 2015-2016[/h]
2016-w17-fg6-eng.gif
Figure 6 - Footnote 1 All provinces and territories except NU report influenza outbreaks in long-term care facilities. All provinces and territories with the exception of NU and QC report outbreaks in hospitals. Outbreaks of influenza or influenza-like-illness in other facilities are reported to FluWatch but reporting varies between jurisdictions. Outbreak definitions are included at the end of the report.
Return to Figure 5 - Footnote1referrer
Figure 6 - Text Description [h=2]Sentinel Pediatric Hospital Influenza Surveillance[/h] [h=3]Paediatric Influenza Hospitalizations and Deaths[/h] In week 17, the number of laboratory-confirmed influenza-associated pediatric hospitlaizations slightly decreased. A total of 34 laboratory-confirmed influenza-associated pediatric (≤16 years of age) hospitalizations were reported by the Immunization Monitoring Program Active (IMPACT) network (Figure 7). The largest proportion of hospitalizations were in children aged 2-4 years, accounting for 35% of the hospitalizations. Similar to the trend of increased laboratory detections of influenza B, 82% of pediatric hospitalizations reported in week 17 were due to influenza B.
To date this season, 1,272 hospitalizations have been reported by the IMPACT network: 887 hospitalized cases (69%) were due to influenza A and 385 cases (31%) were due to influenza B. This season?s count of pediatric hospitalizations is nearly double that reported up to week 17 (676) in the 2014-15 season. The current year total number of cases also exceeds the total number of cases reported in the past five seasons.
A total of 195 intensive care unit (ICU) admissions have been reported. Children aged 2 to 4 and 5 to 9 years accounted for 29% and 26% respectively of ICU admissions. A total of 131 ICU cases (67%) reported at least one underlying condition or comorbidity. Eight influenza-associated deaths have been reported which is above the number of deaths reported at this time in the last five season.
[TABLE="class: table table-condensed table-striped table-hover table-bordered, width: 1140"]
Table 2 - Cumulative numbers of peadiatric hospitalizations (≤16 years of age) with influenza reported by the IMPACT network, Canada, 2015-16 [TR="class: bg-primary, bgcolor: #2572B4"]
Age Groups Cumulative (30 Aug. 2015 to 30 April 2016) [/TR]
[TR="class: bg-primary, bgcolor: #2572B4"]
Influenza A Influenza B Influenza A and B (#(%)) [/TR]
[TR="class: bg-primary, bgcolor: #2572B4"]
A Total A(H1) pdm09 A(H3) A (UnS) B Total [/TR]
[TR]
[TD="class: wb-fnote small wb-init wb-fnote-inited, colspan: 7"] Table 2 - Footnote x Suppressed to prevent residual disclosure.
Return to Table 2 - Footnotexreferrer
[/TD]
[/TR]
[TR="bgcolor: #F5F5F5"]
0-5m [TD="class: text-right"]120[/TD]
[TD="class: text-right"]32[/TD]
[TD="class: text-right"]5[/TD]
[TD="class: text-right"]83[/TD]
[TD="class: text-right"]33[/TD]
[TD="class: text-right"]153 (12%)[/TD]
[/TR]
[TR]
6-23m [TD="class: text-right"]275[/TD]
[TD="class: text-right"]75[/TD]
[TD="class: text-right"]8[/TD]
[TD="class: text-right"]192[/TD]
[TD="class: text-right"]76[/TD]
[TD="class: text-right"]351 (28%)[/TD]
[/TR]
[TR="bgcolor: #F5F5F5"]
2-4y [TD="class: text-right"]254[/TD]
[TD="class: text-right"]81[/TD]
[TD="class: text-right"]<5[/TD]
[TD="class: text-right"]Table 2 - Footnotex[/TD]
[TD="class: text-right"]104[/TD]
[TD="class: text-right"]358 (28%)[/TD]
[/TR]
[TR]
5-9y [TD="class: text-right"]180[/TD]
[TD="class: text-right"]45[/TD]
[TD="class: text-right"]<5[/TD]
[TD="class: text-right"]Table 2 - Footnotex[/TD]
[TD="class: text-right"]124[/TD]
[TD="class: text-right"]304 (24%)[/TD]
[/TR]
[TR="bgcolor: #F5F5F5"]
10-16y [TD="class: text-right"]58[/TD]
[TD="class: text-right"]18[/TD]
[TD="class: text-right"]<5[/TD]
[TD="class: text-right"]Table 2 - Footnotex[/TD]
[TD="class: text-right"]48[/TD]
[TD="class: text-right"]106 (8%)[/TD]
[/TR]
[TR]
Total [TD="class: text-right"]887[/TD]
[TD="class: text-right"]251[/TD]
[TD="class: text-right"]22[/TD]
[TD="class: text-right"]614[/TD]
[TD="class: text-right"]385[/TD]
[TD="class: text-right"]1272 (100%)[/TD]
[/TR]
[/TABLE]
[h=4]Figure 7. Number of cases of influenza reported by sentinel hospital networks, by week, Canada, 2015-16, paediatric and adult hospitalizations (≤16 years of age, IMPACT; ≥16 years of age, CIRN-SOS)[/h]
2016-w17-fg7-eng.gif
Not included in Table 2 and Figure 7 are two IMPACT cases that were due to co-infections of influenza A and B.
Figure 7 - Text Description [h=3]Adult Influenza Hospitalizations and Deaths[/h] Overall, adult hospitalizations decreased in week 17. A total of 12 laboratory-confirmed influenza-associated adult (≥16 years of age) hospitalizations were reported by the Canadian Immunization Research Network Serious Outcome Surveillance (CIRN-SOS) (Figure 7). The majority of hospitalizations were in adults ≥65 years of age (67%) and due to influenza B (70%). In recent weeks, the weekly number of hospitalizations reported by CIRN has been decreasing and an increasing proportion of hospitalizations have been due to influenza B.
To date this season, 1,131 hospitalizations have been reported by CIRN-SOS (Table 3). The majority of hospitalized cases were due to influenza A (82%) and the largest reported proportion was among adults ≥65 years of age (50%). One hundred and eighty-five intensive care unit (ICU) admissions have been reported of which 130 cases reported at least one underlying condition or comorbidity. A total of 50 deaths have been reported this season with the majority of deaths reported in adults ≥65 years of age (66%).
[TABLE="class: table table-condensed table-striped table-hover table-bordered, width: 1140"]
Table 3 - Cumulative numbers of adult hospitalizations (≥16 years of age) with influenza reported by the CIRN-SOS network, Canada, 2015-16 [TR="class: bg-primary, bgcolor: #2572B4"]
Age groups (years) Cumulative (1 Nov. 2015 to 30 April 2016) [/TR]
[TR="class: bg-primary, bgcolor: #2572B4"]
Influenza A B Influenza A and B [/TR]
[TR="class: bg-primary, bgcolor: #2572B4"]
A Total A(H1) pdm09 A(H3) A(UnS) Total # (%) [/TR]
[TR]
[TD="class: wb-fnote small wb-init wb-fnote-inited, colspan: 7"] Table 3 - Footnote x Suppressed to prevent residual disclosure.
Return to Table 3 - Footnotexreferrer
[/TD]
[/TR]
[TR="bgcolor: #F5F5F5"]
16-20 [TD="class: text-right"]Table 3 - Footnotex[/TD]
[TD="class: text-right"]<5[/TD]
[TD="class: text-right"]0[/TD]
[TD="class: text-right"]<5[/TD]
[TD="class: text-right"]<5[/TD]
[TD="class: text-right"]7 (1%)[/TD]
[/TR]
[TR]
20-44 [TD="class: text-right"]141[/TD]
[TD="class: text-right"]50[/TD]
[TD="class: text-right"]<5[/TD]
[TD="class: text-right"]Table 3 - Footnotex[/TD]
[TD="class: text-right"]41[/TD]
[TD="class: text-right"]182 (16%)[/TD]
[/TR]
[TR="bgcolor: #F5F5F5"]
45-64 [TD="class: text-right"]330[/TD]
[TD="class: text-right"]104[/TD]
[TD="class: text-right"]<5[/TD]
[TD="class: text-right"]Table 3 - Footnotex[/TD]
[TD="class: text-right"]43[/TD]
[TD="class: text-right"]373(33%)[/TD]
[/TR]
[TR]
65+ [TD="class: text-right"]445[/TD]
[TD="class: text-right"]124[/TD]
[TD="class: text-right"]24[/TD]
[TD="class: text-right"]297[/TD]
[TD="class: text-right"]120[/TD]
[TD="class: text-right"]565 (50%)[/TD]
[/TR]
[TR="bgcolor: #F5F5F5"]
Unknown [TD="class: text-right"]<5[/TD]
[TD="class: text-right"]0[/TD]
[TD="class: text-right"]0[/TD]
[TD="class: text-right"]<5[/TD]
[TD="class: text-right"]<5[/TD]
[TD="class: text-right"]<5 (x%)[/TD]
[/TR]
[TR]
Total [TD="class: text-right"]23[/TD]
[TD="class: text-right"]283[/TD]
[TD="class: text-right"]28[/TD]
[TD="class: text-right"]612[/TD]
[TD="class: text-right"]208[/TD]
[TD="class: text-right"]1131[/TD]
[/TR]
[TR="bgcolor: #F5F5F5"]
% [TD="class: text-right"]82%[/TD]
[TD="class: text-right"]31%[/TD]
[TD="class: text-right"]3%[/TD]
[TD="class: text-right"]66%[/TD]
[TD="class: text-right"]18%[/TD]
[TD="class: text-right"]100%[/TD]
[/TR]
[/TABLE]
[h=4]Figure 8. Percentage of hospitalizations, ICU admissions and deaths with influenza reported by age-group (≥16 year of age), Canada 2015-16[/h]
2016-w17-fg8-eng.gif
Note: The number of hospitalizations reported through CIRN-SOS and IMPACT represents a subset of all influenza-associated adult and paediatric hospitalizations in Canada. Delays in the reporting of data may cause data to change retrospectively.
x - Suppressed to prevent residual disclosure.
Figure 8 - Text Description [h=2]Provincial/Territorial Influenza Hospitalizations and Deaths[/h] In week 17, the number of hospitalizations reported by participating provinces and territories decreased from the previous week (from 129 in week 16 to 93 in week 17)Footnote*. Influenza B accounted for the greatest proportion of hospitalizations (63%) in week 17. The largest proportion of cases reported was in adults ≥65 years of age (43%). Among hospitalizations with influenza B, children represented 31% of cases.
Since the start of the 2015-16 season, 4,963 laboratory-confirmed influenza-associated hospitalizations have been reported. A total of 3,978 hospitalizations (80%) were due to influenza A and 985 (20%) were due to influenza B. Of the 522 ICU admissions reported, 269 (52%) were due to influenza A(H1N1). A total of 236 deaths have been reported; all but 33 were associated with influenza A (86%).
Overall this season, hospitalizations have been reported more frequently among adults ≥65 years of age. The largest proportion of ICU admissions was reported in adults 45-64 years of age and the highest proportion of fatal cases was reported in adults ≥65 years of age. Pediatric (0-19 years) and young to middle-aged adults (20-44 years) accounted for 42% of all hospitalizations and 13% of all deaths reported to date this season. Similar to findings from the IMPACT network, there have been more pediatric hospitalizations reported to date compared to the year-end totals in each of the previous four influenza seasons. [h=3]Figure 9. Percentage of hospitalizations, ICU admissions and deaths with influenza reported by age-group, Canada 2015-16[/h]
2016-w17-fg9-eng.gif
Figure 9 - Text Description Footnote * Note: Influenza-associated hospitalizations are not reported to PHAC by the following Provinces and Territory: BC, NU, and QC. Only hospitalizations that require intensive medical care are reported by SK. ICU admissions are not distinguished among hospital admissions reported from ON. Data may also include cases reported by the IMPACT networks. The number of new influenza-associated hospitalizations and deaths reported for the current week may include cases from ON that occurred in previous weeks, as a result of retrospective updates to the cumulative total. It is important to note that the hospitalization or death does not have to be attributable to influenza, a positive laboratory test is sufficient for reporting.
Return to footnote*referrer
Footnote * Includes three hospitalizations for which age is unknown.
Return to footnote1referrer
See additional data on Reported Influenza Hospitalizations and Deaths in Canada: 2011-12 to 2015-16 on the Public Health Agency of Canada website.
[h=2]Influenza Strain Characterizations[/h] During the 2015-16 influenza season, the National Microbiology Laboratory (NML) has characterized 2,233 influenza viruses [209 A(H3N2), 1,230 A(H1N1) and 794 influenza B].
Influenza A (H3N2): When tested by hemagglutination inhibition (HI) assays, 58 A(H3N2) viruses were antigenically characterized as A/Switzerland/9715293/2013-like using antiserum raised against cell-propagated A/Switzerland/9715293/2013.
Sequence analysis was done on 151 A(H3N2) viruses. All viruses belonged to a genetic group for which most viruses were antigenically related to A/Switzerland/9715293/2013. A/Switzerland/9715293/2013 is the A(H3N2) component of the 2015-16 Northern Hemisphere's vaccine.
Influenza A (H1N1): All of the 1,230 A(H1N1) viruses characterized were antigenically similar to A/California/7/2009, the A(H1N1) component of the 2015-16 influenza vaccine.
Influenza B:A total of 162 influenza B viruses characterized were antigenically similar to the vaccine strain B/Phuket/3073/2013. A total of 632 influenza B viruses were characterized as B/Brisbane/60/2008-like, one of the influenza B components of the 2015-16 Northern Hemisphere quadrivalent influenza vaccine.
The recommended components for the 2015-2016 Northern Hemisphere trivalent influenza vaccine included: an A/California/7/2009(H1N1)pdm09-like virus, an A/Switzerland/9715293/2013(H3N2)-like virus, and a B/Phuket/3073/2013 -like virus (Yamagata lineage). For quadrivalent vaccines, the addition of a B/Brisbane/60/2008-like virus (Victoria lineage) is recommended.
The NML receives a proportion of the influenza positive specimens from provincial laboratories for strain characterization and antiviral resistance testing. Characterization data reflect the results of haemagglutination inhibition testing compared to the reference influenza strains recommended by WHO.
.../

http://healthycanadians.gc.ca/publi...-2016-17-surveillance-influenza/index-eng.php
 
Back
Top