• FluTrackers.com Inc. does not provide medical advice. Information on this web site is collected from various internet resources, and the FluTrackers board of directors makes no warranty to the safety, efficacy, correctness or completeness of the information posted on this site by any author or poster. The information collated here is for instructional and/or discussion purposes only and is NOT intended to diagnose or treat any disease, illness, or other medical condition. Every individual reader or poster should seek advice from their personal physician/healthcare practitioner before considering or using any interventions that are discussed on this website. By continuing to access this website you agree to consult your personal physican before using any interventions posted on this website, and you agree to hold harmless FluTrackers.com Inc., the board of directors, the members, and all authors and posters for any effects from use of any medication, supplement, vitamin or other substance, device, intervention, etc. mentioned in posts on this website, or other internet venues referenced in posts on this website.
  • We are not asking for any donations. Do not donate to any entity who says they are raising funds for us.

Australia Influenza Surveillance 2017

Ronan Kelly

Retired 2020
Link to 2016 thread:
https://flutrackers.com/forum/forum/...veillance-2016


New South Wales

Week 21: 22 to 28 May, 2017
Summary:
? Influenza activity continues to be low across all NSW local health districts.
? Both influenza A and B strains are circulating at similar levels.
In this reporting week:
? Hospital Surveillance ? influenza like illness (ILI) presentations to selected emergency
departments were low and at inter-seasonal levels.
? Laboratory surveillance ? the total number of influenza isolations was unchanged this week with
the proportion of respiratory samples positive for influenza unchanged at 4.8%.
? Community surveillance ? influenza notifications were low across all NSW local health districts
(LHD). General Practice and community-based surveillance systems showed low ILI activity.
One aged care facility reported a respiratory outbreak.
? National and international influenza surveillance ? national influenza surveillance reports are
not produced at this time of year, however many jurisdictions are reporting low influenza
activity.
? Recommended composition of 2017 influenza vaccines ? the 2017 Australian influenza
vaccines cover two A and two B strains, including one A strain change from the 2016
influenza vaccines.

For more information: NSW Health

Queensland
Statewide Weekly Influenza
Surveillance Report

Reporting Period: 1 January to 28 May 2017 Queensland.png


For more information: Queensland Health

South Australia

21 May to 27 May 2017
Influenza vaccine is now available and we advise people (≥6 months of age) to get vaccinated as
soon as possible.

One hundred and fifty-four cases of influenza were reported this week with 118 cases being
characterised as influenza A and 36 as influenza B. Cases comprised of 76 males and 78 females,
with a median age of 37 years. There have been 1,524 cases of influenza notified year-to-date,
compared with 810 cases reported for the same period last year.

The influenza chart shows recent influenza activity in South Australia.

For more information: SA Health

Tasmania

No reports yet for 2017

For more information: DHHS Tasmania

Victoria

Report No. 3: Week ending 21 May 2017
Overview: The 2017 influenza season so far
Influenza-like illness (ILI) surveillance indicates activity is at baseline levels.
The number of notified laboratory confirmed influenza cases for the year to 21 May is 42% higher than at the
same time in 2016. This difference is largely due to increased notifications in the first 7 weeks of the year. In the
past 4 weeks the number of notified cases was similar to 2016. Of the notified influenza cases, 84% have been
type A. Five VicSPIN swabs were positive for influenza: two influenza A(H1) and three influenza A(untyped). Six
were positive for picornavirus.
Influenza and ILI surveillance systems are at baseline levels.
GP?s can you please try to swab all ILI patients and ensure you record all ILI patients.
Electronic entry of tally sheet data will be possible in several weeks when the new database is rolled out, with
instructions about how to use it to be provided beforehand.

For more information: Victorian Infectious Diseases Reference Laboratory

Western Australia
WEEK ENDING 21ST MAY 2017
KEY POINTS
INFLUENZA AND INFLUENZA-LIKE ILLNESSES (ILI)
Summary: Indicators of ILI and influenza activity remain at inter-seasonal levels.
 There is a low level of ILI and influenza activity.
 While the number of detections remains low, there has been a relative increase in influenza A/H1N1
virus in the past 3 weeks, accounting for around 50% of detections.
 Non-influenza respiratory virus activity, including RSV, also remains low

For more information: WA Dept.of Health

*
Nationally

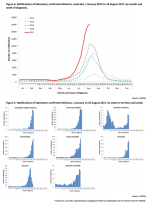
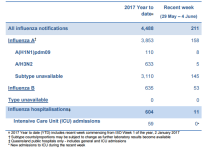
For the period to Jan 1- June 5, 2017.
NNDSS.png


For national data: National Notifiable Diseases Surveillance System

Australian Sentinel Practices Research Network (ASPREN)

No. 5, 2017
27th February-12th March, 2017

SYNDROMIC SURVEILLANCE
REPORTING
Reports were received from 171 GPs from 8
states and territories during the reporting
period. During weeks 9 and 10 ASPREN
reporters saw a total of 25,698 patients.

INFLUENZA-LIKE-ILLNESS (ILI)
Nationally, ILI notifications increased over the
period with 83 notifications being reported in
weeks 9?10. ILI rates reported in this period slightly
increased at 4 and 3 cases per 1000 consultations in weeks 9
and 10 respectively, compared to 2 cases per 1000
consultations in the previous fortnight. For the same reporting
period in 2016, ILI rates were 2 cases per 1000 consultations
(see Fig. 5). On a state-by-state basis, it is important to note
the sustained, elevated ILI rate in the Northern Territory (see
Fig. 2).


For more information: ASPREN

*
Flu Tracking

Week ending 28 May 2017
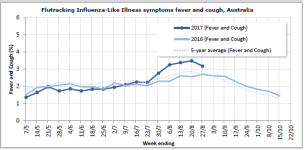
This survey was sent on Monday, 29 May 2017 at 01:13 AM and by 09:00 AM, Thursday 01 June we had received 24590 responses (24587 last week) from 14682 people responding for themselves and 9908 household members across Australia.

Low levels of influenza-like illness activity

Across Australia, fever and cough was reported by 1.6% of vaccinated participants and 1.8% of unvaccinated participants. Fever, cough and absence from normal duties was reported by 1.1% of vaccinated participants and 1.3% of unvaccinated participants.

For participants this week, 13811/24590 (56.2 %) have received the seasonal vaccine so far. Of the 4677 participants who identified as working face-to-face with patients, 3487 (74.6%) have received the vaccine.

For more information: Flu Tracking


Australian influenza report 2017 - Current report:
No reports yet for 2017

For more information: Department of Health
 
Updates marked with a *

*New South Wales


Week 22: 29 May to 4 June, 2017
Summary:
? Influenza activity is increasing but remains low across all NSW local health districts.
? Influenza B strains are circulating at slightly higher levels than influenza A strains.
In this reporting week:
? Hospital Surveillance ? influenza like illness (ILI) presentations to selected emergency
departments were low and at inter-seasonal levels.
? Laboratory surveillance ? the total number of influenza isolations increased this week with the
proportion of respiratory samples positive for influenza at 5.5%.
? Community surveillance ? influenza notifications were low across all NSW local health districts
(LHD). General Practice and community-based surveillance systems showed low ILI activity.
One aged care facility reported an influenza B outbreak.
? Deaths with pneumonia or influenza reported on the death certificate - The NSW Registry of
Births, Deaths, and Marriages have recorded 15 deaths in association with influenza in 2017.
The rate of deaths classified as ?pneumonia and influenza? remained low.

? National and international influenza surveillance ? national influenza surveillance reports are
not produced at this time of year, however many jurisdictions are reporting low influenza
activity.
? Recommended composition of 2017 influenza vaccines ? the 2017 Australian influenza
vaccines cover two A and two B strains, including one A strain change from the 2016
influenza vaccines.

For more information: NSW Health

*Queensland
Statewide Weekly Influenza
Surveillance Report

Reporting Period: 1 January to 4 June 2017

Queensland.png

For more information: Queensland Health

*South Australia

28 May to 3 June 2017
Influenza vaccine is now available and we advise people (≥6 months of age) to get vaccinated as
soon as possible.

One hundred and seventy-one cases of influenza were reported this week with 142 cases being
characterised as influenza A and 29 as influenza B. Cases comprised of 80 males and 91 females,
with a median age of 46 years. There have been 1,696 cases of influenza notified year-to-date,
compared with 826 cases reported for the same period last year.
The influenza chart shows recent influenza activity in South Australia.

For more information: SA Health

*Tasmania

FluTas 2017 Report 01

This surveillance report describes influenza activity in Tasmania during the period 1 January to 30 April 2017.

2017 summary: January to April


The 2017 influenza season has not begun.
Although inter-seasonal influenza notification numbers were greater than the five year average for the same period, flu activity is still well below winter influenza levels.
During this period the majority of notifications were for Influenza A; there were 119 notifications of influenza A (86 per cent) and 19 of Influenza B (14 per cent).

For more information: DHHS Tasmania

Victoria

Report No. 3: Week ending 21 May 2017
Overview: The 2017 influenza season so far
Influenza-like illness (ILI) surveillance indicates activity is at baseline levels.
The number of notified laboratory confirmed influenza cases for the year to 21 May is 42% higher than at the
same time in 2016. This difference is largely due to increased notifications in the first 7 weeks of the year. In the
past 4 weeks the number of notified cases was similar to 2016. Of the notified influenza cases, 84% have been
type A. Five VicSPIN swabs were positive for influenza: two influenza A(H1) and three influenza A(untyped). Six
were positive for picornavirus.
Influenza and ILI surveillance systems are at baseline levels.
GP?s can you please try to swab all ILI patients and ensure you record all ILI patients.
Electronic entry of tally sheet data will be possible in several weeks when the new database is rolled out, with
instructions about how to use it to be provided beforehand.

For more information: Victorian Infectious Diseases Reference Laboratory

Western Australia
WEEK ENDING 21ST MAY 2017
KEY POINTS
INFLUENZA AND INFLUENZA-LIKE ILLNESSES (ILI)
Summary: Indicators of ILI and influenza activity remain at inter-seasonal levels.
 There is a low level of ILI and influenza activity.
 While the number of detections remains low, there has been a relative increase in influenza A/H1N1
virus in the past 3 weeks, accounting for around 50% of detections.
 Non-influenza respiratory virus activity, including RSV, also remains low

For more information: WA Dept.of Health

*
Nationally

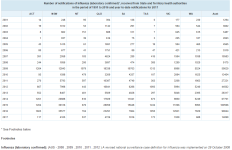
For the period to Jan 1- June 10, 2017.


NNDSS.png


For national data: National Notifiable Diseases Surveillance System

*Australian Sentinel Practices Research Network (ASPREN)

No. 10, 2017
8 - 21 May, 2017

SYNDROMIC SURVEILLANCE
REPORTING
Reports were received from 261 reporters
from 8 states and territories during the
reporting period. This includes data from
GPs reporting to VicSPIN. During weeks 19
and 20 ASPREN reporters saw a total of
41,057 patients.

INFLUENZA-LIKE-ILLNESS (ILI)
Nationally, ILI notifications increased over the period with 143
notifications being reported in weeks 19?20. ILI rates
reported in this period remained steady at 4 and 3 cases per
1000 consultations for both weeks 19 and 20 respectively.
This was the same rates as seen in the previous fortnight. For
the same reporting period in 2016, ILI rates were the similar at
3 and 5 cases per 1000 consultations for weeks 19 and 20
respectively (see Fig. 5). On a state-by-state basis, it is
important to note the elevated ILI rate in remote NSW (see
Fig. 2).

For more information: ASPREN

*
Flu Tracking

Week ending 04 June 2017
Low levels of influenza-like illness activity

This survey was sent on Monday, 05 June 2017 at 01:13 AM and by 09:00 AM, Thursday 08 June we had received 24330 responses (24776 last week) from 14570 people responding for themselves and 9760 household members across Australia.

Across Australia, fever and cough was reported by 1.6% of vaccinated participants and 2.2% of unvaccinated participants. Fever, cough and absence from normal duties was reported by 1.0% of vaccinated participants and 1.4% of unvaccinated participants.

For participants this week, 14123/24330 (58.0 %) have received the seasonal vaccine so far. Of the 4606 participants who identified as working face-to-face with patients, 3528 (76.6%) have received the vaccine.

For more information: Flu Tracking


Australian influenza report 2017 - Current report:
No reports yet for 2017

For more information: Department of Health
 
Updates marked with a *

*New South Wales


Week 23: 5 to 11 June, 2017
Summary:
 Influenza activity in the community is increasing, consistent with the start of the winter
influenza season.
 The impact of influenza on the health sector is increasing but remains low.
 Influenza activity usually reaches its peak 5-8 weeks after the season onset.
 Influenza B strains at similar levels to influenza A strains.
In this reporting week:
 Hospital Surveillance – influenza like illness (ILI) presentations to selected emergency
departments increased but remained at inter-seasonal levels.
 Laboratory surveillance – the total number of influenza isolations increased this week with the
proportion of respiratory samples positive for influenza notably increased at 8.0%.
 Community surveillance – influenza notifications increased in metropolitan local health districts
(LHD). General Practice surveillance showed low but increasing ILI activity. One aged care
facility reported an influenza A outbreak.
 National and international influenza surveillance – influenza activity has increased slightly in
the last month, but remains at inter-seasonal levels across Australia.
 Recommended composition of 2017 influenza vaccines – the 2017 Australian influenza
vaccines cover two A and two B strains, including one A strain change from the 2016
influenza vaccines.

For more information: NSW Health

*Queensland
Statewide Weekly Influenza
Surveillance Report

Reporting Period: 1 January to 11 June 2017 Queensland.png


For more information: Queensland Health

*South Australia

4 June to 10 June 2017
Influenza vaccine is now available and we advise people (≥6 months of age) to get vaccinated as
soon as possible.

One hundred and seventy-six cases of influenza were reported this week with 148 cases being
characterised as influenza A and 28 as influenza B. Cases comprised of 78 males and 98 females,
with a median age of 34 years. There have been 1,872 cases of influenza notified year-to-date,
compared with 845 cases reported for the same period last year.
The influenza chart shows recent influenza activity in South Australia.

For more information: SA Health

Tasmania

FluTas 2017 Report 01

This surveillance report describes influenza activity in Tasmania during the period 1 January to 30 April 2017.

2017 summary: January to April


The 2017 influenza season has not begun.
Although inter-seasonal influenza notification numbers were greater than the five year average for the same period, flu activity is still well below winter influenza levels.
During this period the majority of notifications were for Influenza A; there were 119 notifications of influenza A (86 per cent) and 19 of Influenza B (14 per cent).

For more information: DHHS Tasmania

*Victoria

Report No. 6: Week ending 11 June 2017
Overview: The 2017 influenza season so far
Influenza and ILI surveillance systems are at baseline to average levels.
The number of notified laboratory confirmed influenza cases for the year to 4 June is 54% higher than at the
same time in 2016, largely due to a higher number of notified cases in the first two months of the year. Most
notified cases year-to-date have been type A (71%).
Twelve swabs were received this week, of which three were positive for influenza; two influenza (H3) and one
influenza B, but picornavirus is the most commonly detected respiratory virus so far in 2017.
This year we are encouraging GPs to swab all ILI patients (where possible) and ensure all ILI patients are recorded
on the tally sheet.
Final stage testing of the new database is now underway, and will hopefully be rolled out in several weeks.

For more information: Victorian Infectious Diseases Reference Laboratory

*Western Australia
WEEK ENDING 4TH JUNE 2017
KEY POINTS
INFLUENZA AND INFLUENZA-LIKE ILLNESSES (ILI)
Summary: Indicators of ILI and influenza activity remain at inter-seasonal levels.
 Influenza detections decreased this week; but remain around the average levels for this time of year.
 Influenza hospital admissions decreased this week, whilst ILI activity at EDs increased.
 Non-influenza respiratory virus activity decreased this week.


For more information: WA Dept.of Health

*
Nationally

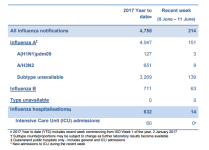
For the period to Jan 1- June 17, 2017.
NNDSS.png


For national data: National Notifiable Diseases Surveillance System

*Australian Sentinel Practices Research Network (ASPREN)

No. 11, 2017
22 May - 4 June, 2017

SYNDROMIC SURVEILLANCE
REPORTING
Reports were received from 274 reporters
from 8 states and territories during the
reporting period. This includes data from
GPs reporting to VicSPIN. During weeks 21
and 22 ASPREN reporters saw a total of
35,230 patients.

INFLUENZA-LIKE-ILLNESS (ILI)
Nationally, ILI notifications increased over the period with 148
notifications being reported in weeks 21—22. ILI rates
reported in this period remained steady at 4 cases per 1000
consultations for both weeks 21 and 22. This was the same
rates as seen in the previous fortnight. For the same reporting
period in 2016, ILI rates were higher at 5 and 7 cases per
1000 consultations for weeks 21 and 22 respectively (see Fig.
5). On a state-by-state basis, it is important to note the
elevated ILI rate in urban NSW (see Fig. 2).

For more information: ASPREN

*
Flu Tracking

Week ending 11 June 2017
Low levels of influenza-like illness activity

This survey was sent on Monday, 12 June 2017 at 01:13 AM and by 09:00 AM, Thursday 15 June we had received
24199 responses (24494 last week) from 14465 people responding for themselves and 9734 household members
across Australia.

Across Australia, fever and cough was reported by 1.6% of
vaccinated participants and 1.8% of unvaccinated
participants. Fever, cough and absence from normal duties
was reported by 1.0% of vaccinated participants and 1.3%
of unvaccinated participants.

For participants this week, 14297/24199 (59.1 %) have
received the seasonal vaccine so far. Of the 4580
participants who identified as working face-to-face with
patients, 3577 (78.1%) have received the vaccine.

For more information: Flu Tracking


*Australian influenza report 2017 - Current report:
AUSTRALIAN INFLUENZA
SURVEILLANCE REPORT
No. 1, 2017
Reporting period 13 ‐ 26 May 2017

KEY MESSAGES
 Influenza activity has increased slightly in the last month, but remains at inter‐seasonal levels across
Australia.
 Detections of influenza B viruses have increased in recent weeks, consistent with the predominance of
influenza B viruses worldwide currently.1
 Respiratory viruses other than influenza are more commonly causing influenza‐like illness presentations to
sentinel general practitioners, with rhinovirus and respiratory syncytial virus (RSV) detected most
frequently.
 There is no indication of the potential severity of the 2017 season at this time.
 To date, the seasonal influenza vaccines appear to be a good match for circulating virus strains.
Australia.png


For more information: Department of Health
 
Updates marked with a *

*New South Wales


Week 24: 12 to 18 June, 2017
Summary:
 Influenza activity in continuing to increase, consistent with the flu season.
 The impact of influenza on the health sector is increasing.
 The peak of influenza activity is likely to be in the next 4-7 weeks.
 Influenza B strains are circulating at slightly higher levels than influenza A strains.
In this reporting week:
 Hospital Surveillance ? influenza like illness (ILI) presentations to selected emergency
departments continued to increase and is close to the seasonal threshold.
 Laboratory surveillance ? the total number of influenza isolations increased this week with the
proportion of respiratory samples positive for influenza higher at 9.7%.
 Community surveillance ? influenza notifications increased in metropolitan local health districts
(LHD). General Practice ILI activity remained steady. Two aged care facilities reported
influenza A outbreaks.
 National and international influenza surveillance ? influenza activity has increased slightly in
the last month, but remains at inter-seasonal levels across Australia.
 Recommended composition of 2017 influenza vaccines ? the 2017 Australian influenza
vaccines cover two A and two B strains, including one A strain change from the 2016
influenza vaccines.

For more information: NSW Health

*Queensland
Statewide Weekly Influenza
Surveillance Report

Reporting Period: 1 January to 18 June 2017
Queensland.png

For more information: Queensland Health

*South Australia

11 June to 17 June 2017
The influenza season has started and we advise everyone (≥6 months of age) not vaccinated this
year to get vaccinated as soon as possible.

One hundred and sixty-six cases of influenza were reported this week with 123 cases being
characterised as influenza A and 43 as influenza B. Cases comprised of 77 males and 89 females,
with a median age of 35 years. There have been 2,038 cases of influenza notified year-to-date,
compared with 869 cases reported for the same period last year.
The influenza chart shows recent influenza activity in South Australia.

For more information: SA Health

Tasmania

FluTas 2017 Report 01

This surveillance report describes influenza activity in Tasmania during the period 1 January to 30 April 2017.

2017 summary: January to April


The 2017 influenza season has not begun.
Although inter-seasonal influenza notification numbers were greater than the five year average for the same period, flu activity is still well below winter influenza levels.
During this period the majority of notifications were for Influenza A; there were 119 notifications of influenza A (86 per cent) and 19 of Influenza B (14 per cent).

For more information: DHHS Tasmania

Victoria

Report No. 6: Week ending 11 June 2017
Overview: The 2017 influenza season so far
Influenza and ILI surveillance systems are at baseline to average levels.
The number of notified laboratory confirmed influenza cases for the year to 4 June is 54% higher than at the
same time in 2016, largely due to a higher number of notified cases in the first two months of the year. Most
notified cases year-to-date have been type A (71%).
Twelve swabs were received this week, of which three were positive for influenza; two influenza (H3) and one
influenza B, but picornavirus is the most commonly detected respiratory virus so far in 2017.
This year we are encouraging GPs to swab all ILI patients (where possible) and ensure all ILI patients are recorded
on the tally sheet.
Final stage testing of the new database is now underway, and will hopefully be rolled out in several weeks.

For more information: Victorian Infectious Diseases Reference Laboratory

Western Australia
WEEK ENDING 4TH JUNE 2017
KEY POINTS
INFLUENZA AND INFLUENZA-LIKE ILLNESSES (ILI)
Summary: Indicators of ILI and influenza activity remain at inter-seasonal levels.
 Influenza detections decreased this week; but remain around the average levels for this time of year.
 Influenza hospital admissions decreased this week, whilst ILI activity at EDs increased.
 Non-influenza respiratory virus activity decreased this week.


For more information: WA Dept.of Health

*
Nationally

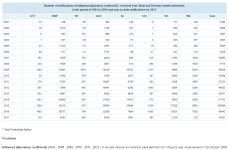
For the period to Jan 1- June 24, 2017.

NNDSS.png

For national data: National Notifiable Diseases Surveillance System

Australian Sentinel Practices Research Network (ASPREN)

No. 11, 2017
22 May - 4 June, 2017

SYNDROMIC SURVEILLANCE
REPORTING
Reports were received from 274 reporters
from 8 states and territories during the
reporting period. This includes data from
GPs reporting to VicSPIN. During weeks 21
and 22 ASPREN reporters saw a total of
35,230 patients.

INFLUENZA-LIKE-ILLNESS (ILI)
Nationally, ILI notifications increased over the period with 148
notifications being reported in weeks 21?22. ILI rates
reported in this period remained steady at 4 cases per 1000
consultations for both weeks 21 and 22. This was the same
rates as seen in the previous fortnight. For the same reporting
period in 2016, ILI rates were higher at 5 and 7 cases per
1000 consultations for weeks 21 and 22 respectively (see Fig.
5). On a state-by-state basis, it is important to note the
elevated ILI rate in urban NSW (see Fig. 2).

For more information: ASPREN

*
Flu Tracking

Week ending 18 June 2017
Low levels of influenza-like illness activity

This survey was sent on Monday, 19 June 2017 at 01:13 AM and by 09:00 AM, Thursday 22 June we had received 24637 responses (24382 last week) from 14802 people responding for themselves and 9835 household members across Australia.

Across Australia, fever and cough was reported by 1.6% of vaccinated participants and 2.1% of unvaccinated participants. Fever, cough and absence from normal duties was reported by 1.0% of vaccinated participants and 1.4% of unvaccinated participants.

For participants this week, 14781/24637 (60.0 %) have received the seasonal vaccine so far. Of the 4664 participants who identified as working face-to-face with patients, 3693 (79.2%) have received the vaccine.

For more information: Flu Tracking


Australian influenza report 2017 - Current report:
AUSTRALIAN INFLUENZA
SURVEILLANCE REPORT
No. 1, 2017
Reporting period 13 ‐ 26 May 2017

KEY MESSAGES
 Influenza activity has increased slightly in the last month, but remains at inter‐seasonal levels across
Australia.
 Detections of influenza B viruses have increased in recent weeks, consistent with the predominance of
influenza B viruses worldwide currently.1
 Respiratory viruses other than influenza are more commonly causing influenza‐like illness presentations to
sentinel general practitioners, with rhinovirus and respiratory syncytial virus (RSV) detected most
frequently.
 There is no indication of the potential severity of the 2017 season at this time.
 To date, the seasonal influenza vaccines appear to be a good match for circulating virus strains.


For more information: Department of Health
 
Updates marked with a *

*New South Wales


Week 26: 26 June to 2 July, 2017

Summary:
• Influenza activity has increased and is likely to continue to rise throughout July.
• The impact of influenza on the health sector is steadily increasing.
• Influenza A and B strains are circulating at similar levels.
In this reporting week:
• Hospital surveillance – influenza-like illness (ILI) presentations to selected emergency
departments continued to increase.
• Laboratory surveillance – the total number of influenza isolations increased again this week
with the proportion of respiratory samples positive for influenza higher at 15.5%.
• Community surveillance – influenza notifications increased in metropolitan local health
districts (LHD). General Practice ILI activity decreased slightly. Four aged care facilities
reported respiratory outbreaks.
• National and international influenza surveillance – influenza activity is increasing in most of
the southern and central regions of Australia. Activity is sporadic and stable in northern
parts of the country.
• Recommended composition of 2017 influenza vaccines – the 2017 Australian influenza
vaccines cover two A and two B strains, including one A strain change from the 2016
influenza vaccines.
NSW.png

For more information: NSW Health

*Queensland
Statewide Weekly Influenza
Surveillance Report

Reporting Period: 1 January to 2 July 2017 Queensland.png


For more information: Queensland Health

*South Australia

18 June to 24 June 2017
The influenza season has started and we advise everyone (≥6 months of age) not vaccinated against
influenza this year to get vaccinated as soon as possible.

Two hundred and sixty-seven cases of influenza were reported this week with 204 cases being
characterised as influenza A and 63 as influenza B. Cases comprised of 131 males and 136 females,
with a median age of 31 years. There have been 2,305 cases of influenza notified year-to-date,
compared with 890 cases reported for the same period last year
The influenza chart shows recent influenza activity in South Australia.

For more information: SA Health

Tasmania

FluTas 2017 Report 01

This surveillance report describes influenza activity in Tasmania during the period 1 January to 30 April 2017.

2017 summary: January to April

The 2017 influenza season has not begun.
Although inter-seasonal influenza notification numbers were greater than the five year average for the same period, flu activity is still well below winter influenza levels.
During this period the majority of notifications were for Influenza A; there were 119 notifications of influenza A (86 per cent) and 19 of Influenza B (14 per cent).

For more information: DHHS Tasmania

*Victoria
Report No. 9: Week ending 2 July 2017
Overview: The 2017 influenza season so far
Influenza surveillance systems are at average levels. ILI rates are above baseline at average levels.
The number of notified laboratory confirmed influenza cases for the year to 2 July is 81% higher than at the same
time in 2016. There has been an increase in notifications in the last couple of weeks for both influenza A and B.
Most notified cases year-to-date have been type A (78%).
Twenty swabs were received this week, of which five were positive for influenza; one influenza (H1), two
Influenza A untyped and two influenza B, but picornavirus is the most commonly detected respiratory virus so
far in 2017.
This year we are encouraging GPs to swab all ILI patients (where possible) and ensure all ILI patients are recorded
on the tally sheet.
Final stage testing of the new database is now underway, and will hopefully be rolled out in several weeks.

For more information: Victorian Infectious Diseases Reference Laboratory

*Western Australia
WEEK ENDING 18TH JUNE 2017

Summary: There were contradictory changes in indicators this week, with ILI activity decreasing, while
influenza notifications and non-influenza respiratory virus detections increased.
 Influenza notifications increased to the seasonal threshold level for the first time in 2017. Currently,
A/H1N1 and A/H3N2 sub-types are co-circulating, with lesser amounts of influenza B virus.
 Influenza percent positivity remains relatively low for this time of year.
 ILI presentations at sentinel GPs and EDs fell this week.
 Influenza-related hospitalisations remain at around average levels for this time of the year, with
influenza A viruses predominant.
 Non-influenza respiratory virus activity increased, mostly due to an increase in parainfluenza and
respiratory syncytial virus detections.

For more information: Virus WAtch

*Nationally

For the period to Jan 1- July 8, 2017.
NNDSS.png


For national data: National Notifiable Diseases Surveillance System

Australian Sentinel Practices Research Network (ASPREN)

No. 11, 2017
22 May - 4 June, 2017

SYNDROMIC SURVEILLANCE
REPORTING
Reports were received from 274 reporters
from 8 states and territories during the
reporting period. This includes data from
GPs reporting to VicSPIN. During weeks 21
and 22 ASPREN reporters saw a total of
35,230 patients.

INFLUENZA-LIKE-ILLNESS (ILI)
Nationally, ILI notifications increased over the period with 148
notifications being reported in weeks 21—22. ILI rates
reported in this period remained steady at 4 cases per 1000
consultations for both weeks 21 and 22. This was the same
rates as seen in the previous fortnight. For the same reporting
period in 2016, ILI rates were higher at 5 and 7 cases per
1000 consultations for weeks 21 and 22 respectively (see Fig.
5). On a state-by-state basis, it is important to note the
elevated ILI rate in urban NSW (see Fig. 2).

For more information: ASPREN

*
Flu Tracking

Week ending 02 July 2017
Low levels of influenza-like illness activity

This survey was sent on Monday, 03 July 2017 at 01:13 AM and by 09:00 AM, Thursday 06 July we had received
23603 responses (24704 last week) from 14375 people responding for themselves and 9228 household members
across Australia.

Across Australia, fever and cough was reported by 1.8% of
vaccinated participants and 2.1% of unvaccinated
participants. Fever, cough and absence from normal duties
was reported by 1.2% of vaccinated participants and 1.4%
of unvaccinated participants.

For participants this week, 14540/23603 (61.6 %) have
received the seasonal vaccine so far. Of the 4468
participants who identified as working face-to-face with
patients, 3571 (79.9%) have received the vaccine.

For more information: Flu Tracking


*Australian influenza report 2017 - Current report:
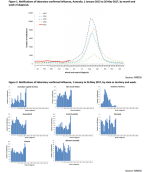
Australian Influenza Surveillance Report No 03 - 10 June to 23 June 2017
Summary
Influenza activity is increasing in most of the southern and central regions of Australia while sporadic and stable in the northern regions of the country.
While testing for influenza has increased over the reporting fortnight, respiratory viruses other than influenza, in particular rhinovirus, were most commonly detected by sentinel laboratories.
Nationally, notifications of laboratory confirmed influenza B viruses have continued to increase over the reporting fortnight, however influenza A(H1N1)pdm09 and influenza A(H3N2) are also co-circulating in some parts of the country.
Influenza-like illness (ILI) in the community was low and relatively stable this reporting fortnight, while ILI presentations to sentinel GPs were also low, but increasing.
To date, the seasonal influenza vaccines appear to be a good match for circulating virus strains
Australia.png


For more information: Department of Health
 
Updates marked with a *

*New South Wales


Week 27: 3 to 9 July, 2017
Summary:
 Surveillance data indicates a marked rise in activity over the last week and it is
expected to continue to rise throughout July.
 The impact of influenza on the health sector is steadily increasing.
 Influenza A strains were more common than influenza B strains.
In this reporting week:
 Hospital surveillance ? influenza-like illness (ILI) presentations to selected emergency
departments continued to increase.
 Laboratory surveillance ? the total number of influenza isolations increased again this week
with the proportion of respiratory samples positive for influenza higher at 21.0%.
Influenza A strains were predominant.
 Community surveillance ? influenza notifications increased in metropolitan local health
districts (LHD). General Practice ILI activity decreased slightly. Seven aged care facilities
reported influenza outbreaks.
 Deaths with pneumonia or influenza reported on the death certificate - The NSW Registry of
Births, Deaths, and Marriages have recorded 16 deaths in association with influenza in 2017.
The rate of deaths classified as ?pneumonia and influenza? remained low.
 National and international influenza surveillance ? influenza activity is increasing in most
of the southern and central regions of Australia. Activity is sporadic and stable in northern
parts of the country.
 Recommended composition of 2017 influenza vaccines ? the 2017 Australian influenza
vaccines cover two A and two B strains, including one A strain change from the 2016
influenza vaccines.

NSW.png

For more information: NSW Health

*Queensland
Statewide Weekly Influenza
Surveillance Report

Reporting Period: 1 January to 9 July 2017
Queensland.png

For more information: Queensland Health

*South Australia
2 July to 8 July 2017
The influenza season has started and we advise everyone (≥6 months of age) not vaccinated against
influenza this year to get vaccinated as soon as possible.

Six hundred and nine cases of influenza were reported this week with 502 cases being characterised
as influenza A and 107 as influenza B. Cases comprised of 287 males and 322 females, with a
median age of 28 years. There have been 3,295 cases
The influenza chart shows recent influenza activity in South Australia.

For more information: SA Health

*Tasmania

FluTas 2017 Report 02

This surveillance report describes influenza activity in Tasmania during May 2017.

May 2017 update

The 2017 influenza season has not begun.

Flu activity during May remained well below winter influenza levels.

During May the majority of notifications were for Influenza A: there were 29 notifications of influenza A and 7 of Influenza B.

Surveillance of community influenza-like illness continued to indicate low activity.

There were 36 notifications of laboratory-confirmed influenza during May 2017 (Table 1). This was higher than the five-year May average (16 notifications) though still within inter-seasonal levels (Figure 1). Residents from the Southern region accounted for the largest proportion of notifications during May (49 per cent).

For more information: DHHS Tasmania

Victoria
Report No. 9: Week ending 2 July 2017
Overview: The 2017 influenza season so far
Influenza surveillance systems are at average levels. ILI rates are above baseline at average levels.
The number of notified laboratory confirmed influenza cases for the year to 2 July is 81% higher than at the same
time in 2016. There has been an increase in notifications in the last couple of weeks for both influenza A and B.
Most notified cases year-to-date have been type A (78%).
Twenty swabs were received this week, of which five were positive for influenza; one influenza (H1), two
Influenza A untyped and two influenza B, but picornavirus is the most commonly detected respiratory virus so
far in 2017.
This year we are encouraging GPs to swab all ILI patients (where possible) and ensure all ILI patients are recorded
on the tally sheet.
Final stage testing of the new database is now underway, and will hopefully be rolled out in several weeks.

For more information: Victorian Infectious Diseases Reference Laboratory

*Western Australia
WEEK ENDING 2ND JULY 2017
KEY POINTS
INFLUENZA AND INFLUENZA-LIKE ILLNESSES (ILI)
Summary: ILI activity increased this week, however influenza notifications have dipped below the seasonal
threshold, and non-influenza respiratory virus activity is relatively low for this time of year.
 Influenza notifications fell below the seasonal threshold level Currently, A/H1N1 and A/H3N2 sub-types
are co-circulating, with lesser amounts of influenza B virus.
 Influenza percent positivity remains relatively low for this time of year.
 ILI presentations at sentinel GPs and particularly at EDs increased this week.
 Influenza-related hospitalisations are below average levels for this time of the year, with influenza A
viruses predominant.
 Cumulative non-influenza respiratory virus activity decreased this week, and is relatively low for this time
of year.

For more information: Virus WAtch

*Nationally

For the period to Jan 1- July 15, 2017.

NNDSS.png

For national data: National Notifiable Diseases Surveillance System

Australian Sentinel Practices Research Network (ASPREN)

No. 11, 2017
22 May - 4 June, 2017

SYNDROMIC SURVEILLANCE
REPORTING
Reports were received from 274 reporters
from 8 states and territories during the
reporting period. This includes data from
GPs reporting to VicSPIN. During weeks 21
and 22 ASPREN reporters saw a total of
35,230 patients.

INFLUENZA-LIKE-ILLNESS (ILI)
Nationally, ILI notifications increased over the period with 148
notifications being reported in weeks 21?22. ILI rates
reported in this period remained steady at 4 cases per 1000
consultations for both weeks 21 and 22. This was the same
rates as seen in the previous fortnight. For the same reporting
period in 2016, ILI rates were higher at 5 and 7 cases per
1000 consultations for weeks 21 and 22 respectively (see Fig.
5). On a state-by-state basis, it is important to note the
elevated ILI rate in urban NSW (see Fig. 2).

For more information: ASPREN

*
Flu Tracking

Week ending 09 July 2017
Low levels of influenza-like illness activity

This survey was sent on Monday, 10 July 2017 at 01:13 AM and by 09:00 AM, Thursday 13 July we had received
23675 responses (23779 last week) from 14455 people responding for themselves and 9220 household members
across Australia.

Across Australia, fever and cough was reported by 2.0% of
vaccinated participants and 2.5% of unvaccinated
participants. Fever, cough and absence from normal duties
was reported by 1.2% of vaccinated participants and 1.6%
of unvaccinated participants.

For participants this week, 14689/23675 (62.0 %) have
received the seasonal vaccine so far. Of the 4417
participants who identified as working face-to-face with
patients, 3542 (80.2%) have received the vaccine.

For more information: Flu Tracking


Australian influenza report 2017 - Current report:
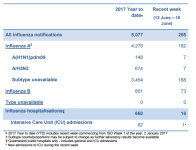
Australian Influenza Surveillance Report No 03 - 10 June to 23 June 2017
Summary
Influenza activity is increasing in most of the southern and central regions of Australia while sporadic and stable in the northern regions of the country.
While testing for influenza has increased over the reporting fortnight, respiratory viruses other than influenza, in particular rhinovirus, were most commonly detected by sentinel laboratories.
Nationally, notifications of laboratory confirmed influenza B viruses have continued to increase over the reporting fortnight, however influenza A(H1N1)pdm09 and influenza A(H3N2) are also co-circulating in some parts of the country.
Influenza-like illness (ILI) in the community was low and relatively stable this reporting fortnight, while ILI presentations to sentinel GPs were also low, but increasing.
To date, the seasonal influenza vaccines appear to be a good match for circulating virus strains

For more information: Department of Health
 
Updates marked with a *

*New South Wales


Week 28: 10 to 16 July, 2017
Summary:
 Surveillance data indicates a continued rise in activity over the last week and it is
expected to continue to rise throughout July.
 The impact of influenza on the health sector continues to increase.
 Influenza A strains are predominating, particularly the A(H3N2) strain.
In this reporting week:
 Hospital surveillance ? influenza-like illness (ILI) presentations to selected emergency
departments continued to increase.
 Laboratory surveillance ? the total number of influenza isolations increased again this week
with the proportion of respiratory samples positive for influenza higher at 25.4%.
Influenza A strains were predominant.
 Community surveillance ? influenza notifications increased in metropolitan local health
districts (LHD). General Practice ILI activity decreased slightly. Eighteen institutions,
including fifteen aged care facilities, reported influenza outbreaks.
 National and international influenza surveillance ? influenza activity is increasing in the
majority of Australian jurisdictions, while remaining stable and sporadic in the rural south
and northern regions of Western Australia, the Northern Territory and the tropical region of
Queensland.
 Recommended composition of 2017 influenza vaccines ? the 2017 Australian influenza
vaccines cover two A and two B strains, including one A strain change from the 2016
influenza vaccines.

NSW.png

For more information: NSW Health

*Queensland
Statewide Weekly Influenza
Surveillance Report

Reporting Period: 1 January to 16 July 2017
Queensland.png

For more information: Queensland Health

*South Australia
9 July to 15 July 2017
The influenza season has started and we advise everyone (≥6 months of age) not vaccinated against
influenza this year to get vaccinated as soon as possible.

Six hundred and eighty eight cases of influenza were reported this week with 572 cases being
characterised as influenza A and 116 as influenza B. Cases comprised of 303 males and 385
females, with a median age of 33 years. There have been 3,984 cases of influenza notified year-todate,
compared with 1,022 cases reported for the same period last year.
The influenza chart shows recent influenza activity in South Australia.

For more information: SA Health

Tasmania

FluTas 2017 Report 02

This surveillance report describes influenza activity in Tasmania during May 2017.

May 2017 update

The 2017 influenza season has not begun.

Flu activity during May remained well below winter influenza levels.

During May the majority of notifications were for Influenza A: there were 29 notifications of influenza A and 7 of Influenza B.

Surveillance of community influenza-like illness continued to indicate low activity.

There were 36 notifications of laboratory-confirmed influenza during May 2017 (Table 1). This was higher than the five-year May average (16 notifications) though still within inter-seasonal levels (Figure 1). Residents from the Southern region accounted for the largest proportion of notifications during May (49 per cent).

For more information: DHHS Tasmania

*Victoria
Report No. 10: Week ending 9 July 2017
Overview: The 2017 influenza season so far
Influenza surveillance systems are at average levels. ILI rates are above baseline at average levels.
The number of notified laboratory confirmed influenza cases for the year to 9 July is 94% higher than at the same
time in 2016. The increase in cases to mark the start of the season has occurred earlier this year (late June)
compared to last year (early August). There has been an increase in notifications in the last couple of weeks for
both influenza A and B. Most notified cases year-to-date have been type A (70%).
Sixteen swabs were received this week, of which eight (50%) were positive for influenza (H3), but picornavirus is
the most commonly detected respiratory virus so far in 2017.
This year we are encouraging GPs to swab all ILI patients (where possible) and ensure all ILI patients are recorded
on the tally sheet.
Final stage testing of the new database is now underway, and will hopefully be rolled out in several weeks.


For more information: Victorian Infectious Diseases Reference Laboratory

*Western Australia
WEEK ENDING 9TH JULY 2017
KEY POINTS
INFLUENZA AND INFLUENZA-LIKE ILLNESSES (ILI)
Summary: Indicators of ILI and influenza activity, including hospitalisations and laboratory percent positivity,
increased this week, although levels remain relatively low for this time of the year.
? Influenza notifications have remained relatively static just above the seasonal threshold for the past three
weeks, but these recent data are unreliable, pending correction of an issue with laboratory reporting.
Currently, A/H1N1 and A/H3N2 sub-types are co-circulating, with lesser amounts of influenza B virus.
? Influenza percent positivity increased this week, but remains relatively low for this time of year.
? ILI presentations at sentinel GPs increased this week, while ED presentations decreased.
? Influenza-related hospitalisations increased sharply this week; primarily attributable to influenza A/H3N2
virus.
? Non-influenza respiratory virus activity increased this week, driven by respiratory syncytial virus.

For more information: Virus WAtch

*Nationally

For the period to Jan 1- July 22, 2017.

NNDSS.png

For national data: National Notifiable Diseases Surveillance System

*Australian Sentinel Practices Research Network (ASPREN)

No. 13, 2017
19 June - 2 July, 2017

SYNDROMIC SURVEILLANCE
REPORTING
Reports were received from 260 reporters
from 8 states and territories during the
reporting period. This includes data from
GPs reporting to VicSPIN. During weeks 25
and 26 ASPREN reporters saw a total of
34,547 patients.

INFLUENZA-LIKE-ILLNESS (ILI)
Nationally, ILI notifications increased over the period with 212
notifications being reported in weeks 25?26. ILI rates
reported in this period increased to 6 cases per 1000
consultations (weighted) in week 25 and 8 cases per 1000
consultations (weighted) for week 26. This was higher than the
rates seen in the previous fortnight where rates were 5 cases
per 1000 consultations. For the same reporting period in
2016, ILI rates were similar at 6 and 7 cases per 1000
consultations for weeks 25 and 26 respectively (see Fig. 5).
On a state-by-state basis, it is important to note increasing
rates in urban NSW, urban and rural Tasmania and rural SA
(see Fig. 2).

For more information: ASPREN

*
Flu Tracking

Week ending 16 July 2017
Low levels of influenza-like illness activity

This survey was sent on Monday, 17 July 2017 at 01:13 AM and by 09:00 AM, Thursday 20 July we had received 24194 responses (23839 last week) from 14648 people responding for themselves and 9546 household members across Australia.

Across Australia, fever and cough was reported by 2.1% of vaccinated participants and 2.4% of unvaccinated participants. Fever, cough and absence from normal duties was reported by 1.6% of vaccinated participants and 1.6% of unvaccinated participants.

For participants this week, 15004/24194 (62.0 %) have received the seasonal vaccine so far. Of the 4547 participants who identified as working face-to-face with patients, 3626 (79.7%) have received the vaccine

For more information: Flu Tracking


*Australian influenza report 2017 - Current report:
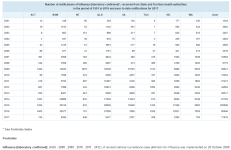
Australian Influenza Surveillance Report No 04 - 24 June to 07 July 2017
Summary
Influenza activity is increasing in the majority of Australian jurisdictions, while remaining stable and sporadic in the rural south and northern regions of Western Australia, the Northern Territory and the tropical region of Queensland.
Positive test results for influenza have increased significantly over the reporting fortnight, particularly in Victoria. Respiratory viruses other than influenza, in particular rhinovirus and RSV, were most commonly detected by sentinel laboratories.
Nationally, notifications of laboratory confirmed influenza B viruses have continued to increase over the reporting fortnight; however the proportion of total notifications has decreased. Influenza A(H1N1)pdm09 and influenza A(H3N2) are also co-circulating in some parts of the country.
Influenza-like illness (ILI) in the community increased slightly but remained low this reporting fortnight, while ILI presentations to sentinel GPs increased significantly.
To date, the seasonal influenza vaccines appear to be a good match for circulating virus strains.

Australia.png

For more information: Department of Health
 
Updates marked with a *

*New South Wales

Week 29: 17 to 23 July, 2017
Summary:
 Seasonal influenza activity continues to rise steadily after an early start.
Influenza activity is likely to remain high for the next few weeks
 Influenza A strains are predominating, particularly the A(H3N2) strain.
In this reporting week:
 Hospital surveillance ? influenza-like illness (ILI) presentations to selected emergency
departments continued to increase.
 Laboratory surveillance ? the total number of influenza isolations increased again this week
with the proportion of respiratory samples positive for influenza higher at 31.4%.
Influenza A strains were predominant.
 Community surveillance ? influenza notifications increased in metropolitan local health
districts (LHD). General Practice ILI activity increased slightly. Thirty-four institutions,
including twenty-nine aged care facilities, reported influenza outbreaks.
 National and international influenza surveillance ? influenza activity is increasing in the
majority of Australian jurisdictions, while remaining stable and sporadic in the rural south
and northern regions of Western Australia, the Northern Territory and the tropical region of
Queensland.
 Recommended composition of 2017 influenza vaccines ? the 2017 Australian influenza
vaccines cover two A
NSW.png

For more information: NSW Health

*Queensland
Statewide Weekly Influenza
Surveillance Report

Reporting Period: 1 January to 23 July 2017
Queensland.png

For more information: Queensland Health

South Australia
9 July to 15 July 2017
The influenza season has started and we advise everyone (≥6 months of age) not vaccinated against
influenza this year to get vaccinated as soon as possible.

Six hundred and eighty eight cases of influenza were reported this week with 572 cases being
characterised as influenza A and 116 as influenza B. Cases comprised of 303 males and 385
females, with a median age of 33 years. There have been 3,984 cases of influenza notified year-todate,
compared with 1,022 cases reported for the same period last year.
The influenza chart shows recent influenza activity in South Australia.

For more information: SA Health

Tasmania

FluTas 2017 Report 02

This surveillance report describes influenza activity in Tasmania during May 2017.

May 2017 update

The 2017 influenza season has not begun.

Flu activity during May remained well below winter influenza levels.

During May the majority of notifications were for Influenza A: there were 29 notifications of influenza A and 7 of Influenza B.

Surveillance of community influenza-like illness continued to indicate low activity.

There were 36 notifications of laboratory-confirmed influenza during May 2017 (Table 1). This was higher than the five-year May average (16 notifications) though still within inter-seasonal levels (Figure 1). Residents from the Southern region accounted for the largest proportion of notifications during May (49 per cent).

For more information: DHHS Tasmania

*Victoria
Report No. 12: Week ending 23 July 2017
Overview: The 2017 influenza season so far
Influenza surveillance systems are at average levels. ILI rates are at average seasonal levels.
The number of notified laboratory confirmed influenza cases for the year to 23 July is 147% higher than at the
same time in 2016. The increase in cases to mark the start of the season has occurred earlier this year (late June)
compared to last year (early August). There has been an increase in notifications in the last few of weeks for both
influenza A and B. Most notified cases year-to-date have been type A (78%).
Thirty six swabs were received this week, of which three were positive for influenza (H1), fourteen were positive
for influenza (H3) and two were positive for influenza B. Influenza is now the most commonly detected
respiratory virus from VicSPIN swabs so far this season.
This year we are encouraging GPs to swab all ILI patients (where possible) and ensure all ILI patients are recorded
on the tally sheet.
Final stage testing of the new database is now underway, and will hopefully be rolled out in a couple of weeks

For more information: Victorian Infectious Diseases Reference Laboratory

*Western Australia
WEEK ENDING 16TH JULY 2017
KEY POINTS
INFLUENZA AND INFLUENZA-LIKE ILLNESSES (ILI)
Summary: Indicators of influenza activity, including notifications, hospitalisations and laboratory percent
positivity, continued to increase this week.
 Influenza notifications are gradually trending upwards, above the seasonal threshold level. Influenza
A/H3N2 virus is currently predominant, this week comprising 61% of PathWest detections, followed by
A/H1N1 (26%) and influenza B (13%).
 Influenza percent positivity is now clearly trending upwards. ILI presentations at sentinel GPs decreased
this week, while ED presentations increased.
 Influenza-related hospitalisations are approaching average levels for this time of year; primarily
attributable to influenza A/H3N2 virus.
 RSV and overall non-influenza respiratory virus activity decreased this week, but overall is trending
upwards.

For more information: Virus WAtch

*Nationally

For the period to Jan 1- July 29, 2017.

NNDSS.png

For national data: National Notifiable Diseases Surveillance System

Australian Sentinel Practices Research Network (ASPREN)

No. 13, 2017
19 June - 2 July, 2017

SYNDROMIC SURVEILLANCE
REPORTING
Reports were received from 260 reporters
from 8 states and territories during the
reporting period. This includes data from
GPs reporting to VicSPIN. During weeks 25
and 26 ASPREN reporters saw a total of
34,547 patients.

INFLUENZA-LIKE-ILLNESS (ILI)
Nationally, ILI notifications increased over the period with 212
notifications being reported in weeks 25—26. ILI rates
reported in this period increased to 6 cases per 1000
consultations (weighted) in week 25 and 8 cases per 1000
consultations (weighted) for week 26. This was higher than the
rates seen in the previous fortnight where rates were 5 cases
per 1000 consultations. For the same reporting period in
2016, ILI rates were similar at 6 and 7 cases per 1000
consultations for weeks 25 and 26 respectively (see Fig. 5).
On a state-by-state basis, it is important to note increasing
rates in urban NSW, urban and rural Tasmania and rural SA
(see Fig. 2).

For more information: ASPREN

*
Flu Tracking

Week ending 23 July 2017
Low levels of influenza-like illness activity

This survey was sent on Monday, 24 July 2017 at 01:13 AM and by 09:00 AM, Thursday 27 July we had received 24616 responses (24390 last week) from 14829 people responding for themselves and 9787 household members across Australia.

Across Australia, fever and cough was reported by 1.9% of vaccinated participants and 2.5% of unvaccinated participants. Fever, cough and absence from normal duties was reported by 1.4% of vaccinated participants and 1.8% of unvaccinated participants.

For participants this week, 15285/24616 (62.1 %) have received the seasonal vaccine so far. Of the 4588 participants who identified as working face-to-face with patients, 3677 (80.1%) have received the vaccine.

For more information: Flu Tracking

Australian influenza report 2017 - Current report:
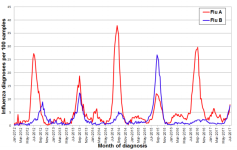
Australian Influenza Surveillance Report No 04 - 24 June to 07 July 2017
Summary
Influenza activity is increasing in the majority of Australian jurisdictions, while remaining stable and sporadic in the rural south and northern regions of Western Australia, the Northern Territory and the tropical region of Queensland.
Positive test results for influenza have increased significantly over the reporting fortnight, particularly in Victoria. Respiratory viruses other than influenza, in particular rhinovirus and RSV, were most commonly detected by sentinel laboratories.
Nationally, notifications of laboratory confirmed influenza B viruses have continued to increase over the reporting fortnight; however the proportion of total notifications has decreased. Influenza A(H1N1)pdm09 and influenza A(H3N2) are also co-circulating in some parts of the country.
Influenza-like illness (ILI) in the community increased slightly but remained low this reporting fortnight, while ILI presentations to sentinel GPs increased significantly.
To date, the seasonal influenza vaccines appear to be a good match for circulating virus strains.

For more information: Department of Health
 
Updates marked with a *

*New South Wales

Week 30: 24 to 30 July, 2017
Summary:
? Seasonal influenza activity rose further this week and is nearing its peak.
Influenza activity is expected to remain high for the next few weeks
? Influenza A strains are predominating, particularly the A(H3N2) strain.
In this reporting week:
? Hospital surveillance ? influenza-like illness (ILI) presentations to selected emergency
departments continued to increase. Admissions for pneumonia were also high.
? Laboratory surveillance ? the total number of influenza isolations increased again this week
with the proportion of respiratory samples positive for influenza higher at 37.7%.
Influenza A strains were predominant.
? Community surveillance ? influenza notifications increased in metropolitan local health
districts (LHD) and General Practice ILI activity was increased. Forty-six institutions,
including 43 aged care facilities, reported influenza outbreaks.
? National and international influenza surveillance ? influenza activity at the national level
continued to increase this reporting fortnight indicating that the season is underway in a
majority of regions across Australia.
? Recommended composition of 2017 influenza vaccines ? the 2017 Australian influenza
vaccines cover two A and two B strains, including one A strain change from the 2016
influenza vaccines.
NSW.png

For more information: NSW Health

*Queensland
Statewide Weekly Influenza
Surveillance Report

Reporting Period: 1 January to 30 July 2017
Queensland.png

For more information: Queensland Health

*South Australia
16 July to 22 July 2017
The influenza season has started and we advise everyone (≥6 months of age) not vaccinated against
influenza this year to get vaccinated as soon as possible

Six hundred and forty eight cases of influenza were reported this week with 518 cases being
characterised as influenza A and 130 as influenza B. Cases comprised of 285 males and 363
females, with a median age of 41 years. There have been 4,633 cases of influenza notified year-todate,
compared with 1,109 cases reported for the same period last year.

The influenza chart shows recent influenza activity in South Australia.

For more information: SA Health

*Tasmania

FluTas 2017 Report 3

Public Health Services produce the fluTAS Report to provide information about the level of influenza (flu) in Tasmania. Multiple surveillance data sources are used to obtain measures of influenza activity in the community.
This surveillance report describes influenza activity in Tasmania during June 2017.

June 2017 update

The 2017 influenza season has not begun.
Overall flu activity at the end of June was still at a pre-seasonal level. However, the number of notifications increased in June.
During June the proportion of notifications due to Influenza B increased; there were 35 notifications of influenza A and 28 of Influenza B.
Surveillance of community influenza-like illness continued to indicate low activity.
Influenza Notifications

There were 63 notifications of laboratory-confirmed influenza during June 2017 (Table 1). This was higher than the five-year June average of 39 notifications. Notifications increased during this period. However, at the end of June were still considered at a pre-seasonal level (Figure 1). Residents from the Southern region accounted for the largest proportion of notifications during June (56 per cent).

For more information: DHHS Tasmania

Victoria
Report No. 12: Week ending 23 July 2017
Overview: The 2017 influenza season so far
Influenza surveillance systems are at average levels. ILI rates are at average seasonal levels.
The number of notified laboratory confirmed influenza cases for the year to 23 July is 147% higher than at the
same time in 2016. The increase in cases to mark the start of the season has occurred earlier this year (late June)
compared to last year (early August). There has been an increase in notifications in the last few of weeks for both
influenza A and B. Most notified cases year-to-date have been type A (78%).
Thirty six swabs were received this week, of which three were positive for influenza (H1), fourteen were positive
for influenza (H3) and two were positive for influenza B. Influenza is now the most commonly detected
respiratory virus from VicSPIN swabs so far this season.
This year we are encouraging GPs to swab all ILI patients (where possible) and ensure all ILI patients are recorded
on the tally sheet.
Final stage testing of the new database is now underway, and will hopefully be rolled out in a couple of weeks

For more information: Victorian Infectious Diseases Reference Laboratory

*Western Australia
WEEK ENDING 23RD JULY 2017
KEY POINTS
INFLUENZA AND INFLUENZA-LIKE ILLNESSES (ILI)
Summary: While the overall trend remains upward, direct indicators of influenza activity, including notifications,
hospitalisations and laboratory percent positivity, increased only marginally this week. RSV activity appears to be
decreasing.
 Influenza notifications and percent positivity are gradually trending upwards. Influenza A/H3N2 virus is
currently predominant, this week comprising 71% of PathWest detections, followed by A/H1N1 (17%) and
influenza B (12%).
 ILI presentations at sentinel GPs increased sharply this week; conversely, ED presentations decreased.
 Influenza-related hospitalisations are below average levels for this time of year; primarily attributable to
influenza A/H3N2 virus.
 RSV and overall non-influenza respiratory virus activity has decreased over the past fortnight.

For more information: Virus WAtch

*Nationally

For the period to Jan 1- Aug 5, 2017.
NNDSS.png

For national data: National Notifiable Diseases Surveillance System

*Australian Sentinel Practices Research Network (ASPREN)

No. 14, 2017
3 July - 16 July, 2017

SYNDROMIC SURVEILLANCE
REPORTING
Reports were received from 282 reporters
from 8 states and territories during the
reporting period. This includes data from
GPs reporting to VicSPIN. During weeks 27
and 28 ASPREN reporters saw a total of
38,914 patients

INFLUENZA-LIKE-ILLNESS (ILI)
Nationally, ILI notifications increased over the period with 337
notifications being reported in weeks 27?28. ILI rates
reported in this period increased to 10 cases per 1000
consultations (weighted) in week 27 and 8 cases per 1000
consultations (weighted) for week 28. This was higher than the
rates seen in the previous fortnight where rates were 6 and 8
cases per 1000 consultations. For the same reporting period
in 2016, ILI rates were similar at 8 cases per 1000
consultations for weeks 27 and 28 respectively (see Fig. 5).
On a state-by-state basis, it is important to note increasing
rates in Remote NSW and rural SA (see Fig. 2).

For more information: ASPREN

*
Flu Tracking

Week ending 30 July 2017
Moderate levels of influenza-like illness activity

This survey was sent on Monday, 31 July 2017 at 01:13 AM and by 09:00 AM, Thursday 03 August we had received 24682 responses (24805 last week) from 14888 people responding for themselves and 9794 household members across Australia.

Across Australia, fever and cough was reported by 2.3% of vaccinated participants and 2.9% of unvaccinated participants. Fever, cough and absence from normal duties was reported by 1.8% of vaccinated participants and 2.0% of unvaccinated participants.

For participants this week, 15357/24682 (62.2 %) have received the seasonal vaccine so far. Of the 4614 participants who identified as working face-to-face with patients, 3708 (80.4%) have received the vaccine.

For more information: Flu Tracking

*Australian influenza report 2017 - Current report:
AUSTRALIAN INFLUENZA
SURVEILLANCE REPORT
No. 5, 2017
Reporting period 8 ? 21 July 2017

KEY MESSAGES
 Influenza activity at the national level continued to increase this reporting fortnight indicating that the
season is underway in a majority of regions across Australia. This increase in activity occurred
approximately one month earlier than in 2016.
 Influenza was detected at increasing levels by the majority of sentinel laboratories this reporting fortnight.
For the first time since reporting for 2017 began, influenza A was the most common respiratory virus
detected by a majority of sentinel laboratories, followed by respiratory syncytial virus (RSV).
 Influenza A(H3N2) is currently the predominant circulating A subtype in the majority of jurisdictions.
Nationally, notifications of laboratory confirmed influenza B viruses reached a plateau this reporting
fortnight.
 Notification rates this year to date have been highest in adults aged 85 years or older, with a secondary
peak in young children, aged less than 10 years.
 Influenza‐like illness (ILI) in the community and ILI presentations to sentinel GPs this fortnight continued
the overall increasing trend, however remain within the range of recent seasons.
 Hospitalisations with confirmed influenza have increased in recent weeks in line with the seasonal increase
in community level activity.
 To date, the seasonal influenza vaccines appear to be a good match for circulating virus strains
...
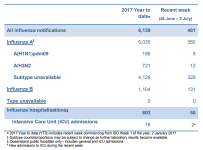
Nationally Notified Influenza Associated Deaths
So far in 2017, 27 influenza associated deaths have been notified to the NNDSS. The majority of deaths were
due to influenza A (78%, n = 21). The median age of deaths notified was 75 years (range 13 to 97 years). The
number of influenza associated deaths reported to the NNDSS is reliant on the follow up of cases to determine
the outcome of their infection and most likely does not represent the true mortality associated with this
disease.

Australia.png

For more information: Department of Health
 
Updates marked with a *

*New South Wales
Week 32: 7 to 13 August, 2017
Summary:
? Seasonal influenza activity rose only slightly this week, consistent with the peak of
the influenza season. Activity is expected to remain high for the next few weeks.
? Influenza A strains are predominating, but influenza B strains increased.
In this reporting week:
? Hospital surveillance ? influenza-like illness (ILI) presentations to selected emergency
departments continued to increase. Admissions for pneumonia remain high.
? Laboratory surveillance ? the total number of influenza isolations increased again this week
with the proportion of respiratory samples positive for influenza higher at 49.3%.
Influenza A strains remain predominant.
? Community surveillance ? influenza notifications increased in all local health districts
(LHD), and community ILI indicators were notably increased. Sixty-four institutions,
including 58 aged care facilities, reported new influenza outbreaks.
? National and international influenza surveillance ? influenza activity at the national level
continued to increase this reporting fortnight with many surveillance systems at levels
comparable to the peak of the 2016 season. High levels of influenza activity in the
community are likely to continue for the next few weeks.
? Recommended composition of 2017 influenza vaccines ? the 2017 Australian influenza
vaccines cover two A and two B strains, including one A strain change from the 2016
influenza vaccines.
NSW.png


For more information: NSW Health

*Queensland
Statewide Weekly Influenza
Surveillance Report

Reporting Period: 1 January to 13 August 2017
Queensland.png

For more information: Queensland Health

*South Australia
6 August to 12 August 2017
The influenza season has started and we advise everyone (≥6 months of age) not vaccinated against
influenza this year to get vaccinated as soon as possible.

One thousand, one hundred and nine cases of influenza were reported this week with 835 cases
being characterised as influenza A and 274 as influenza B. Cases comprised of 510 males and 599
females, with a median age of 31 years. There have been 7,313 cases of influenza notified year-todate,
compared with 1,512 cases reported for the same period last year.

The influenza chart shows recent influenza activity in South Australia.

For more information: SA Health

Tasmania

FluTas 2017 Report 3

Public Health Services produce the fluTAS Report to provide information about the level of influenza (flu) in Tasmania. Multiple surveillance data sources are used to obtain measures of influenza activity in the community.
This surveillance report describes influenza activity in Tasmania during June 2017.

June 2017 update

The 2017 influenza season has not begun.
Overall flu activity at the end of June was still at a pre-seasonal level. However, the number of notifications increased in June.
During June the proportion of notifications due to Influenza B increased; there were 35 notifications of influenza A and 28 of Influenza B.
Surveillance of community influenza-like illness continued to indicate low activity.
Influenza Notifications

There were 63 notifications of laboratory-confirmed influenza during June 2017 (Table 1). This was higher than the five-year June average of 39 notifications. Notifications increased during this period. However, at the end of June were still considered at a pre-seasonal level (Figure 1). Residents from the Southern region accounted for the largest proportion of notifications during June (56 per cent).

For more information: DHHS Tasmania

*Victoria
Report No. 15: Week ending 13 August 2017
Overview: The 2017 influenza season so far
Influenza surveillance systems are at average levels. ILI rates are at average seasonal levels.
The number of notified laboratory confirmed influenza cases for the year to 13 August is 160% higher than at the
same time in 2016. The increase in cases to mark the start of the season occurred earlier this year (late June)
compared to last year (early August), and in the last few weeks the number of notifications has been higher than
in the previous year. Most notified cases year-to-date have been type A (80%).
Twenty nine swabs were received this week, of which nine were positive for influenza (H3), two were positive for
influenza A(H1), two were influenza A untyped and three was positive for influenza B. Influenza is the most
commonly detected respiratory virus from VicSPIN swabs so far this season.
This year we are encouraging GPs to swab all ILI patients (where possible) and ensure all ILI patients are recorded
on the tally sheet.
The new database will be rolled out in the next week.

For more information: Victorian Infectious Diseases Reference Laboratory

*Western Australia
WEEK ENDING 6TH AUGUST 2017
KEY POINTS
INFLUENZA AND INFLUENZA-LIKE ILLNESSES (ILI)
Summary: Seasonal influenza indicators including notifications, percent positivity and hospitalisations remain
relatively low for this time of year.
 Influenza notifications and PathWest laboratory detections declined this week. Influenza A/H3N2 virus is
currently predominant, comprising 86% of PathWest detections.
 ILI presentations at sentinel GPs and EDs increased slightly this week.
 Influenza-related hospitalisations are below average levels for this time of year; reported hospitalisations
are primarily attributable to influenza A/H3N2 virus.
 While overall non-influenza respiratory virus activity decreased, RSV detections increased this week.

For more information: Virus WAtch

*Nationally

For the period to Jan 1- Aug 9, 2017.
NNDSS.png


For national data: National Notifiable Diseases Surveillance System

Australian Sentinel Practices Research Network (ASPREN)

No. 14, 2017
3 July - 16 July, 2017

SYNDROMIC SURVEILLANCE
REPORTING
Reports were received from 282 reporters
from 8 states and territories during the
reporting period. This includes data from
GPs reporting to VicSPIN. During weeks 27
and 28 ASPREN reporters saw a total of
38,914 patients

INFLUENZA-LIKE-ILLNESS (ILI)
Nationally, ILI notifications increased over the period with 337
notifications being reported in weeks 27—28. ILI rates
reported in this period increased to 10 cases per 1000
consultations (weighted) in week 27 and 8 cases per 1000
consultations (weighted) for week 28. This was higher than the
rates seen in the previous fortnight where rates were 6 and 8
cases per 1000 consultations. For the same reporting period
in 2016, ILI rates were similar at 8 cases per 1000
consultations for weeks 27 and 28 respectively (see Fig. 5).
On a state-by-state basis, it is important to note increasing
rates in Remote NSW and rural SA (see Fig. 2).

For more information: ASPREN

*
Flu Tracking

Week ending 13 August 2017
Moderate levels of influenza-like illness activity

This survey was sent on Monday, 14 August 2017 at 01:13 AM and by 09:00 AM, Thursday 17 August we had received 25381 responses (25427 last week) from 15180 people responding for themselves and 10201 household members across Australia.

Across Australia, fever and cough was reported by 2.9% of vaccinated participants and 4.0% of unvaccinated participants. Fever, cough and absence from normal duties was reported by 2.2% of vaccinated participants and 3.3% of unvaccinated participants.

For participants this week, 15760/25381 (62.1 %) have received the seasonal vaccine so far. Of the 4699 participants who identified as working face-to-face with patients, 3791 (80.7%) have received the vaccine.

For more information: Flu Tracking

Australian influenza report 2017 - Current report:
AUSTRALIAN INFLUENZA
SURVEILLANCE REPORT
No. 5, 2017
Reporting period 8 – 21 July 2017

KEY MESSAGES
 Influenza activity at the national level continued to increase this reporting fortnight indicating that the
season is underway in a majority of regions across Australia. This increase in activity occurred
approximately one month earlier than in 2016.
 Influenza was detected at increasing levels by the majority of sentinel laboratories this reporting fortnight.
For the first time since reporting for 2017 began, influenza A was the most common respiratory virus
detected by a majority of sentinel laboratories, followed by respiratory syncytial virus (RSV).
 Influenza A(H3N2) is currently the predominant circulating A subtype in the majority of jurisdictions.
Nationally, notifications of laboratory confirmed influenza B viruses reached a plateau this reporting
fortnight.
 Notification rates this year to date have been highest in adults aged 85 years or older, with a secondary
peak in young children, aged less than 10 years.
 Influenza‐like illness (ILI) in the community and ILI presentations to sentinel GPs this fortnight continued
the overall increasing trend, however remain within the range of recent seasons.
 Hospitalisations with confirmed influenza have increased in recent weeks in line with the seasonal increase
in community level activity.
 To date, the seasonal influenza vaccines appear to be a good match for circulating virus strains
...
Nationally Notified Influenza Associated Deaths
So far in 2017, 27 influenza associated deaths have been notified to the NNDSS. The majority of deaths were
due to influenza A (78%, n = 21). The median age of deaths notified was 75 years (range 13 to 97 years). The
number of influenza associated deaths reported to the NNDSS is reliant on the follow up of cases to determine
the outcome of their infection and most likely does not represent the true mortality associated with this
disease.


For more information: Department of Health
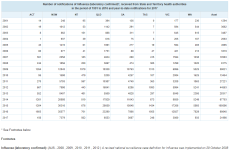
 
Updates marked with a *

*New South Wales


Week 33: 14 to 20 August, 2017
Summary:
 Seasonal influenza activity remains high overall, with declines noted in some
surveillance indicators. Activity is expected to remain high for the next few weeks.
 Influenza B activity increased but influenza A strains remained predominant overall.
In this reporting week:
 Hospital surveillance ? influenza-like illness (ILI) presentations to selected emergency
departments continued to be high; the index of increase peaked on 11 August.
 Laboratory surveillance ? the total number of influenza isolations increased again this week
with the proportion of respiratory samples positive for influenza slightly higher at 50.5%.
The influenza A rate fell slightly while the influenza B rate was increased.
 Community surveillance ? influenza notifications increased overall but fell in some local
health districts (LHD) in Sydney. New influenza outbreaks were reported in 82
institutions, including 72 residential aged care facilities.
 National and international influenza surveillance ? influenza activity at the national level
continued to increase this reporting fortnight with many jurisdictions reporting activity at
levels comparable to the peak of the 2016 season.
 Recommended composition of 2017 influenza vaccines ? the 2017 Australian influenza
vaccines cover two A and two B strains, including one A strain change from the 2016
influenza vaccines.

NSW.png

For more information: NSW Health

*Queensland
Statewide Weekly Influenza
Surveillance Report

Reporting Period: 1 January to 20 August 2017
Queensland.png

For more information: Queensland Health

South Australia
6 August to 12 August 2017
The influenza season has started and we advise everyone (≥6 months of age) not vaccinated against
influenza this year to get vaccinated as soon as possible.

One thousand, one hundred and nine cases of influenza were reported this week with 835 cases
being characterised as influenza A and 274 as influenza B. Cases comprised of 510 males and 599
females, with a median age of 31 years. There have been 7,313 cases of influenza notified year-todate,
compared with 1,512 cases reported for the same period last year.

The influenza chart shows recent influenza activity in South Australia.

For more information: SA Health

Tasmania

FluTas 2017 Report 3

Public Health Services produce the fluTAS Report to provide information about the level of influenza (flu) in Tasmania. Multiple surveillance data sources are used to obtain measures of influenza activity in the community.
This surveillance report describes influenza activity in Tasmania during June 2017.

June 2017 update

The 2017 influenza season has not begun.
Overall flu activity at the end of June was still at a pre-seasonal level. However, the number of notifications increased in June.
During June the proportion of notifications due to Influenza B increased; there were 35 notifications of influenza A and 28 of Influenza B.
Surveillance of community influenza-like illness continued to indicate low activity.
Influenza Notifications

There were 63 notifications of laboratory-confirmed influenza during June 2017 (Table 1). This was higher than the five-year June average of 39 notifications. Notifications increased during this period. However, at the end of June were still considered at a pre-seasonal level (Figure 1). Residents from the Southern region accounted for the largest proportion of notifications during June (56 per cent).

For more information: DHHS Tasmania

*Victoria
Report No. 16: Week ending 20 August 2017
Overview: The 2017 influenza season so far
Influenza surveillance systems are at average to above average levels.
The number of notified laboratory confirmed influenza cases for the year to 20 August is 131% higher than at the
same time in 2016. The increase in cases to mark the start of the season occurred earlier this year (late June)
compared to last year (early August), and in the last few weeks the number of notifications has been higher than
in the previous year. Most notified cases year-to-date have been type A (80%).
Fifty four swabs were received this week, of which thirty were positive: thirteen were positive for influenza (H3),
one was positive for influenza A(H1), and sixteen were positive for influenza B. Influenza is the most commonly
detected respiratory virus from VicSPIN swabs so far this season.
This year we are encouraging GPs to swab all ILI patients (where possible) and ensure all ILI patients are recorded
on the tally sheet.
The new database has been rolled out at www.vicspin.com.au. We have sent login details to all practices and
would encourage all GP?s to use the database for data entry. Please contact us with any feedback.

For more information: Victorian Infectious Diseases Reference Laboratory

*Western Australia
WEEK ENDING 13TH AUGUST 2017
KEY POINTS
INFLUENZA AND INFLUENZA-LIKE ILLNESSES (ILI)
Summary: Influenza notifications and percent positivity increased this week, although levels remain relatively low
for this time of year. Hospitalisations remain steady and lower than the seasonal average.
 ILI presentations at sentinel EDs increased sharply this week, while presentations to sentinel GPs
declined.
 PathWest laboratory detections have plateaued over recent weeks; influenza A/H3N2 virus is currently
predominant, comprising 72% of PathWest detections.
 Influenza-related hospitalisations are below average levels for this time of year; reported hospitalisations
are primarily attributable to influenza A/H3N2 virus.
 Overall non-influenza respiratory virus activity decreased.

For more information: Virus WAtch

*Nationally

For the period to Jan 1- Aug 26, 2017.

NNDSS.png


For national data: National Notifiable Diseases Surveillance System

Australian Sentinel Practices Research Network (ASPREN)

No. 14, 2017
3 July - 16 July, 2017

SYNDROMIC SURVEILLANCE
REPORTING
Reports were received from 282 reporters
from 8 states and territories during the
reporting period. This includes data from
GPs reporting to VicSPIN. During weeks 27
and 28 ASPREN reporters saw a total of
38,914 patients

INFLUENZA-LIKE-ILLNESS (ILI)
Nationally, ILI notifications increased over the period with 337
notifications being reported in weeks 27?28. ILI rates
reported in this period increased to 10 cases per 1000
consultations (weighted) in week 27 and 8 cases per 1000
consultations (weighted) for week 28. This was higher than the
rates seen in the previous fortnight where rates were 6 and 8
cases per 1000 consultations. For the same reporting period
in 2016, ILI rates were similar at 8 cases per 1000
consultations for weeks 27 and 28 respectively (see Fig. 5).
On a state-by-state basis, it is important to note increasing
rates in Remote NSW and rural SA (see Fig. 2).

For more information: ASPREN

*
Flu Tracking

Week ending 20 August 2017
Moderate levels of influenza-like illness activity

This survey was sent on Monday, 21 August 2017 at 01:13 AM and by 09:00 AM, Thursday 24 August we had received 25496 responses (25595 last week) from 15245 people responding for themselves and 10251 household members across Australia.

Across Australia, fever and cough was reported by 3.1% of vaccinated participants and 4.1% of unvaccinated participants. Fever, cough and absence from normal duties was reported by 2.3% of vaccinated participants and 3.4% of unvaccinated participants.

For participants this week, 15866/25496 (62.2 %) have received the seasonal vaccine so far. Of the 4720 participants who identified as working face-to-face with patients, 3794 (80.4%) have received the vaccine.

FluTracking.png

For more information: Flu Tracking

*Australian influenza report 2017 - Current report:
Australian Influenza Surveillance Report No 06 - 22 July to 04 August 2017
Summary
Influenza activity at the national level continued to increase this reporting fortnight with many surveillance systems at levels comparable to the peak of the 2016 season.
High levels of influenza activity in the community are likely to continue for the next few weeks.
There has been almost two and a half times the number of laboratory confirmed notifications of influenza reported to the National Notifiable Diseases Surveillance System this year when compared with the same period last year. An earlier season onset and introduction of rapid testing have contributed, in part, to this increase.
Influenza-like illness (ILI) is increasing nationally. Influenza was the most common cause of ILI presentations to sentinel general practitioners this fortnight, with almost half of all patients presenting to sentinel general practitioners with ILI and tested were positive for influenza.
Influenza A(H3N2) is currently the predominant circulating virus nationally, however influenza B viruses also continue to circulate.
Notification rates this year to date have been highest in adults aged 85 years or older, with a secondary peak in young children, aged 5 to 9 years.
Hospitalisations with confirmed influenza have increased overall this reporting fortnight, but have declined in the most recent week.
Clinical severity for the season to date, as measured through the proportion of patients admitted directly to ICU and deaths attributed to pneumonia or influenza, is low.
To date, based on antigenic characterisation of circulating influenza viruses, the seasonal influenza vaccines appear to be a moderate to good match for circulating virus strains, depending on the strain. Vaccine effectiveness estimates, which provide an indication of how well the vaccine provides protection against influenza, are only available towards the end of the influenza season.
...
Nationally Notified Influenza Associated Deaths
So far in 2017, 43 influenza associated deaths have been notified to the NNDSS. The majority of deaths were
due to influenza A (81%, n = 35). The median age of deaths notified was 81 years (range 13 to 97 years). The
number of influenza associated deaths reported to the NNDSS is reliant on the follow up of cases to determine
the outcome of their infection and most likely does not represent the true mortality associated with this
disease.
...
Australia.png

For more information: Department of Health
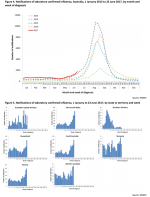
 
Updates marked with a *

*New South Wales
Week 34: 21 to 27 August, 2017
Summary:
? The influenza season has passed its peak but activity remains high. Activity is
expected to continue to decline throughout September.
? Influenza A strains remain predominant but are declining. Influenza B activity is steady.
In this reporting week:
? Hospital surveillance ? influenza-like illness (ILI) presentations to selected emergency
departments decreased for the first time this season. Overall activity remained high.
? Laboratory surveillance ? the total number of influenza isolations decreased for the first
time this season, and the influenza-positive test rate was lower at 45.7%. There was a
decrease in the proportion of influenza A fell while influenza B was steady.
? Community surveillance ? influenza notifications increased slightly overall but GP and
FluTracking surveillance both indicated declines in ILI activity. Influenza outbreaks in
institutions declined but there were still 48 outbreaks in residential aged care facilities.
? Deaths with pneumonia or influenza reported on the death certificate ? the NSW Registry of
Births, Deaths, and Marriages has recorded 69 deaths in association with influenza in 2017.
The rate of deaths classified as ?pneumonia and influenza? was increased overall.

? National and international influenza surveillance ? influenza activity at the national level
continued to increase this reporting fortnight with most jurisdictions reporting peak
seasonal activity levels, with notifications above the usual range.
? Recommended composition of 2017 influenza vaccines ? the 2017 Australian influenza
vaccines cover two A and two B strains, including one A strain change from the 2016
influenza vaccines.

NSW.png


For more information: NSW Health

*Queensland
Statewide Weekly Influenza
Surveillance Report

Reporting Period: 1 January to 27 August 2017 Queensland.png
Comparison to recent years:
2016: 110 hospitalizations in corresponding week and 1,517 YTD
2015 109/976
2014: 152/1,400
2013: 5/199

For more information: Queensland Health

*South Australia
20 August to 26 August 2017
The influenza season is underway but it is not too late to be vaccinated. We advise everyone (≥6
months of age) not vaccinated against influenza this year to get vaccinated as soon as possible.

One thousand, five hundred and thirty five cases of influenza were reported this week with 1,042
cases being characterised as influenza A and 493 as influenza B. Cases comprised of 705 males and
828 females, with a median age of 32 years. There have been 10,361 cases of influenza notified
year-to-date, compared with 2,149 cases reported for the same period last year. Influenza
notifications are higher than currently reported as not all influenza notifications have been entered into
the surveillance system


The influenza chart shows recent influenza activity in South Australia.

For more information: SA Health

*Tasmania

fluTAS 2017 Report 4

July 2017 update

The 2017 influenza season commenced at the end of June.
July was a period of increasing seasonal flu activity, being driven by both Influenza A (188 notifications) and Influenza B (131 notifications). Influenza A(H3N2) remains the most commonly detected subtype.
During July, influenza hospital admissions increased. Community influenza-like illness surveillance indicated low to early seasonal activity.
To date the 2017 influenza vaccine is a good match for circulating virus strains in Australia.

There were 319 notifications of laboratory-confirmed influenza during July 2017 (Table 1). This was greater than June 2017 (63 notifications) and the five-year July average of 184 notifications. Notifications since the start of 2017 indicate that the winter influenza season commenced in Tasmania towards the end of June, with July being a period of increasing seasonal activity. The commencement of the 2017 season is approximately one-month earlier than recent seasons (Figure 1).

There have been a total of 557 influenza notifications since the start of 2017.

For more information: DHHS Tasmania

*Victoria
Report No. 17: Week ending 27 August 2017
Overview: The 2017 influenza season so far
Influenza surveillance systems are at average to above average levels.
The number of notified laboratory confirmed influenza cases for the year to 27 August is higher than at the same
time in 2016. The increase in cases to mark the start of the season occurred earlier this year (late June) compared
to last year (early August), and in the last few weeks the number of notifications has been higher than in the
previous year. Most notified cases year-to-date have been type A (80%).
Fifty two swabs were received this week, of which nine were positive for influenza (H3), ten were positive for
influenza A(untyped), and seven were positive for influenza B. Influenza is the most commonly detected
respiratory virus from VicSPIN swabs so far this season.
This year we are encouraging GPs to swab all ILI patients (where possible) and ensure all ILI patients are recorded
on the tally sheet.
The new database has been rolled out at www.vicspin.com.au. We have sent login details to all practices and
would encourage all GP?s to use the database for data entry. Please contact us with any feedback.

For more information: Victorian Infectious Diseases Reference Laboratory

*Western Australia
WEEK ENDING 20TH AUGUST 2017
KEY POINTS
INFLUENZA AND INFLUENZA-LIKE ILLNESSES (ILI)
Summary: Influenza notifications and percent positivity are gradually trending upwards, although levels remain
relatively low for this time of year. Hospitalisations with influenza remain lower than the average of recent
seasons.
 ILI presentations at sentinel GPs increased slightly this week, while presentations to sentinel EDs fell
after experiencing a sharp increase last week.
 PathWest laboratory detections have increased gradually over recent weeks. Influenza A/H3N2 virus
remains predominant, comprising 59% of PathWest detections, but influenza A/H1N1 detections
increased this week (25%) and influenza B remains relatively steady (16%).
 Influenza-related hospitalisations are below average levels for this time of year; and are primarily
attributable to influenza A/H3N2 virus.
 RSV and overall non-influenza respiratory virus activity continues to decrease.

For more information: Virus WAtch

*Nationally

For the period to Jan 1- Sep 2, 2017.

NNDSS.png


For national data: National Notifiable Diseases Surveillance System

Australian Sentinel Practices Research Network (ASPREN)

No. 14, 2017
3 July - 16 July, 2017

SYNDROMIC SURVEILLANCE
REPORTING
Reports were received from 282 reporters
from 8 states and territories during the
reporting period. This includes data from
GPs reporting to VicSPIN. During weeks 27
and 28 ASPREN reporters saw a total of
38,914 patients

INFLUENZA-LIKE-ILLNESS (ILI)
Nationally, ILI notifications increased over the period with 337
notifications being reported in weeks 27—28. ILI rates
reported in this period increased to 10 cases per 1000
consultations (weighted) in week 27 and 8 cases per 1000
consultations (weighted) for week 28. This was higher than the
rates seen in the previous fortnight where rates were 6 and 8
cases per 1000 consultations. For the same reporting period
in 2016, ILI rates were similar at 8 cases per 1000
consultations for weeks 27 and 28 respectively (see Fig. 5).
On a state-by-state basis, it is important to note increasing
rates in Remote NSW and rural SA (see Fig. 2).

For more information: ASPREN

*
Flu Tracking

Week ending 27 August 2017
Moderate levels of influenza-like illness activity

This survey was sent on Monday, 28 August 2017 at 01:13 AM and by 09:00 AM, Thursday 31 August we had received 25319 responses (25701 last week) from 15144 people responding for themselves and 10175 household members across Australia.

Across Australia, fever and cough was reported by 2.8% of vaccinated participants and 3.7% of unvaccinated participants. Fever, cough and absence from normal duties was reported by 2.3% of vaccinated participants and 3.0% of unvaccinated participants.

For participants this week, 15819/25319 (62.5 %) have received the seasonal vaccine so far. Of the 4666 participants who identified as working face-to-face with patients, 3784 (81.1%) have received the vaccine.
FluTracking.png


For more information: Flu Tracking

*Australian influenza report 2017 - Current report:
AUSTRALIAN INFLUENZA
SURVEILLANCE REPORT
No. 7, 2017
5 ? 18 August 2017
The Department of Health acknowledges the providers of the many sources of data used in this report and
greatly appreciates their contribution.
KEY MESSAGES
 Influenza activity at the national level continued to increase this reporting fortnight with many
surveillance systems at levels comparable to or exceeding the peak of the 2016 season.
 High levels of influenza activity in the community are likely to continue for the next few weeks.
There has been almost two and a half times the number of laboratory confirmed notifications of influenza
reported to the National Notifiable Diseases Surveillance System this year when compared with the same
period last year. An earlier season onset and introduction of rapid testing have contributed, in part, to this
increase.

 Influenza‐like illness (ILI) is increasing nationally. Influenza was the most common cause of ILI
presentations to sentinel general practitioners this fortnight, with more than half of all patients presenting
to sentinel general practitioners with ILI and tested were positive for influenza.
 Influenza A(H3N2) is currently the predominant circulating influenza A virus nationally, though the number
of notifications has decreased this reporting period. Influenza B viruses also continue to circulate.
 Notification rates this year to date have been highest in adults aged 80 years or older, with a secondary
peak in young children, aged 5 to 9 years.
 Hospitalisations with confirmed influenza have increased overall this reporting fortnight, but have
declined in the most recent week.
 Clinical severity for the season to date, as measured through the proportion of patients admitted directly
to ICU and deaths attributed to pneumonia or influenza, is low.
 To date, based on antigenic characterisation of circulating influenza viruses, the seasonal influenza
vaccines appear to be a moderate to good match for circulating virus strains, depending on the strain.
Vaccine effectiveness estimates, which provide an indication of how well the vaccine provides protection
against influenza, are only available towards the end of the influenza season.
...
Nationally Notified Influenza Associated Deaths
So far in 2017, 52 influenza associated deaths have been notified to the NNDSS. The majority of deaths were
due to influenza A (81%, n = 43). The median age of deaths notified was 81 years (range 13 to 97 years). The
number of influenza associated deaths reported to the NNDSS is reliant on the follow up of cases to determine
the outcome of their infection and most likely does not represent the true mortality associated with this
disease.
...
Australia.png

For more information: Department of Health
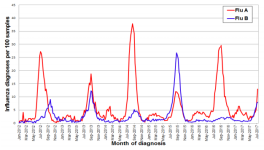
 
Back
Top