• FluTrackers.com Inc. does not provide medical advice. Information on this web site is collected from various internet resources, and the FluTrackers board of directors makes no warranty to the safety, efficacy, correctness or completeness of the information posted on this site by any author or poster. The information collated here is for instructional and/or discussion purposes only and is NOT intended to diagnose or treat any disease, illness, or other medical condition. Every individual reader or poster should seek advice from their personal physician/healthcare practitioner before considering or using any interventions that are discussed on this website. By continuing to access this website you agree to consult your personal physican before using any interventions posted on this website, and you agree to hold harmless FluTrackers.com Inc., the board of directors, the members, and all authors and posters for any effects from use of any medication, supplement, vitamin or other substance, device, intervention, etc. mentioned in posts on this website, or other internet venues referenced in posts on this website.
  • We are not asking for any donations. Do not donate to any entity who says they are raising funds for us.

Australia Influenza Surveillance 2016

Ronan Kelly

Retired 2020
Link to 2015 thread: https://flutrackers.com/forum/forum.../730575-australia-influenza-surveillance-2015

New South Wales

Influenza Monthly Epidemiology Report, NSW
March 2016

1. Summary
 Influenza A and B strains are continuing to circulate at levels slightly higher than is usual for
this time of year, with influenza A(H1N1) viruses the most common strain identified.
 The rate of influenza like illness (ILI) presentations to selected emergency departments was
low and consistent with inter-seasonal activity.
 Emergency department presentations for bronchiolitis increased markedly.
 The rate of ILI consultations at sentinel general practices was low.
 The proportion of deaths attributed to pneumonia and influenza remained low.
 The increased local influenza activity corresponds to increased seasonal influenza activity
reported in the Northern Hemisphere where influenza A(H1N1) strains are also predominating.

For more information: NSW Health - Infectious Diseases

Queensland

Statewide Weekly Influenza
Surveillance Report
Reporting Period: 1 January to 1 May 2016

There were 135 notifications reported this week. Of these cases, 28 were attributed to influenza B virus. Of the 107 Influenza A samples, 2 were identified as A/H3N2, 5 as A/H1N1pdm09, 100 had subtype not available There were 22 hospital admissions including 3 to ICU.

YTD there were 3,022 notifications reported. Of these cases, 467 were attributed to influenza B virus. Of the 2,555 Influenza A samples, 415 were identified as A(H1N1)pdm09 and 141 as A/H3N2.

There have been 386 hospital admissions including 52 to ICU.

For more information: Queensland Health

South Australia

24 April March to 30 April 2016

Influenza
Sixty cases of influenza were reported this week, with 46 cases being characterised as influenza A
and 14 as influenza B. Cases comprised of 25 males and 35 females, with a median age of 35 years.
There have been 679 cases of influenza notified year-to-date, compared with 1,217 cases reported
for the same period last year.

The influenza chart shows recent influenza activity in South Australia.

For more information: SA Health

Tasmania

No Reports available

For more information: DHHS Tasmania

Victoria

No Reports Available

For more information: Victorian Infectious Diseases Reference Laboratory

Western Australia

WEEK ENDING 10TH APRIL 2016
KEY POINTS
INFLUENZA AND INFLUENZA-LIKE ILLNESSES (ILI)
Summary: Indicators of influenza activity are low and remain at inter-seasonal levels.
 ILI presentations to sentinel emergency departments (EDs), detections of influenza virus, and
influenza notifications are low.
 ILI presentations to general practitioners (GPs) have increased over the past fortnight, but
remain consistent with inter-seasonal levels and appear to be due to non-influenza illness.
 The majority of influenza viruses subtyped are influenza A, with influenza A/H1N1 constituting
54% of total detections this week; influenza B continues to co-circulate.
 Non-influenza respiratory virus activity remains low.

For more information: WA Dept.of Health

Nationally

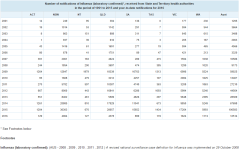
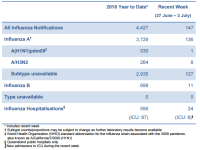
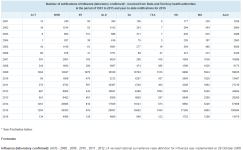
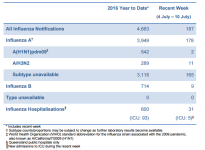
For the period to Jan 1- May 7th, 2016 there were 8,173 confirmed Influenza cases.

The largest number of notifications have been in QLD with 3,134 , NSW had 2,354, VIC 1,060, SA 699, WA had 677, NT 99, ACT 79, and TAS 71.

For national data: National Notifiable Diseases Surveillance System

Australian Sentinel Practices Research Network (ASPREN)

No. 6, 2016
7th March-20th March 2016

SYNDROMIC SURVEILLANCE
REPORTING
Reports were received from 219 GPs from 8
states and territories during the reporting
period. During weeks 11 and 12 a total of
16,033 and 15,125 consultations were made
respectively.

INFLUENZA-LIKE-ILLNESS (ILI)
Nationally, ILI notifications remained steady over the period
with 30 and 23 notifications in weeks 11 and 12 respectively.
ILI rates reported in this period decreased slightly with 2 and
1 cases per 1000 consultations in weeks 11 and 12
respectively, compared to 2 and 3 cases per 1000
consultations in weeks 9 and 10 respectively. For the same
reporting period in 2015, ILI rates were similar at 2 cases per
1000 consultations (see Figure 5). On a state-by-state basis,
it is important to note the increased ILI rate in Urban and
Remote QLD (see Figure 2).

For more information: ASPREN

Flu Tracking

Flutracking Weekly Interim Report
Week ending 01 May 2016

Low levels of influenza-like illness

This survey was sent on Monday, 02 May 2016 at 01:13 AM and by 09:00 AM, Thursday 05 May we had received 20280 responses from 12347 people responding for themselves and 7933 household members across Australia.

Across Australia, fever and cough was reported by 1.7% of vaccinated participants and 2.4% of unvaccinated participants. Fever, cough and absence from normal duties was reported by 1.0% of vaccinated participants and 1.3% of unvaccinated participants.

For participants this week, 8045/20280 (39.7 %) have received the seasonal vaccine so far. Of the 3942 participants who identified as working face-to-face with patients, 2310 (58.6%) have received the vaccine.


For more information: Flu Tracking


Australian influenza report 2015 - Current report:

No Reports available

For more information: Department of Health
 
Updated information marked with a *

*New South Wales

April 2016

1. Summary
 The influenza season has not yet started and it is unlikely to start in the next four weeks.
 Although higher than the usual inter-seasonal average, influenza activity continued to be low
across NSW, with influenza A(H1N1) viruses the most common strain identified.
 The rate of influenza like illness (ILI) presentations to selected emergency departments was
low and consistent with inter-seasonal activity.
 Emergency department presentations for bronchiolitis decreases toward the end of April.
 The rate of ILI consultations at sentinel general practices was low.
 The proportion of deaths attributed to pneumonia and influenza remained low.
 Influenza activity in the Northern Hemisphere has decreased. Influenza B has been the
predominant influenza virus strain circulating.

For more information: NSW Health - Infectious Diseases

*Queensland

Statewide Weekly Influenza
Surveillance Report
Reporting Period: 1 January to 8 May 2016

There were 129 notifications reported this week. Of these cases, 22 were attributed to influenza B virus. Of the 107 Influenza A samples, 4 were identified as A/H3N2, 5 as A/H1N1pdm09, 98 had subtype not available There were 11 hospital admissions including 3 to ICU.

YTD there were 3,182 notifications reported. Of these cases, 493 were attributed to influenza B virus. Of the 2,689 Influenza A samples, 433 were identified as A(H1N1)pdm09 and 146 as A/H3N2.

There have been 401 hospital admissions including 57 to ICU.

For more information: Queensland Health

South Australia

24 April March to 30 April 2016

Influenza
Sixty cases of influenza were reported this week, with 46 cases being characterised as influenza A
and 14 as influenza B. Cases comprised of 25 males and 35 females, with a median age of 35 years.
There have been 679 cases of influenza notified year-to-date, compared with 1,217 cases reported
for the same period last year.

The influenza chart shows recent influenza activity in South Australia.

For more information: SA Health

*Tasmania

Issue 1 | 9 May 2016

There have been 65 notifications of flu detected in specimens collected from the start of 2016 up to and including
Sunday 24 April 2016. Similar numbers of notifications were received for specimens collected during the identical
January-to-April periods of 2014 (65 notifications) and 2015 (63 notifications).
The low rate of notification during this period ? an average of four per week ? is consistent with the expected
low activity during the period between winter flu seasons (see Figures 1 and 2).
Flu has been notified in residents from all regions of Tasmania (see Table 1). One overseas visitor was diagnosed
with flu whilst in Tasmania.
Influenza A virus was identified as the main cause of flu during this period (see Table 2). Additional laboratory
typing was performed on 12 influenza A samples. Eight samples were identified as being belonging to the
A(H1N1)pdm09 strain while the remaining four were related to A(H3N2).

For more information: DHHS Tasmania

*Victoria

Report No. 1: Week ending 8 May 2016

Overview: The 2016 influenza season so far
Measures of influenza‐like illness (ILI) from VicSPIN indicate the season is currently at baseline levels. ILI from the
National Home Doctor Service is slightly elevated compared to the same time in previous years but variable.
The number of notified laboratory confirmed influenza cases for the year to 8 May is similar to the same time in
2015. Of the notified influenza cases, a majority (~80%) have been type A. Both influenza A subtypes
(H1N1)pdm09 and H3N2 have been detected by VicSPIN, as well as parainfluenza virus and picornavirus.
Overall the data from the influenza and ILI surveillance systems indicate the influenza season is yet to start in
Victoria.

For more information: Victorian Infectious Diseases Reference Laboratory

*Western Australia

WEEK ENDING 1ST MAY 2016
KEY POINTS
INFLUENZA AND INFLUENZA-LIKE ILLNESSES (ILI)
Summary: Indicators of influenza activity are low and remain at inter-seasonal levels.
 ILI presentations to sentinel emergency departments (EDs), sentinel general practitioners
(GPs), detections of influenza virus, and influenza notifications remain low.
 Influenza A and influenza B viruses continue to co-circulate at low levels.
 Non-influenza respiratory virus activity remains low.

For more information: WA Dept.of Health

*Nationally

For the period to Jan 1- May 7th, 2016 there were 8,651 confirmed Influenza cases.

The largest number of notifications have been in QLD with 3,301 , NSW had 2,499, VIC 1,124, SA 747, WA had 716, NT 103, ACT 85, and TAS 76.

For national data: National Notifiable Diseases Surveillance System

*Australian Sentinel Practices Research Network (ASPREN)

No. 8, 2016
4th April-17th March 2016

SYNDROMIC SURVEILLANCE
REPORTING
Reports were received from 208 GPs from 8
states and territories during the reporting
period. During weeks 15 and 16 a total of
15,829 and 15,760 consultations were made
respectively.

INFLUENZA-LIKE-ILLNESS (ILI)
Nationally, ILI notifications increased over the period with 66
and 51 notifications in weeks 15 and 16 respectively. ILI rates
reported in this period remain steady at 4 cases per 1000
consultations in weeks 15 and 16, compared to 2 and 4
cases per 1000 consultations in weeks 13 and 14
respectively. For the same reporting period in 2015, ILI rates
were lower at 2 and 3 cases per 1000 consultations (see
Figure 5). On a state-by-state basis, it is important to note the
increased ILI rate in Urban ACT (see Figure 2).


For more information: ASPREN

*Flu Tracking

Flutracking Weekly Interim Report
Week ending 08 May 2016

Low levels of influenza-like illness

This survey was sent on Monday, 09 May 2016 at 01:13 AM and by 09:00 AM, Thursday 12 May we had received 22057 responses (20280 last week) from 13290 people responding for themselves and 8767 household members across Australia.

Across Australia, fever and cough was reported by 1.4% of vaccinated participants and 1.6% of unvaccinated participants. Fever, cough and absence from normal duties was reported by 1.1% of vaccinated participants and 1.1% of unvaccinated participants.s.

For participants this week, 8829/22057 (40.0 %) have received the seasonal vaccine so far. Of the 4276 participants who identified as working face-to-face with patients, 2543 (59.5%) have received the vaccine.


For more information: Flu Tracking


Australian influenza report 2015 - Current report:

No Reports available

For more information: Department of Health
 
Updated information marked with a *

*New South Wales

NSW Health Influenza Surveillance Report
Week 19: 9 to 15 May 2016

Summary:
 The influenza season has not yet started and it is unlikely to start in the next four
weeks.
 Although higher than the usual inter-seasonal average, influenza activity continued to
be low across NSW, with influenza A(H1N1) viruses the most common strain identified.
In this reporting week:
 Hospital surveillance ? the rate of influenza like illness (ILI) presentations to selected
emergency departments was low and consistent with inter-seasonal activity.
 Laboratory surveillance ? the proportion of respiratory samples positive for influenza was low
at 3.7%.
 Community surveillance ? influenza notifications were low in all NSW local health districts.
Data collected from eGPS, ASPREN and Flu Tracking showed low levels of ILI activity. One
new influenza outbreak was reported in a residential aged care facility.
 National and international influenza surveillance ? no new national reports have been issued. .
Influenza activity in the Northern Hemisphere has decreased with influenza B strains now
predominant.
 Recommended composition of 2016 influenza vaccines ? the World Health Organization
(WHO) has provided recommendations for the 2016 southern hemisphere winter influenza
season including two strain changes.


For more information: NSW Health - Infectious Diseases

*Queensland

Statewide Weekly Influenza
Surveillance Report
Reporting Period: 1 January to 15 May 2016

There were 114 notifications reported this week. Of these cases, 21 were attributed to influenza B virus. Of the 93 Influenza A samples, 9 were identified as A/H3N2, 5 as A/H1N1pdm09, 79 had subtype not available There were 8 hospital admissions including 1 to ICU.

YTD there were 3,341 notifications reported. Of these cases, 530 were attributed to influenza B virus. Of the 2,811 Influenza A samples, 443 were identified as A(H1N1)pdm09 and 156 as A/H3N2.

There have been 410 hospital admissions including 59 to ICU.

For more information: Queensland Health

*South Australia

1 May to 7 May 2016

Influenza
Fifty-three cases of influenza were reported this week, with 43 cases being characterised as influenza
A and ten as influenza B. Cases comprised of 20 males and 33 females, with a median age of 27
years. There have been 733 cases of influenza notified year-to-date, compared with 1,314 cases
reported for the same period last year.

The influenza chart shows recent influenza activity in South Australia.

For more information: SA Health

Tasmania

Issue 1 | 9 May 2016

There have been 65 notifications of flu detected in specimens collected from the start of 2016 up to and including
Sunday 24 April 2016. Similar numbers of notifications were received for specimens collected during the identical
January-to-April periods of 2014 (65 notifications) and 2015 (63 notifications).
The low rate of notification during this period – an average of four per week – is consistent with the expected
low activity during the period between winter flu seasons (see Figures 1 and 2).
Flu has been notified in residents from all regions of Tasmania (see Table 1). One overseas visitor was diagnosed
with flu whilst in Tasmania.
Influenza A virus was identified as the main cause of flu during this period (see Table 2). Additional laboratory
typing was performed on 12 influenza A samples. Eight samples were identified as being belonging to the
A(H1N1)pdm09 strain while the remaining four were related to A(H3N2).

For more information: DHHS Tasmania

Victoria

Report No. 1: Week ending 8 May 2016

Overview: The 2016 influenza season so far
Measures of influenza‐like illness (ILI) from VicSPIN indicate the season is currently at baseline levels. ILI from the
National Home Doctor Service is slightly elevated compared to the same time in previous years but variable.
The number of notified laboratory confirmed influenza cases for the year to 8 May is similar to the same time in
2015. Of the notified influenza cases, a majority (~80%) have been type A. Both influenza A subtypes
(H1N1)pdm09 and H3N2 have been detected by VicSPIN, as well as parainfluenza virus and picornavirus.
Overall the data from the influenza and ILI surveillance systems indicate the influenza season is yet to start in
Victoria.

For more information: Victorian Infectious Diseases Reference Laboratory

*Western Australia

WEEK ENDING 8TH MAY 2016
KEY POINTS
INFLUENZA AND INFLUENZA-LIKE ILLNESSES (ILI)
Summary: Indicators of influenza activity are low and remain at inter-seasonal levels.
 ILI presentations to sentinel emergency departments (EDs) and sentinel general practitioners
(GPs) increased slightly this week, but remain within inter-seasonal level.
 Detections of influenza virus and influenza notifications remain low.
 Influenza A and influenza B viruses continue to co-circulate at low levels.
 Non-influenza respiratory virus activity remains low.

For more information: WA Dept.of Health

*Nationally

For the period to Jan 1- May 22nd, 2016 there were 9,228 confirmed Influenza cases.

The largest number of notifications have been in QLD with 3,501 , NSW had 2,667, VIC 1,203, WA 805, SA had 771, NT 109, ACT 91, and TAS 81.

For national data: National Notifiable Diseases Surveillance System

Australian Sentinel Practices Research Network (ASPREN)

No. 8, 2016
4th April-17th March 2016

SYNDROMIC SURVEILLANCE
REPORTING
Reports were received from 208 GPs from 8
states and territories during the reporting
period. During weeks 15 and 16 a total of
15,829 and 15,760 consultations were made
respectively.

INFLUENZA-LIKE-ILLNESS (ILI)
Nationally, ILI notifications increased over the period with 66
and 51 notifications in weeks 15 and 16 respectively. ILI rates
reported in this period remain steady at 4 cases per 1000
consultations in weeks 15 and 16, compared to 2 and 4
cases per 1000 consultations in weeks 13 and 14
respectively. For the same reporting period in 2015, ILI rates
were lower at 2 and 3 cases per 1000 consultations (see
Figure 5). On a state-by-state basis, it is important to note the
increased ILI rate in Urban ACT (see Figure 2).


For more information: ASPREN

*Flu Tracking

Flutracking Weekly Interim Report
Week ending 15 May 2016

Low levels of influenza-like illness

This survey was sent on Monday, 16 May 2016 at 01:13 AM and by 09:00 AM, Thursday 19 May we had received 22856 responses (22057 last week) from 13749 people responding for themselves and 9107 household members across Australia.

Across Australia, fever and cough was reported by 2.0% of vaccinated participants and 1.9% of unvaccinated participants. Fever, cough and absence from normal duties was reported by 1.5% of vaccinated participants and 1.4% of unvaccinated participants.

For participants this week, 9206/22856 (40.3 %) have received the seasonal vaccine so far. Of the 4413 participants who identified as working face-to-face with patients, 2629 (59.6%) have received the vaccine.


For more information: Flu Tracking


Australian influenza report 2016 - Current report:

No Reports available

For more information: Department of Health
 
Updated information marked with a *

*New South Wales

NSW Health Influenza Surveillance Report
Week 20: 16 to 22 May 2016

Summary:
 The influenza season has not yet started and it is unlikely to start in the next four
weeks.
 Although higher than the usual inter-seasonal average, influenza activity continued to
be low across NSW, with influenza A(H1N1) viruses the most common strain identified.
In this reporting week:
 Hospital surveillance ? the rate of influenza like illness (ILI) presentations to selected
emergency departments was low and consistent with inter-seasonal activity.
 Laboratory surveillance ? the proportion of respiratory samples positive for influenza was low
at 2.8%.
 Community surveillance ? influenza notifications were low in all NSW local health districts.
Data collected from eGPS, ASPREN and Flu Tracking showed low levels of ILI activity. One
new influenza outbreak was reported in a residential group housing facility.
 National and international influenza surveillance ? no new national reports have been issued. .
Influenza activity in the Northern Hemisphere has decreased with influenza B strains now
predominant.
 Recommended composition of 2016 influenza vaccines ? the World Health Organization
(WHO) has provided recommendations for the 2016 southern hemisphere winter influenza
season including two strain changes.


For more information: NSW Health - Infectious Diseases

*Queensland

Statewide Weekly Influenza
Surveillance Report
Reporting Period: 1 January to 22 May 2016

There were 151 notifications reported this week. Of these cases, 26 were attributed to influenza B virus. Of the 125 Influenza A samples, 13 were identified as A/H3N2, 7 as A/H1N1pdm09, 105 had subtype not available There were 16 hospital admissions including 3 to ICU.

YTD there were 3,518 notifications reported. Of these cases, 563 were attributed to influenza B virus. Of the 2,955 Influenza A samples, 459 were identified as A(H1N1)pdm09 and 171 as A/H3N2.

There have been 434 hospital admissions including 62 to ICU.

For more information: Queensland Health

*South Australia

15 May to 21 May 2016

Twenty-one cases of influenza were reported this week, with 16 cases being characterised as
influenza A and five as influenza B. Cases comprised of 12 males and nine females, with a median
age of 40 years. There have been 791 cases of influenza notified year-to-date, compared with 1,507
cases reported for the same period last year.

The influenza chart shows recent influenza activity in South Australia.

For more information: SA Health

Tasmania

Issue 1 | 9 May 2016

There have been 65 notifications of flu detected in specimens collected from the start of 2016 up to and including
Sunday 24 April 2016. Similar numbers of notifications were received for specimens collected during the identical
January-to-April periods of 2014 (65 notifications) and 2015 (63 notifications).
The low rate of notification during this period ? an average of four per week ? is consistent with the expected
low activity during the period between winter flu seasons (see Figures 1 and 2).
Flu has been notified in residents from all regions of Tasmania (see Table 1). One overseas visitor was diagnosed
with flu whilst in Tasmania.
Influenza A virus was identified as the main cause of flu during this period (see Table 2). Additional laboratory
typing was performed on 12 influenza A samples. Eight samples were identified as being belonging to the
A(H1N1)pdm09 strain while the remaining four were related to A(H3N2).

For more information: DHHS Tasmania

*Victoria

Report No. 3: Week ending 22 May 2016

Overview: The 2016 influenza season so far Measures of influenza-like illness (ILI) from VicSPIN indicate the season is currently at baseline levels.
The ILI rate from the National Home Doctor Service has decreased in the last several weeks.
The number of notified laboratory confirmed influenza cases for the year to 22 May is 5% lower than the same time in 2015.
Of the notified influenza cases, 80% have been type A.
VicSPIN detected influenza types A(H1) and B (26% of specimens tested) during the week.
Picornavirus was the other most common respiratory virus detected.
Overall the data from the influenza and ILI surveillance systems indicate the influenza season is yet to start in Victoria.

For more information: Victorian Infectious Diseases Reference Laboratory

*Western Australia

WEEK ENDING 15TH MAY 2016
KEY POINTS
INFLUENZA AND INFLUENZA-LIKE ILLNESSES (ILI)
Summary: Some indicators of influenza-like illness activity increased this week, but overall, indicators
remain at inter-seasonal levels.
 There were modest increases in ILI presentations to sentinel emergency departments (EDs),
notifications of influenza to the WA Health Department, and detections of influenza virus by
sentinel general practitioners (GPs) this week.
 Other indicators of influenza activity remain low, including routine detections of influenza virus.
 Influenza A (both H1 and H3) and influenza B viruses continue to co-circulate at low levels, with
influenza B (43%) constituting the majority of detections.
 Respiratory syncytial virus activity increased this week, but overall, non-influenza respiratory
virus activity remains low.

For more information: WA Dept.of Health

*Nationally

For the period to Jan 1- May 28th, 2016 there were 9,602 confirmed Influenza cases.

The largest number of notifications have been in QLD with 3,623 , NSW had 2,788, VIC 1,254, WA 854, SA had 789, NT 113, ACT 96, and TAS 85.

For national data: National Notifiable Diseases Surveillance System

Australian Sentinel Practices Research Network (ASPREN)

No. 8, 2016
4th April-17th March 2016

SYNDROMIC SURVEILLANCE
REPORTING
Reports were received from 208 GPs from 8
states and territories during the reporting
period. During weeks 15 and 16 a total of
15,829 and 15,760 consultations were made
respectively.

INFLUENZA-LIKE-ILLNESS (ILI)
Nationally, ILI notifications increased over the period with 66
and 51 notifications in weeks 15 and 16 respectively. ILI rates
reported in this period remain steady at 4 cases per 1000
consultations in weeks 15 and 16, compared to 2 and 4
cases per 1000 consultations in weeks 13 and 14
respectively. For the same reporting period in 2015, ILI rates
were lower at 2 and 3 cases per 1000 consultations (see
Figure 5). On a state-by-state basis, it is important to note the
increased ILI rate in Urban ACT (see Figure 2).


For more information: ASPREN

*Flu Tracking

Flutracking Weekly Interim Report
Week ending 22 May 2016

Low levels of influenza-like illness activity

This survey was sent on Monday, 23 May 2016 at 01:13 AM and by 09:00 AM, Thursday 26 May
we had received 22888 responses (22856 last week) from 13820 people responding for themselves and 9068 household members across Australia.

Across Australia, fever and cough was reported by 1.7% of vaccinated participants and 2.2% of unvaccinated participants.
Fever, cough and absence from normal duties was reported by 1.5% of vaccinated participants and 1.7% of unvaccinated participants.

For participants this week, 10664/22888 (46.6 %) have received the seasonal vaccine so far.
Of the 4442 participants who identified as working face-to-face with patients, 2964 (66.7%) have received the vaccine.

For more information: Flu Tracking


Australian influenza report 2016 - Current report:

No Reports available

For more information: Department of Health
 
Updated information marked with a *

New South Wales

NSW Health Influenza Surveillance Report
Week 20: 16 to 22 May 2016

Summary:
 The influenza season has not yet started and it is unlikely to start in the next four
weeks.
 Although higher than the usual inter-seasonal average, influenza activity continued to
be low across NSW, with influenza A(H1N1) viruses the most common strain identified.
In this reporting week:
 Hospital surveillance – the rate of influenza like illness (ILI) presentations to selected
emergency departments was low and consistent with inter-seasonal activity.
 Laboratory surveillance – the proportion of respiratory samples positive for influenza was low
at 2.8%.
 Community surveillance – influenza notifications were low in all NSW local health districts.
Data collected from eGPS, ASPREN and Flu Tracking showed low levels of ILI activity. One
new influenza outbreak was reported in a residential group housing facility.
 National and international influenza surveillance – no new national reports have been issued. .
Influenza activity in the Northern Hemisphere has decreased with influenza B strains now
predominant.
 Recommended composition of 2016 influenza vaccines – the World Health Organization
(WHO) has provided recommendations for the 2016 southern hemisphere winter influenza
season including two strain changes.


For more information: NSW Health - Infectious Diseases

*Queensland

Statewide Weekly Influenza
Surveillance Report
Reporting Period: 1 January to 29 May 2016

There were 116 notifications reported this week. Of these cases, 26 were attributed to influenza B virus. Of the 90 Influenza A samples, 14 were identified as A/H3N2, 5 as A/H1N1pdm09, 71 had subtype not available There were 15 hospital admissions including 3 to ICU.

YTD there were 3,654 notifications reported. Of these cases, 595 were attributed to influenza B virus. Of the 3,059 Influenza A samples, 476 were identified as A(H1N1)pdm09 and 187 as A/H3N2.

There have been 461 hospital admissions including 68 to ICU.

For more information: Queensland Health

*South Australia

22 May to 28 May 2016

Eighteen cases of influenza were reported this week, with 12 cases being characterised as influenza
A and six as influenza B. Cases comprised of seven males and 11 females, with a median age of 55
years. There have been 808 cases of influenza notified year-to-date, compared with 1,614 cases
reported for the same period last year.

The influenza chart shows recent influenza activity in South Australia.

For more information: SA Health

Tasmania

Issue 1 | 9 May 2016

There have been 65 notifications of flu detected in specimens collected from the start of 2016 up to and including
Sunday 24 April 2016. Similar numbers of notifications were received for specimens collected during the identical
January-to-April periods of 2014 (65 notifications) and 2015 (63 notifications).
The low rate of notification during this period – an average of four per week – is consistent with the expected
low activity during the period between winter flu seasons (see Figures 1 and 2).
Flu has been notified in residents from all regions of Tasmania (see Table 1). One overseas visitor was diagnosed
with flu whilst in Tasmania.
Influenza A virus was identified as the main cause of flu during this period (see Table 2). Additional laboratory
typing was performed on 12 influenza A samples. Eight samples were identified as being belonging to the
A(H1N1)pdm09 strain while the remaining four were related to A(H3N2).

For more information: DHHS Tasmania

Victoria

Report No. 3: Week ending 22 May 2016

Overview: The 2016 influenza season so far Measures of influenza-like illness (ILI) from VicSPIN indicate the season is currently at baseline levels.
The ILI rate from the National Home Doctor Service has decreased in the last several weeks.
The number of notified laboratory confirmed influenza cases for the year to 22 May is 5% lower than the same time in 2015.
Of the notified influenza cases, 80% have been type A.
VicSPIN detected influenza types A(H1) and B (26% of specimens tested) during the week.
Picornavirus was the other most common respiratory virus detected.
Overall the data from the influenza and ILI surveillance systems indicate the influenza season is yet to start in Victoria.

For more information: Victorian Infectious Diseases Reference Laboratory

Western Australia

WEEK ENDING 15TH MAY 2016
KEY POINTS
INFLUENZA AND INFLUENZA-LIKE ILLNESSES (ILI)
Summary: Some indicators of influenza-like illness activity increased this week, but overall, indicators
remain at inter-seasonal levels.
 There were modest increases in ILI presentations to sentinel emergency departments (EDs),
notifications of influenza to the WA Health Department, and detections of influenza virus by
sentinel general practitioners (GPs) this week.
 Other indicators of influenza activity remain low, including routine detections of influenza virus.
 Influenza A (both H1 and H3) and influenza B viruses continue to co-circulate at low levels, with
influenza B (43%) constituting the majority of detections.
 Respiratory syncytial virus activity increased this week, but overall, non-influenza respiratory
virus activity remains low.

For more information: WA Dept.of Health

*Nationally

For the period to Jan 1- Jun 4th, 2016 there were 10,038 confirmed Influenza cases.

The largest number of notifications have been in QLD with 3,746 , NSW had 2,958, VIC 1,300, WA 920, SA had 808, NT 116, ACT 99, and TAS 91.

For national data: National Notifiable Diseases Surveillance System

Australian Sentinel Practices Research Network (ASPREN)

No. 8, 2016
4th April-17th March 2016

SYNDROMIC SURVEILLANCE
REPORTING
Reports were received from 208 GPs from 8
states and territories during the reporting
period. During weeks 15 and 16 a total of
15,829 and 15,760 consultations were made
respectively.

INFLUENZA-LIKE-ILLNESS (ILI)
Nationally, ILI notifications increased over the period with 66
and 51 notifications in weeks 15 and 16 respectively. ILI rates
reported in this period remain steady at 4 cases per 1000
consultations in weeks 15 and 16, compared to 2 and 4
cases per 1000 consultations in weeks 13 and 14
respectively. For the same reporting period in 2015, ILI rates
were lower at 2 and 3 cases per 1000 consultations (see
Figure 5). On a state-by-state basis, it is important to note the
increased ILI rate in Urban ACT (see Figure 2).


For more information: ASPREN

*Flu Tracking

Flutracking Weekly Interim Report
Week ending 29 May 2016

Low levels of influenza-like illness activity

This survey was sent on Monday, 30 May 2016 at 01:13 AM and by 09:00 AM, Thursday 02 June we had received 23130 responses (22888 last week)
from 13899 people responding for themselves and 9231 household members across Australia.

Across Australia, fever and cough was reported by 1.8% of vaccinated participants and 2.5% of unvaccinated participants.
Fever, cough and absence from normal duties was reported by 1.1% of vaccinated participants and 1.5% of unvaccinated participants.

For participants this week, 11798/23130 (51.0 %) have received the seasonal vaccine so far.
Of the 4483 participants who identified as working face-to-face with patients, 3208 (71.6%) have received the vaccine.

For more information: Flu Tracking


Australian influenza report 2016 - Current report:

No Reports available

For more information: Department of Health
 
Updated information marked with a *

*New South Wales

NSW Health Influenza Surveillance Report
Week 21: 23 to 29 May 2016

Summary:
 The influenza season has not yet started and it is unlikely to start in the next four
weeks.
 Although higher than the usual inter-seasonal average, influenza activity continued to
be low across NSW, with influenza A(H1N1) viruses the most common strain identified.
In this reporting week:
 Hospital surveillance ? the rate of influenza like illness (ILI) presentations to selected
emergency departments was low and consistent with inter-seasonal activity.
 Laboratory surveillance ? the proportion of respiratory samples positive for influenza remained
low at 3.5%.
 Community surveillance ? influenza notifications were low in all NSW local health districts.
Data collected from eGPS, ASPREN and Flu Tracking showed low levels of ILI activity. One
new influenza outbreak was reported in a residential care facility.
 National and international influenza surveillance ? no new national reports have been issued.
Influenza activity in the Northern Hemisphere has decreased with influenza B strains now
predominant.
 Recommended composition of 2016 influenza vaccines ? the World Health Organization
(WHO) has provided recommendations for the 2016 southern hemisphere winter influenza
season including two strain changes.

For more information: NSW Health - Infectious Diseases

*Queensland

Statewide Weekly Influenza
Surveillance Report
Reporting Period: 1 January to 5 June 2016

There were 104 notifications reported this week. Of these cases, 17 were attributed to influenza B virus. Of the 87 Influenza A samples, 11 were identified as A/H3N2, 5 as A/H1N1pdm09, 71 had subtype not available There were 11 hospital admissions including 3 to ICU.

YTD there were 3,758 notifications reported. Of these cases, 613 were attributed to influenza B virus. Of the 3,145 Influenza A samples, 496 were identified as A(H1N1)pdm09 and 201 as A/H3N2.

There have been 466 hospital admissions including 71 to ICU.

For more information: Queensland Health

South Australia

22 May to 28 May 2016

Eighteen cases of influenza were reported this week, with 12 cases being characterised as influenza
A and six as influenza B. Cases comprised of seven males and 11 females, with a median age of 55
years. There have been 808 cases of influenza notified year-to-date, compared with 1,614 cases
reported for the same period last year.

The influenza chart shows recent influenza activity in South Australia.

For more information: SA Health

Tasmania

Issue 1 | 9 May 2016

There have been 65 notifications of flu detected in specimens collected from the start of 2016 up to and including
Sunday 24 April 2016. Similar numbers of notifications were received for specimens collected during the identical
January-to-April periods of 2014 (65 notifications) and 2015 (63 notifications).
The low rate of notification during this period ? an average of four per week ? is consistent with the expected
low activity during the period between winter flu seasons (see Figures 1 and 2).
Flu has been notified in residents from all regions of Tasmania (see Table 1). One overseas visitor was diagnosed
with flu whilst in Tasmania.
Influenza A virus was identified as the main cause of flu during this period (see Table 2). Additional laboratory
typing was performed on 12 influenza A samples. Eight samples were identified as being belonging to the
A(H1N1)pdm09 strain while the remaining four were related to A(H3N2).

For more information: DHHS Tasmania

*Victoria

Report No. 5: Week ending 5 June 2016

Overview: The 2016 influenza season so far
Measures of influenza‐like illness (ILI) from VicSPIN indicate the season is currently just above baseline levels.
The ILI rate from the National Home Doctor Service has been variable but increased slightly in the last week.
The number of notified laboratory confirmed influenza cases for the year to 5 June is 16% lower than the same
time in 2015. Of the notified influenza cases, 72% have been type A. VicSPIN detected no influenza during the
week. Picornavirus was the other most common respiratory virus detected.
Overall the data from the influenza and ILI surveillance systems indicate the influenza season is just at or slightly
above baseline levels in Victoria.

For more information: Victorian Infectious Diseases Reference Laboratory

*Western Australia

WEEK ENDING 29TH MAY 2016
KEY POINTS
INFLUENZA AND INFLUENZA-LIKE ILLNESSES (ILI)
Summary: Influenza-like illness in general practice increased this week; however, this increase appears
to be mostly attributed to non-influenza respiratory viruses.
 ILI presentations to sentinel general practitioners (GPs) increased modestly this week, while activity
at hospitals EDs was steady.
 Other indicators of influenza activity remain relatively steady, including routine detections of
influenza virus and test percent positivity.
 Influenza A (both H1 and H3) and influenza B viruses continue to co-circulate at low levels, with
influenza A/H1 (52%) and influenza B (33%) constituting the majority of detections.
 Respiratory syncytial virus activity increased this week, particularly at Princess Margaret Hospital
for Children.

For more information: WA Dept.of Health

*Nationally

For the period to Jan 1- Jun 12th, 2016 there were 10,750 confirmed Influenza cases.

The largest number of notifications have been in QLD with 3,886 , NSW had 3,354, VIC 1,370, WA 974, SA had 830, NT 124, ACT 111, and TAS 101.

For national data: National Notifiable Diseases Surveillance System

Australian Sentinel Practices Research Network (ASPREN)

No. 8, 2016
4th April-17th March 2016

SYNDROMIC SURVEILLANCE
REPORTING
Reports were received from 208 GPs from 8
states and territories during the reporting
period. During weeks 15 and 16 a total of
15,829 and 15,760 consultations were made
respectively.

INFLUENZA-LIKE-ILLNESS (ILI)
Nationally, ILI notifications increased over the period with 66
and 51 notifications in weeks 15 and 16 respectively. ILI rates
reported in this period remain steady at 4 cases per 1000
consultations in weeks 15 and 16, compared to 2 and 4
cases per 1000 consultations in weeks 13 and 14
respectively. For the same reporting period in 2015, ILI rates
were lower at 2 and 3 cases per 1000 consultations (see
Figure 5). On a state-by-state basis, it is important to note the
increased ILI rate in Urban ACT (see Figure 2).


For more information: ASPREN

*Flu Tracking

Flutracking Weekly Interim Report
Week ending 05 June 2016

Low levels of influenza-like illness activity

This survey was sent on Monday, 06 June 2016 at 01:13 AM and by 09:00 AM, Thursday 09 June we had received 22928 responses (23130 last week) from 13809 people responding for themselves and 9119 household members across Australia.

Across Australia, fever and cough was reported by 1.9% of vaccinated participants and 2.3% of unvaccinated participants. Fever, cough and absence from normal duties was reported by 1.3% of vaccinated participants and 1.5% of unvaccinated participants.

For participants this week, 13218/22928 (57.7 %) have received the seasonal vaccine so far. Of the 4447 participants who identified as working face-to-face with patients, 3473 (78.1%) have received the vaccine.

For more information: Flu Tracking


Australian influenza report 2016 - Current report:

No Reports available

For more information: Department of Health
 
Updated information marked with a *

*New South Wales

NSW Health Influenza Surveillance Report
Week 23: 6 to 12 June 2016

Summary:
 The influenza season is likely to commence in the next few weeks.
 Influenza activity is increasing but continues to be generally low in most parts of NSW.
Influenza A(H3N2) and influenza A(H1N1) strains are circulating at similar levels.
In this reporting week:
 Hospital Surveillance ? the rate of influenza like illness (ILI) presentations to selected
emergency departments increased and is approaching the trigger level for the flu season.
 Laboratory surveillance ? the proportion of respiratory samples positive for influenza increased
but remained relatively low at 5.3%.
 Community surveillance ? influenza notifications continue to increase in a number of Sydney
local health districts. Data collected from General Practice surveillance systems showed higher
levels of ILI activity. One new influenza outbreak was reported in a residential care facility.
 National and international influenza surveillance ? no new national reports have been issued
but activity is increasing in a number of states. Influenza activity is increasing in other regions
in the Southern Hemisphere.
 Recommended composition of 2016 influenza vaccines ? the World Health Organization
(WHO) has provided recommendations for the 2016 southern hemisphere winter influenza
season including two strain changes.

For more information: NSW Health - Infectious Diseases

*Queensland

Statewide Weekly Influenza
Surveillance Report
Reporting Period: 1 January to 12 June 2016

There were 121 notifications reported this week. Of these cases, 18 were attributed to influenza B virus. Of the 103 Influenza A samples, 10 were identified as A/H3N2, 5 as A/H1N1pdm09, 88 had subtype not available There were 10 hospital admissions including 2 to ICU.

YTD there were 3,906 notifications reported. Of these cases, 627 were attributed to influenza B virus. Of the 3,267 Influenza A samples, 509 were identified as A(H1N1)pdm09 and 215 as A/H3N2.

There have been 479 hospital admissions including 73 to ICU.

For more information: Queensland Health

South Australia

22 May to 28 May 2016

Eighteen cases of influenza were reported this week, with 12 cases being characterised as influenza
A and six as influenza B. Cases comprised of seven males and 11 females, with a median age of 55
years. There have been 808 cases of influenza notified year-to-date, compared with 1,614 cases
reported for the same period last year.

The influenza chart shows recent influenza activity in South Australia.

For more information: SA Health

Tasmania

Issue 1 | 9 May 2016

There have been 65 notifications of flu detected in specimens collected from the start of 2016 up to and including
Sunday 24 April 2016. Similar numbers of notifications were received for specimens collected during the identical
January-to-April periods of 2014 (65 notifications) and 2015 (63 notifications).
The low rate of notification during this period – an average of four per week – is consistent with the expected
low activity during the period between winter flu seasons (see Figures 1 and 2).
Flu has been notified in residents from all regions of Tasmania (see Table 1). One overseas visitor was diagnosed
with flu whilst in Tasmania.
Influenza A virus was identified as the main cause of flu during this period (see Table 2). Additional laboratory
typing was performed on 12 influenza A samples. Eight samples were identified as being belonging to the
A(H1N1)pdm09 strain while the remaining four were related to A(H3N2).

For more information: DHHS Tasmania

*Victoria

Report No. 6: Week ending 12 June 2016
Overview: The 2016 influenza season so far
Measures of influenza‐like illness (ILI) from VicSPIN indicate the season is currently slightly below baseline levels.
The ILI rate from the National Home Doctor Service has been variable but increased to above baseline levels in
the last week.
The number of notified laboratory confirmed influenza cases for the year to 12 June is 19% lower than the same
time in 2015. Of the notified influenza cases, 79% have been type A. VicSPIN detected one influenza A(H3N2)
during the week.
Overall the data from the influenza and ILI surveillance systems indicate the influenza season is just at or slightly
above baseline levels in Victoria

For more information: Victorian Infectious Diseases Reference Laboratory

*Western Australia

WEEK ENDING 12TH JUNE 2016
KEY POINTS
INFLUENZA AND INFLUENZA-LIKE ILLNESSES (ILI)
Summary: Indicators of influenza-like illness and influenza either decreased or remained relatively
stable this week, indicating that seasonal activity has not yet started.
 ILI presentations to general practice, detections of influenza virus, and notifications of influenza
cases decreased this week
 Emergency department presentations and admissions remain relatively stable.
 Influenza A (both H1 and H3) and influenza B viruses continue to co-circulate at low levels, with
influenza A/H1 (44%) and influenza B (31%) constituting the majority of detections.
 Non-influenza respiratory viruses decreased or remained stable this week.

For more information: WA Dept.of Health

*Nationally

For the period to Jan 1- Jun 18th, 2016 there were 11,174 confirmed Influenza cases.

The largest number of notifications have been in QLD with 4,024 , NSW had 3,535, VIC 1,404, WA 1,021, SA had 841, NT 124, ACT 119, and TAS 106.

For national data: National Notifiable Diseases Surveillance System

Australian Sentinel Practices Research Network (ASPREN)

No. 8, 2016
4th April-17th March 2016

SYNDROMIC SURVEILLANCE
REPORTING
Reports were received from 208 GPs from 8
states and territories during the reporting
period. During weeks 15 and 16 a total of
15,829 and 15,760 consultations were made
respectively.

INFLUENZA-LIKE-ILLNESS (ILI)
Nationally, ILI notifications increased over the period with 66
and 51 notifications in weeks 15 and 16 respectively. ILI rates
reported in this period remain steady at 4 cases per 1000
consultations in weeks 15 and 16, compared to 2 and 4
cases per 1000 consultations in weeks 13 and 14
respectively. For the same reporting period in 2015, ILI rates
were lower at 2 and 3 cases per 1000 consultations (see
Figure 5). On a state-by-state basis, it is important to note the
increased ILI rate in Urban ACT (see Figure 2).


For more information: ASPREN

*Flu Tracking

Flutracking Weekly Interim Report
Week ending 12 June 2016

Low levels of influenza-like illness activity

This survey was sent on Monday, 13 June 2016 at 01:13 AM and by 09:00 AM, Thursday 16 June we had received 22451 responses (22928 last week) from 13570 people responding for themselves and 8881 household members across Australia.

Across Australia, fever and cough was reported by 1.8% of vaccinated participants and 2.3% of unvaccinated participants. Fever, cough and absence from normal duties was reported by 1.0% of vaccinated participants and 1.3% of unvaccinated participants.

For participants this week, 13198/22451 (58.8 %) have received the seasonal vaccine so far. Of the 4375 participants who identified as working face-to-face with patients, 3452 (78.9%) have received the vaccine.

For more information: Flu Tracking


Australian influenza report 2016 - Current report:

No Reports available

For more information: Department of Health
 
Updated information marked with a *

*New South Wales

NSW Health Influenza Surveillance Report
Week 24: 13 to 19 June 2016

Summary:
 The influenza season is likely to commence in the next few weeks.
 Influenza activity remained steady in most parts of NSW. Influenza A(H3N2) and
influenza A(H1N1) strains are circulating at similar levels.

In this reporting week:
 Hospital Surveillance ? the rate of influenza like illness (ILI) presentations to selected
emergency departments fluctuated around the seasonal threshold. It is expected to increase
over the coming weeks.
 Laboratory surveillance ? the proportion of respiratory samples positive for influenza
decreased slightly and remained relatively low at 4.9%.
 Community surveillance ? influenza notifications were similar to the previous week in most
local health districts. Data collected from General Practice surveillance systems showed
slightly lower levels of ILI activity. No new influenza outbreaks were reported in residential care
facilities.
 National and international influenza surveillance ? Influenza activity remains at low levels
across Australia. Influenza activity is increasing in other regions in the Southern Hemisphere.
 Recommended composition of 2016 influenza vaccines ? the World Health Organization
(WHO) has provided recommendations for the 2016 southern hemisphere winter influenza
season including two strain changes.

For more information: NSW Health - Infectious Diseases

*Queensland

Statewide Weekly Influenza
Surveillance Report
Reporting Period: 1 January to 19 June 2016

Queensland.png

For more information: Queensland Health

*South Australia

12 June to 18 June 2016

Twenty-two cases of influenza were reported this week, with 16 cases being characterised as
influenza A and six as influenza B. Cases comprised of eight males and 14 females, with a median
age of 40 years. There have been 869 cases of influenza notified year-to-date, compared with 2,086
cases reported for the same period last year.

The influenza chart shows recent influenza activity in South Australia.

For more information: SA Health

Tasmania

Issue 1 | 9 May 2016

There have been 65 notifications of flu detected in specimens collected from the start of 2016 up to and including
Sunday 24 April 2016. Similar numbers of notifications were received for specimens collected during the identical
January-to-April periods of 2014 (65 notifications) and 2015 (63 notifications).
The low rate of notification during this period ? an average of four per week ? is consistent with the expected
low activity during the period between winter flu seasons (see Figures 1 and 2).
Flu has been notified in residents from all regions of Tasmania (see Table 1). One overseas visitor was diagnosed
with flu whilst in Tasmania.
Influenza A virus was identified as the main cause of flu during this period (see Table 2). Additional laboratory
typing was performed on 12 influenza A samples. Eight samples were identified as being belonging to the
A(H1N1)pdm09 strain while the remaining four were related to A(H3N2).

For more information: DHHS Tasmania

Victoria

Report No. 6: Week ending 12 June 2016
Overview: The 2016 influenza season so far
Measures of influenza‐like illness (ILI) from VicSPIN indicate the season is currently slightly below baseline levels.
The ILI rate from the National Home Doctor Service has been variable but increased to above baseline levels in
the last week.
The number of notified laboratory confirmed influenza cases for the year to 12 June is 19% lower than the same
time in 2015. Of the notified influenza cases, 79% have been type A. VicSPIN detected one influenza A(H3N2)
during the week.
Overall the data from the influenza and ILI surveillance systems indicate the influenza season is just at or slightly
above baseline levels in Victoria

For more information: Victorian Infectious Diseases Reference Laboratory

Western Australia

WEEK ENDING 12TH JUNE 2016
KEY POINTS
INFLUENZA AND INFLUENZA-LIKE ILLNESSES (ILI)
Summary: Indicators of influenza-like illness and influenza either decreased or remained relatively
stable this week, indicating that seasonal activity has not yet started.
 ILI presentations to general practice, detections of influenza virus, and notifications of influenza
cases decreased this week
 Emergency department presentations and admissions remain relatively stable.
 Influenza A (both H1 and H3) and influenza B viruses continue to co-circulate at low levels, with
influenza A/H1 (44%) and influenza B (31%) constituting the majority of detections.
 Non-influenza respiratory viruses decreased or remained stable this week.

For more information: WA Dept.of Health

*Nationally

For the period to Jan 1- Jun 25th, 2016.

NNDSS Australia.png

For national data: National Notifiable Diseases Surveillance System

*Australian Sentinel Practices Research Network (ASPREN)

No. 11, 2016
16th-29th May, 2016

SYNDROMIC SURVEILLANCE
REPORTING
Reports were received from 269 GPs from 8
states and territories during the reporting
period. During weeks 21 and 22 a total of
19,202 and 21,267 consultations were made
respectively.

INFLUENZA-LIKE-ILLNESS (ILI)
Nationally, ILI notifications increased over the period with 96
and 105 notifications in weeks 21 and 22 respectively. ILI
rates reported in this period increased with 5 cases per 1000
consultations in weeks 21 and 22, compared to 3 cases per
1000 consultations in weeks 19 and 20. For the same
reporting period in 2015, ILI rates were similar at 6 and 5
cases per 1000 consultations (see Figure 5). On a state-bystate
basis, it is important to note the increased ILI rate in
Rural NSW (see Figure 2).


For more information: ASPREN

*Flu Tracking

Flutracking Weekly Interim Report
Week ending 19 June 2016

Low levels of influenza-like illness activity

This survey was sent on Monday, 20 June 2016 at 01:13 AM and by 09:00 AM, Thursday 23 June we had received 22846 responses (22451 last week) from 13796 people responding for themselves and 9050 household members across Australia.

Across Australia, fever and cough was reported by 2.0% of vaccinated participants and 2.0% of unvaccinated participants. Fever, cough and absence from normal duties was reported by 1.3% of vaccinated participants and 1.3% of unvaccinated participants.

For participants this week, 13524/22846 (59.2 %) have received the seasonal vaccine so far. Of the 4479 participants who identified as working face-to-face with patients, 3550 (79.3%) have received the vaccine.

For more information: Flu Tracking


*Australian influenza report 2016 - Current report:

No. 1, 2016, REPORTING PERIOD:
28 May to 10 June 2016

KEY MESSAGES
? Influenza activity remains at low levels across Australia.
? Respiratory viruses other than influenza are more commonly causing influenza-like illness presentations to
sentinel general practitioners, with rhinovirus detected most frequently.
? There is no indication of the potential severity of the 2016 season at this time.
? To date, the seasonal influenza vaccines appear to be a good match for circulating virus strains
...
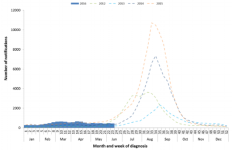
Figure 3. Notifications of laboratory confirmed influenza, Australia, 1 January 2012 to 10 June 2016, by month and
week of diagnosis.

Australia.png
For more information: Department of Health
 
Updated information marked with a *

*New South Wales

NSW Health Influenza Surveillance Report
Week 25: 20 to 26 June 2016

Summary:
 The influenza season has started with activity likely to increase steadily over the next
few weeks. The peak in activity usually occurs 5-8 weeks after the season onset.
 Influenza A(H3N2) and influenza A(H1N1) strains are circulating at similar levels.

In this reporting week:
 Hospital Surveillance – the rate of influenza like illness (ILI) presentations to selected
emergency departments increase and crossed the threshold of 15, consistent with the start of
the influenza.
 Laboratory surveillance – the proportion of respiratory samples positive for influenza increased
slightly but remained relatively low at 5.1%.
 Community surveillance – influenza notifications were up slightly to the previous week in most
local health districts. Data collected from General Practice surveillance systems showed
slightly lower levels of ILI activity. One new influenza outbreak was reported in a rehabilitation
hospital.
 National and international influenza surveillance – Influenza activity remains at low levels
across Australia, with current influenza strains well matched to the 2016 influenza vaccines.
Influenza activity is increasing in other regions in the Southern Hemisphere.
 Recommended composition of 2016 influenza vaccines – the World Health Organization
(WHO) has provided recommendations for the 2016 southern hemisphere winter influenza
season including two strain changes.


For more information: NSW Health - Infectious Diseases

*Queensland

Statewide Weekly Influenza
Surveillance Report
Reporting Period: 1 January to 26 June 2016 Queensland.png


For more information: Queensland Health

South Australia

12 June to 18 June 2016

Twenty-two cases of influenza were reported this week, with 16 cases being characterised as
influenza A and six as influenza B. Cases comprised of eight males and 14 females, with a median
age of 40 years. There have been 869 cases of influenza notified year-to-date, compared with 2,086
cases reported for the same period last year.

The influenza chart shows recent influenza activity in South Australia.

For more information: SA Health

Tasmania

Issue 1 | 9 May 2016

There have been 65 notifications of flu detected in specimens collected from the start of 2016 up to and including
Sunday 24 April 2016. Similar numbers of notifications were received for specimens collected during the identical
January-to-April periods of 2014 (65 notifications) and 2015 (63 notifications).
The low rate of notification during this period ? an average of four per week ? is consistent with the expected
low activity during the period between winter flu seasons (see Figures 1 and 2).
Flu has been notified in residents from all regions of Tasmania (see Table 1). One overseas visitor was diagnosed
with flu whilst in Tasmania.
Influenza A virus was identified as the main cause of flu during this period (see Table 2). Additional laboratory
typing was performed on 12 influenza A samples. Eight samples were identified as being belonging to the
A(H1N1)pdm09 strain while the remaining four were related to A(H3N2).

For more information: DHHS Tasmania

*Victoria

Report No. 7: Week ending 19 June 2016
Overview: The 2016 influenza season so far
Measures of influenza‐like illness (ILI) from VicSPIN indicate the season is currently slightly above baseline levels.
The ILI rate from the National Home Doctor Service decreased but remained above baseline levels in the last
week.
The number of notified laboratory confirmed influenza cases for the year to 19 June is 24% lower than the same
time in 2016. Of the notified influenza cases, 82% have been type A. VicSPIN detected two influenza A(H1N1)pdm
and one influenza A(untyped) during the week.
Overall the data from the influenza and ILI surveillance systems indicate the influenza season remains just at or
slightly above baseline levels in Victoria.

For more information: Victorian Infectious Diseases Reference Laboratory

*Western Australia

WEEK ENDING 19TH JUNE 2016
KEY POINTS
INFLUENZA AND INFLUENZA-LIKE ILLNESSES (ILI)
Summary: Indicators of influenza-like illness and influenza increased this week, although overall
influenza virus detections remain low.
 ILI presentations to sentinel general practices (GPs) and emergency departments (EDs),
detections of influenza virus, and the percent of influenza tests returned positive increased this
week.
 One-half of viruses subtyped this week were influenza A/H1 (48%); influenza B (36%) and
influenza A/H3 (16%) continue to co-circulate.
 Respiratory syncytial virus activity increased this week; other non-influenza respiratory viruses
remained stable.

For more information: WA Dept.of Health

*Nationally

For the period to Jan 1- Jul 2nd, 2016.
NNDSS Australia.png


For national data: National Notifiable Diseases Surveillance System

Australian Sentinel Practices Research Network (ASPREN)

No. 11, 2016
16th-29th May, 2016

SYNDROMIC SURVEILLANCE
REPORTING
Reports were received from 269 GPs from 8
states and territories during the reporting
period. During weeks 21 and 22 a total of
19,202 and 21,267 consultations were made
respectively.

INFLUENZA-LIKE-ILLNESS (ILI)
Nationally, ILI notifications increased over the period with 96
and 105 notifications in weeks 21 and 22 respectively. ILI
rates reported in this period increased with 5 cases per 1000
consultations in weeks 21 and 22, compared to 3 cases per
1000 consultations in weeks 19 and 20. For the same
reporting period in 2015, ILI rates were similar at 6 and 5
cases per 1000 consultations (see Figure 5). On a state-bystate
basis, it is important to note the increased ILI rate in
Rural NSW (see Figure 2).


For more information: ASPREN

*Flu Tracking

Flutracking Weekly Interim Report
Week ending 26 June 2016

Low levels of influenza-like illness activity

This survey was sent on Monday, 27 June 2016 at 01:13 AM and by 09:00 AM, Thursday 30 June we had received 22476 responses (22846 last week) from 13639 people responding for themselves and 8837 household members across Australia.

Across Australia, fever and cough was reported by 1.7% of vaccinated participants and 2.0% of unvaccinated participants. Fever, cough and absence from normal duties was reported by 1.1% of vaccinated participants and 1.4% of unvaccinated participants.

For participants this week, 13465/22476 (59.9 %) have received the seasonal vaccine so far. Of the 4441 participants who identified as working face-to-face with patients, 3545 (79.8%) have received the vaccine.

For more information: Flu Tracking


Australian influenza report 2016 - Current report:

No. 1, 2016, REPORTING PERIOD:
28 May to 10 June 2016

KEY MESSAGES
? Influenza activity remains at low levels across Australia.
? Respiratory viruses other than influenza are more commonly causing influenza-like illness presentations to
sentinel general practitioners, with rhinovirus detected most frequently.
? There is no indication of the potential severity of the 2016 season at this time.
? To date, the seasonal influenza vaccines appear to be a good match for circulating virus strains
...
Figure 3. Notifications of laboratory confirmed influenza, Australia, 1 January 2012 to 10 June 2016, by month and
week of diagnosis.


For more information: Department of Health
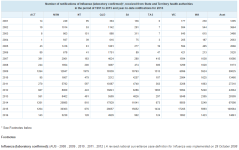
 
Last edited:
Updated information marked with a *

*New South Wales

Week 26: 27 June to 3 July 2016

Summary:
 The influenza season has started and activity continues to increase steadily, particularly
in metropolitan Sydney.
 Influenza A(H3N2) and influenza A(H1N1) strains are circulating at similar levels.
In this reporting week:
 Hospital Surveillance – the rate of influenza like illness (ILI) presentations to selected
emergency departments increased further above the seasonal threshold.
 Laboratory surveillance – the proportion of respiratory samples positive for influenza was 7.2%,
continuing its steady increase.
 Community surveillance – influenza notifications were increased, particularly in metropolitan
Sydney local health districts (LHD). General Practice surveillance systems showed moderate
levels of ILI activity, similar to the previous week. One new influenza outbreak was reported in
a rehabilitation hospital.
 National and international influenza surveillance – influenza activity remains at low levels
across Australia, with current influenza strains well matched to the 2016 influenza vaccines.
Influenza activity is increasing in other regions in the Southern Hemisphere.
 Recommended composition of influenza vaccines – the World Health Organization (WHO)
recommendations for influenza vaccines for the 2016-17 northern hemisphere winter influenza
season are the same as for the 2016 southern hemisphere winter influenza vaccines.


For more information: NSW Health - Infectious Diseases

*Queensland

Statewide Weekly Influenza
Surveillance Report
Reporting Period: 1 January to 3 July 2016 Queensland.png


For more information: Queensland Health

*South Australia

26 June to 2 July 2016

Thirty-eight cases of influenza were reported this week, with 31 cases being characterised as
influenza A and seven as influenza B. Cases comprised of 14 males and 24 females, with a median
age of 39 years. Five (11%) notifications were for children aged less than 10 years and 10 (26%)
notifications for persons aged 65 years or greater. There have been 927 cases of influenza notified
year-to-date, compared with 2,679 cases reported for the same period last year.

The influenza chart shows recent influenza activity in South Australia.

For more information: SA Health

Tasmania

Issue 1 | 9 May 2016

There have been 65 notifications of flu detected in specimens collected from the start of 2016 up to and including
Sunday 24 April 2016. Similar numbers of notifications were received for specimens collected during the identical
January-to-April periods of 2014 (65 notifications) and 2015 (63 notifications).
The low rate of notification during this period – an average of four per week – is consistent with the expected
low activity during the period between winter flu seasons (see Figures 1 and 2).
Flu has been notified in residents from all regions of Tasmania (see Table 1). One overseas visitor was diagnosed
with flu whilst in Tasmania.
Influenza A virus was identified as the main cause of flu during this period (see Table 2). Additional laboratory
typing was performed on 12 influenza A samples. Eight samples were identified as being belonging to the
A(H1N1)pdm09 strain while the remaining four were related to A(H3N2).

For more information: DHHS Tasmania

*Victoria

Report No. 9: Week ending 3 July 2016

Overview: The 2016 influenza season so far
Measures of influenza‐like illness (ILI) from VicSPIN indicate the season is currently slightly above baseline levels.
The ILI rate from the National Home Doctor Service remained above baseline levels in the last week.
The number of notified laboratory confirmed influenza cases for the year to 3 July is 34% lower than the same
time in 2015. Of the notified influenza cases, 80% have been type A. VicSPIN detected one influenza B and one
influenza A(untyped) during the week.
Overall the data from the influenza and ILI surveillance systems indicate the influenza season remains just at or
slightly above baseline levels in Victoria.

For more information: Victorian Infectious Diseases Reference Laboratory

*Western Australia

WEEK ENDING 28TH JUNE 2016
KEY POINTS
INFLUENZA AND INFLUENZA-LIKE ILLNESSES (ILI)
Summary: Indicators of influenza activity remain near seasonal thresholds, indicating the 2016
influenza season has not yet started.
 ILI presentations to sentinel emergency departments (EDs) increased this week.
 Laboratory detections of influenza virus, notifications, and ILI presentations to sentinel general
practitioners (GPs) remain stable this week.
 Influenza A/H1 (34%), influenza A/H3 (37%), and influenza B (26%) are co-circulating, but no
one subtype is predominating.
 Non-influenza respiratory viruses remained stable this week.

For more information: WA Dept.of Health

*Nationally

For the period to Jan 1- Jul 9th, 2016. NNDSS Australia.png


For national data: National Notifiable Diseases Surveillance System

Australian Sentinel Practices Research Network (ASPREN)

No. 11, 2016
16th-29th May, 2016

SYNDROMIC SURVEILLANCE
REPORTING
Reports were received from 269 GPs from 8
states and territories during the reporting
period. During weeks 21 and 22 a total of
19,202 and 21,267 consultations were made
respectively.

INFLUENZA-LIKE-ILLNESS (ILI)
Nationally, ILI notifications increased over the period with 96
and 105 notifications in weeks 21 and 22 respectively. ILI
rates reported in this period increased with 5 cases per 1000
consultations in weeks 21 and 22, compared to 3 cases per
1000 consultations in weeks 19 and 20. For the same
reporting period in 2015, ILI rates were similar at 6 and 5
cases per 1000 consultations (see Figure 5). On a state-bystate
basis, it is important to note the increased ILI rate in
Rural NSW (see Figure 2).


For more information: ASPREN

*Flu Tracking

Flutracking Weekly Interim Report
Week ending 03 July 2016

Low levels of influenza-like illness activity

This survey was sent on Monday, 04 July 2016 at 01:13 AM and by 09:00 AM, Thursday 07 July we had received 22704 responses (22476 last week) from 13751 people responding for themselves and 8953 household members across Australia.

Across Australia, fever and cough was reported by 2.0% of vaccinated participants and 2.5% of unvaccinated participants. Fever, cough and absence from normal duties was reported by 1.3% of vaccinated participants and 1.6% of unvaccinated participants.

For participants this week, 13528/22704 (59.6 %) have received the seasonal vaccine so far. Of the 4450 participants who identified as working face-to-face with patients, 3528 (79.3%) have received the vaccine.

For more information: Flu Tracking


*Australian influenza report 2016 - Current report:

Australian Influenza Surveillance Report No 02 - 11 June to 24 June 2016
Summary

Influenza activity remains at low levels across Australia with increases seen in some areas of the country.
Respiratory viruses other than influenza are more commonly causing influenza-like illness presentations to sentinel general practitioners, with RSV detected most frequently.
While influenza A(H1N1)pdm09 has been the predominant circulating influenza virus so far this year, influenza A(H3N2) has increased in recent weeks in some jurisdictions.
There is no indication of the potential severity of the 2016 season at this time.
To date, the seasonal influenza vaccines appear to be a good match for circulating virus strains.


For more information: Department of Health
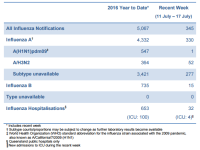
 
Last edited:
Updated information marked with a *

*New South Wales

Week 27: 4 to 10 July 2016
Summary:

 The influenza season has started and activity continues to increase steadily, particularly
in metropolitan Sydney.
 Admissions to critical care wards for pneumonia or influenza-like illness increased
markedly.
 Influenza A(H3N2) and influenza A(H1N1) strains are circulating at similar levels.
In this reporting week:
 Hospital Surveillance ? the rate of influenza like illness (ILI) presentations to selected
emergency departments increased further above the seasonal threshold. Pneumonia and ILI
admissions to critical care wards increased markedly.
 Laboratory surveillance ? the proportion of respiratory samples positive for influenza was
12.2%, continuing its steady increase.
 Community surveillance ? influenza notifications were increased, particularly in metropolitan
Sydney local health districts (LHD). General Practice surveillance systems showed moderate
levels of ILI activity, similar to the previous week. Four new influenza outbreaks were reported
in residential care facilities.
Deaths - The NSW Registry of Births, Deaths, and Marriages have recorded 12 deaths in
association with influenza in 2016. The rate of deaths classified as ?pneumonia and influenza?
remained low.

 National and international influenza surveillance ? influenza activity remains at low levels
across Australia, with current influenza strains well matched to the 2016 influenza vaccines.
Influenza activity is increasing in other regions in the Southern Hemisphere.

For more information: NSW Health - Infectious Diseases

*Queensland

Statewide Weekly Influenza
Surveillance Report
Reporting Period: 1 January to 10 July 2016
Queensland.png


For more information: Queensland Health

South Australia

26 June to 2 July 2016

Thirty-eight cases of influenza were reported this week, with 31 cases being characterised as
influenza A and seven as influenza B. Cases comprised of 14 males and 24 females, with a median
age of 39 years. Five (11%) notifications were for children aged less than 10 years and 10 (26%)
notifications for persons aged 65 years or greater. There have been 927 cases of influenza notified
year-to-date, compared with 2,679 cases reported for the same period last year.

The influenza chart shows recent influenza activity in South Australia.

For more information: SA Health

*Tasmania

Issue 2 | 15 July 2016

 Influenza activity remained at the low ?baseline? level despite a small increase in testing.
 The 2016 winter flu season has not commenced.
 Surveillance of influenza-like illness by General Practice and FluTracking continued to indicate minimal
activity during this period.
 Laboratory tests of nose and throat swabs indicated that other respiratory pathogens were the main
cause of influenza-like illness during May and June.

Since the report of 9 May a further 57 notifications of influenza were received, with 49 relating to influenza
detected in specimens collected during May and June. The total number of influenza notifications since the
start of 2016 is 122. Notifications of influenza during May and June were similar to March and April (see Table
1). Weekly influenza counts at the end of June remained low and indicated that the winter influenza season had
not commenced (see Figure 1). For comparison, more influenza had been reported by the end of June 2015 (154
notifications) with the 2015 influenza season in Tasmania having commenced during June 2015.

During May and June Influenza A virus was the most common cause of influenza in Tasmania (see Table 2). To
date, additional laboratory typing has been performed on 20 samples of influenza A virus. Fifteen samples were
the A(H1N1)pdm09 strain while the remaining five were A(H3N2). The 2016 annual influenza vaccine covers
both of these strains. See Annual Influenza Vaccine (page 6).


For more information: DHHS Tasmania

*Victoria

Report No. 10: Week ending 10 July 2016

Overview: The 2016 influenza season so far
Measures of influenza‐like illness (ILI) from VicSPIN indicate the season is currently slightly above baseline levels.
The ILI rate from the National Home Doctor Service remained above baseline levels in the last week.
The number of notified laboratory confirmed influenza cases for the year to 3 July is 39% lower than the same
time in 2015. Of the notified influenza cases, 82% have been type A. VicSPIN detected one influenza A(untyped)
during the week.
Overall the data from the influenza and ILI surveillance systems indicate the influenza season remains just at or
slightly above baseline levels in Victoria.

For more information: Victorian Infectious Diseases Reference Laboratory

*Western Australia

WEEK ENDING 3RD JULY 2016

Summary: Some indicators of influenza activity have increased above seasonal thresholds, indicating
the 2016 influenza season will likely commence soon.
? Laboratory detections of influenza virus and notifications increased this week.
? ILI presentations to sentinel emergency departments (EDs) and general practitioners (GPs)
decreased slightly this week.
? Influenza A/H1 (41%), influenza A/H3 (24%), and influenza B (35%) are co-circulating, but no
one subtype is predominating.
? Respiratory syncytial virus activity increased this week.

For more information: WA Dept.of Health

*Nationally

For the period to Jan 1- Jul 16th, 2016.
NNDSS Australia.png

For national data: National Notifiable Diseases Surveillance System

Australian Sentinel Practices Research Network (ASPREN)

No. 11, 2016
16th-29th May, 2016

SYNDROMIC SURVEILLANCE
REPORTING
Reports were received from 269 GPs from 8
states and territories during the reporting
period. During weeks 21 and 22 a total of
19,202 and 21,267 consultations were made
respectively.

INFLUENZA-LIKE-ILLNESS (ILI)
Nationally, ILI notifications increased over the period with 96
and 105 notifications in weeks 21 and 22 respectively. ILI
rates reported in this period increased with 5 cases per 1000
consultations in weeks 21 and 22, compared to 3 cases per
1000 consultations in weeks 19 and 20. For the same
reporting period in 2015, ILI rates were similar at 6 and 5
cases per 1000 consultations (see Figure 5). On a state-bystate
basis, it is important to note the increased ILI rate in
Rural NSW (see Figure 2).


For more information: ASPREN

*Flu Tracking

Flutracking Weekly Interim Report
Week ending 10 July 2016

Low levels of influenza-like illness activity

This survey was sent on Monday, 11 July 2016 at 01:13 AM and by 09:00 AM, Thursday 14 July we had received
22463 responses (22704 last week) from 13679 people responding for themselves and 8784 household members
across Australia.

Across Australia, fever and cough was reported by 2.1% of
vaccinated participants and 2.1% of unvaccinated
participants. Fever, cough and absence from normal duties
was reported by 1.4% of vaccinated participants and 1.5%
of unvaccinated participants.

For participants this week, 13513/22463 (60.2 %) have
received the seasonal vaccine so far. Of the 4364
participants who identified as working face-to-face with
patients, 3484 (79.8%) have received the vaccine.

For more information: Flu Tracking


Australian influenza report 2016 - Current report:

Australian Influenza Surveillance Report No 02 - 11 June to 24 June 2016
Summary

Influenza activity remains at low levels across Australia with increases seen in some areas of the country.
Respiratory viruses other than influenza are more commonly causing influenza-like illness presentations to sentinel general practitioners, with RSV detected most frequently.
While influenza A(H1N1)pdm09 has been the predominant circulating influenza virus so far this year, influenza A(H3N2) has increased in recent weeks in some jurisdictions.
There is no indication of the potential severity of the 2016 season at this time.
To date, the seasonal influenza vaccines appear to be a good match for circulating virus strains.


For more information: Department of Health
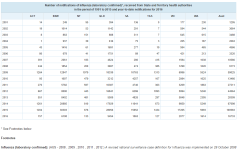
 
Updated information marked with a *

*New South Wales

Week 28: 11 to 17 July 2016
Summary:

Summary:
 The influenza season has started and activity continues to increase steadily, particularly
in metropolitan Sydney.
 Influenza A(H3N2) is the dominant circulating influenza strain.


In this reporting week:
 Hospital Surveillance ? the rate of influenza like illness (ILI) presentations to selected
emergency departments decreased this week but remains above the seasonal threshold.
 Laboratory surveillance ? the proportion of respiratory samples positive for influenza was
14.3%, continuing its steady increase.
 Community surveillance ? influenza notifications were increased, particularly in metropolitan
Sydney local health districts (LHD). General Practice surveillance systems showed moderate
levels of ILI activity, similar to the previous week.
Influenza activity has increased in the aged care sector with 11 new respiratory outbreaks
reported this week in residential aged care facilities.
 National and international influenza surveillance influenza activity is variable across Australia,
increasing in some regions, while low and stable in others. Current influenza strains are well
matched to the 2016 influenza vaccines. Influenza activity is increasing in other regions in the
Southern Hemisphere.

For more information: NSW Health - Infectious Diseases

*Queensland

Statewide Weekly Influenza
Surveillance Report
Reporting Period: 1 January to 17 July 2016
Queensland.png

For more information: Queensland Health

*South Australia

10 July to 16 July 2016

Fifty-seven cases of influenza were reported this week with 52 cases being characterised as influenza
A and five as influenza B. Cases comprised of 25 males and 32 females, with a median age of 41
years. Eight (14%) notifications were for children aged less than 10 years and 13 (23%) notifications
for persons aged 65 years or greater. There have been 1,028 cases of influenza notified year-to-date,
compared with 3,521 cases reported for the same period last year.

The influenza chart shows recent influenza activity in South Australia.

For more information: SA Health

Tasmania

Issue 2 | 15 July 2016

 Influenza activity remained at the low ‘baseline’ level despite a small increase in testing.
 The 2016 winter flu season has not commenced.
 Surveillance of influenza-like illness by General Practice and FluTracking continued to indicate minimal
activity during this period.
 Laboratory tests of nose and throat swabs indicated that other respiratory pathogens were the main
cause of influenza-like illness during May and June.

Since the report of 9 May a further 57 notifications of influenza were received, with 49 relating to influenza
detected in specimens collected during May and June. The total number of influenza notifications since the
start of 2016 is 122. Notifications of influenza during May and June were similar to March and April (see Table
1). Weekly influenza counts at the end of June remained low and indicated that the winter influenza season had
not commenced (see Figure 1). For comparison, more influenza had been reported by the end of June 2015 (154
notifications) with the 2015 influenza season in Tasmania having commenced during June 2015.

During May and June Influenza A virus was the most common cause of influenza in Tasmania (see Table 2). To
date, additional laboratory typing has been performed on 20 samples of influenza A virus. Fifteen samples were
the A(H1N1)pdm09 strain while the remaining five were A(H3N2). The 2016 annual influenza vaccine covers
both of these strains. See Annual Influenza Vaccine (page 6).


For more information: DHHS Tasmania

Victoria

Report No. 10: Week ending 10 July 2016

Overview: The 2016 influenza season so far
Measures of influenza‐like illness (ILI) from VicSPIN indicate the season is currently slightly above baseline levels.
The ILI rate from the National Home Doctor Service remained above baseline levels in the last week.
The number of notified laboratory confirmed influenza cases for the year to 3 July is 39% lower than the same
time in 2015. Of the notified influenza cases, 82% have been type A. VicSPIN detected one influenza A(untyped)
during the week.
Overall the data from the influenza and ILI surveillance systems indicate the influenza season remains just at or
slightly above baseline levels in Victoria.

For more information: Victorian Infectious Diseases Reference Laboratory

*Western Australia

WEEK ENDING 10TH JULY 2016

KEY POINTS
INFLUENZA AND INFLUENZA-LIKE ILLNESSES (ILI)
Summary: Most indicators of influenza activity are increasing and are currently above seasonal
thresholds, indicating the 2016 influenza season has commenced.
 ILI presentations to sentinel emergency departments (EDs) and general practitioners (GPs)
increased this week.
 The percent of tests positive for influenza virus and notifications of laboratory-confirmed
influenza cases are increasing.
 Hospital admissions in influenza cases are around average levels for this time of year.
 Influenza A/H1 (27%), influenza A/H3 (25%), and influenza B (47%) are co-circulating, with no
one subtype is predominating yet.
 Non-influenza respiratory virus activity remains elevated but lower than levels for the
corresponding period in 2015.

For more information: WA Dept.of Health

*Nationally

For the period to Jan 1- Jul 23rd, 2016. NNDSS Australia.png


For national data: National Notifiable Diseases Surveillance System

*Australian Sentinel Practices Research Network (ASPREN)

No. 12, 2016
30th May-19th June, 2016

SYNDROMIC SURVEILLANCE
REPORTING
Reports were received from 285 GPs from 8
states and territories during the reporting
period. During weeks 23 and 24 a total of
21,244 and 19,905 consultations were made
respectively.

INFLUENZA-LIKE-ILLNESS (ILI)
Nationally, ILI notifications decreased slightly over the period
with 110 and 129 notifications in weeks 23 and 24
respectively. ILI rates reported in this period were similar with
6 and 8 cases per 1000 consultations in weeks 23 and 24
respectively, compared to 5 and 8 cases per 1000
consultations in weeks 21 and 22 respectively. For the same
reporting period in 2015, ILI rates were similar at 7 cases per
1000 consultations (see Figure 5). On a state-by-state basis,
it is important to note the increased ILI rate in Urban ACT
(see Figure 2).

For more information: ASPREN

*Flu Tracking

Flutracking Weekly Interim Report
Week ending 17 July 2016

Low levels of influenza-like illness activity

This survey was sent on Monday, 18 July 2016 at 01:13 AM and by 09:00 AM, Thursday 21 July we had received 22998 responses (22463 last week) from 13905 people responding for themselves and 9093 household members across Australia.

Across Australia, fever and cough was reported by 2.2% of vaccinated participants and 2.0% of unvaccinated participants. Fever, cough and absence from normal duties was reported by 1.5% of vaccinated participants and 1.3% of unvaccinated participants.

For participants this week, 13761/22998 (59.8 %) have received the seasonal vaccine so far. Of the 4488 participants who identified as working face-to-face with patients, 3579 (79.7%) have received the vaccine.

For more information: Flu Tracking


*Australian influenza report 2016 - Current report:

Australian Influenza Surveillance Report No 03 - 25 June to 08 July 2016

Summary
Influenza activity is variable across Australia; increasing in some regions, while low and stable in others.
Respiratory viruses other than influenza are more commonly causing influenza-like illness (ILI) in the community, with respiratory syncytial virus (RSV) and rhinovirus most commonly the cause of ILI presentations to sentinel general practitioners and various non-influenza viruses being detected by sentinel laboratories.
Nationally, influenza A(H1N1)pdm09 has been the predominant influenza virus circulating so far this year. However in the last fortnight influenza A(H1N1)pdm09 and influenza A(H3N2) circulated at similar levels nationally, noting jurisdictional variation.
To date, the seasonal influenza vaccines appear to be a good match for circulating virus strains.

Australia.png

For more information: Department of Health
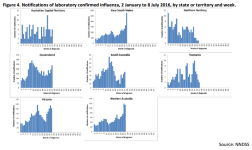
 
Updated information marked with a *

*New South Wales

Week 29: 18 to 24 July 2016
Summary:
 Seasonal influenza activity continues to rise, particularly in metropolitan areas.
 Influenza A(H3N2) is the dominant circulating influenza strain.

In this reporting week:
 Hospital Surveillance ? the rate of influenza like illness (ILI) presentations to selected
emergency departments rose sharply and remains well above the seasonal threshold.
 Laboratory surveillance ? the proportion of respiratory samples positive for influenza increased
to 18.7%, continuing its steady rise.
 Community surveillance ? influenza notifications were increased, particularly in metropolitan
Sydney local health districts (LHD). General Practice surveillance systems showed moderate
levels of ILI activity, similar to the previous week. Influenza activity continues to be impacting
heavily on the aged care sector with 13 new respiratory outbreaks reported this week in
residential aged care facilities.
 National and international influenza surveillance ? the most recent national reports suggest
influenza activity is still variable across Australia, increasing in some regions, while low and
stable in others. Current influenza strains are well matched to the 2016 influenza vaccines.
Influenza activity is increasing in other regions in the Southern Hemisphere.


For more information: NSW Health - Infectious Diseases

*Queensland

Statewide Weekly Influenza
Surveillance Report
Reporting Period: 1 January to 24 July 2016 Queensland.png

For more information: Queensland Health

*South Australia

17 July to 23 July 2016

Eighty-five cases of influenza were reported this week with 75 cases being characterised as influenza
A and ten as influenza B. Cases comprised of 42 males and 43 females, with a median age of 43
years. Eleven (13%) notifications were for children aged less than 10 years and 19 (22%) notifications
for persons aged 65 years or greater. There have been 1,113 cases of influenza notified year-to-date,
compared with 4,033 cases reported for the same period last year

The influenza chart shows recent influenza activity in South Australia.

For more information: SA Health

Tasmania

Issue 2 | 15 July 2016

 Influenza activity remained at the low ?baseline? level despite a small increase in testing.
 The 2016 winter flu season has not commenced.
 Surveillance of influenza-like illness by General Practice and FluTracking continued to indicate minimal
activity during this period.
 Laboratory tests of nose and throat swabs indicated that other respiratory pathogens were the main
cause of influenza-like illness during May and June.

Since the report of 9 May a further 57 notifications of influenza were received, with 49 relating to influenza
detected in specimens collected during May and June. The total number of influenza notifications since the
start of 2016 is 122. Notifications of influenza during May and June were similar to March and April (see Table
1). Weekly influenza counts at the end of June remained low and indicated that the winter influenza season had
not commenced (see Figure 1). For comparison, more influenza had been reported by the end of June 2015 (154
notifications) with the 2015 influenza season in Tasmania having commenced during June 2015.

During May and June Influenza A virus was the most common cause of influenza in Tasmania (see Table 2). To
date, additional laboratory typing has been performed on 20 samples of influenza A virus. Fifteen samples were
the A(H1N1)pdm09 strain while the remaining five were A(H3N2). The 2016 annual influenza vaccine covers
both of these strains. See Annual Influenza Vaccine (page 6).


For more information: DHHS Tasmania

*Victoria

Report No. 12: Week ending 24 July 2016

Overview: The 2016 influenza season so far
Measures of influenza‐like illness (ILI) from VicSPIN indicate the season is currently slightly above baseline levels.
The ILI rate from the National Home Doctor Service remained above baseline levels in the last week.
The number of notified laboratory confirmed influenza cases for the year to 24 July is 46% lower than the same
time in 2015. Of the notified influenza cases, 83% have been type A. VicSPIN detected three positive influenza
A(H3N2), two positive influenza A(H1N1)pdm2009 and two influenza A(untyped) during the week.
Overall the data from the influenza and ILI surveillance systems indicate the influenza season remains just at or
slightly above baseline levels in Victoria.

For more information: Victorian Infectious Diseases Reference Laboratory

*Western Australia

WEEK ENDING 17TH JULY 2016

KEY POINTS
INFLUENZA AND INFLUENZA-LIKE ILLNESSES (ILI)
Summary: Direct indicators of influenza activity continue to increase, but levels of influenza-like illness
remain low for this time of year, perhaps reflecting relatively low levels of non-influenza respiratory virus
activity.
 ILI presentations to sentinel general practitioners (GPs) increased this week, while presentations to
sentinel emergency departments (EDs) decreased slightly, but both remain relatively low for this
time of year.
 The percent of tests positive for influenza virus and notifications of laboratory-confirmed influenza
cases continue to increase.
 Hospital admissions in notified influenza cases are below average levels for this time of year.
 Influenza A/H1 (10%), influenza A/H3 (39%), and influenza B (51%) are co-circulating, with a
relative increase in the proportion of A/H3 cases and decrease in A/H1 cases compared to
previous weeks.
 Non-influenza respiratory virus activity remains lower than levels for the corresponding period in
2015.

For more information: WA Dept.of Health

*Nationally

For the period to Jan 1- Jul 30th, 2016.
NNDSS Australia.png

For national data: National Notifiable Diseases Surveillance System

*Australian Sentinel Practices Research Network (ASPREN)

No. 13, 2016
20th June-3rd July, 2016

SYNDROMIC SURVEILLANCE
REPORTING
Reports were received from 297 GPs from 8
states and territories during the reporting
period. During weeks 25 and 26 a total of
22,161 and 20,202 consultations were made
respectively.

INFLUENZA-LIKE-ILLNESS (ILI)
Nationally, ILI notifications increased over the period with 135
and 128 notifications in weeks 25 and 26 respectively. ILI
rates reported in this period were similar with 7 and 8 cases
weighted / 6 cases unweighted per 1000 consultations in
weeks 25 and 26 respectively, compared to 6 and 8 cases
weighted / 5 and 6 unweighted per 1000 consultations in
weeks 23 and 24 respectively. For the same reporting period
in 2015, ILI rates were slightly higher at 8 and 9 cases
weighted / 7 and 8 unweighted per 1000 consultations (see
Figure 5). On a state-by-state basis, it is important to note the
increased ILI rate in Urban ACT (see Figure 2)

For more information: ASPREN

*Flu Tracking

Flutracking Weekly Interim Report
Week ending 24 July 2016

Low levels of influenza-like illness activity

This survey was sent on Monday, 25 July 2016 at 01:13 AM and by 09:00 AM, Thursday 28 July we had received 23174 responses (22998 last week) from 14014 people responding for themselves and 9160 household members across Australia.

Across Australia, fever and cough was reported by 1.9% of vaccinated participants and 2.3% of unvaccinated participants. Fever, cough and absence from normal duties was reported by 1.3% of vaccinated participants and 1.5% of unvaccinated participants.

For participants this week, 13916/23174 (60.1 %) have received the seasonal vaccine so far. Of the 4531 participants who identified as working face-to-face with patients, 3604 (79.5%) have received the vaccine.

For more information: Flu Tracking


*Australian influenza report 2016 - Current report:

Australian Influenza Surveillance Report No 04 - 09 July to 22 July 2016

Summary
In the fortnight ending 22 July 2016, influenza activity at the national level was increasing and indicative of early influenza seasonal activity, however there were some regions within Australia where activity remained unchanged.
Influenza was the most common cause of influenza-like illness (ILI) presentations to sentinel general practitioners.
Influenza A(H3N2) was the predominant influenza virus circulating nationally in recent weeks, noting jurisdictional variation.
Influenza A(H3N2) is typically more prevalent in older age groups.
So far this year, influenza notification rates have been highest in children aged less than 5 years and adults aged 85 years or older, with a secondary peak in adults aged 35-39 years.
To date, the seasonal influenza vaccines appear to be a good match for circulating virus strains.

Australia.png
For more information: Department of Health
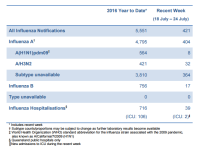
 
Updated information marked with a *

*New South Wales

Week 30: 25 July to 31 July 2016
Summary:
? Seasonal influenza activity continues to rise steadily.
? Influenza A(H3N2) is the dominant circulating influenza strain.
In this reporting week:
? Hospital Surveillance ? the rate of influenza like illness (ILI) presentations to selected
emergency departments was stable and remains well above the seasonal threshold.
? Laboratory surveillance ? the proportion of respiratory samples positive for influenza increased
to 21.4%, continuing its steady rise.
? Community surveillance ? influenza notifications were increased across most local health
districts (LHD). Influenza activity continues to impact heavily on the aged care sector with 4
new respiratory outbreaks reported this week in residential aged care facilities.
? National and international influenza surveillance ? the most recent national reports suggest
influenza activity is increasing across Australia, although activity is unchanged in some areas.
Current influenza strains are well matched to the 2016 influenza vaccines. Influenza activity is
increasing in some other regions in the Southern Hemisphere.


For more information: NSW Health - Infectious Diseases

*Queensland
Statewide Weekly Influenza
Surveillance Report
Reporting Period: 1 January to 31 July 2016

Queensland.png

For more information: Queensland Health

*South Australia

24 July to 30 July 2016

One hundred and thirteen cases of influenza were reported this week with 104 cases being
characterised as influenza A and nine as influenza B. Cases comprised of 56 males and 57 females,
with a median age of 34 years. Eleven (10%) notifications were for children aged less than 10 years
and 19 (17%) notifications for persons aged 65 years or greater. There have been 1,226 cases of
influenza notified year-to-date, compared with 4,628 cases reported for the same period last year

The influenza chart shows recent influenza activity in South Australia.

For more information: SA Health

Tasmania

Issue 2 | 15 July 2016

 Influenza activity remained at the low ‘baseline’ level despite a small increase in testing.
 The 2016 winter flu season has not commenced.
 Surveillance of influenza-like illness by General Practice and FluTracking continued to indicate minimal
activity during this period.
 Laboratory tests of nose and throat swabs indicated that other respiratory pathogens were the main
cause of influenza-like illness during May and June.

Since the report of 9 May a further 57 notifications of influenza were received, with 49 relating to influenza
detected in specimens collected during May and June. The total number of influenza notifications since the
start of 2016 is 122. Notifications of influenza during May and June were similar to March and April (see Table
1). Weekly influenza counts at the end of June remained low and indicated that the winter influenza season had
not commenced (see Figure 1). For comparison, more influenza had been reported by the end of June 2015 (154
notifications) with the 2015 influenza season in Tasmania having commenced during June 2015.

During May and June Influenza A virus was the most common cause of influenza in Tasmania (see Table 2). To
date, additional laboratory typing has been performed on 20 samples of influenza A virus. Fifteen samples were
the A(H1N1)pdm09 strain while the remaining five were A(H3N2). The 2016 annual influenza vaccine covers
both of these strains. See Annual Influenza Vaccine (page 6).


For more information: DHHS Tasmania

*Victoria

Report No. 13: Week ending 31 July 2016

Overview: The 2016 influenza season so far
Measures of influenza‐like illness (ILI) from VicSPIN indicate the season is currently below baseline levels. The ILI
rate from the National Home Doctor Service remained above baseline levels in the last week.
The number of notified laboratory confirmed influenza cases for the year to 31 July is 48% lower than the same
time in 2015. Of the notified influenza cases, 83% have been type A. VicSPIN detected five positive influenza
A(H3N2) and two positive influenza A(H1N1)pdm2009 during the week.
Overall the data from the influenza and ILI surveillance systems indicate the influenza season remains just at or
slightly below baseline levels in Victoria.

For more information: Victorian Infectious Diseases Reference Laboratory

Western Australia

WEEK ENDING 17TH JULY 2016

KEY POINTS
INFLUENZA AND INFLUENZA-LIKE ILLNESSES (ILI)
Summary: Direct indicators of influenza activity continue to increase, but levels of influenza-like illness
remain low for this time of year, perhaps reflecting relatively low levels of non-influenza respiratory virus
activity.
 ILI presentations to sentinel general practitioners (GPs) increased this week, while presentations to
sentinel emergency departments (EDs) decreased slightly, but both remain relatively low for this
time of year.
 The percent of tests positive for influenza virus and notifications of laboratory-confirmed influenza
cases continue to increase.
 Hospital admissions in notified influenza cases are below average levels for this time of year.
 Influenza A/H1 (10%), influenza A/H3 (39%), and influenza B (51%) are co-circulating, with a
relative increase in the proportion of A/H3 cases and decrease in A/H1 cases compared to
previous weeks.
 Non-influenza respiratory virus activity remains lower than levels for the corresponding period in
2015.

For more information: WA Dept.of Health

*Nationally

For the period to Jan 1- Aug 6th, 2016.
NNDSS Australia.png

For national data: National Notifiable Diseases Surveillance System

Australian Sentinel Practices Research Network (ASPREN)

No. 13, 2016
20th June-3rd July, 2016

SYNDROMIC SURVEILLANCE
REPORTING
Reports were received from 297 GPs from 8
states and territories during the reporting
period. During weeks 25 and 26 a total of
22,161 and 20,202 consultations were made
respectively.

INFLUENZA-LIKE-ILLNESS (ILI)
Nationally, ILI notifications increased over the period with 135
and 128 notifications in weeks 25 and 26 respectively. ILI
rates reported in this period were similar with 7 and 8 cases
weighted / 6 cases unweighted per 1000 consultations in
weeks 25 and 26 respectively, compared to 6 and 8 cases
weighted / 5 and 6 unweighted per 1000 consultations in
weeks 23 and 24 respectively. For the same reporting period
in 2015, ILI rates were slightly higher at 8 and 9 cases
weighted / 7 and 8 unweighted per 1000 consultations (see
Figure 5). On a state-by-state basis, it is important to note the
increased ILI rate in Urban ACT (see Figure 2)

For more information: ASPREN

*Flu Tracking

Flutracking Weekly Interim Report
Week ending 31 July 2016

Low levels of influenza-like illness activity

This survey was sent on Monday, 01 August 2016 at 01:13 AM and by 09:00 AM, Thursday 04 August we had received 23285 responses (23174 last week) from 14048 people responding for themselves and 9237 household members across Australia.

Across Australia, fever and cough was reported by 2.1% of vaccinated participants and 2.6% of unvaccinated participants. Fever, cough and absence from normal duties was reported by 1.4% of vaccinated participants and 1.8% of unvaccinated participants.

For participants this week, 13941/23285 (59.9 %) have received the seasonal vaccine so far. Of the 4562 participants who identified as working face-to-face with patients, 3631 (79.6%) have received the vaccine.

For more information: Flu Tracking


Australian influenza report 2016 - Current report:

Australian Influenza Surveillance Report No 04 - 09 July to 22 July 2016

Summary
In the fortnight ending 22 July 2016, influenza activity at the national level was increasing and indicative of early influenza seasonal activity, however there were some regions within Australia where activity remained unchanged.
Influenza was the most common cause of influenza-like illness (ILI) presentations to sentinel general practitioners.
Influenza A(H3N2) was the predominant influenza virus circulating nationally in recent weeks, noting jurisdictional variation.
Influenza A(H3N2) is typically more prevalent in older age groups.
So far this year, influenza notification rates have been highest in children aged less than 5 years and adults aged 85 years or older, with a secondary peak in adults aged 35-39 years.
To date, the seasonal influenza vaccines appear to be a good match for circulating virus strains.

For more information: Department of Health
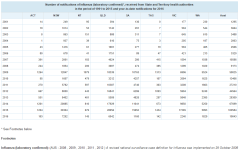
 
Updated information marked with a *

*New South Wales

Week 31: 1 August to 7 August 2016

Summary:
 Seasonal influenza activity continues to rise steadily and is currently following a similar
course to last year (2015).
 Influenza A(H3N2) is the dominant circulating influenza strain.
In this reporting week:
 Hospital Surveillance ? the rate of influenza like illness (ILI) presentations to selected
emergency departments increased and remains well above the seasonal threshold.
 Laboratory surveillance ? the total number of influenza isolations continues to rise along with
the proportion of respiratory samples positive for influenza (25%).
 Community surveillance ? influenza notifications were increased across most local health
districts (LHD). General Practice and community-based surveillance systems showed easing
ILI activity. Influenza activity continues to impact heavily on the aged care sector with 19 new
respiratory outbreaks reported this week in residential aged care facilities.
 National and international influenza surveillance ? the most recent national reports suggest
influenza activity is increasing across Australia, although activity is unchanged in some areas.
Current influenza strains are well matched to the 2016 influenza vaccines. Influenza activity is
increasing in some other regions in the Southern Hemisphere.


For more information: NSW Health - Infectious Diseases

*Queensland
Statewide Weekly Influenza
Surveillance Report
Reporting Period: 1 January to 7 August 2016
Queensland.png

For more information: Queensland Health

*South Australia

31 July to 6 August 2016

One hundred and twenty-nine cases of influenza were reported this week with 119 cases being
characterised as influenza A and ten as influenza B. Cases comprised of 62 males and 67 females,
with a median age of 30 years. Thirty (23%) notifications were for children aged less than 10 years
and 22 (17%) notifications for persons aged 65 years or greater. There have been 1,357 cases of
influenza notified year-to-date, compared with 5,517 cases reported for the same period last year

The influenza chart shows recent influenza activity in South Australia.

For more information: SA Health

Tasmania

Issue 2 | 15 July 2016

 Influenza activity remained at the low ?baseline? level despite a small increase in testing.
 The 2016 winter flu season has not commenced.
 Surveillance of influenza-like illness by General Practice and FluTracking continued to indicate minimal
activity during this period.
 Laboratory tests of nose and throat swabs indicated that other respiratory pathogens were the main
cause of influenza-like illness during May and June.

Since the report of 9 May a further 57 notifications of influenza were received, with 49 relating to influenza
detected in specimens collected during May and June. The total number of influenza notifications since the
start of 2016 is 122. Notifications of influenza during May and June were similar to March and April (see Table
1). Weekly influenza counts at the end of June remained low and indicated that the winter influenza season had
not commenced (see Figure 1). For comparison, more influenza had been reported by the end of June 2015 (154
notifications) with the 2015 influenza season in Tasmania having commenced during June 2015.

During May and June Influenza A virus was the most common cause of influenza in Tasmania (see Table 2). To
date, additional laboratory typing has been performed on 20 samples of influenza A virus. Fifteen samples were
the A(H1N1)pdm09 strain while the remaining five were A(H3N2). The 2016 annual influenza vaccine covers
both of these strains. See Annual Influenza Vaccine (page 6).


For more information: DHHS Tasmania

Victoria

Report No. 13: Week ending 31 July 2016

Overview: The 2016 influenza season so far
Measures of influenza‐like illness (ILI) from VicSPIN indicate the season is currently below baseline levels. The ILI
rate from the National Home Doctor Service remained above baseline levels in the last week.
The number of notified laboratory confirmed influenza cases for the year to 31 July is 48% lower than the same
time in 2015. Of the notified influenza cases, 83% have been type A. VicSPIN detected five positive influenza
A(H3N2) and two positive influenza A(H1N1)pdm2009 during the week.
Overall the data from the influenza and ILI surveillance systems indicate the influenza season remains just at or
slightly below baseline levels in Victoria.

For more information: Victorian Infectious Diseases Reference Laboratory

*Western Australia

WEEK ENDING 31ST JULY 2016

KEY POINTS
INFLUENZA AND INFLUENZA-LIKE ILLNESSES (ILI)
Summary: Direct indicators of influenza activity continue to increase, but levels of influenza-like illness are
relatively stable and remain low for this time of year, perhaps reflecting relatively low levels of non-influenza
respiratory virus activity.
 ILI presentations to sentinel general practitioners (GPs) remain relatively low for this time of year,
whilst ILI presentations to sentinel emergency departments (EDs) are now in the mid-range of values
seen at this time of year.
 The percent of tests positive for influenza virus and notifications of laboratory-confirmed influenza
continue to increase and their levels are now similar to those experienced at the corresponding time in
the past two years.
 Hospital admissions with notified influenza have been relatively stable in recent weeks and levels are
around or below the average for this time of year.
 Influenza A/H3 (60% of detections) is now the dominant circulating virus, along with influenza B (33%),
with a continuing decline in the proportion of influenza A/H1 (7%) cases identified.
 Non-influenza respiratory virus activity remains well below levels for the corresponding period in 2015.

For more information: WA Dept.of Health

*Nationally

For the period to Jan 1- Aug 13th, 2016.
NNDSS Australia.png

For national data: National Notifiable Diseases Surveillance System

Australian Sentinel Practices Research Network (ASPREN)

No. 13, 2016
20th June-3rd July, 2016

SYNDROMIC SURVEILLANCE
REPORTING
Reports were received from 297 GPs from 8
states and territories during the reporting
period. During weeks 25 and 26 a total of
22,161 and 20,202 consultations were made
respectively.

INFLUENZA-LIKE-ILLNESS (ILI)
Nationally, ILI notifications increased over the period with 135
and 128 notifications in weeks 25 and 26 respectively. ILI
rates reported in this period were similar with 7 and 8 cases
weighted / 6 cases unweighted per 1000 consultations in
weeks 25 and 26 respectively, compared to 6 and 8 cases
weighted / 5 and 6 unweighted per 1000 consultations in
weeks 23 and 24 respectively. For the same reporting period
in 2015, ILI rates were slightly higher at 8 and 9 cases
weighted / 7 and 8 unweighted per 1000 consultations (see
Figure 5). On a state-by-state basis, it is important to note the
increased ILI rate in Urban ACT (see Figure 2)

For more information: ASPREN

*Flu Tracking

Flutracking Weekly Interim Report
Week ending 7 August 2016

Low levels of influenza-like illness activity

This survey was sent on Monday, 08 August 2016 at 01:13 AM and by 09:00 AM, Thursday 11 August we had received 23220 responses (23285 last week) from 14005 people responding for themselves and 9215 household members across Australia.

Across Australia, fever and cough was reported by 2.0% of vaccinated participants and 2.7% of unvaccinated participants. Fever, cough and absence from normal duties was reported by 1.5% of vaccinated participants and 2.0% of unvaccinated participants.

For participants this week, 13993/23220 (60.3 %) have received the seasonal vaccine so far. Of the 4545 participants who identified as working face-to-face with patients, 3651 (80.3%) have received the vaccine.

For more information: Flu Tracking


Australian influenza report 2016 - Current report:

Australian Influenza Surveillance Report No 04 - 09 July to 22 July 2016

Summary
In the fortnight ending 22 July 2016, influenza activity at the national level was increasing and indicative of early influenza seasonal activity, however there were some regions within Australia where activity remained unchanged.
Influenza was the most common cause of influenza-like illness (ILI) presentations to sentinel general practitioners.
Influenza A(H3N2) was the predominant influenza virus circulating nationally in recent weeks, noting jurisdictional variation.
Influenza A(H3N2) is typically more prevalent in older age groups.
So far this year, influenza notification rates have been highest in children aged less than 5 years and adults aged 85 years or older, with a secondary peak in adults aged 35-39 years.
To date, the seasonal influenza vaccines appear to be a good match for circulating virus strains.

For more information: Department of Health
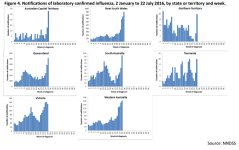
 
  • Updated information marked with a *

    *
    New South Wales

    Week 32: 8 August to 14 August 2016
    Summary:
     Seasonal influenza activity continues to rise steadily and is currently following a similar
    course to last year (2015).
     Influenza A(H3N2) is the dominant circulating influenza strain.
    In this reporting week:
     Hospital Surveillance – the rate of influenza like illness (ILI) presentations to selected
    emergency departments increased and remains well above the seasonal threshold.
     Laboratory surveillance – the total number of influenza isolations continues to rise along with
    the proportion of respiratory samples positive for influenza (29.2%).
     Community surveillance – influenza notifications were increased across most local health
    districts (LHD). General Practice and community-based surveillance systems suggest
    increased ILI activity. Influenza activity continues to impact heavily on the aged care sector
    with 20 new respiratory outbreaks reported this week in residential aged care facilities.
    Deaths - The NSW Registry of Births, Deaths, and Marriages have recorded 22 deaths in
    association with influenza in 2016. The rate of deaths classified as “pneumonia and influenza”
    remained low.

     National and international influenza surveillance – the most recent national reports suggest
    influenza activity at the national level continued to increase indicating that the season is
    underway. Current influenza strains are well matched to the 2016 influenza vaccines. Influenza
    activity is increasing in some other regions in the Southern Hemisphere.


    For more information: NSW Health - Infectious Diseases

    *
    Queensland
    Statewide Weekly Influenza
    Surveillance Report
    Reporting Period: 1 January to 14 August 2016
    Queensland.png


    For more information: Queensland Health

    South Australia

    31 July to 6 August 2016

    One hundred and twenty-nine cases of influenza were reported this week with 119 cases being
    characterised as influenza A and ten as influenza B. Cases comprised of 62 males and 67 females,
    with a median age of 30 years. Thirty (23%) notifications were for children aged less than 10 years
    and 22 (17%) notifications for persons aged 65 years or greater. There have been 1,357 cases of
    influenza notified year-to-date, compared with 5,517 cases reported for the same period last year

    The influenza
    chart shows recent influenza activity in South Australia.

    For more information:
    SA Health

    Tasmania

    Issue 2 | 15 July 2016

     Influenza activity remained at the low ‘baseline’ level despite a small increase in testing.
     The 2016 winter flu season has not commenced.
     Surveillance of influenza-like illness by General Practice and FluTracking continued to indicate minimal
    activity during this period.
     Laboratory tests of nose and throat swabs indicated that other respiratory pathogens were the main
    cause of influenza-like illness during May and June.

    Since the report of 9 May a further 57 notifications of influenza were received, with 49 relating to influenza
    detected in specimens collected during May and June. The total number of influenza notifications since the
    start of 2016 is 122. Notifications of influenza during May and June were similar to March and April (see Table
    1). Weekly influenza counts at the end of June remained low and indicated that the winter influenza season had
    not commenced (see Figure 1). For comparison, more influenza had been reported by the end of June 2015 (154
    notifications) with the 2015 influenza season in Tasmania having commenced during June 2015.

    During May and June Influenza A virus was the most common cause of influenza in Tasmania (see Table 2). To
    date, additional laboratory typing has been performed on 20 samples of influenza A virus. Fifteen samples were
    the A(H1N1)pdm09 strain while the remaining five were A(H3N2). The 2016 annual influenza vaccine covers
    both of these strains. See Annual Influenza Vaccine (page 6).


    For more information:
    DHHS Tasmania

    *
    Victoria

    Report No. 14: Week ending 7 August 2016

    Overview: The 2016 influenza season so far
    Measures of influenza‐like illness (ILI) from VicSPIN indicate the season is currently at average levels. The ILI rate
    from the National Home Doctor Service remained above baseline levels in the last week.
    The number of notified laboratory confirmed influenza cases for the year to 7 August is 52% lower than the same
    time in 2015. Of the notified influenza cases, 83% have been type A. VicSPIN detected six positive influenza
    A(H3N2), four positive influenza A(H1N1)pdm2009, one influenza C and one influenza(untyped) during the week.
    Overall the data from the influenza and ILI surveillance systems indicate the influenza season is at average levels
    in Victoria.

    For more information:
    Victorian Infectious Diseases Reference Laboratory

    Western Australia

    WEEK ENDING 31ST JULY 2016

    KEY POINTS
    INFLUENZA AND INFLUENZA-LIKE ILLNESSES (ILI)
    Summary: Direct indicators of influenza activity continue to increase, but levels of influenza-like illness are
    relatively stable and remain low for this time of year, perhaps reflecting relatively low levels of non-influenza
    respiratory virus activity.
     ILI presentations to sentinel general practitioners (GPs) remain relatively low for this time of year,
    whilst ILI presentations to sentinel emergency departments (EDs) are now in the mid-range of values
    seen at this time of year.
     The percent of tests positive for influenza virus and notifications of laboratory-confirmed influenza
    continue to increase and their levels are now similar to those experienced at the corresponding time in
    the past two years.
     Hospital admissions with notified influenza have been relatively stable in recent weeks and levels are
    around or below the average for this time of year.
     Influenza A/H3 (60% of detections) is now the dominant circulating virus, along with influenza B (33%),
    with a continuing decline in the proportion of influenza A/H1 (7%) cases identified.
     Non-influenza respiratory virus activity remains well below levels for the corresponding period in 2015.

    For more information:
    WA Dept.of Health

    *
    Nationally

    For the period to Jan 1- Aug 20th, 2016.
    NNDSS Australia.png


    For national data: National Notifiable Diseases Surveillance System

    *
    Australian Sentinel Practices Research Network (ASPREN)

    No. 14, 2016
    4th July-17th July, 2016

    SYNDROMIC SURVEILLANCE
    REPORTING
    Reports were received from 303 GPs from 8
    states and territories during the reporting
    period. During weeks 27 and 28 a total of
    18,577 and 21,035 consultations were made
    respectively.


    INFLUENZA-LIKE-ILLNESS (ILI)
    Nationally, ILI notifications increased over the period with 129
    and 155 notifications in weeks 27 and 28 respectively. ILI
    rates reported in this period were slightly higher with 8 and 9
    cases weighted / 7 cases unweighted per 1000 consultations
    in weeks 27 and 28 respectively, compared to 7 and 8 cases
    weighted / 6 unweighted per 1000 consultations in weeks 25
    and 26 respectively. For the same reporting period in 2015,
    ILI rates were slightly higher at 10 cases weighted / 9
    unweighted per 1000 consultations (see Figure 5). On a state
    -by-state basis, it is important to note the increased ILI rate in
    Remote NSW (see Figure 2).

    For more information:
    ASPREN

    *
    Flu Tracking

    Flutracking Weekly Interim Report
    Week ending 14 August 2016

    Moderate levels of influenza-like illness activity

    This survey was sent on Monday, 15 August 2016 at 01:13 AM and by 09:00 AM, Thursday 18 August we had received 23204 responses (23220 last week) from 14010 people responding for themselves and 9194 household members across Australia.

    Across Australia, fever and cough was reported by 2.3% of vaccinated participants and 3.2% of unvaccinated participants. Fever, cough and absence from normal duties was reported by 1.7% of vaccinated participants and 2.3% of unvaccinated participants.

    For participants this week, 14012/23204 (60.4 %) have received the seasonal vaccine so far. Of the 4547 participants who identified as working face-to-face with patients, 3647 (80.2%) have received the vaccine.

    For more information:
    Flu Tracking


    *
    Australian influenza report 2016 - Current report:
    AUSTRALIAN INFLUENZA SURVEILLANCE REPORT No. 5, 2016, REPORTING PERIOD: 23 July to 5 August 2016

    KEY MESSAGES
    • In the fortnight ending 5 August 2016, influenza activity at the national level continued to increase
    indicating that the season is underway.
    • Influenza-like illness (ILI) is increasing nationally. Influenza was the most common cause of ILI presentations
    to sentinel general practitioners.
    • Influenza A(H3N2) was the dominant circulating influenza virus nationally in recent weeks, noting
    jurisdictional variation. Notifications of influenza B increased slightly in recent weeks, but remained at low
    levels overall.
    • Notification rates this year to date have been highest in adults aged 85 years or older, with a secondary
    peak in the very young, aged less than 5 years. This is consistent with influenza A(H3N2) being typically
    more prevalent in older age groups.
    • Hospitalisations with confirmed influenza have increased in recent weeks in line with the seasonal increase
    in community level activity.
    • To date, the seasonal influenza vaccines appear to be a good match for circulating virus strains.

    Australia.png


    For more information: Department of Health
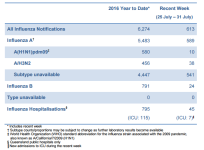
 
Updated information marked with a *

*
New South Wales

Week 33: 15 August to 21 August 2016
Summary:
 Seasonal influenza activity continues to rise steadily and is currently following a similar
course to last year (2015). The season is likely to be at or near its peak activity.
 Influenza A(H3N2) remains the dominant circulating influenza strain.
In this reporting week:
 Hospital Surveillance ? the rate of influenza like illness (ILI) presentations to selected
emergency departments increased and remains well above the seasonal threshold.
 Laboratory surveillance ? the total number of influenza isolations continues to rise along with
the proportion of respiratory samples positive for influenza (30.1%).
 Community surveillance ? influenza notifications were increased across most local health
districts (LHD). General Practice and community-based surveillance systems suggest
increased ILI activity. Influenza activity continues to impact heavily on the aged care sector
with 22 new respiratory outbreaks reported this week in residential aged care facilities.
 National and international influenza surveillance ? the most recent national reports suggest
influenza activity at the national level continued to increase indicating that the season is
underway. Current influenza strains are well matched to the 2016 influenza vaccines. Influenza
activity is increasing in some other regions in the Southern Hemisphere.


For more information: NSW Health - Infectious Diseases

*
Queensland
Statewide Weekly Influenza
Surveillance Report
Reporting Period: 1 January to 21 August 2016


Queensland.png

For more information: Queensland Health

*South Australia

7 August to 13 August 2016

The influenza season has started. Influenza vaccine is still available and we advise people (≥6 months of age) to get vaccinated as soon as possible.

One hundred and sixty-eight cases of influenza were reported this week with 152 cases being characterised as influenza A and 16 as influenza B. Cases comprised of 81 males and 87 females, with a median age of 38 years. Thirty-four (20%) notifications were for children aged less than 10 years and 34 (20%) notifications for persons aged 65 years or greater. There have been 1,527 cases of influenza notified year-to-date, compared with 6,601 cases reported for the same period last year

The influenza chart shows recent influenza activity in South Australia.

For more information: SA Health

*Tasmania

Issue 3 | 18 August 2016

The modest increase in influenza activity at the end of July is similar to pre-season activity observed in
recent years.
 The 2016 winter flu season appeared to be beginning toward the end of July.
 Influenza A virus is the most common cause of laboratory confirmed Influenza. The most common
circulating strains included A(H1N1)pdm09, followed by A(H3N2). The 2016 annual vaccine covers these
strains.
 There was a small increase in laboratory tests of nose and throat swabs during July. Respiratory Syncytial
Virus (RSV) was the most commonly detected respiratory pathogen followed by Rhinovirus and Influenza A
virus.
 Surveillance of influenza-like illness by General Practice and FluTracking continued to indicate low activity
during this period.

There were a further 37 notifications of influenza during July, resulting in a total of 159 influenza notifications
since the start of 2016. The July total of 37 notifications is the largest monthly total since the start of 2016 (see
Table 1). Weekly notification counts increased during July, with 18 of the 37 influenza notifications in the final
week (see Figure 1).

During July 2016, Influenza A virus was the most common cause of influenza in Tasmania: isolated in 34 out of 37
notifications. Since the start of 2016, additional laboratory typing has been performed on 25 samples of influenza
A virus. Sixteen samples were the A(H1N1)pdm09 strain while the remaining nine were A(H3N2). The 2016
annual influenza vaccine covers both of these strains. See Annual Influenza Vaccine (page 6).


For more information: DHHS Tasmania

*
Victoria

Report No. 16: Week ending 21 August 2016

Overview: The 2016 influenza season so far
Measures of influenza‐like illness (ILI) from VicSPIN indicate the season is currently at average levels. The ILI rate
from the National Home Doctor Service remained above baseline levels in the last week.
The number of notified laboratory confirmed influenza cases for the year to 21 August is 55% lower than the
same time in 2015. Of the notified influenza cases, 89% have been type A. VicSPIN detected eight positive
influenza A(H3N2), one influenza B and three influenza(untyped) during the week.
Overall the data from the influenza and ILI surveillance systems indicate the influenza season is slightly above
baseline levels in Victoria.

For more information: Victorian Infectious Diseases Reference Laboratory

Western Australia

WEEK ENDING 21ST AUGUST 2016

KEY POINTS
INFLUENZA AND INFLUENZA-LIKE ILLNESSES (ILI)
Summary: ILI activity has stabilised this week, but influenza notifications continue to increase, with influenza
A/H3N2 the dominant circulating strain.
 ILI presentations to sentinel general practitioners (GPs) and emergency departments (EDs) stabilised
this week but remain relatively high.
 The percent of tests positive for influenza virus and notifications of laboratory-confirmed influenza
remain higher than levels experienced at the corresponding time in the past three years.
 Hospital admissions with notified influenza (primarily due to A/H3N2 virus) appear to be still increasing
and are above the recent average for this time of year.
 Influenza A/H3 (69% of detections) is still the dominant circulating virus, along with influenza B (25%).
 Several influenza (A/H3N2) outbreaks have been reported in residential aged care facilities in the past
few weeks.
 Non-influenza respiratory virus activity remains well below levels for the corresponding period in 2015

For more information: WA Dept.of Health

*
Nationally

For the period to Jan 1- Aug 27th, 2016.


NNDSS Australia.png

For national data: National Notifiable Diseases Surveillance System

Australian Sentinel Practices Research Network (ASPREN)

No. 14, 2016
4th July-17th July, 2016

SYNDROMIC SURVEILLANCE
REPORTING
Reports were received from 303 GPs from 8
states and territories during the reporting
period. During weeks 27 and 28 a total of
18,577 and 21,035 consultations were made
respectively.


INFLUENZA-LIKE-ILLNESS (ILI)
Nationally, ILI notifications increased over the period with 129
and 155 notifications in weeks 27 and 28 respectively. ILI
rates reported in this period were slightly higher with 8 and 9
cases weighted / 7 cases unweighted per 1000 consultations
in weeks 27 and 28 respectively, compared to 7 and 8 cases
weighted / 6 unweighted per 1000 consultations in weeks 25
and 26 respectively. For the same reporting period in 2015,
ILI rates were slightly higher at 10 cases weighted / 9
unweighted per 1000 consultations (see Figure 5). On a state
-by-state basis, it is important to note the increased ILI rate in
Remote NSW (see Figure 2).

For more information:
ASPREN

*
Flu Tracking

Flutracking Weekly Interim Report
Week ending 21 August 2016

Moderate levels of influenza-like illness activity


This survey was sent on Monday, 22 August 2016 at 01:13 AM and by 09:00 AM, Thursday 25 August we had received 23075 responses (23206 last week) from 13930 people responding for themselves and 9145 household members across Australia.

Across Australia, fever and cough was reported by 2.3% of vaccinated participants and 3.1% of unvaccinated participants. Fever, cough and absence from normal duties was reported by 1.8% of vaccinated participants and 2.3% of unvaccinated participants.

For participants this week, 13990/23075 (60.6 %) have received the seasonal vaccine so far. Of the 4518 participants who identified as working face-to-face with patients, 3631 (80.4%) have received the vaccine.

For more information: Flu Tracking


*
Australian influenza report 2016 - Current report:
AUSTRALIAN INFLUENZA SURVEILLANCE REPORT No. 5, 2016, REPORTING PERIOD: 23 July to 5 August 2016

KEY MESSAGES
? In the fortnight ending 5 August 2016, influenza activity at the national level continued to increase
indicating that the season is underway.
? Influenza-like illness (ILI) is increasing nationally. Influenza was the most common cause of ILI presentations
to sentinel general practitioners.
? Influenza A(H3N2) was the dominant circulating influenza virus nationally in recent weeks, noting
jurisdictional variation. Notifications of influenza B increased slightly in recent weeks, but remained at low
levels overall.
? Notification rates this year to date have been highest in adults aged 85 years or older, with a secondary
peak in the very young, aged less than 5 years. This is consistent with influenza A(H3N2) being typically
more prevalent in older age groups.
? Hospitalisations with confirmed influenza have increased in recent weeks in line with the seasonal increase
in community level activity.
? To date, the seasonal influenza vaccines appear to be a good match for circulating virus strains.

For more information: Department of Health
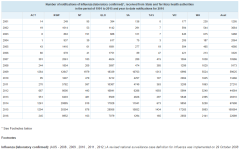
 
Updated information marked with a *

*
New South Wales

Week 34: 22 August to 28 August 2016
Summary:
 Seasonal influenza activity rose only slightly this week and is currently following a
similar course to last year (2015). The season is likely to be at or near its peak activity.
 Influenza A(H3N2) remains the dominant circulating influenza strain.
In this reporting week:
 Hospital Surveillance ? the rate of influenza like illness (ILI) presentations to selected
emergency departments increased and remains well above the seasonal threshold.
 Laboratory surveillance ? the total number of influenza isolations rose slightly this week with
the proportion of respiratory samples positive for influenza 30.9%.
 Community surveillance ? influenza notifications were increased across most local health
districts (LHD). General Practice and community-based surveillance systems suggest
increased ILI activity. Influenza activity continues to impact heavily on the aged care sector
with 21 new respiratory outbreaks reported this week in residential aged care facilities.
 National and international influenza surveillance ? the most recent national reports suggest
influenza activity at the national level continued to increase, with most regions of Australia
reporting widespread and increasing activity. Current influenza strains are well matched to the
2016 influenza vaccines.


For more information: NSW Health - Infectious Diseases

*
Queensland
Statewide Weekly Influenza
Surveillance Report
Reporting Period: 1 January to 28 August 2016

Queensland.png

For more information: Queensland Health

*South Australia

14 August to 20 August 2016

The influenza season has started. Influenza vaccine is still available and we advise people (≥6 months of age) to get vaccinated as soon as possible.

Two hundred and forty-three cases of influenza were reported this week with 231 cases being
characterised as influenza A and 12 as influenza B. Cases comprised of 113 males and 130 females,
with a median age of 34 years. Forty-five (19%) notifications were for children aged less than 10
years and 44 (18%) notifications for persons aged 65 years or greater. There have been 1,770 cases
of influenza notified year-to-date, compared with 7,890 cases reported for the same period last year.

The influenza chart shows recent influenza activity in South Australia.

For more information: SA Health

Tasmania

Issue 3 | 18 August 2016

The modest increase in influenza activity at the end of July is similar to pre-season activity observed in
recent years.
 The 2016 winter flu season appeared to be beginning toward the end of July.
 Influenza A virus is the most common cause of laboratory confirmed Influenza. The most common
circulating strains included A(H1N1)pdm09, followed by A(H3N2). The 2016 annual vaccine covers these
strains.
 There was a small increase in laboratory tests of nose and throat swabs during July. Respiratory Syncytial
Virus (RSV) was the most commonly detected respiratory pathogen followed by Rhinovirus and Influenza A
virus.
 Surveillance of influenza-like illness by General Practice and FluTracking continued to indicate low activity
during this period.

There were a further 37 notifications of influenza during July, resulting in a total of 159 influenza notifications
since the start of 2016. The July total of 37 notifications is the largest monthly total since the start of 2016 (see
Table 1). Weekly notification counts increased during July, with 18 of the 37 influenza notifications in the final
week (see Figure 1).

During July 2016, Influenza A virus was the most common cause of influenza in Tasmania: isolated in 34 out of 37
notifications. Since the start of 2016, additional laboratory typing has been performed on 25 samples of influenza
A virus. Sixteen samples were the A(H1N1)pdm09 strain while the remaining nine were A(H3N2). The 2016
annual influenza vaccine covers both of these strains. See Annual Influenza Vaccine (page 6).


For more information: DHHS Tasmania

*
Victoria

Report No. 17: Week ending 28 August 2016

Overview: The 2016 influenza season so far Measures of influenza-like illness (ILI) from VicSPIN and the National Home Doctor
Service indicate the season is currently at average levels. The number of notified laboratory confirmed influenza cases for the
year to 28 August is 53% lower than the same time in 2015. Of the notified influenza cases, 90% have been type A.
Sixty percent of VicSPIN swabs were positive for influenza, most of which were influenza A(H3N2).
Overall the data from the influenza and ILI surveillance systems indicate that activity has increased in recent weeks and Victoria
is experiencing an average influenza season so far in 2016.

For more information: Victorian Infectious Diseases Reference Laboratory

*Western Australia

WEEK ENDING 28TH AUGUST 2016
KEY POINTS
INFLUENZA AND INFLUENZA-LIKE ILLNESSES (ILI)
Summary: Indicators of ILI and influenza activity suggest the influenza season may have reached its peak.
Influenza A/H3N2 virus remains the dominant circulating strain.
 ILI presentations to sentinel general practitioners (GPs) and emergency departments (EDs) appear to
have plateaued over the past fortnight, but remain relatively high.
 The percent of tests positive for influenza virus and notifications of laboratory-confirmed influenza
decreased this week, but levels remain in the higher range of values observed during this time period
in recent years.
 Hospital admissions with notified influenza remain above the average level experienced in recent
years.
 Influenza A/H3N2 (66% of detections) remains the dominant circulating virus, along with influenza B
(30%).
 Several influenza (A/H3N2) outbreaks have been reported in residential aged care facilities in the past
few weeks.
 Non-influenza respiratory virus activity remains well below levels for the corresponding period in 2015.

For more information: WA Dept.of Health

*
Nationally

For the period to Jan 1- Sep 3rd, 2016.

NNDSS Australia.png

For national data: National Notifiable Diseases Surveillance System

*Australian Sentinel Practices Research Network (ASPREN)

No. 15, 2016
18th July-31st July, 2016


SYNDROMIC SURVEILLANCE
REPORTING
Reports were received from 289 GPs from 8
states and territories during the reporting
period. During weeks 29 and 30 a total of
19,906 and 21,013 consultations were made
respectively.

INFLUENZA-LIKE-ILLNESS (ILI)
Nationally, ILI notifications increased over the period with 169
and 188 notifications in weeks 29 and 30 respectively. ILI
rates reported in this period were higher with 11 and 10
cases weighted / 8 and 9 cases unweighted per 1000
consultations in weeks 29 and 30 respectively, compared to 8
and 9 cases weighted / 7 unweighted per 1000 consultations
in weeks 27 and 28 respectively. For the same reporting
period in 2015, ILI rates were similar at 10 and 11 cases
weighted / 10 and 11 unweighted per 1000 consultations (see
Figure 5). On a state-by-state basis, it is important to note the
increased ILI rate in Urban ACT (see Figure 2).

For more information: ASPREN

*
Flu Tracking

Flutracking Weekly Interim Report
Week ending 28 August 2016

Moderate levels of influenza-like illness activity


This survey was sent on Monday, 29 August 2016 at 01:13 AM and by 09:00 AM, Thursday 01 September we had received 23026 responses (23073 last week) from 13891 people responding for themselves and 9135 household members across Australia.

Across Australia, fever and cough was reported by 2.5% of vaccinated participants and 3.1% of unvaccinated participants. Fever, cough and absence from normal duties was reported by 1.7% of vaccinated participants and 2.2% of unvaccinated participants.

For participants this week, 13976/23026 (60.7 %) have received the seasonal vaccine so far. Of the 4513 participants who identified as working face-to-face with patients, 3639 (80.6%) have received the vaccine.

For more information: Flu Tracking


*
Australian influenza report 2016 - Current report:
Australian Influenza Surveillance Report No 06 - 06 August to 19 August 2016
Summary
In the fortnight ending 19 August 2016, influenza activity continued to increase at the national level, with most regions of Australia reporting widespread and increasing activity.
Influenza-like illness (ILI) also continued to increase nationally. More than half of all patients presenting to sentinel general practitioners with ILI and tested were positive for influenza this fortnight.
Influenza A(H3N2) continued to be the dominant circulating influenza virus nationally in recent weeks, noting jurisdictional variation. Notifications of influenza B increased slightly in recent weeks, but remained at low levels overall.
Notification rates this year to date have been highest in adults aged 85 years or older, with a secondary peak in the very young, aged less than 5 years. This is consistent with influenza A(H3N2) being typically more prevalent in older age groups.
Clinical severity for the season to date, as measured through the proportion of patients admitted directly to ICU and deaths attributed to pneumonia or influenza, is low to moderate.
To date, the seasonal influenza vaccines appear to be a good match for circulating virus strains.

Australia.png

For more information: Department of Health
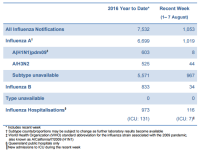
 
Updated information marked with a *

*
New South Wales

Week 35: 29 August to 4 September 2016
Summary:
 Seasonal influenza activity remains high but is at or just past its peak for 2016.
 Influenza A(H3N2) remains the dominant circulating influenza strain.
In this reporting week:
 Hospital Surveillance ? influenza like illness (ILI) presentations to selected emergency
departments decreased but remains at high levels. The index of increase indicates that activity
peaked on 28 August 2016.
 Laboratory surveillance ? the total number of influenza isolations rose slightly this week with
the proportion of respiratory samples positive for influenza at 31.7%.
 Community surveillance ? influenza notifications continued to be high across most local health
districts (LHD). General Practice and community-based surveillance systems suggests
decreasing ILI activity. Influenza activity continues to impact heavily on the aged care sector
with 30 new respiratory outbreaks reported this week in residential aged care facilities.
Deaths - The NSW Registry of Births, Deaths, and Marriages have recorded 46 deaths in
association with influenza in 2016. The rate of deaths classified as ?pneumonia and influenza?
remained low.

 National and international influenza surveillance ? the most recent national reports suggest
influenza activity at the national level continued to increase, with most regions of Australia
reporting widespread and increasing activity. Current influenza strains are well matched to the
2016 influenza vaccines.


For more information: NSW Health - Infectious Diseases

*
Queensland
Statewide Weekly Influenza
Surveillance Report
Reporting Period: 1 January to 4 September 2016
Queensland.png


For more information: Queensland Health

*South Australia

21 August to 27 August 2016

The influenza season has started. Influenza vaccine is still available and we advise people (≥6 months of age) to get vaccinated as soon as possible.

Three hundred and seventy-one cases of influenza were reported this week with 348 cases being
characterised as influenza A and 23 as influenza B. Cases comprised of 162 males and 209 females,
with a median age of 36 years. Seventy-one (19%) notifications were for children aged less than 10
years and 65 (18%) notifications for persons aged 65 years or greater. There have been 2,172 cases
of influenza notified year-to-date, compared with 9,196 cases reported for the same period last year.

The influenza chart shows recent influenza activity in South Australia.

For more information: SA Health

Tasmania

Issue 3 | 18 August 2016

The modest increase in influenza activity at the end of July is similar to pre-season activity observed in
recent years.
 The 2016 winter flu season appeared to be beginning toward the end of July.
 Influenza A virus is the most common cause of laboratory confirmed Influenza. The most common
circulating strains included A(H1N1)pdm09, followed by A(H3N2). The 2016 annual vaccine covers these
strains.
 There was a small increase in laboratory tests of nose and throat swabs during July. Respiratory Syncytial
Virus (RSV) was the most commonly detected respiratory pathogen followed by Rhinovirus and Influenza A
virus.
 Surveillance of influenza-like illness by General Practice and FluTracking continued to indicate low activity
during this period.

There were a further 37 notifications of influenza during July, resulting in a total of 159 influenza notifications
since the start of 2016. The July total of 37 notifications is the largest monthly total since the start of 2016 (see
Table 1). Weekly notification counts increased during July, with 18 of the 37 influenza notifications in the final
week (see Figure 1).

During July 2016, Influenza A virus was the most common cause of influenza in Tasmania: isolated in 34 out of 37
notifications. Since the start of 2016, additional laboratory typing has been performed on 25 samples of influenza
A virus. Sixteen samples were the A(H1N1)pdm09 strain while the remaining nine were A(H3N2). The 2016
annual influenza vaccine covers both of these strains. See Annual Influenza Vaccine (page 6).


For more information: DHHS Tasmania

*
Victoria

Report No. 18: Week ending 4 September 2016

Overview: The 2016 influenza season so far Measures of influenza-like illness (ILI) from VicSPIN and the National Home Doctor Service indicate the season is currently at average levels. The number of notified laboratory confirmed influenza cases for the year to 4 September is 50% lower than the same time in 2015. Of the notified influenza cases, 91% have been type A. Fifty two percent of VicSPIN swabs were positive for influenza, most of which were influenza A(H3N2). Overall the data from the influenza and ILI surveillance systems indicate that the season is at or near its peak in what has been an average influenza season so far in 2016.

For more information: Victorian Infectious Diseases Reference Laboratory

Western Australia

WEEK ENDING 28TH AUGUST 2016
KEY POINTS
INFLUENZA AND INFLUENZA-LIKE ILLNESSES (ILI)
Summary: Indicators of ILI and influenza activity suggest the influenza season may have reached its peak.
Influenza A/H3N2 virus remains the dominant circulating strain.
 ILI presentations to sentinel general practitioners (GPs) and emergency departments (EDs) appear to
have plateaued over the past fortnight, but remain relatively high.
 The percent of tests positive for influenza virus and notifications of laboratory-confirmed influenza
decreased this week, but levels remain in the higher range of values observed during this time period
in recent years.
 Hospital admissions with notified influenza remain above the average level experienced in recent
years.
 Influenza A/H3N2 (66% of detections) remains the dominant circulating virus, along with influenza B
(30%).
 Several influenza (A/H3N2) outbreaks have been reported in residential aged care facilities in the past
few weeks.
 Non-influenza respiratory virus activity remains well below levels for the corresponding period in 2015.

For more information: WA Dept.of Health

*
Nationally

For the period to Jan 1- Sep 10th, 2016.
NNDSS Australia.png


For national data: National Notifiable Diseases Surveillance System

Australian Sentinel Practices Research Network (ASPREN)

No. 15, 2016
18th July-31st July, 2016


SYNDROMIC SURVEILLANCE
REPORTING
Reports were received from 289 GPs from 8
states and territories during the reporting
period. During weeks 29 and 30 a total of
19,906 and 21,013 consultations were made
respectively.

INFLUENZA-LIKE-ILLNESS (ILI)
Nationally, ILI notifications increased over the period with 169
and 188 notifications in weeks 29 and 30 respectively. ILI
rates reported in this period were higher with 11 and 10
cases weighted / 8 and 9 cases unweighted per 1000
consultations in weeks 29 and 30 respectively, compared to 8
and 9 cases weighted / 7 unweighted per 1000 consultations
in weeks 27 and 28 respectively. For the same reporting
period in 2015, ILI rates were similar at 10 and 11 cases
weighted / 10 and 11 unweighted per 1000 consultations (see
Figure 5). On a state-by-state basis, it is important to note the
increased ILI rate in Urban ACT (see Figure 2).

For more information: ASPREN

*
Flu Tracking

Flutracking Weekly Interim Report
Week ending 04 September 2016

Moderate levels of influenza-like illness activity


This survey was sent on Monday, 05 September 2016 at 01:13 AM and by 09:00 AM, Thursday 08 September we had received 22568 responses (23021 last week) from 13615 people responding for themselves and 8953 household members across Australia.

Across Australia, fever and cough was reported by 2.4% of vaccinated participants and 3.0% of unvaccinated participants. Fever, cough and absence from normal duties was reported by 1.8% of vaccinated participants and 2.2% of unvaccinated participants.

For participants this week, 13684/22568 (60.6 %) have received the seasonal vaccine so far. Of the 4426 participants who identified as working face-to-face with patients, 3563 (80.5%) have received the vaccine.

For more information: Flu Tracking


Australian influenza report 2016 - Current report:
Australian Influenza Surveillance Report No 06 - 06 August to 19 August 2016
Summary
In the fortnight ending 19 August 2016, influenza activity continued to increase at the national level, with most regions of Australia reporting widespread and increasing activity.
Influenza-like illness (ILI) also continued to increase nationally. More than half of all patients presenting to sentinel general practitioners with ILI and tested were positive for influenza this fortnight.
Influenza A(H3N2) continued to be the dominant circulating influenza virus nationally in recent weeks, noting jurisdictional variation. Notifications of influenza B increased slightly in recent weeks, but remained at low levels overall.
Notification rates this year to date have been highest in adults aged 85 years or older, with a secondary peak in the very young, aged less than 5 years. This is consistent with influenza A(H3N2) being typically more prevalent in older age groups.
Clinical severity for the season to date, as measured through the proportion of patients admitted directly to ICU and deaths attributed to pneumonia or influenza, is low to moderate.
To date, the seasonal influenza vaccines appear to be a good match for circulating virus strains.


For more information: Department of Health
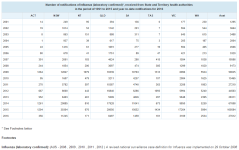
 
Updated information marked with a *

New South Wales

Week 35: 29 August to 4 September 2016
Summary:
 Seasonal influenza activity remains high but is at or just past its peak for 2016.
 Influenza A(H3N2) remains the dominant circulating influenza strain.
In this reporting week:
 Hospital Surveillance – influenza like illness (ILI) presentations to selected emergency
departments decreased but remains at high levels. The index of increase indicates that activity
peaked on 28 August 2016.
 Laboratory surveillance – the total number of influenza isolations rose slightly this week with
the proportion of respiratory samples positive for influenza at 31.7%.
 Community surveillance – influenza notifications continued to be high across most local health
districts (LHD). General Practice and community-based surveillance systems suggests
decreasing ILI activity. Influenza activity continues to impact heavily on the aged care sector
with 30 new respiratory outbreaks reported this week in residential aged care facilities.
Deaths - The NSW Registry of Births, Deaths, and Marriages have recorded 46 deaths in
association with influenza in 2016. The rate of deaths classified as “pneumonia and influenza”
remained low.

 National and international influenza surveillance – the most recent national reports suggest
influenza activity at the national level continued to increase, with most regions of Australia
reporting widespread and increasing activity. Current influenza strains are well matched to the
2016 influenza vaccines.


For more information: NSW Health - Infectious Diseases

*
Queensland
Statewide Weekly Influenza
Surveillance Report
Reporting Period: 1 January to 11 September 2016
Queensland.png

For more information: Queensland Health

*South Australia

28 August to 3 September 2016

The influenza season has started. Influenza vaccine is still available and we advise people (≥6 months of age) to get vaccinated as soon as possible.

Three hundred and fifty-nine cases of influenza were reported this week with 341 cases being
characterised as influenza A and 18 as influenza B. Cases comprised of 185 males and 174 females
with a median age of 35 years. Seventy-seven (21%) notifications were for children aged less than 10
years and 80 (22%) notifications for persons aged 65 years or greater. There have been 2,533 cases
of influenza notified year-to-date, compared with 10,560 cases reported for the same period last year

The influenza chart shows recent influenza activity in South Australia.

For more information: SA Health

Tasmania

Issue 3 | 18 August 2016

The modest increase in influenza activity at the end of July is similar to pre-season activity observed in
recent years.
 The 2016 winter flu season appeared to be beginning toward the end of July.
 Influenza A virus is the most common cause of laboratory confirmed Influenza. The most common
circulating strains included A(H1N1)pdm09, followed by A(H3N2). The 2016 annual vaccine covers these
strains.
 There was a small increase in laboratory tests of nose and throat swabs during July. Respiratory Syncytial
Virus (RSV) was the most commonly detected respiratory pathogen followed by Rhinovirus and Influenza A
virus.
 Surveillance of influenza-like illness by General Practice and FluTracking continued to indicate low activity
during this period.

There were a further 37 notifications of influenza during July, resulting in a total of 159 influenza notifications
since the start of 2016. The July total of 37 notifications is the largest monthly total since the start of 2016 (see
Table 1). Weekly notification counts increased during July, with 18 of the 37 influenza notifications in the final
week (see Figure 1).

During July 2016, Influenza A virus was the most common cause of influenza in Tasmania: isolated in 34 out of 37
notifications. Since the start of 2016, additional laboratory typing has been performed on 25 samples of influenza
A virus. Sixteen samples were the A(H1N1)pdm09 strain while the remaining nine were A(H3N2). The 2016
annual influenza vaccine covers both of these strains. See Annual Influenza Vaccine (page 6).


For more information: DHHS Tasmania

*
Victoria

Report No. 19: Week ending 11 September 2016

Overview: The 2016 influenza season so far Measures of influenza-like illness (ILI) from VicSPIN and the National Home Doctor Service indicate the season is currently at average levels. The number of notified laboratory confirmed influenza cases for the year to 11 September is 50% lower than at the same time in 2015. Of the notified influenza cases, 92% have been type A. Forty-eight percent of VicSPIN swabs were positive for influenza, most of which were influenza A(H3N2). Although cases of notified laboratory confirmed influenza are still increasing, data from other influenza and ILI surveillance systems indicate that the 2016 season probably peaked over the last several weeks.

For more information: Victorian Infectious Diseases Reference Laboratory

*Western Australia

WEEK ENDING 4TH SEPTEMBER 2016
KEY POINTS
INFLUENZA AND INFLUENZA-LIKE ILLNESSES (ILI)
Summary: Indicators of ILI and influenza activity suggest the influenza season may have reached its peak in
late August. Influenza A/H3N2 virus remains the dominant circulating strain.
 ILI presentations to sentinel general practitioners (GPs) and emergency departments (EDs) have
plateaued over the past few weeks, but remain relatively high.
 The percent of tests positive for influenza virus and notifications of laboratory-confirmed influenza
remained stable this week, however levels remain in the higher range of values observed during this
time period in recent years.
 Hospital admissions with notified influenza appear to have peaked in the third week of August but
remain above the average level experienced in recent years.
 Influenza A/H3N2 (79% of detections) remains the dominant circulating virus, comprising an
increasing proportion of cases, with declining influenza B (18%) activity.
 Several influenza (A/H3N2) outbreaks have been reported in residential aged care facilities in the past
week, and a total of 20 outbreaks in the past month.
 Non-influenza respiratory virus activity remains well below levels for the corresponding period in 2015

For more information: WA Dept.of Health

*
Nationally

For the period to Jan 1- Sep 17th, 2016.

NNDSS Australia.png

For national data: National Notifiable Diseases Surveillance System

*Australian Sentinel Practices Research Network (ASPREN)

No. 16, 2016
1st August-14th August, 2016


SYNDROMIC SURVEILLANCE
REPORTING
Reports were received from 293 GPs from 8
states and territories during the reporting
period. During weeks 31 and 32 a total of
21,960 and 21,025 consultations were made
respectively.

INFLUENZA-LIKE-ILLNESS (ILI)
Nationally, ILI notifications increased over the period with 255
and 265 notifications in weeks 31 and 32 respectively. ILI
rates reported in this period were higher with 13 cases
weighted / 12 and 13 cases unweighted per 1000
consultations in weeks 31 and 32 respectively, compared to
11 and 10 cases weighted / 8 and 9 unweighted per 1000
consultations in weeks 29 and 30 respectively. For the same
reporting period in 2015, ILI rates were the higher at 14 and
15 cases weighted / 14 unweighted per 1000 consultations
(see Figure 5). On a state-by-state basis, it is important to
note the increased ILI rate in Urban ACT (see Figure 2).

For more information: ASPREN

*
Flu Tracking

Flutracking Weekly Interim Report
Week ending 11 September 2016

Moderate levels of influenza-like illness activity


This survey was sent on Monday, 12 September 2016 at 01:13 AM and by 09:00 AM, Thursday 15 September we had received 22649 responses (22568 last week) from 13649 people responding for themselves and 9000 household members across Australia.

Across Australia, fever and cough was reported by 2.3% of vaccinated participants and 2.9% of unvaccinated participants. Fever, cough and absence from normal duties was reported by 1.6% of vaccinated participants and 2.2% of unvaccinated participants.

For participants this week, 13672/22649 (60.4 %) have received the seasonal vaccine so far. Of the 4430 participants who identified as working face-to-face with patients, 3541 (79.9%) have received the vaccine.

For more information: Flu Tracking


*Australian influenza report 2016 - Current report:
Australian Influenza Surveillance Report No 07 - 20 August to 02 September 2016
Summary
In the fortnight ending 2 September 2016, influenza activity continued to increase at the national level, with most regions of Australia reporting widespread and increasing activity.
National indicators of influenza-like illness (ILI) declined in the last fortnight, suggesting that the season may be close to peaking. The proportion of patients presenting to sentinel general practitioners with ILI and testing positive for influenza declined slightly this fortnight.
Influenza A(H3N2) continued to be the dominant circulating influenza virus nationally in recent weeks, noting jurisdictional variation.
Notification rates this year to date have been highest in adults aged 85 years or older, with a secondary peak in the very young, aged less than 5 years. This is consistent with influenza A(H3N2) being typically more prevalent in older age groups.
Clinical severity for the season to date, as measured through the proportion of patients admitted directly to ICU and deaths attributable to pneumonia or influenza, is low to moderate.
To date, the seasonal influenza vaccines appear to be a good match for circulating virus strains.

Australia.png


For more information: Department of Health
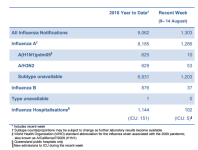
 
Back
Top