Ronan Kelly
Retired 2020
Updated information is indicated with a *
*New South Wales
NSW Health Influenza Surveillance Report
Week 36: 31 August to 6 September 2015
Summary:
Influenza activity appears to be at or past its peak overall, but variation remains across
the state.
The impact on Emergency Departments increased and remains high in some districts
and in the 0-34 years and 65 years and over age-groups.
Influenza B strains continuing to predominate.
The overall trend in influenza activity is similar to the high activity seen in 2014.
In this reporting week:
Hospital surveillance – presentations to NSW emergency departments for influenza-like illness
(ILI) increased again after a fall last week. Presentations for pneumonia decreased overall but
remained high in the 17-34 and the 65 years and over age-groups.
Laboratory surveillance – the proportion of respiratory samples positive for influenza was
moderate to high at 35.5%, but continues to trend down. Influenza B viruses continue to
predominate.
Community surveillance – influenza notifications across most local health districts increased
this week but are expected to decline in the coming weeks. Data collected from ASPREN,
FluTracking and eGPS showed declines in seasonal ILI activity. Influenza outbreaks in
residential age care facilities continue to be a concern with 13 new outbreaks reported.
Deaths – the NSW Registry of Births, Deaths, and Marriages have recorded 23 pneumonia
and influenza deaths in 2015; deaths remain low overall and below the epidemic threshold.
National and international influenza surveillance – across Australia, seasonal influenza activity
appears to have peaked in recent weeks with the exception of South Australia where activity
continues to rise. The timing and magnitude of the peak is similar to 2014.
For more information: NSW Health - Infectious Diseases
*Queensland
For Period 1 January - 6 September 2015
There were 2,375 notifications reported this week. Of these cases, 1,645 were attributed to influenza B virus. Of the 730 Influenza A samples, 25 were identified as A/H3N2, 9 as A/H1N1pdm09, 696 had subtype not available There were 84 hospital admissions including 8 to ICU.
YTD there were 21,179 notifications reported. Of these cases, 14,420 were attributed to influenza B virus. Of the 6,759 Influenza A samples, 133 were identified as A(H1N1)pdm09 and 996 as A/H3N2.
There have been 1,101 hospital admissions including 100 to ICU.
For more information: QLD Health
*South Australia
30 August to 5 September 2015
One thousand, one hundred and eighty-one cases of influenza were reported this week. Of these, 496
were characterised as influenza A and 685 were characterised as influenza B. Year-to-date 41% of
cases are influenza A and 59% of cases are influenza B.
Cases comprised of 532 males and 649 females, with a median age of 25 years. Three hundred and
twenty (27%) notifications were for children aged less than 10 years (65% being influenza B,
compared to 35% being influenza A) and 162 (14%) notifications for persons aged 65 years or greater
(38% being influenza B, compare to 62% being influenza A). Year-to-date there have been 10,755
cases of influenza, compared to 6,128 cases reported for the same period last year.
The influenza chart shows that influenza activity in South Australia is increasing.
For more information: SA Health
*Tasmania
Issue 5 | 9 September 2015
This report describes flu activity in Tasmania up to Sunday 30 August 2015. Available data over this period
indicate:
The 2015 winter flu season continued in August with a steep increase and peak in weekly flu notifications.
To date three-quarters of flu notifications have been from the south of the state.
Influenza A virus has been the most frequently detected cause of flu, and there has also been more
Influenza B virus than usual circulating.
Laboratories in Tasmania reported an increase in flu testing during August. General practitioners
participating in flu monitoring reported an increase in patients presenting with an Influenza-like Illness
(ILI).
Influenza-like Illness (ILI) reports from Tasmanian FluTracking participants also peaked during August.
Influenza Notifications
Since the fluTAS Report of 10 August 2015, 470 notifications of laboratory-diagnosed flu in Tasmanian residents
have been notified to the Director of Public Health. A total of 777 notifications of flu have been notified since
the start of 2015. Most notifications relate to residents in the south of the state (see Table 1).
Notifications peaked during the week ending Sunday 23 August 2015 (see Figure 1). The 470 notifications
received since the last fluTAS report account for 61 per cent of the total for the year to date. There were more
flu notifications during the four weeks ending 30 August 2015 (462) than during the same period last year (226
notifications), and more than the average of that period during the five years 2010-14 (120 notifications).
For more information: DHHS Tasmania
Victoria
Report No 18 Week ending 30/08/15
Summary
Influenza-like illness (ILI) activity remained above baseline levels (4.0) this week with 7.8 cases per 1000 patients
seen, compared to 8.5 in the previous week.
This week we received 29 surveillance swabs of which 15 (52%) were positive for influenza. From the 413 swabs
received from surveillance GPs this season (27/4/15 – 30/8/15) 142 (34%) have been positive for influenza, 1
A(untyped), 54 A(H3N2) and 88 influenza B.
The majority of viruses detected through routine testing this week were influenza A. Of the 258 influenza viruses
detected so far this year 8 were A(H1N1)pdm09, 152 were A(H3N2), 11 A(untyped) and 87 were influenza B.
Since 13/4/2015 FluCAN have reported 396 hospitalisations with confirmed influenza, of which 177 were untyped
influenza A patients, 1 A(H1N1)pdm09 and 218 were influenza B, from the 4 Victorian sentinel hospitals. Of the
396, 19 have been in ICU/HDU, three have been pregnant and 302 have had medical comorbidities.
Of the 130 influenza viruses analysed at the WHO Collaborating Centre for Reference and Research on Influenza
year to date from Victoria, 9 were A(H1N1)pdm09, 48 A(H3N2) and 80 influenza B.
The total number of laboratory confirmed notifications to the National Notifiable Diseases Surveillance System
(NNDSS) year to date was 58,765, of which 7,301 (12%) were from Victoria.
For more information: Victorian Infectious Diseases Reference Laboratory
*Western Australia
WEEK ENDING 30TH AUGUST 2015
KEY POINTS
INFLUENZA AND INFLUENZA-LIKE ILLNESSES (ILI)
Summary: Indicators of influenza activity remained stable or declined this week, further indicating we
may have reached the peak of the influenza season. Non-influenza respiratory virus activity continues to
decline.
ILI presentations to sentinel general practitioners (GPs) and emergency departments (EDs)
remain relatively stable and within ranges seen in recent mild influenza seasons.
Influenza virus detections, notifications and percent positivity decreased this week. Influenza B
virus (62% of detections) continues to predominate, and a majority of detected B strains are
Yamagata lineage (consistent with the trivalent vaccine); influenza A/H3N2 comprised 33% of
subtyped cases this week.
Hospitalisations with confirmed influenza remain stable and below the average observed at this
time in recent seasons.
Respiratory syncytial virus and other non-influenza respiratory virus activity continue to decline.
For more information: WA Dept.of Health
*Nationally
For the period to Jan 1- Sep 12th, 2015 there were 70,146 confirmed Influenza cases (new record high).
The largest number of notifications have been in QLD with 22,528 (new record high) , NSW had 21,450 (new record high), SA 11,678 (new record high), VIC 7,950, WA had 4,239, ACT 1,005, TAS 1,017 and NT 279.
For national data: National Notifiable Diseases Surveillance System
*Australian Sentinel Practices Research Network (ASPREN)
No. 17, 2015
10th August - 23rd August 2015
SYNDROMIC SURVEILLANCE
REPORTING
Reports were received from 284 GPs from 8
states and territories during the reporting
period. During weeks 33 and 34 a total of
20,948 and 20,520 consultations were made,
respectively.
INFLUENZA-LIKE-ILLNESS (ILI)
Nationally, ILI notifications increased significantly over the
period with 321 and 360 notifications in weeks 33 and 34
respectively. However, ILI rates reported in this period
decreased with 20 and 23 cases per 1000 consultations in
weeks 33 and 34 respectively, compared to 28 and 23 cases
per 1000 consultations in weeks 31 and 32 respectively. For
the same reporting period in 2014, ILI rates were slightly
lower at 19 and 21 cases per 1000 consultations (see Figure
5). On a state-by-state basis, it is important to note the
increased ILI rate in Urban QLD and Urban VIC (see Figure
2).
For more information: ASPREN
*Flu Tracking
Flutracking Weekly Interim Report
Week ending 6 September 2015
Moderate levels of influenza-like illness activity
This survey was sent on Monday, 07 September 2015 at 01:13 AM and by 09:00 AM, Thursday 10 September we had received 20702 responses (20868 last week) from 12751 people responding for themselves and 7951 household members across Australia.
Across Australia, fever and cough was reported by 3.5% of vaccinated participants and 4.4% of unvaccinated participants.
Fever, cough and absence from normal duties was reported by 2.2% of vaccinated participants and 3.1% of unvaccinated participants.
For participants this week, 12914/20702 (62.4 %) have received the seasonal vaccine so far.
Of the 4245 participants who identified as working face-to-face with patients, 3455 (81.4%) have received the vaccine.
For more information: Flu Tracking
*Australian influenza report 2015 - Current report:
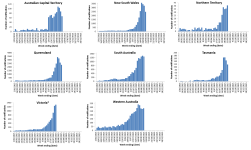
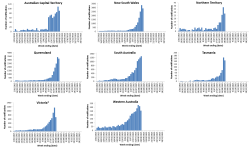
Australian Influenza Surveillance Report No 07 - 15 August to 28 August 2015
Summary
Across most jurisdictions, seasonal influenza activity appears to have peaked in recent weeks with the exception of South Australia where activity continues to rise. The timing and magnitude of the peak is similar to 2014.
Influenza notification rates have been highest among those aged between 5 and 9 and over 85 years with a secondary peak in those aged 40-44 years.
Influenza B continues to be the dominant influenza virus type nationally, comprising over two thirds of all notifications. In the Australian Capital Territory and Western Australia, influenza A continues to replace influenza B.
All systems that monitor influenza-like illness (ILI) activity are reporting decreasing activity following a season peak in the week ending 23 August. Influenza is the primary cause of ILI in the community this fortnight however other respiratory viruses continue to circulate at elevated levels.
Data for hospitalisations with confirmed influenza show high influenza activity which is typical for mid-season. Influenza B continues to account for more than half of admissions.
The seasonal influenza vaccines appear to be a good match for circulating strains with 83% of samples matching the trivalent seasonal vaccine (TIV).
...
Deaths Associated with Influenza and Pneumonia
Nationally Notified Influenza Associated Deaths
So far in 2015, 72 influenza associated deaths have been notified to the NNDSS, an increase of 12 from the previous fortnight. The median age of deaths notified was 85 years (range 40 to 102 years). Influenza A(H3N2) continues to be associated with deaths in older age groups. The number of influenza associated deaths reported to the NNDSS is reliant on the follow up of cases to determine the outcome of their infection and most likely does not represent the true mortality associated with this disease.
New South Wales Influenza and Pneumonia Death Registrations
Death registration data for the week ending 7 August 2015 show that there were 1.43 pneumonia or influenza associated deaths per 100,000 population in NSW, which is below the epidemic threshold of 1.61 per 100,000 NSW population (Figure 16). Up to 7 August 2015, out of 30,232 deaths in NSW, 19 death certificates noted influenza and 2,797 noted pneumonia.
For more information: Department of Health
*New South Wales
NSW Health Influenza Surveillance Report
Week 36: 31 August to 6 September 2015
Summary:
Influenza activity appears to be at or past its peak overall, but variation remains across
the state.
The impact on Emergency Departments increased and remains high in some districts
and in the 0-34 years and 65 years and over age-groups.
Influenza B strains continuing to predominate.
The overall trend in influenza activity is similar to the high activity seen in 2014.
In this reporting week:
Hospital surveillance – presentations to NSW emergency departments for influenza-like illness
(ILI) increased again after a fall last week. Presentations for pneumonia decreased overall but
remained high in the 17-34 and the 65 years and over age-groups.
Laboratory surveillance – the proportion of respiratory samples positive for influenza was
moderate to high at 35.5%, but continues to trend down. Influenza B viruses continue to
predominate.
Community surveillance – influenza notifications across most local health districts increased
this week but are expected to decline in the coming weeks. Data collected from ASPREN,
FluTracking and eGPS showed declines in seasonal ILI activity. Influenza outbreaks in
residential age care facilities continue to be a concern with 13 new outbreaks reported.
Deaths – the NSW Registry of Births, Deaths, and Marriages have recorded 23 pneumonia
and influenza deaths in 2015; deaths remain low overall and below the epidemic threshold.
National and international influenza surveillance – across Australia, seasonal influenza activity
appears to have peaked in recent weeks with the exception of South Australia where activity
continues to rise. The timing and magnitude of the peak is similar to 2014.
For more information: NSW Health - Infectious Diseases
*Queensland
For Period 1 January - 6 September 2015
There were 2,375 notifications reported this week. Of these cases, 1,645 were attributed to influenza B virus. Of the 730 Influenza A samples, 25 were identified as A/H3N2, 9 as A/H1N1pdm09, 696 had subtype not available There were 84 hospital admissions including 8 to ICU.
YTD there were 21,179 notifications reported. Of these cases, 14,420 were attributed to influenza B virus. Of the 6,759 Influenza A samples, 133 were identified as A(H1N1)pdm09 and 996 as A/H3N2.
There have been 1,101 hospital admissions including 100 to ICU.
For more information: QLD Health
*South Australia
30 August to 5 September 2015
One thousand, one hundred and eighty-one cases of influenza were reported this week. Of these, 496
were characterised as influenza A and 685 were characterised as influenza B. Year-to-date 41% of
cases are influenza A and 59% of cases are influenza B.
Cases comprised of 532 males and 649 females, with a median age of 25 years. Three hundred and
twenty (27%) notifications were for children aged less than 10 years (65% being influenza B,
compared to 35% being influenza A) and 162 (14%) notifications for persons aged 65 years or greater
(38% being influenza B, compare to 62% being influenza A). Year-to-date there have been 10,755
cases of influenza, compared to 6,128 cases reported for the same period last year.
The influenza chart shows that influenza activity in South Australia is increasing.
For more information: SA Health
*Tasmania
Issue 5 | 9 September 2015
This report describes flu activity in Tasmania up to Sunday 30 August 2015. Available data over this period
indicate:
The 2015 winter flu season continued in August with a steep increase and peak in weekly flu notifications.
To date three-quarters of flu notifications have been from the south of the state.
Influenza A virus has been the most frequently detected cause of flu, and there has also been more
Influenza B virus than usual circulating.
Laboratories in Tasmania reported an increase in flu testing during August. General practitioners
participating in flu monitoring reported an increase in patients presenting with an Influenza-like Illness
(ILI).
Influenza-like Illness (ILI) reports from Tasmanian FluTracking participants also peaked during August.
Influenza Notifications
Since the fluTAS Report of 10 August 2015, 470 notifications of laboratory-diagnosed flu in Tasmanian residents
have been notified to the Director of Public Health. A total of 777 notifications of flu have been notified since
the start of 2015. Most notifications relate to residents in the south of the state (see Table 1).
Notifications peaked during the week ending Sunday 23 August 2015 (see Figure 1). The 470 notifications
received since the last fluTAS report account for 61 per cent of the total for the year to date. There were more
flu notifications during the four weeks ending 30 August 2015 (462) than during the same period last year (226
notifications), and more than the average of that period during the five years 2010-14 (120 notifications).
For more information: DHHS Tasmania
Victoria
Report No 18 Week ending 30/08/15
Summary
Influenza-like illness (ILI) activity remained above baseline levels (4.0) this week with 7.8 cases per 1000 patients
seen, compared to 8.5 in the previous week.
This week we received 29 surveillance swabs of which 15 (52%) were positive for influenza. From the 413 swabs
received from surveillance GPs this season (27/4/15 – 30/8/15) 142 (34%) have been positive for influenza, 1
A(untyped), 54 A(H3N2) and 88 influenza B.
The majority of viruses detected through routine testing this week were influenza A. Of the 258 influenza viruses
detected so far this year 8 were A(H1N1)pdm09, 152 were A(H3N2), 11 A(untyped) and 87 were influenza B.
Since 13/4/2015 FluCAN have reported 396 hospitalisations with confirmed influenza, of which 177 were untyped
influenza A patients, 1 A(H1N1)pdm09 and 218 were influenza B, from the 4 Victorian sentinel hospitals. Of the
396, 19 have been in ICU/HDU, three have been pregnant and 302 have had medical comorbidities.
Of the 130 influenza viruses analysed at the WHO Collaborating Centre for Reference and Research on Influenza
year to date from Victoria, 9 were A(H1N1)pdm09, 48 A(H3N2) and 80 influenza B.
The total number of laboratory confirmed notifications to the National Notifiable Diseases Surveillance System
(NNDSS) year to date was 58,765, of which 7,301 (12%) were from Victoria.
For more information: Victorian Infectious Diseases Reference Laboratory
*Western Australia
WEEK ENDING 30TH AUGUST 2015
KEY POINTS
INFLUENZA AND INFLUENZA-LIKE ILLNESSES (ILI)
Summary: Indicators of influenza activity remained stable or declined this week, further indicating we
may have reached the peak of the influenza season. Non-influenza respiratory virus activity continues to
decline.
ILI presentations to sentinel general practitioners (GPs) and emergency departments (EDs)
remain relatively stable and within ranges seen in recent mild influenza seasons.
Influenza virus detections, notifications and percent positivity decreased this week. Influenza B
virus (62% of detections) continues to predominate, and a majority of detected B strains are
Yamagata lineage (consistent with the trivalent vaccine); influenza A/H3N2 comprised 33% of
subtyped cases this week.
Hospitalisations with confirmed influenza remain stable and below the average observed at this
time in recent seasons.
Respiratory syncytial virus and other non-influenza respiratory virus activity continue to decline.
For more information: WA Dept.of Health
*Nationally
For the period to Jan 1- Sep 12th, 2015 there were 70,146 confirmed Influenza cases (new record high).
The largest number of notifications have been in QLD with 22,528 (new record high) , NSW had 21,450 (new record high), SA 11,678 (new record high), VIC 7,950, WA had 4,239, ACT 1,005, TAS 1,017 and NT 279.
For national data: National Notifiable Diseases Surveillance System
*Australian Sentinel Practices Research Network (ASPREN)
No. 17, 2015
10th August - 23rd August 2015
SYNDROMIC SURVEILLANCE
REPORTING
Reports were received from 284 GPs from 8
states and territories during the reporting
period. During weeks 33 and 34 a total of
20,948 and 20,520 consultations were made,
respectively.
INFLUENZA-LIKE-ILLNESS (ILI)
Nationally, ILI notifications increased significantly over the
period with 321 and 360 notifications in weeks 33 and 34
respectively. However, ILI rates reported in this period
decreased with 20 and 23 cases per 1000 consultations in
weeks 33 and 34 respectively, compared to 28 and 23 cases
per 1000 consultations in weeks 31 and 32 respectively. For
the same reporting period in 2014, ILI rates were slightly
lower at 19 and 21 cases per 1000 consultations (see Figure
5). On a state-by-state basis, it is important to note the
increased ILI rate in Urban QLD and Urban VIC (see Figure
2).
For more information: ASPREN
*Flu Tracking
Flutracking Weekly Interim Report
Week ending 6 September 2015
Moderate levels of influenza-like illness activity
This survey was sent on Monday, 07 September 2015 at 01:13 AM and by 09:00 AM, Thursday 10 September we had received 20702 responses (20868 last week) from 12751 people responding for themselves and 7951 household members across Australia.
Across Australia, fever and cough was reported by 3.5% of vaccinated participants and 4.4% of unvaccinated participants.
Fever, cough and absence from normal duties was reported by 2.2% of vaccinated participants and 3.1% of unvaccinated participants.
For participants this week, 12914/20702 (62.4 %) have received the seasonal vaccine so far.
Of the 4245 participants who identified as working face-to-face with patients, 3455 (81.4%) have received the vaccine.
For more information: Flu Tracking
*Australian influenza report 2015 - Current report:
Australian Influenza Surveillance Report No 07 - 15 August to 28 August 2015
Summary
Across most jurisdictions, seasonal influenza activity appears to have peaked in recent weeks with the exception of South Australia where activity continues to rise. The timing and magnitude of the peak is similar to 2014.
Influenza notification rates have been highest among those aged between 5 and 9 and over 85 years with a secondary peak in those aged 40-44 years.
Influenza B continues to be the dominant influenza virus type nationally, comprising over two thirds of all notifications. In the Australian Capital Territory and Western Australia, influenza A continues to replace influenza B.
All systems that monitor influenza-like illness (ILI) activity are reporting decreasing activity following a season peak in the week ending 23 August. Influenza is the primary cause of ILI in the community this fortnight however other respiratory viruses continue to circulate at elevated levels.
Data for hospitalisations with confirmed influenza show high influenza activity which is typical for mid-season. Influenza B continues to account for more than half of admissions.
The seasonal influenza vaccines appear to be a good match for circulating strains with 83% of samples matching the trivalent seasonal vaccine (TIV).
...
Deaths Associated with Influenza and Pneumonia
Nationally Notified Influenza Associated Deaths
So far in 2015, 72 influenza associated deaths have been notified to the NNDSS, an increase of 12 from the previous fortnight. The median age of deaths notified was 85 years (range 40 to 102 years). Influenza A(H3N2) continues to be associated with deaths in older age groups. The number of influenza associated deaths reported to the NNDSS is reliant on the follow up of cases to determine the outcome of their infection and most likely does not represent the true mortality associated with this disease.
New South Wales Influenza and Pneumonia Death Registrations
Death registration data for the week ending 7 August 2015 show that there were 1.43 pneumonia or influenza associated deaths per 100,000 population in NSW, which is below the epidemic threshold of 1.61 per 100,000 NSW population (Figure 16). Up to 7 August 2015, out of 30,232 deaths in NSW, 19 death certificates noted influenza and 2,797 noted pneumonia.
For more information: Department of Health