
• FluTrackers.com Inc. does not provide medical advice. Information on this web site is collected from various internet resources, and the FluTrackers board of directors makes no warranty to the safety, efficacy, correctness or completeness of the information posted on this site by any author or poster. The information collated here is for instructional and/or discussion purposes only and is NOT intended to diagnose or treat any disease, illness, or other medical condition. Every individual reader or poster should seek advice from their personal physician/healthcare practitioner before considering or using any interventions that are discussed on this website. By continuing to access this website you agree to consult your personal physican before using any interventions posted on this website, and you agree to hold harmless FluTrackers.com Inc., the board of directors, the members, and all authors and posters for any effects from use of any medication, supplement, vitamin or other substance, device, intervention, etc. mentioned in posts on this website, or other internet venues referenced in posts on this website.
  • We are not asking for any donations. Do not donate to any entity who says they are raising funds for us.

Australia Influenza Surveillance 2015

Ronan Kelly

Retired 2020
Link to 2014 thread: https://flutrackers.com/forum/forum...164261-australia-influenza-surveillance-2014​

Updated information is indicated with a *

*New South Wales

In March:
 The rate of influenza like illness (ILI) presentations to selected emergency departments was
low and was within the normal range expected for March.
 242 cases with laboratory-confirmed influenza A (predominantly H3N2) and 108 cases with
influenza B were identified by sentinel NSW laboratories.
 Rhinovirus was the most common respiratory virus identified by sentinel laboratories.


For more information: NSW Health - Infectious Diseases

*Queensland

For Period 1 January -19 April 2012015

There were 122 notifications reported this week. Of these cases, 42 were attributed to influenza B virus. Of the 80 Influenza A samples, 17 were identified as A/H3N2, 63 had subtype not available There were 9 hospital admissions including 1 to ICU.

YTD there were 1,684 notifications reported. Of these cases, 382 were attributed to influenza B virus. Of the 1,302 Influenza A samples, 54 were identified as A(H1N1)pdm09 and 399 as A/H3N2.

There have been 114 hospital admissions including 11 to ICU.

For more information: QLD Health

*South Australia

19 April to 25 April 2015

Eighty-nine cases of influenza were reported this week. Of these, 65 were characterised as influenza
A and 24 were characterised as influenza B.
Cases comprised of 39 males and 50 females, with a median age of 60 years. There were nine (10%)
notifications for children aged less than 10 years and 37 (42%) notifications for persons aged over 65
years. Year-to-date there have been 1,130 cases of Influenza, compared to 594 cases reported for
the same period last year.
The influenza chart shows that influenza activity in South Australia may be increasing.

For more information: SA Health

Tasmania

No Reports yet for 2015.

For more information: DHHS Tasmania

Victoria

No Reports yet for 2015

For more information: Victorian Infectious Diseases Reference Laboratory

*Western Australia

WEEK ENDING 26TH APRIL 2015
KEY POINTS
INFLUENZA AND INFLUENZA-LIKE ILLNESSES (ILI)
Summary: Indicators of influenza activity remain relatively steady, at inter-seasonal levels.
 ILI presentations to sentinel general practitioners (GPs) were steady but presentations and
admissions to sentinel Emergency Departments (EDs) increased this week.
 Routine and sentinel detections of influenza virus remain low, with influenza A/H3N2
constituting the majority of subtyped viruses; influenza A/H1N1 and influenza B continue to cocirculate.

 Respiratory syncytial virus activity appears to be increasing.

For more information: WA Dept.of Health

*Nationally

For the period to Jan 1- May 2nd, 2015 there were 6,386 confirmed Influenza cases.

The majority of notifications have been in QLD with 1,940 , NSW had 1,407, SA 1,187, VIC 959, WA had 682, ACT 92, TAS 65 and NT 54.

For national data: National Notifiable Diseases Surveillance System

*Australian Sentinel Practices Research Network (ASPREN)

No. 5, 2015
23rd February 2015 ? 8th March 2015

SYNDROMIC SURVEILLANCE
REPORTING
Reports were received from 181 GPs from 8
states and territories during the reporting
period. During weeks 9 and 10 a total of
15,245 and 12,357 consultations were made,
respectively.

INFLUENZA-LIKE-ILLNESS (ILI)
Nationally, ILI notifications increased over the period with 26
and 32 notifications in weeks 9 and 10 respectively. ILI rates
reported in this period increased slightly with 2 and 4 cases
per 1000 consultations in weeks 9 and 10 respectively,
compared to 2 cases per 1000 consultations in weeks 7 and
8 respectively. For the same reporting period in 2014, ILI
rates were higher at 5 and 8 cases per 1000 consultations
respectively (see Figure 5). On a state-by-state basis, it is
important to note the increased ILI rate in Urban ACT (see
Figure 2).

For more information: ASPREN

*Flu Tracking

Flutracking Weekly Interim Report
Week ending 26 April 2015

Low levels of influenza-like illness activity

This survey was sent on Monday, 27 April 2015 at 01:13 AM and by 09:00 AM, Thursday 30 April we had received 18600 responses (0 last week) from 11337 people responding for themselves and 7263 household members across Australia.

Across Australia, fever and cough was reported by 2.1% of vaccinated participants and 2.3% of unvaccinated participants. Fever, cough and absence from normal duties was reported by 1.2% of vaccinated participants and 1.4% of unvaccinated participants.

For participants this week, 13141/18600 (70.7 %) have received the seasonal vaccine so far. Of the 3516 participants who identified as working face-to-face with patients, 2263 (64.4%) have received the vaccine.

For more information: Flu Tracking


*Australian influenza report 2015 - Current report:

Week ending 10 April 2015

SUMMARY
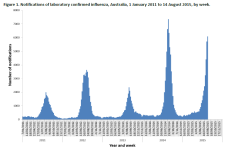
 Australia is currently in the inter‐seasonal period for influenza, with overall influenza activity at low levels
but showing some increase (Figure 1).
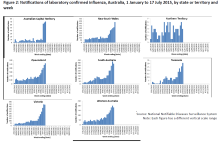
 Influenza activity across jurisdictions is variable (Figure 2). Activity since the start of the year has been
higher in a majority of jurisdictions than at the same time last year, however many jurisdictions have
reported a decline in activity in the most recent reporting week compared with the week prior.
 Nationally, influenza A is the predominant circulating virus type; of those viruses where subtyping data are
available, influenza A(H3N2) is most common (Figure 3).
 The majority of influenza viruses circulating in Australia appear to be a good match with the 2015 seasonal
influenza vaccine.
 Influenza‐like illness (ILI) levels detected through the sentinel GP ILI surveillance system remain low (Figure
4). In the most recent fortnight, influenza A infection was the most common cause of ILI detected.

For more information: Department of Health
 
Updated information is indicated with a *

New South Wales

In March:
 The rate of influenza like illness (ILI) presentations to selected emergency departments was
low and was within the normal range expected for March.
 242 cases with laboratory-confirmed influenza A (predominantly H3N2) and 108 cases with
influenza B were identified by sentinel NSW laboratories.
 Rhinovirus was the most common respiratory virus identified by sentinel laboratories.


For more information: NSW Health - Infectious Diseases

*Queensland

For Period 1 January -26 April 2012015

There were 117 notifications reported this week. Of these cases, 41 were attributed to influenza B virus. Of the 76 Influenza A samples, 17 were identified as A/H3N2, 2 as A/H1N1pdm09, 57 had subtype not available There were 9 hospital admissions including 1 to ICU.

YTD there were 1,855 notifications reported. Of these cases, 435 were attributed to influenza B virus. Of the 1,420 Influenza A samples, 56 were identified as A(H1N1)pdm09 and 438 as A/H3N2.

There have been 121 hospital admissions including 13 to ICU.

For more information: QLD Health

South Australia

19 April to 25 April 2015

Eighty-nine cases of influenza were reported this week. Of these, 65 were characterised as influenza
A and 24 were characterised as influenza B.
Cases comprised of 39 males and 50 females, with a median age of 60 years. There were nine (10%)
notifications for children aged less than 10 years and 37 (42%) notifications for persons aged over 65
years. Year-to-date there have been 1,130 cases of Influenza, compared to 594 cases reported for
the same period last year.
The influenza chart shows that influenza activity in South Australia may be increasing.

For more information: SA Health

Tasmania

No Reports yet for 2015.

For more information: DHHS Tasmania

*Victoria

Report No 1 Week ending 03/05/15 Summary
 Influenza-like illness (ILI) activity started below baseline levels this week with 1.6 cases per 1000 patients seen. Data from the National Home Doctor Service (Victorian data) remained below the seasonal threshold with a proportion of 5.1.
 From the 9 swabs received from surveillance GPs this season (27/4/15 ? 3/5/15) 5 (56%) have been positive for influenza, 2 influenza A(untyped) and 3 influenza B.
 The majority of viruses detected through routine testing this week were picornavirus. Of the 36 influenza viruses detected so far this year 2 were A(H1N1)pdm09, 26 were A(H3N2), 5 are untyped and 3 were influenza B.
 Of the 19 influenza viruses analysed at the WHO Collaborating Centre for Reference and Research on Influenza year to date from Victoria, 4 were A(H1N1)pdm09, 11 A(H3N2) and 4 influenza B.
 The total number of laboratory confirmed notifications to the National Notifiable Diseases Surveillance System (NNDSS) to date was 6,310, of which 1,024 (16%) were from Victoria.

For more information: Victorian Infectious Diseases Reference Laboratory

Western Australia

WEEK ENDING 26TH APRIL 2015
KEY POINTS
INFLUENZA AND INFLUENZA-LIKE ILLNESSES (ILI)
Summary: Indicators of influenza activity remain relatively steady, at inter-seasonal levels.
 ILI presentations to sentinel general practitioners (GPs) were steady but presentations and
admissions to sentinel Emergency Departments (EDs) increased this week.
 Routine and sentinel detections of influenza virus remain low, with influenza A/H3N2
constituting the majority of subtyped viruses; influenza A/H1N1 and influenza B continue to cocirculate.

 Respiratory syncytial virus activity appears to be increasing.

For more information: WA Dept.of Health

*Nationally

For the period to Jan 1- May 9th, 2015 there were 6,922 confirmed Influenza cases.

The majority of notifications have been in QLD with 2,077 , NSW had 1,499, SA 1,289, VIC 1,079, WA had 744, ACT 92, TAS 72 and NT 60.

For national data: National Notifiable Diseases Surveillance System

Australian Sentinel Practices Research Network (ASPREN)

No. 5, 2015
23rd February 2015 — 8th March 2015

SYNDROMIC SURVEILLANCE
REPORTING
Reports were received from 181 GPs from 8
states and territories during the reporting
period. During weeks 9 and 10 a total of
15,245 and 12,357 consultations were made,
respectively.

INFLUENZA-LIKE-ILLNESS (ILI)
Nationally, ILI notifications increased over the period with 26
and 32 notifications in weeks 9 and 10 respectively. ILI rates
reported in this period increased slightly with 2 and 4 cases
per 1000 consultations in weeks 9 and 10 respectively,
compared to 2 cases per 1000 consultations in weeks 7 and
8 respectively. For the same reporting period in 2014, ILI
rates were higher at 5 and 8 cases per 1000 consultations
respectively (see Figure 5). On a state-by-state basis, it is
important to note the increased ILI rate in Urban ACT (see
Figure 2).

For more information: ASPREN

*Flu Tracking

Flutracking Weekly Interim Report
Week ending 3 May 2015

Low levels of influenza-like illness activity

This survey was sent on Monday, 04 May 2015 at 01:13 AM and by 09:00 AM, Thursday 07 May we had received 19920 responses (18600 last week) from 12180 people responding for themselves and 7740 household members across Australia.

Across Australia, fever and cough was reported by 1.8% of vaccinated participants and 2.3% of unvaccinated participants. Fever, cough and absence from normal duties was reported by 1.0% of vaccinated participants and 1.4% of unvaccinated participants.

For participants this week, 6814/19920 (34.2 %) have received the seasonal vaccine so far. Of the 3872 participants who identified as working face-to-face with patients, 1798 (46.4%) have received the vaccine.

A system error was detected this week in the recording of vaccination status. The vaccination status for all participants was set to ?not vaccinated in 2015? at approximately 7am Monday to correct the error. Participants completing their survey AFTER 7am Monday were able to enter their correct vaccination status. Approximately 1200 participants completed their survey prior to 7am and were not able to update their vaccination status, therefore vaccination coverage calculations this week will be slightly lower than expected.From next week (week ending 10 May) onwards, vaccination data will be accurate.

Vaccination data from last week (week ending 26th April 2015) should not be used.

For more information: Flu Tracking


Australian influenza report 2015 - Current report:

Week ending 10 April 2015

SUMMARY
 Australia is currently in the inter‐seasonal period for influenza, with overall influenza activity at low levels
but showing some increase (Figure 1).
 Influenza activity across jurisdictions is variable (Figure 2). Activity since the start of the year has been
higher in a majority of jurisdictions than at the same time last year, however many jurisdictions have
reported a decline in activity in the most recent reporting week compared with the week prior.
 Nationally, influenza A is the predominant circulating virus type; of those viruses where subtyping data are
available, influenza A(H3N2) is most common (Figure 3).
 The majority of influenza viruses circulating in Australia appear to be a good match with the 2015 seasonal
influenza vaccine.
 Influenza‐like illness (ILI) levels detected through the sentinel GP ILI surveillance system remain low (Figure
4). In the most recent fortnight, influenza A infection was the most common cause of ILI detected.

For more information: Department of Health
 
Updated information is indicated with a *

*New South Wales

In April:
 The rate of influenza like illness (ILI) presentations to selected emergency departments was low and consistent with inter-seasonal activity.
 The rate of ILI consultations at sentinel general practices was low and consistent with interseasonal activity.
 The proportion of deaths attributed to pneumonia and influenza was low and below the epidemic threshold.
 Of 12 584 specimens tested, 448 (3.6%) were positive for influenza. The number and proportion positive is slightly higher than usual for this time of year. Influenza A(H3N2) was the predominant strain.
 National surveillance indicated low influenza activity across the country; influenza viruses circulating appear to be a good match with the 2015 seasonal trivalent influenza vaccine.


For more information: NSW Health - Infectious Diseases

*Queensland

For Period 1 January -10 May 2015

There were 119 notifications reported this week. Of these cases, 59 were attributed to influenza B virus. Of the 60 Influenza A samples, 4 were identified as A/H3N2, 1 as A/H1N1pdm09, 55 had subtype not available There were 4 hospital admissions including 1 to ICU.

YTD there were 2,141 notifications reported. Of these cases, 552 were attributed to influenza B virus. Of the 1,589 Influenza A samples, 59 were identified as A(H1N1)pdm09 and 487 as A/H3N2.

There have been 137 hospital admissions including 14 to ICU.

For more information: QLD Health

*South Australia

26 April to 2 May 2015

One-hundred and ten cases of influenza were reported this week. Of these, 66 were characterised as influenza A and 44 were characterised as influenza B. Cases comprised of 53 males and 57 females, with a median age of 57 years. There were eight (7%) notifications for children aged less than 10 years and 42 (38%) notifications for persons aged over 65 years. Year-to-date there have been 1,240 cases of Influenza, compared to 628 cases reported for the same period last year. The influenza chart shows that influenza activity in South Australia may be increasing.

For more information: SA Health

*Tasmania

This report describes flu activity in Tasmania in the first four months of 2015 (up to and including 3 May 2015). Available data over this period indicate:
 a low level of flu activity
 a similar level of activity to the same period in 2014
 although some cases of flu were reported, there is no indication the 2015 flu season has started
 most flu notifications are due to Influenza A infections.

A total of 70 notifications of laboratory-diagnosed flu in Tasmanian residents were notified to DHHS during the first 18 weeks of 2015, compared with 69 notifications for the same period in 2014. Overall, the five-year average over this time period was 32 notifications (2010-14)

There have been 58 (83 per cent) notifications of Influenza A virus and 12 (17 per cent) notifications of Influenza B virus since the start of 2015


For more information: DHHS Tasmania

Victoria

Report No 1 Week ending 03/05/15 Summary
 Influenza-like illness (ILI) activity started below baseline levels this week with 1.6 cases per 1000 patients seen. Data from the National Home Doctor Service (Victorian data) remained below the seasonal threshold with a proportion of 5.1.
 From the 9 swabs received from surveillance GPs this season (27/4/15 – 3/5/15) 5 (56%) have been positive for influenza, 2 influenza A(untyped) and 3 influenza B.
 The majority of viruses detected through routine testing this week were picornavirus. Of the 36 influenza viruses detected so far this year 2 were A(H1N1)pdm09, 26 were A(H3N2), 5 are untyped and 3 were influenza B.
 Of the 19 influenza viruses analysed at the WHO Collaborating Centre for Reference and Research on Influenza year to date from Victoria, 4 were A(H1N1)pdm09, 11 A(H3N2) and 4 influenza B.
 The total number of laboratory confirmed notifications to the National Notifiable Diseases Surveillance System (NNDSS) to date was 6,310, of which 1,024 (16%) were from Victoria.

For more information: Victorian Infectious Diseases Reference Laboratory

*Western Australia

Summary: Indicators of influenza activity remain relatively steady, at inter-seasonal levels.
? ILI presentations to sentinel general practitioners (GPs) and Emergency Departments remained steady this week.
? Influenza B and A/H3N2 constituted the majority of influenza viruses subtyped this week.
? Non-influenza respiratory virus activity decreased this week.

For more information: WA Dept.of Health

*Nationally

For the period to Jan 1- May 16th, 2015 there were 7,425 confirmed Influenza cases.

The majority of notifications have been in QLD with 2,239 , NSW had 1,598, SA 1,378, VIC 1,177, WA had 785, ACT 109, TAS 78 and NT 61.

For national data: National Notifiable Diseases Surveillance System

Australian Sentinel Practices Research Network (ASPREN)

No. 5, 2015
23rd February 2015 ? 8th March 2015

SYNDROMIC SURVEILLANCE
REPORTING
Reports were received from 181 GPs from 8
states and territories during the reporting
period. During weeks 9 and 10 a total of
15,245 and 12,357 consultations were made,
respectively.

INFLUENZA-LIKE-ILLNESS (ILI)
Nationally, ILI notifications increased over the period with 26
and 32 notifications in weeks 9 and 10 respectively. ILI rates
reported in this period increased slightly with 2 and 4 cases
per 1000 consultations in weeks 9 and 10 respectively,
compared to 2 cases per 1000 consultations in weeks 7 and
8 respectively. For the same reporting period in 2014, ILI
rates were higher at 5 and 8 cases per 1000 consultations
respectively (see Figure 5). On a state-by-state basis, it is
important to note the increased ILI rate in Urban ACT (see
Figure 2).

For more information: ASPREN

*Flu Tracking

Flutracking Weekly Interim Report
Week ending 10 May 2015

Low levels of influenza-like illness activity

This survey was sent on Monday, 11 May 2015 at 01:13 AM and by 09:00 AM, Thursday 14 May we had received 20679 responses (19920 last week) from 12652 people responding for themselves and 8027 household members across Australia.

Across Australia, fever and cough was reported by 1.9% of vaccinated participants and 2.6% of unvaccinated participants. Fever, cough and absence from normal duties was reported by 1.0% of vaccinated participants and 1.6% of unvaccinated participants.

For participants this week, 9970/20679 (48.2 %) have received the seasonal vaccine so far. Of the 4104 participants who identified as working face-to-face with patients, 2711 (66.1%) have received the vaccine.


For more information: Flu Tracking


Australian influenza report 2015 - Current report:

Week ending 10 April 2015

SUMMARY
 Australia is currently in the inter‐seasonal period for influenza, with overall influenza activity at low levels
but showing some increase (Figure 1).
 Influenza activity across jurisdictions is variable (Figure 2). Activity since the start of the year has been
higher in a majority of jurisdictions than at the same time last year, however many jurisdictions have
reported a decline in activity in the most recent reporting week compared with the week prior.
 Nationally, influenza A is the predominant circulating virus type; of those viruses where subtyping data are
available, influenza A(H3N2) is most common (Figure 3).
 The majority of influenza viruses circulating in Australia appear to be a good match with the 2015 seasonal
influenza vaccine.
 Influenza‐like illness (ILI) levels detected through the sentinel GP ILI surveillance system remain low (Figure
4). In the most recent fortnight, influenza A infection was the most common cause of ILI detected.

For more information: Department of Health
 
Updated information is indicated with a *

New South Wales

In April:
 The rate of influenza like illness (ILI) presentations to selected emergency departments was low and consistent with inter-seasonal activity.
 The rate of ILI consultations at sentinel general practices was low and consistent with interseasonal activity.
 The proportion of deaths attributed to pneumonia and influenza was low and below the epidemic threshold.
 Of 12 584 specimens tested, 448 (3.6%) were positive for influenza. The number and proportion positive is slightly higher than usual for this time of year. Influenza A(H3N2) was the predominant strain.
 National surveillance indicated low influenza activity across the country; influenza viruses circulating appear to be a good match with the 2015 seasonal trivalent influenza vaccine.


For more information: NSW Health - Infectious Diseases

*Queensland

For Period 1 January -17 May 2015

There were 148 notifications reported this week. Of these cases, 76 were attributed to influenza B virus. Of the 72 Influenza A samples, 6 were identified as A/H3N2, none as A/H1N1pdm09, 66 had subtype not available There were 5 hospital admissions including 2 to ICU.

YTD there were 2,308 notifications reported. Of these cases, 634 were attributed to influenza B virus. Of the 1,674 Influenza A samples, 59 were identified as A(H1N1)pdm09 and 487 as A/H3N2.

There have been 148 hospital admissions including 18 to ICU.

For more information: QLD Health

*South Australia

10 May to 16 May 2015

Eighty-one cases of influenza were reported this week. Of these, 31 were characterised as influenza A and 50 were characterised as influenza B. Cases comprised of 36 males and 45 females, with a median age of 41 years. There were six (7%) notifications for children aged less than 10 years and 21 (26%) notifications for persons aged over 65 years. Year-to-date there have been 1,420 cases of Influenza, compared to 675 cases reported for the same period last year. The influenza chart shows that influenza activity in South Australia may be increasing.

For more information: SA Health

Tasmania

This report describes flu activity in Tasmania in the first four months of 2015 (up to and including 3 May 2015). Available data over this period indicate:
 a low level of flu activity
 a similar level of activity to the same period in 2014
 although some cases of flu were reported, there is no indication the 2015 flu season has started
 most flu notifications are due to Influenza A infections.

A total of 70 notifications of laboratory-diagnosed flu in Tasmanian residents were notified to DHHS during the first 18 weeks of 2015, compared with 69 notifications for the same period in 2014. Overall, the five-year average over this time period was 32 notifications (2010-14)

There have been 58 (83 per cent) notifications of Influenza A virus and 12 (17 per cent) notifications of Influenza B virus since the start of 2015


For more information: DHHS Tasmania

*Victoria

Report No 3 Week ending 17/05/15
Summary
 Influenza-like illness (ILI) activity remained below baseline levels this week with 2.6 cases per 1000 patients seen. Data from the National Home Doctor Service (Victorian data) remained below the seasonal threshold with a proportion of 5.7.
 This week we received 14 surveillance swabs of which 2 (14%) were positive for influenza B. From the 32 swabs received from surveillance GPs this season (27/4/15 ? 17/5/15) 7 (22%) have been positive for influenza, 2 A(untyped) and 5 influenza B.
 The majority of viruses detected through routine testing this week were picornavirus. Of the 39 influenza viruses detected so far this year 3 were A(H1N1)pdm09, 27 were A(H3N2), 4 are untyped and 5 were influenza B.
 Of the 25 influenza viruses analysed at the WHO Collaborating Centre for Reference and Research on Influenza year to date from Victoria, 4 were A(H1N1)pdm09, 15 A(H3N2) and 6 influenza B.
 The total number of laboratory confirmed notifications to the National Notifiable Diseases Surveillance System (NNDSS) year to date was 7,571, of which 1,186 (16%) were from Victoria.

For more information: Victorian Infectious Diseases Reference Laboratory

*Western Australia

WEEK ENDING 17TH MAY 2015

Summary: Indicators of influenza activity increased slightly this week, but remain at inter-seasonal levels. Influenza B virus is predominant at present.
? ILI presentations to sentinel general practitioners (GPs) and Emergency Departments (EDs) increased this week.
? Influenza B constituted the majority of influenza viruses subtyped this week; influenza A/H3N2 and, to a lesser extent, influenza A/H1N1, continue to co-circulate.
? Overall non-influenza respiratory virus activity remains low.

For more information: WA Dept.of Health

*Nationally

For the period to Jan 1- May 23rd, 2015 there were 7,952 confirmed Influenza cases.

The majority of notifications have been in QLD with 2,407 , NSW had 1,676, SA 1,482, VIC 1,269, WA had 858, ACT 115, TAS 84 and NT 61.

For national data: National Notifiable Diseases Surveillance System

Australian Sentinel Practices Research Network (ASPREN)

No. 5, 2015
23rd February 2015 — 8th March 2015

SYNDROMIC SURVEILLANCE
REPORTING
Reports were received from 181 GPs from 8
states and territories during the reporting
period. During weeks 9 and 10 a total of
15,245 and 12,357 consultations were made,
respectively.

INFLUENZA-LIKE-ILLNESS (ILI)
Nationally, ILI notifications increased over the period with 26
and 32 notifications in weeks 9 and 10 respectively. ILI rates
reported in this period increased slightly with 2 and 4 cases
per 1000 consultations in weeks 9 and 10 respectively,
compared to 2 cases per 1000 consultations in weeks 7 and
8 respectively. For the same reporting period in 2014, ILI
rates were higher at 5 and 8 cases per 1000 consultations
respectively (see Figure 5). On a state-by-state basis, it is
important to note the increased ILI rate in Urban ACT (see
Figure 2).

For more information: ASPREN

*Flu Tracking

Flutracking Weekly Interim Report Week ending 17 May 2015

Low levels of influenza-like illness activity

This survey was sent on Monday, 18 May 2015 at 01:13 AM and by 02:00 PM, Wednesday 20 May we had received 20951 responses (20431 last week) from 12806 people responding for themselves and 8145 household members across Australia.

Across Australia, fever and cough was reported by 2.2% of vaccinated participants and 2.9% of unvaccinated participants. Fever, cough and absence from normal duties was reported by 1.3% of vaccinated participants and 1.8% of unvaccinated participants.

For participants this week, 11142/20951 (53.2 %) have received the seasonal vaccine so far. Of the 4205 participants who identified as working face-to-face with patients, 3046 (72.4%) have received the vaccine.


For more information: Flu Tracking


*Australian influenza report 2015 - Current report:

Week ending 8 May 2015

Summary
Australia is currently in the inter-seasonal period for influenza, with overall influenza activity at low levels.

Influenza activity across jurisdictions is variable. Recent activity in many jurisdictions has decreased from the unusually high activity seen earlier this year.

Nationally, influenza A is the predominant circulating virus type; of those viruses where subtyping data are available, influenza A(H3N2) is the most common.

Of the limited number of isolates that have been further characterised for similarity with the vaccine components, influenza A viruses appear to be well matched. Approximately three-quarters of the influenza B viruses characterised are a match to the trivalent vaccine strain; with the remaining influenza B viruses matching the additional strain in the quadrivalent vaccine.

Influenza-like illness (ILI) levels detected through the sentinel GP ILI surveillance system remain lower than previous years. In the most recent fortnight, rhinovirus infection was the most common cause of ILI detected.

For more information: Department of Health
 
Updated information is indicated with a *

*New South Wales

NSW Health Influenza Surveillance Report
Week 21: 18 to 24 May 2015

Summary:
 The influenza season has not yet started and it is unlikely to start in the next four weeks.
 Influenza activity continues to be generally low in most parts of NSW.

In this reporting week:
 Hospital surveillance ? presentations to NSW emergency departments for influenza-like illness
(ILI) were well below the flu season threshold. Bronchiolitis presentations remained high; although
decreased compared to previous weeks. Pneumonia presentations increased further this week.
 Laboratory surveillance ? the proportion of respiratory samples positive for influenza was low
(2.7%), with influenza B viruses predominant. RSV and rhinovirus activity remain high.
 Community surveillance ? influenza notifications were highest in metropolitan areas but low
overall. Data collected from eGPS, ASPREN and FluTracking show low ILI activity as expected for
this time of year. There was one report of an influenza outbreak in an institution.
 National and international influenza surveillance ? Australia is currently in the inter-seasonal
period for influenza, with overall influenza activity at low levels. The updated 2015 influenza
vaccines are well matched to the currently circulating influenza strains.

For more information: NSW Health - Infectious Diseases

Queensland

For Period 1 January -17 May 2015

There were 148 notifications reported this week. Of these cases, 76 were attributed to influenza B virus. Of the 72 Influenza A samples, 6 were identified as A/H3N2, none as A/H1N1pdm09, 66 had subtype not available There were 5 hospital admissions including 2 to ICU.

YTD there were 2,308 notifications reported. Of these cases, 634 were attributed to influenza B virus. Of the 1,674 Influenza A samples, 59 were identified as A(H1N1)pdm09 and 487 as A/H3N2.

There have been 148 hospital admissions including 18 to ICU.

For more information: QLD Health

*South Australia

17 May to 23 May 2015

One hundred and fifteen cases of influenza were reported this week. Of these, 43 were characterised
as influenza A and 72 were characterised as influenza B.
Cases comprised of 62 males and 53 females, with a median age of 31 years. There were twentyseven
(23%) notifications for children aged less than 10 years and 22 (19%) notifications for persons
aged over 65 years. Year-to-date there have been 1,535 cases of Influenza, compared to 700 cases
reported for the same period last year.
The influenza chart shows that influenza activity in South Australia may be increasing.

For more information: SA Health

Tasmania

This report describes flu activity in Tasmania in the first four months of 2015 (up to and including 3 May 2015). Available data over this period indicate:
 a low level of flu activity
 a similar level of activity to the same period in 2014
 although some cases of flu were reported, there is no indication the 2015 flu season has started
 most flu notifications are due to Influenza A infections.

A total of 70 notifications of laboratory-diagnosed flu in Tasmanian residents were notified to DHHS during the first 18 weeks of 2015, compared with 69 notifications for the same period in 2014. Overall, the five-year average over this time period was 32 notifications (2010-14)

There have been 58 (83 per cent) notifications of Influenza A virus and 12 (17 per cent) notifications of Influenza B virus since the start of 2015


For more information: DHHS Tasmania

*Victoria

Report No 4 Week ending 24/05/15

Summary
 Influenza-like illness (ILI) activity remained below baseline levels this week with 2.4 cases per 1000 patients seen.
Data from the National Home Doctor Service (Victorian data) remained below the seasonal threshold with a
proportion of 6.6.
 This week we received 15 surveillance swabs of which 5 (33%) were positive for influenza. From the 46 swabs
received from surveillance GPs this season (27/4/15 ? 24/5/15) 12 (26%) have been positive for influenza, 6
A(untyped) and 6 influenza B.
 The majority of viruses detected through routine testing this week were picornavirus. Of the 43 influenza viruses
detected so far this year 4 were A(H1N1)pdm09, 28 were A(H3N2), 4 are untyped and 6 were influenza B.
 Since 11/4/2015 FluCAN have reported 12 hospitalisations with confirmed influenza, of which 5 were untyped
influenza A patients and 7 were influenza B, from the 4 Victorian sentinel hospitals.
 Of the 26 influenza viruses analysed at the WHO Collaborating Centre for Reference and Research on Influenza
year to date from Victoria, 4 were A(H1N1)pdm09, 16 A(H3N2) and 6 influenza B.
 The total number of laboratory confirmed notifications to the National Notifiable Diseases Surveillance System
(NNDSS) year to date was 8,405, of which 1,348 (16%) were from Victoria.

For more information: Victorian Infectious Diseases Reference Laboratory

Western Australia

WEEK ENDING 17TH MAY 2015

Summary: Indicators of influenza activity increased slightly this week, but remain at inter-seasonal levels. Influenza B virus is predominant at present.
• ILI presentations to sentinel general practitioners (GPs) and Emergency Departments (EDs) increased this week.
• Influenza B constituted the majority of influenza viruses subtyped this week; influenza A/H3N2 and, to a lesser extent, influenza A/H1N1, continue to co-circulate.
• Overall non-influenza respiratory virus activity remains low.

For more information: WA Dept.of Health

*Nationally

For the period to Jan 1- May 30th, 2015 there were 8,513 confirmed Influenza cases.

The majority of notifications have been in QLD with 2,572 , NSW had 1,766, SA 1,590, VIC 1,373, WA had 929, ACT 125, TAS 90 and NT 68.

For national data: National Notifiable Diseases Surveillance System

Australian Sentinel Practices Research Network (ASPREN)

No. 5, 2015
23rd February 2015 ? 8th March 2015

SYNDROMIC SURVEILLANCE
REPORTING
Reports were received from 181 GPs from 8
states and territories during the reporting
period. During weeks 9 and 10 a total of
15,245 and 12,357 consultations were made,
respectively.

INFLUENZA-LIKE-ILLNESS (ILI)
Nationally, ILI notifications increased over the period with 26
and 32 notifications in weeks 9 and 10 respectively. ILI rates
reported in this period increased slightly with 2 and 4 cases
per 1000 consultations in weeks 9 and 10 respectively,
compared to 2 cases per 1000 consultations in weeks 7 and
8 respectively. For the same reporting period in 2014, ILI
rates were higher at 5 and 8 cases per 1000 consultations
respectively (see Figure 5). On a state-by-state basis, it is
important to note the increased ILI rate in Urban ACT (see
Figure 2).

For more information: ASPREN

*Flu Tracking

Flutracking Weekly Interim Report
Week ending 24 May 2015

Low levels of influenza-like illness activity

This survey was sent on Monday, 25 May 2015 at 01:13 AM and by 09:00 AM, Thursday 28 May we had received
21846 responses (21332 last week) from 13309 people responding for themselves and 8537 household members
across Australia.

Across Australia, fever and cough was reported by 2.3% of vaccinated participants and 3.2% of unvaccinated participants. Fever, cough and absence from normal duties was reported by 1.4% of vaccinated participants and 1.8% of unvaccinated participants.

For participants this week, 12231/21846 (56.0 %) have received the seasonal vaccine so far. Of the 4487 participants who identified as working face-to-face with patients, 3407 (75.9%) have received the vaccine.

For more information: Flu Tracking


Australian influenza report 2015 - Current report:

Week ending 8 May 2015

Summary
Australia is currently in the inter-seasonal period for influenza, with overall influenza activity at low levels.

Influenza activity across jurisdictions is variable. Recent activity in many jurisdictions has decreased from the unusually high activity seen earlier this year.

Nationally, influenza A is the predominant circulating virus type; of those viruses where subtyping data are available, influenza A(H3N2) is the most common.

Of the limited number of isolates that have been further characterised for similarity with the vaccine components, influenza A viruses appear to be well matched. Approximately three-quarters of the influenza B viruses characterised are a match to the trivalent vaccine strain; with the remaining influenza B viruses matching the additional strain in the quadrivalent vaccine.

Influenza-like illness (ILI) levels detected through the sentinel GP ILI surveillance system remain lower than previous years. In the most recent fortnight, rhinovirus infection was the most common cause of ILI detected.

For more information: Department of Health
 
Flu cases tracking at record levels
June 5, 2015 - 8:42PM

The first five months of 2015 have been the worst on record for influenza cases, with experts warning Australia could be in for a rotten flu season.
...
http://www.smh.com.au/national/health/flu-cases-tracking-at-record-levels-20150605-ghhn9k.html

Australia.png
http://www9.health.gov.au/cda/sourc...essionid=72306d6e8e0ca9ba1e766f8496b547534333
 
Updated information is indicated with a *

*New South Wales

NSW Health Influenza Surveillance Report
Week 22: 25 to 31 May 2015

Summary:
 The influenza season has not yet started but may commence in the next four weeks.
 Influenza activity continues to be generally low in most parts of NSW.

In this reporting week:
 Hospital surveillance ? presentations to NSW emergency departments for influenza-like illness
(ILI) were well below the flu season threshold. Bronchiolitis presentations remained high; although
lower compared to previous weeks. Pneumonia presentations decreased further this week.
 Laboratory surveillance ? the proportion of respiratory samples positive for influenza was low
(3.0%) with influenza B viruses predominant. Respiratory syncytial virus (RSV) and rhinovirus
activity remain high.
 Community surveillance ? influenza notifications were highest in metropolitan areas but low
overall. Data collected from eGPS, ASPREN and FluTracking show low ILI activity as expected for
this time of year. There was one report of an influenza outbreak in an institution.
 National and international influenza surveillance ? Australia is currently in the inter-seasonal
period for influenza, with overall influenza activity at low levels. The updated 2015 influenza
vaccines are well matched to the currently circulating influenza strains.

For more information: NSW Health - Infectious Diseases

*Queensland

For Period 1 January -24 May 2015

There were 131 notifications reported this week. Of these cases, 86 were attributed to influenza B virus. Of the 45 Influenza A samples, 3 were identified as A/H3N2, 1 as A/H1N1pdm09, 41 had subtype not available There were 2 hospital admissions including 0 to ICU.

YTD there were 2,481 notifications reported. Of these cases, 731 were attributed to influenza B virus. Of the 1,750 Influenza A samples, 60 were identified as A(H1N1)pdm09 and 496 as A/H3N2.

There have been 150 hospital admissions including 19 to ICU.

For more information: QLD Health

South Australia

17 May to 23 May 2015

One hundred and fifteen cases of influenza were reported this week. Of these, 43 were characterised
as influenza A and 72 were characterised as influenza B.
Cases comprised of 62 males and 53 females, with a median age of 31 years. There were twentyseven
(23%) notifications for children aged less than 10 years and 22 (19%) notifications for persons
aged over 65 years. Year-to-date there have been 1,535 cases of Influenza, compared to 700 cases
reported for the same period last year.
The influenza chart shows that influenza activity in South Australia may be increasing.

For more information: SA Health

Tasmania

This report describes flu activity in Tasmania in the first four months of 2015 (up to and including 3 May 2015). Available data over this period indicate:
 a low level of flu activity
 a similar level of activity to the same period in 2014
 although some cases of flu were reported, there is no indication the 2015 flu season has started
 most flu notifications are due to Influenza A infections.

A total of 70 notifications of laboratory-diagnosed flu in Tasmanian residents were notified to DHHS during the first 18 weeks of 2015, compared with 69 notifications for the same period in 2014. Overall, the five-year average over this time period was 32 notifications (2010-14)

There have been 58 (83 per cent) notifications of Influenza A virus and 12 (17 per cent) notifications of Influenza B virus since the start of 2015


For more information: DHHS Tasmania

*Victoria

Report No 5 Week ending 31/05/15

Summary
 Influenza-like illness (ILI) activity remained below baseline levels this week with 3.1 cases per 1000 patients seen.
Data from the National Home Doctor Service (Victorian data) remained below the seasonal threshold with a
proportion of 4.1.
 This week we received 19 surveillance swabs of which 3 (16%) were positive for influenza. From the 65 swabs
received from surveillance GPs this season (27/4/15 ? 31/5/15) 15 (23%) have been positive for influenza, 7
A(untyped) and 8 influenza B.
 The majority of viruses detected through routine testing this week were picornavirus. Of the 45 influenza viruses
detected so far this year 5 were A(H1N1)pdm09, 28 were A(H3N2), 4 are untyped and 8 were influenza B.
 Since 11/4/2015 FluCAN have reported 20 hospitalisations with confirmed influenza, of which 6 were untyped
influenza A patients and 13 were influenza B, from the 4 Victorian sentinel hospitals.
 Of the 24 influenza viruses analysed at the WHO Collaborating Centre for Reference and Research on Influenza
year to date from Victoria, 4 were A(H1N1)pdm09, 14 A(H3N2) and 6 influenza B.
 The total number of laboratory confirmed notifications to the National Notifiable Diseases Surveillance System
(NNDSS) year to date was 8,751, of which 1,420 (16%) were from Victoria.

For more information: Victorian Infectious Diseases Reference Laboratory

*Western Australia

WEEK ENDING 31ST MAY 2015

Summary: Indicators of influenza-like activity increased this week, but influenza virus detections remain steady, and increases in non-influenza virus activity, particularly RSV, appear to be responsible. Influenza B virus dominates influenza activity at present.
? ILI presentations to sentinel general practitioners (GPs) and sentinel emergency departments (EDs) increased this week.
? Influenza virus detections and hospitalisations for influenza remain relatively steady.
? Influenza B constituted the majority of influenza viruses subtyped this week; influenza A/H3N2 and, to a lesser extent, influenza A/H1N1, continue to co-circulate.
? Respiratory syncytial virus activity continues to increase.

For more information: WA Dept.of Health

*Nationally

For the period to Jan 1- Jun 6th, 2015 there were 9,144 confirmed Influenza cases.

The majority of notifications have been in QLD with 2,757 , NSW had 1,864, SA 1,716, VIC 1,494, WA had 1,002, ACT 139, TAS 102 and NT 70.

For national data: National Notifiable Diseases Surveillance System

Australian Sentinel Practices Research Network (ASPREN)

No. 5, 2015
23rd February 2015 — 8th March 2015

SYNDROMIC SURVEILLANCE
REPORTING
Reports were received from 181 GPs from 8
states and territories during the reporting
period. During weeks 9 and 10 a total of
15,245 and 12,357 consultations were made,
respectively.

INFLUENZA-LIKE-ILLNESS (ILI)
Nationally, ILI notifications increased over the period with 26
and 32 notifications in weeks 9 and 10 respectively. ILI rates
reported in this period increased slightly with 2 and 4 cases
per 1000 consultations in weeks 9 and 10 respectively,
compared to 2 cases per 1000 consultations in weeks 7 and
8 respectively. For the same reporting period in 2014, ILI
rates were higher at 5 and 8 cases per 1000 consultations
respectively (see Figure 5). On a state-by-state basis, it is
important to note the increased ILI rate in Urban ACT (see
Figure 2).

For more information: ASPREN

*Flu Tracking

Flutracking Weekly Interim Report
Week ending 31 May 2015

Low levels of influenza-like illness activity

This survey was sent on Monday, 01 June 2015 at 01:13 AM and by 09:00 AM, Thursday 04 June we had received
21654 responses (21846 last week) from 13244 people responding for themselves and 8410 household members
across Australia.

Across Australia, fever and cough was reported by 2.7% of
vaccinated participants and 3.4% of unvaccinated
participants. Fever, cough and absence from normal duties
was reported by 1.6% of vaccinated participants and 2.1%
of unvaccinated participants.

For participants this week, 12489/21654 (57.7 %) have
received the seasonal vaccine so far. Of the 4461
participants who identified as working face-to-face with
patients, 3433 (77.0%) have received the vaccine.


For more information: Flu Tracking


*Australian influenza report 2015 - Current report:

Week ending 22 May 2015

SUMMARY

? Australia is currently in the inter-seasonal period for influenza. Overall influenza activity is low and stable, but higher than at the same time in previous years (Figure 1).
? Influenza activity across jurisdictions is variable (Figure 2). Influenza activity is higher in most jurisdictions compared to the same period in previous years.
? This year to date, influenza A is the predominant circulating virus type; of those viruses where subtyping data are available, influenza A(H3N2) is the most common (Figure 3). Influenza B is circulating at increasing levels in recent weeks.
? Of the limited number of isolates that have been further characterised for similarity with the vaccine components, influenza A viruses appear to be well matched. Over 80% of the influenza B viruses characterised are a match to the trivalent vaccine strain; the remaining influenza B viruses matching the additional strain in the quadrivalent vaccine.
? Influenza-like illness (ILI) levels detected through the sentinel GP ILI surveillance system are increasing (Figure 4). In the most recent fortnight, rhinovirus infection was the most common cause of ILI detected.


For more information: Department of Health
 
Updated information is indicated with a *

*New South Wales

NSW Health Influenza Surveillance Report
Week 23: 1 to 7 June 2015

Summary:
 The influenza season is likely to commence in the next few weeks.
 Influenza activity is increasing but continues to be generally low in most parts of NSW.
In this reporting week:
 Hospital surveillance ? presentations to NSW emergency departments for influenza-like illness
(ILI) increased but were below the flu season threshold. Bronchiolitis presentations remained high;
although lower compared to previous weeks
 Laboratory surveillance ? the proportion of respiratory samples positive for influenza was low
(4.2%) but increasing with influenza B viruses predominant. Respiratory syncytial virus (RSV) and
rhinovirus activity remain high.
 Community surveillance ? influenza notifications were highest in metropolitan areas but low
overall. Data collected from ASPREN and FluTracking show low but increasing ILI activity as
expected for this time of year. There was one report of an influenza outbreak in an institution.
 Deaths - The NSW Registry of Births, Deaths, and Marriages have recorded 7 deaths in
association with influenza in 2015.
 National and international influenza surveillance ? Australia is currently in the inter-seasonal
period for influenza, with overall influenza activity at low levels. The updated 2015 influenza
vaccines are well matched to the currently circulating influenza strains.

For more information: NSW Health - Infectious Diseases

*Queensland

For Period 1 January -7 June 2015

There were 130 notifications reported this week. Of these cases, 78 were attributed to influenza B virus. Of the 52 Influenza A samples, 1 was identified as A/H3N2, none as A/H1N1pdm09, 51 had subtype not available There were no hospital admissions including 0 to ICU.

YTD there were 2,857 notifications reported. Of these cases, 933 were attributed to influenza B virus. Of the 1,924 Influenza A samples, 62 were identified as A(H1N1)pdm09 and 511 as A/H3N2.

There have been 165 hospital admissions including 20 to ICU.

For more information: QLD Health

*South Australia

24 May to 30 May 2015

One hundred and thirteen cases of influenza were reported this week. Of these, 35 were characterised as influenza A and 78 were characterised as influenza B. Cases comprised of 44 males and 69 females, with a median age of 36 years. There were eighteen (16%) notifications for children aged less than 10 years and 25 (22%) notifications for persons aged over 65 years. Year-to-date there have been 1,648 cases of Influenza, compared to 726 cases reported for the same period last year. The influenza chart shows that influenza activity in South Australia may be increasing

For more information: SA Health

Tasmania

This report describes flu activity in Tasmania in the first four months of 2015 (up to and including 3 May 2015). Available data over this period indicate:
 a low level of flu activity
 a similar level of activity to the same period in 2014
 although some cases of flu were reported, there is no indication the 2015 flu season has started
 most flu notifications are due to Influenza A infections.

A total of 70 notifications of laboratory-diagnosed flu in Tasmanian residents were notified to DHHS during the first 18 weeks of 2015, compared with 69 notifications for the same period in 2014. Overall, the five-year average over this time period was 32 notifications (2010-14)

There have been 58 (83 per cent) notifications of Influenza A virus and 12 (17 per cent) notifications of Influenza B virus since the start of 2015


For more information: DHHS Tasmania

*Victoria

Report No 6 Week ending 07/06/15

Summary
 Influenza-like illness (ILI) activity increased above baseline levels this week with 4.4 cases per 1000 patients seen.
Data from the National Home Doctor Service (Victorian data) also increased above the seasonal threshold with a
proportion of 11.8.
 This week we received 25 surveillance swabs of which 4 (16%) were positive for influenza. From the 90 swabs
received from surveillance GPs this season (27/4/15 ? 7/6/15) 19 (21%) have been positive for influenza, 8
A(untyped) and 11 influenza B.
 The majority of viruses detected through routine testing this week were picornavirus and RSV. Of the 48 influenza
viruses detected so far this year 5 were A(H1N1)pdm09, 28 were A(H3N2), 5 untyped and 10 were influenza B.
 Since 11/4/2015 FluCAN have reported 28 hospitalisations with confirmed influenza, of which 8 were untyped
influenza A patients and 20 were influenza B, from the 4 Victorian sentinel hospitals.
 Of the 28 influenza viruses analysed at the WHO Collaborating Centre for Reference and Research on Influenza
year to date from Victoria, 7 were A(H1N1)pdm09, 15 A(H3N2) and 6 influenza B.
 The total number of laboratory confirmed notifications to the National Notifiable Diseases Surveillance System
(NNDSS) year to date was 9,370, of which 1,510 (16%) were from Victoria.

For more information: Victorian Infectious Diseases Reference Laboratory

Western Australia

WEEK ENDING 31ST MAY 2015

Summary: Indicators of influenza-like activity increased this week, but influenza virus detections remain steady, and increases in non-influenza virus activity, particularly RSV, appear to be responsible. Influenza B virus dominates influenza activity at present.
• ILI presentations to sentinel general practitioners (GPs) and sentinel emergency departments (EDs) increased this week.
• Influenza virus detections and hospitalisations for influenza remain relatively steady.
• Influenza B constituted the majority of influenza viruses subtyped this week; influenza A/H3N2 and, to a lesser extent, influenza A/H1N1, continue to co-circulate.
• Respiratory syncytial virus activity continues to increase.

For more information: WA Dept.of Health

*Nationally

For the period to Jan 1- Jun 13th, 2015 there were 9,897 confirmed Influenza cases.

The majority of notifications have been in QLD with 2,947 , NSW had 2,012, SA 1,844, VIC 1,596, WA had 1,163, ACT 149, TAS 114 and NT 72.

For national data: National Notifiable Diseases Surveillance System

*Australian Sentinel Practices Research Network (ASPREN)

No. 11, 2015 18th May - 31st May 2015

SYNDROMIC SURVEILLANCE
REPORTING
Reports were received from 252 GPs from 8
states and territories during the reporting
period. During weeks 21 and 22 a total of
20,060 and 18,250 consultations were made,
respectively.

INFLUENZA-LIKE-ILLNESS (ILI)
Nationally, ILI notifications increased over the
period with 92 and 74 notifications in weeks 21 and 22
respectively. ILI rates reported in this period decreased
slightly with 6 and 4 cases per 1000 consultations in weeks
21 and 22 respectively, compared to 7 and 4 cases per 1000
consultations in weeks 19 and 20 respectively. For the same
reporting period in 2014, ILI rates were the same at 4 and 6
cases per 1000 consultations respectively (see Figure 5). On
a state-by-state basis, it is important to note the increased ILI
rate in Urban SA (see Figure 2).

For more information: ASPREN

*Flu Tracking

Flutracking Weekly Interim Report
Week ending 07 June 2015

Low levels of influenza-like illness activity

This survey was sent on Monday, 08 June 2015 at 01:13 AM and by 09:00 AM, Thursday 11 June we had received
21298 responses (21654 last week) from 13106 people responding for themselves and 8192 household members
across Australia.

Across Australia, fever and cough was reported by 2.7% of
vaccinated participants and 3.2% of unvaccinated
participants. Fever, cough and absence from normal duties
was reported by 1.5% of vaccinated participants and 1.9%
of unvaccinated participants.

For participants this week, 12523/21298 (58.8 %) have received the seasonal vaccine so far. Of the 4428 participants who identified as working face-to-face with patients, 3476 (78.5%) have received the vaccine.

For more information: Flu Tracking


Australian influenza report 2015 - Current report:

Week ending 22 May 2015

SUMMARY

• Australia is currently in the inter-seasonal period for influenza. Overall influenza activity is low and stable, but higher than at the same time in previous years (Figure 1).
• Influenza activity across jurisdictions is variable (Figure 2). Influenza activity is higher in most jurisdictions compared to the same period in previous years.
• This year to date, influenza A is the predominant circulating virus type; of those viruses where subtyping data are available, influenza A(H3N2) is the most common (Figure 3). Influenza B is circulating at increasing levels in recent weeks.
• Of the limited number of isolates that have been further characterised for similarity with the vaccine components, influenza A viruses appear to be well matched. Over 80% of the influenza B viruses characterised are a match to the trivalent vaccine strain; the remaining influenza B viruses matching the additional strain in the quadrivalent vaccine.
• Influenza-like illness (ILI) levels detected through the sentinel GP ILI surveillance system are increasing (Figure 4). In the most recent fortnight, rhinovirus infection was the most common cause of ILI detected.


For more information: Department of Health
 
Updated information is indicated with a *

*New South Wales

NSW Health Influenza Surveillance Report Week 24: 8 to 14 June 2015
Summary:
 The influenza season is likely to commence in the next few weeks.
 Influenza activity is increasing but continues to be generally low in most parts of NSW.

In this reporting week:
 Hospital surveillance ? presentations to NSW emergency departments for influenza-like illness (ILI) eased and were below the flu season threshold. Bronchiolitis presentations remained high.
 Laboratory surveillance ? the proportion of respiratory samples positive for influenza was low (5.5%) but continues to increase, with influenza B viruses predominant. Respiratory syncytial virus (RSV) and rhinovirus activity remain high.
 Community surveillance ? influenza notifications were highest in metropolitan areas but low overall. Data collected from ASPREN and FluTracking show low but increasing ILI activity as expected for this time of year. There was one report of an influenza outbreak in an institution.
 National and international influenza surveillance ? Across Australia the influenza season does not appear to have commenced. While influenza notifications are higher than at this point last year, they are still at low levels.

For more information: NSW Health - Infectious Diseases

*Queensland

For Period 1 January -14 June 2015

There were 196 notifications reported this week. Of these cases, 116 were attributed to influenza B virus. Of the 80 Influenza A samples, 14 were identified as A/H3N2, 2 as A/H1N1pdm09, 64 had subtype not available There were 9 hospital admissions including 2 to ICU.

YTD there were 3,104 notifications reported. Of these cases, 1,075 were attributed to influenza B virus. Of the 2,029 Influenza A samples, 66 were identified as A(H1N1)pdm09 and 536 as A/H3N2.

There have been 189 hospital admissions including 24 to ICU.

For more information: QLD Health

*South Australia

31 May to 6 June 2015

One hundred and twenty seven cases of influenza were reported this week. Of these, 21 were characterised as influenza A and 106 were characterised as influenza B. Cases comprised of 49 males and 78 females, with a median age of 31 years. Thirty-four (27%) notifications were for children aged less than 10 years and 13 (10%) notifications for persons aged 65 years or greater. Year-to-date there have been 1,777 cases of Influenza, compared to 757 cases reported for the same period last year. The influenza chart shows that influenza activity in South Australia may be increasing.

For more information: SA Health

*Tasmania

This report describes flu activity in Tasmania up to Sunday 31 May 2015.
Available data over this period indicate:
 Despite more notified cases than is usual for the first 5 months of the year, other measures of influenza activity do not suggest a significant increase in community disease.
 A sharp and sustained increase in cases indicative of the start of the 2015 winter flu season has not yet occurred.
 Influenza A virus is responsible for the majority of recent influenza infections.

Flu Notifications
Tasmanian laboratories are required to notify the Director of Public Health of evidence of influenza infection (flu) in specimens collected from patients. These specimens are usually nose or throat swabs, less often a blood sample. The best test for flu involves PCR1 to detect influenza virus RNA present in a nose or throat swab.
Since the last fluTAS report 29 notifications of laboratory-diagnosed flu in Tasmanian residents have been notified to the Director of Public Health. A total of 99 notifications of flu have been notified since the start of 2015. The overall trend is typical of ?inter-seasonal? activity (see Figure 1).
Flu notifications during May 2015 were almost equal in each of the three regions of Tasmania

For more information: DHHS Tasmania

*Victoria

Report No 7 Week ending 14/06/15
Summary
 Influenza-like illness (ILI) activity decreased back below baseline levels (4.0) this week with 3.1 cases per 1000 patients seen. The previous week has adjusted from 5.8 to 3.2. Data from the National Home Doctor Service (Victorian data) also decreased back below the baseline threshold (10.0) with a proportion of 6.5.
 This week we received 15 surveillance swabs of which 1 (7%) was positive for influenza B. From the 105 swabs received from surveillance GPs this season (27/4/15 ? 14/6/15) 20 (19%) have been positive for influenza, 3 A(untyped), 5 A(H1N1)pdm2009 and 12 influenza B.
 The majority of viruses detected through routine testing this week were influenza A and RSV. Of the 55 influenza viruses detected so far this year 5 were A(H1N1)pdm09, 35 were A(H3N2), 5 A(untyped) and 10 were influenza B.
 Since 13/4/2015 FluCAN have reported 36 hospitalisations with confirmed influenza, of which 12 were untyped influenza A patients and 24 were influenza B, from the 4 Victorian sentinel hospitals. Of the 36, 2 have been in ICU/HDU with influenza A(untyped), none have been pregnant and 27 have had medical comorbidities.
 Of the 28 influenza viruses analysed at the WHO Collaborating Centre for Reference and Research on Influenza year to date from Victoria, 7 were A(H1N1)pdm09, 15 A(H3N2) and 6 influenza B.
 The total number of laboratory confirmed notifications to the National Notifiable Diseases Surveillance System (NNDSS) year to date was 10,253, of which 1,652 (16%) were from Victoria.

For more information: Victorian Infectious Diseases Reference Laboratory

Western Australia

WEEK ENDING 31ST MAY 2015

Summary: Indicators of influenza-like activity increased this week, but influenza virus detections remain steady, and increases in non-influenza virus activity, particularly RSV, appear to be responsible. Influenza B virus dominates influenza activity at present.
? ILI presentations to sentinel general practitioners (GPs) and sentinel emergency departments (EDs) increased this week.
? Influenza virus detections and hospitalisations for influenza remain relatively steady.
? Influenza B constituted the majority of influenza viruses subtyped this week; influenza A/H3N2 and, to a lesser extent, influenza A/H1N1, continue to co-circulate.
? Respiratory syncytial virus activity continues to increase.

For more information: WA Dept.of Health

*Nationally

For the period to Jan 1- Jun 20th, 2015 there were 10,902 confirmed Influenza cases.

The majority of notifications have been in QLD with 3,208 , NSW had 2,226, SA 2,041, VIC 1,801, WA had 1,267, ACT 157, TAS 125 and NT 77.

For national data: National Notifiable Diseases Surveillance System

Australian Sentinel Practices Research Network (ASPREN)

No. 11, 2015 18th May - 31st May 2015

SYNDROMIC SURVEILLANCE
REPORTING
Reports were received from 252 GPs from 8
states and territories during the reporting
period. During weeks 21 and 22 a total of
20,060 and 18,250 consultations were made,
respectively.

INFLUENZA-LIKE-ILLNESS (ILI)
Nationally, ILI notifications increased over the
period with 92 and 74 notifications in weeks 21 and 22
respectively. ILI rates reported in this period decreased
slightly with 6 and 4 cases per 1000 consultations in weeks
21 and 22 respectively, compared to 7 and 4 cases per 1000
consultations in weeks 19 and 20 respectively. For the same
reporting period in 2014, ILI rates were the same at 4 and 6
cases per 1000 consultations respectively (see Figure 5). On
a state-by-state basis, it is important to note the increased ILI
rate in Urban SA (see Figure 2).

For more information: ASPREN

*Flu Tracking

Flutracking Weekly Interim Report
Week ending 14 June 2015

Low levels of influenza-like illness activity

This survey was sent on Monday, 15 June 2015 at 01:13 AM and by 09:00 AM, Thursday 18 June we had received 21739 responses (21298 last week) from 13346 people responding for themselves and 8393 household members across Australia.

Across Australia, fever and cough was reported by 2.5% of vaccinated participants and 3.0% of unvaccinated participants. Fever, cough and absence from normal duties was reported by 1.4% of vaccinated participants and 1.8% of unvaccinated participants.

For participants this week, 12946/21739 (59.6 %) have received the seasonal vaccine so far. Of the 4496 participants who identified as working face-to-face with patients, 3574 (79.5%) have received the vaccine.

For more information: Flu Tracking


*Australian influenza report 2015 - Current report:

Australian Influenza Surveillance Report No 01 - 23 May to 05 June 2015 [h=3]Summary[/h]
  • The 2015 influenza season does not appear to have commenced. While influenza notifications are higher than at this point last year, they are still at low levels.
  • As at 5 June 2015, there were 9,449 cases of laboratory confirmed influenza reported, with 1,013 notifications reported in the most recent fortnight.
  • So far this year, influenza A has been the predominant influenza virus type. However influenza B has been circulating at increasing levels and is the predominant influenza virus type circulating in the most recent fortnight. This trend is common amongst most jurisdictions.
  • Systems that monitor influenza-like illness (ILI) are reporting low levels of activity, with an increase in activity in recent weeks, as expected at this time of year. In particular, viral respiratory presentations to Western Australia emergency departments have increased sharply in the most recent fortnight.
  • Respiratory viruses other than influenza are more commonly causing ILI in the community, with rhinovirus detected most frequently.
  • There is no indication of the potential severity of the season at this time.
  • Of the limited number of isolates that have been further characterised for similarity with the vaccine components, influenza A viruses appear to be well matched. Over 80% of the influenza B viruses characterised are a match to the trivalent vaccine strain; the remaining influenza B viruses match the additional strain in the quadrivalent vaccine.

For more information: Department of Health
 
Updated information is indicated with a *

New South Wales

NSW Health Influenza Surveillance Report Week 24: 8 to 14 June 2015
Summary:
 The influenza season is likely to commence in the next few weeks.
 Influenza activity is increasing but continues to be generally low in most parts of NSW.

In this reporting week:
 Hospital surveillance – presentations to NSW emergency departments for influenza-like illness (ILI) eased and were below the flu season threshold. Bronchiolitis presentations remained high.
 Laboratory surveillance – the proportion of respiratory samples positive for influenza was low (5.5%) but continues to increase, with influenza B viruses predominant. Respiratory syncytial virus (RSV) and rhinovirus activity remain high.
 Community surveillance – influenza notifications were highest in metropolitan areas but low overall. Data collected from ASPREN and FluTracking show low but increasing ILI activity as expected for this time of year. There was one report of an influenza outbreak in an institution.
 National and international influenza surveillance – Across Australia the influenza season does not appear to have commenced. While influenza notifications are higher than at this point last year, they are still at low levels.

For more information: NSW Health - Infectious Diseases

Queensland

For Period 1 January -14 June 2015

There were 196 notifications reported this week. Of these cases, 116 were attributed to influenza B virus. Of the 80 Influenza A samples, 14 were identified as A/H3N2, 2 as A/H1N1pdm09, 64 had subtype not available There were 9 hospital admissions including 2 to ICU.

YTD there were 3,104 notifications reported. Of these cases, 1,075 were attributed to influenza B virus. Of the 2,029 Influenza A samples, 66 were identified as A(H1N1)pdm09 and 536 as A/H3N2.

There have been 189 hospital admissions including 24 to ICU.

For more information: QLD Health

*South Australia

14 June to 20 June 2015

Two hundred and thirty-four cases of influenza were reported this week. Of these, 50 were characterised as influenza A and 184 were characterised as influenza B. Cases comprised of 96 males and 138 females, with a median age of 23 years. Sixty-seven (28%) notifications were for children aged less than 10 years and 34 (14%) notifications for persons aged 65 years or greater. Year-to-date there have been 2,159 cases of influenza, compared to 852 cases reported for the same period last year. The influenza chart shows that influenza activity in South Australia may be increasing.

For more information: SA Health

Tasmania

This report describes flu activity in Tasmania up to Sunday 31 May 2015.
Available data over this period indicate:
 Despite more notified cases than is usual for the first 5 months of the year, other measures of influenza activity do not suggest a significant increase in community disease.
 A sharp and sustained increase in cases indicative of the start of the 2015 winter flu season has not yet occurred.
 Influenza A virus is responsible for the majority of recent influenza infections.

Flu Notifications
Tasmanian laboratories are required to notify the Director of Public Health of evidence of influenza infection (flu) in specimens collected from patients. These specimens are usually nose or throat swabs, less often a blood sample. The best test for flu involves PCR1 to detect influenza virus RNA present in a nose or throat swab.
Since the last fluTAS report 29 notifications of laboratory-diagnosed flu in Tasmanian residents have been notified to the Director of Public Health. A total of 99 notifications of flu have been notified since the start of 2015. The overall trend is typical of “inter-seasonal” activity (see Figure 1).
Flu notifications during May 2015 were almost equal in each of the three regions of Tasmania

For more information: DHHS Tasmania

*Victoria

Report No 8 Week ending 21/06/15
Summary
 Influenza-like illness (ILI) activity remained below baseline levels (4.0) this week with 3.3 cases per 1000 patients
seen, compared to 3.2 in the previous week. Data from the National Home Doctor Service (Victorian data)
increased back above the baseline threshold (10.0) with a proportion of 12.0.
 This week we received 15 surveillance swabs of which 5 (33%) were positive for influenza B. From the 120 swabs
received from surveillance GPs this season (27/4/15 ? 21/6/15) 25 (21%) have been positive for influenza, 1
A(untyped), 7 A(H3N2) and 17 influenza B.
 The majority of viruses detected through routine testing this week were RSV. Of the 60 influenza viruses detected
so far this year 5 were A(H1N1)pdm09, 39 were A(H3N2), 3 A(untyped) and 13 were influenza B.
 Since 13/4/2015 FluCAN have reported 42 hospitalisations with confirmed influenza, of which 15 were untyped
influenza A patients and 27 were influenza B, from the 4 Victorian sentinel hospitals. Of the 42, 3 have been in
ICU/HDU, none have been pregnant and 30 have had medical comorbidities.
 Of the 28 influenza viruses analysed at the WHO Collaborating Centre for Reference and Research on Influenza
year to date from Victoria, 7 were A(H1N1)pdm09, 14 A(H3N2) and 7 influenza B.
 The total number of laboratory confirmed notifications to the National Notifiable Diseases Surveillance System
(NNDSS) year to date was 11,386, of which 1,884 (17%) were from Victoria.

For more information: Victorian Infectious Diseases Reference Laboratory

*Western Australia

WEEK ENDING 14TH JUNE 2015

Summary: Respiratory syncytial virus detections continue to increase. Indicators of influenza virus
activity remain variable.
? ILI presentations and admissions to sentinel emergency departments (EDs) decreased this
week, whereas ILI presentations to sentinel general practitioners (GPs) increased.
? Influenza virus detections and notifications are relatively steady, with influenza B (71%) and
influenza A/H3N2 (26%) viruses dominating detections.
? Overall non-influenza respiratory virus detections decreased marginally, but respiratory syncytial
virus activity continues to increase steeply.

For more information: WA Dept.of Health

*Nationally

For the period to Jan 1- Jun 27th, 2015 there were 12,142 confirmed Influenza cases.

The majority of notifications have been in QLD with 3,541 , NSW had 2,483, SA 2,302, VIC 2,015, WA had 1,405, ACT 173, TAS 144 and NT 79.

For national data: National Notifiable Diseases Surveillance System

Australian Sentinel Practices Research Network (ASPREN)

No. 11, 2015 18th May - 31st May 2015

SYNDROMIC SURVEILLANCE
REPORTING
Reports were received from 252 GPs from 8
states and territories during the reporting
period. During weeks 21 and 22 a total of
20,060 and 18,250 consultations were made,
respectively.

INFLUENZA-LIKE-ILLNESS (ILI)
Nationally, ILI notifications increased over the
period with 92 and 74 notifications in weeks 21 and 22
respectively. ILI rates reported in this period decreased
slightly with 6 and 4 cases per 1000 consultations in weeks
21 and 22 respectively, compared to 7 and 4 cases per 1000
consultations in weeks 19 and 20 respectively. For the same
reporting period in 2014, ILI rates were the same at 4 and 6
cases per 1000 consultations respectively (see Figure 5). On
a state-by-state basis, it is important to note the increased ILI
rate in Urban SA (see Figure 2).

For more information: ASPREN

*Flu Tracking

Flutracking Weekly Interim Report
Week ending 21 June 2015

Low levels of influenza-like illness activity

This survey was sent on Monday, 22 June 2015 at 01:13 AM and by 09:00 AM, Thursday 25 June we had received 21553 responses (21739 last week) from 13228 people responding for themselves and 8325 household members across Australia.

Across Australia, fever and cough was reported by 2.6% of vaccinated participants and 3.0% of unvaccinated participants. Fever, cough and absence from normal duties was reported by 1.6% of vaccinated participants and 1.7% of unvaccinated participants

For participants this week, 12897/21553 (59.8 %) have received the seasonal vaccine so far. Of the 4452 participants who identified as working face-to-face with patients, 3541 (79.5%) have received the vaccine.

For more information: Flu Tracking


Australian influenza report 2015 - Current report:

Australian Influenza Surveillance Report No 01 - 23 May to 05 June 2015 Summary
  • The 2015 influenza season does not appear to have commenced. While influenza notifications are higher than at this point last year, they are still at low levels.
  • As at 5 June 2015, there were 9,449 cases of laboratory confirmed influenza reported, with 1,013 notifications reported in the most recent fortnight.
  • So far this year, influenza A has been the predominant influenza virus type. However influenza B has been circulating at increasing levels and is the predominant influenza virus type circulating in the most recent fortnight. This trend is common amongst most jurisdictions.
  • Systems that monitor influenza-like illness (ILI) are reporting low levels of activity, with an increase in activity in recent weeks, as expected at this time of year. In particular, viral respiratory presentations to Western Australia emergency departments have increased sharply in the most recent fortnight.
  • Respiratory viruses other than influenza are more commonly causing ILI in the community, with rhinovirus detected most frequently.
  • There is no indication of the potential severity of the season at this time.
  • Of the limited number of isolates that have been further characterised for similarity with the vaccine components, influenza A viruses appear to be well matched. Over 80% of the influenza B viruses characterised are a match to the trivalent vaccine strain; the remaining influenza B viruses match the additional strain in the quadrivalent vaccine.
For more information: Department of Health
 
Updated information is indicated with a *

*New South Wales

NSW Health Influenza Surveillance Report Week 26: 22 to 28 June 2015 Summary:
 All measures indicate that the influenza season has commenced, however hospital activity remains low to moderate.
 Influenza activity is expected to continue to increase from now until the season peaks.

In this reporting week:
 Hospital surveillance ? presentations to NSW emergency departments for influenza-like illness (ILI) increased and were above the flu season threshold. Bronchiolitis presentations remained high.
 Laboratory surveillance ? the proportion of respiratory samples positive for influenza was low (6.7%) but continues to increase, with influenza B viruses predominant. Respiratory syncytial virus (RSV) and rhinovirus activity remain high.
 Community surveillance ? influenza notifications were highest in metropolitan areas but low overall. Data collected from ASPREN and FluTracking show low but increasing ILI activity as expected for this time of year. There was one report of an influenza outbreak in an institution.
 National and international influenza surveillance ? Across Australia the influenza activity is variable. While influenza notifications are higher than at this point last year, they are still at low levels.

For more information: NSW Health - Infectious Diseases

*Queensland

For Period 1 January -28 June 2015

There were 328 notifications reported this week. Of these cases, 233 were attributed to influenza B virus. Of the 95 Influenza A samples, 8 were identified as A/H3N2, 2 as A/H1N1pdm09, 85 had subtype not available There were 6 hospital admissions including 0 to ICU.

YTD there were 3,735 notifications reported. Of these cases, 1,480 were attributed to influenza B virus. Of the 2,255 Influenza A samples, 73 were identified as A(H1N1)pdm09 and 583 as A/H3N2.

There have been 224 hospital admissions including 26 to ICU.

For more information: QLD Health

*South Australia

21 June to 27 June 2015

Two hundred and sixty-one cases of influenza were reported this week. Of these, 93 were characterised as influenza A and 168 were characterised as influenza B. Cases comprised of 122 males and 139 females, with a median age of 20 years. Seventy-four (29%) notifications were for children aged less than 10 years and 29 (11%) notifications for persons aged 65 years or greater. Year-to-date there have been 2,421 cases of influenza, compared to 925 cases reported for the same period last year. The influenza chart shows that influenza activity in South Australia is increasing.

For more information: SA Health

Tasmania

This report describes flu activity in Tasmania up to Sunday 31 May 2015.
Available data over this period indicate:
 Despite more notified cases than is usual for the first 5 months of the year, other measures of influenza activity do not suggest a significant increase in community disease.
 A sharp and sustained increase in cases indicative of the start of the 2015 winter flu season has not yet occurred.
 Influenza A virus is responsible for the majority of recent influenza infections.

Flu Notifications
Tasmanian laboratories are required to notify the Director of Public Health of evidence of influenza infection (flu) in specimens collected from patients. These specimens are usually nose or throat swabs, less often a blood sample. The best test for flu involves PCR1 to detect influenza virus RNA present in a nose or throat swab.
Since the last fluTAS report 29 notifications of laboratory-diagnosed flu in Tasmanian residents have been notified to the Director of Public Health. A total of 99 notifications of flu have been notified since the start of 2015. The overall trend is typical of ?inter-seasonal? activity (see Figure 1).
Flu notifications during May 2015 were almost equal in each of the three regions of Tasmania

For more information: DHHS Tasmania

*Victoria

Report No 9 Week ending 28/06/15
Summary
 Influenza-like illness (ILI) activity remained below baseline levels (4.0) this week with 2.8 cases per 1000 patients
seen, compared to 2.9 in the previous week. Data from the National Home Doctor Service (Victorian data)
remained above the baseline threshold (10.0) with a proportion of 11.4.
 This week we received 21 surveillance swabs of which 7 (33%) were positive for influenza. From the 140 swabs
received from surveillance GPs this season (27/4/15 ? 28/6/15) 32 (23%) have been positive for influenza, 4
A(untyped), 7 A(H3N2) and 21 influenza B.
 The majority of viruses detected through routine testing this week were picornavirus and RSV. Of the 69 influenza
viruses detected so far this year 5 were A(H1N1)pdm09, 39 were A(H3N2), 8 A(untyped) and 17 were influenza B.
 Since 13/4/2015 FluCAN have reported 58 hospitalisations with confirmed influenza, of which 24 were untyped
influenza A patients and 34 were influenza B, from the 4 Victorian sentinel hospitals. Of the 58, 3 have been in
ICU/HDU, none have been pregnant and 41 have had medical comorbidities.
 Of the 28 influenza viruses analysed at the WHO Collaborating Centre for Reference and Research on Influenza
year to date from Victoria, 7 were A(H1N1)pdm09, 14 A(H3N2) and 7 influenza B.
 The total number of laboratory confirmed notifications to the National Notifiable Diseases Surveillance System
(NNDSS) year to date was 13,047, of which 2,220 (17%) were from Victoria.

For more information: Victorian Infectious Diseases Reference Laboratory

*Western Australia

WEEK ENDING 28TH JUNE 2015

Summary: Rates of influenza-like illness increased this week.
 ILI presentations to sentinel emergency departments (EDs) and sentinel general practitioners
(GPs) increased this week.
 Hospitalisations with confirmed influenza have been relatively steady over recent weeks, at
around 10 per 1000 admissions.
 Influenza virus detections, test positivity and notifications are have changed little in the past few
weeks, with influenza B viruses (75%) and influenza A/H3N2 (20%) viruses dominating
detections; influenza A/H1N1 is co-circulating at a low level (5%). The influenza B strains
currently circulating are 90% Yamagata lineage, matching the trivalent influenza vaccine strain.
 Non-influenza respiratory virus detections decreased; however, respiratory syncytial virus
activity remains high.

For more information: WA Dept.of Health

*Nationally

For the period to Jan 1- Jul 4th, 2015 there were 13,709 confirmed Influenza cases.

The majority of notifications have been in QLD with 3,940 , NSW had 2,752, SA 2,616, VIC 2,389, WA had 1,555, ACT 210, TAS 163 and NT 84.

For national data: National Notifiable Diseases Surveillance System

*Australian Sentinel Practices Research Network (ASPREN)

No. 13, 2015 15th June - 28th June 2015

SYNDROMIC SURVEILLANCE
REPORTING
Reports were received from 276 GPs from 8
states and territories during the reporting
period. During weeks 25 and 26 a total of
19,540 and 19,017 consultations were made,
respectively.

INFLUENZA-LIKE-ILLNESS (ILI)
Nationally, ILI notifications increased over the period with 151
and 166 notifications in weeks 25 and 26 respectively. ILI
rates reported in this period increased with 10 and 12 cases
per 1000 consultations in weeks 25 and 26 respectively,
compared to 8 cases per 1000 consultations in weeks 23 and
24. For the same reporting period in 2014, ILI rates were
lower at 9 cases per 1000 consultations (see Figure 5). On a
state-by-state basis, it is important to note the increased ILI
rate in Rural SA (see Figure 2).


For more information: ASPREN

*Flu Tracking

Flutracking Weekly Interim Report
Week ending 28 June 2015

Low levels of influenza-like illness activity

This survey was sent on Monday, 29 June 2015 at 01:13 AM and by 09:00 AM, Thursday 02 July we had received 21019 responses (21553 last week) from 12982 people responding for themselves and 8037 household members across Australia.

Across Australia, fever and cough was reported by 2.6% of vaccinated participants and 3.3% of unvaccinated participants. Fever, cough and absence from normal duties was reported by 1.6% of vaccinated participants and 2.0% of unvaccinated participants

For participants this week, 12769/21019 (60.7 %) have received the seasonal vaccine so far. Of the 4345 participants who identified as working face-to-face with patients, 3485 (80.2%) have received the vaccine.

For more information: Flu Tracking


*Australian influenza report 2015 - Current report:

Australian Influenza Surveillance Report No 02 - 06 June to 19 June 2015
Summary
There are indications that the 2015 influenza season is imminent. While influenza activity is currently variable across the country, most surveillance systems are showing an overall increase.
As at 19 June 2015, there were 11,585 cases of laboratory confirmed influenza reported, with 1,795 notifications reported in the most recent fortnight.
So far this year, influenza A has been the predominant influenza virus type. However influenza B has been circulating at increasing levels and is the predominant influenza virus type circulating in the most recent fortnight. This trend is common amongst all jurisdictions, except Tasmania and the Northern Territory where overall activity is low.
Systems that monitor influenza-like illness (ILI) are reporting low levels of activity, with an increase in activity in recent weeks, as expected at this time of year.
Respiratory viruses other than influenza are more commonly causing ILI in the community, with rhinovirus and RSV detected most frequently.
Influenza B is the dominant type responsible for influenza associated hospitalisations.
There is no indication of the potential severity of the season at this time.
Of the limited number of isolates that have been further characterised for similarity with the vaccine components, influenza A viruses appear to be well matched. Over 80% of the influenza B viruses characterised are a match to the trivalent vaccine strain; the remaining influenza B viruses match the additional strain in the quadrivalent vaccine.

For more information: Department of Health
 
Updated information is indicated with a *

*New South Wales

NSW Health Influenza Surveillance Report Week 27: 29 June to 5 July 2015
Summary:
 All measures indicate that the influenza season has commenced, however hospital activity remains low to moderate.
 Influenza activity is expected to continue to increase from now until the season peaks. In this reporting week:
 Hospital surveillance ? presentations to NSW emergency departments for influenza-like illness (ILI) increased and were above the flu season threshold. Bronchiolitis presentations remained high.
 Laboratory surveillance ? the proportion of respiratory samples positive for influenza was low (7.3%) but continues to increase, with influenza B viruses predominant. Respiratory syncytial virus (RSV) and rhinovirus activity remain high.
 Community surveillance ? influenza notifications were highest in metropolitan areas but low overall. Data collected from ASPREN and FluTracking show low but increasing ILI activity as expected for this time of year. There were two reports of an influenza outbreak in an institution.
Deaths - The NSW Registry of Births, Deaths, and Marriages have recorded 11 deaths in association with influenza in 2015.
 National and international influenza surveillance ? Across Australia the influenza activity is variable. While influenza notifications are higher than at this point last year, they are still at low levels.

For more information: NSW Health - Infectious Diseases

*Queensland

For Period 1 January - 5 July 2015

There were 358 notifications reported this week. Of these cases, 278 were attributed to influenza B virus. Of the 80 Influenza A samples, 11 were identified as A/H3N2, 1 as A/H1N1pdm09, 68 had subtype not available There were 19 hospital admissions including 0 to ICU.

YTD there were 4,131 notifications reported. Of these cases, 1,767 were attributed to influenza B virus. Of the 2,364 Influenza A samples, 78 were identified as A(H1N1)pdm09 and 599 as A/H3N2.

There have been 261 hospital admissions including 25 to ICU. (one less than last week? - Ro)

For more information: QLD Health

*South Australia

28 June to 4 July 2015

Three hundred and forty-eight cases of influenza were reported this week. Of these, 119 were
characterised as influenza A and 229 were characterised as influenza B.
Cases comprised of 154 males and 194 females, with a median age of 17 years. One hundred and
nineteen (34%) notifications were for children aged less than 10 years and 34 (10%) notifications for
persons aged 65 years or greater. Year-to-date there have been 2,770 cases of influenza, compared
to 1,011 cases reported for the same period last year.
The influenza chart shows that influenza activity in South Australia is increasing.

For more information: SA Health

*Tasmania

This report describes flu activity in Tasmania up to Sunday 28 June 2015.
Available data over this period indicate:
 Increased flu in the South of the State indicated that the 2015 winter flu season has started
 Flu notifications and the amount of testing increased during June.
 Tasmanian FluTracking participants increasingly reported Influenza-like Illness (ILI) during June.
 Influenza A virus is responsible for the majority of recent influenza infections.

Flu Notifications
Tasmanian laboratories are required to notify the Director of Public Health of evidence of influenza infection (flu)
in specimens collected from patients. These specimens are usually nose or throat swabs, less often a blood
sample. The best test for flu involves PCR1 to detect influenza virus RNA present in a nose or throat swab.
Since the last fluTAS Report 61 notifications of laboratory-diagnosed flu in Tasmanian residents have been notified
to the Director of Public Health. A total of 160 notifications of flu have been notified since the start of 2015.
Notifications of flu increased during June indicating the commencement of the winter flu season (see Figure 1). Of
the 61 notifications since the last fluTAS Report, 41 were during the fortnight ending Sunday 28 June. This
increase in flu has been limited to the south of the State

For more information: DHHS Tasmania

*Victoria

Report No 10 Week ending 05/07/15
Summary
 Influenza-like illness (ILI) activity increased above baseline levels (4.0) this week with 6.3 cases per 1000 patients
seen, compared to 2.9 in the previous week. Data from the National Home Doctor Service (Victorian data)
remained above the baseline threshold (10.0) with a proportion of 10.9.
 This week we received 27 surveillance swabs of which 6 (22%) were positive for influenza. From the 167 swabs
received from surveillance GPs this season (27/4/15 ? 5/7/15) 38 (23%) have been positive for influenza, 1
A(untyped), 10 A(H3N2) and 27 influenza B.
 The majority of viruses detected through routine testing this week were influenza B and RSV. Of the 82 influenza
viruses detected so far this year 5 were A(H1N1)pdm09, 48 were A(H3N2), 3 A(untyped) and 26 were influenza B.
 Since 13/4/2015 FluCAN have reported 78 hospitalisations with confirmed influenza, of which 33 were untyped
influenza A patients, 1 A(H1N1)pdm09 and 43 were influenza B, from the 4 Victorian sentinel hospitals. Of the 78,
3 have been in ICU/HDU, none have been pregnant and 54 have had medical comorbidities.
 Of the 32 influenza viruses analysed at the WHO Collaborating Centre for Reference and Research on Influenza
year to date from Victoria, 7 were A(H1N1)pdm09, 15 A(H3N2) and 10 influenza B.
 The total number of laboratory confirmed notifications to the National Notifiable Diseases Surveillance System
(NNDSS) year to date was 14,810, of which 2,610 (18%) were from Victoria.

For more information: Victorian Infectious Diseases Reference Laboratory

*Western Australia

WEEK ENDING 5TH JULY 2015

Summary: ILI activity and more direct indicators of influenza virus activity all increased this week,
indicating influenza season has commenced.
? ILI presentations to sentinel emergency departments (EDs) and sentinel general practitioners
(GPs) increased this week.
? Hospitalisations with confirmed influenza have been relatively steady over recent weeks, at
around 10 per 1000 admissions.
? Influenza virus detections, notifications and test positivity rate in both sentinel and routinely
collected specimens all increased this week; influenza B viruses (80%) and influenza A/H3N2
(19%) viruses remain the dominantly detected subtypes, with very little influenza A/H1N1
circulating. The influenza B strains currently circulating are around 90% Yamagata lineage,
matching the trivalent influenza vaccine strain.
? Overall non-influenza respiratory virus detections increased, and respiratory syncytial virus
activity remains particularly high.

For more information: WA Dept.of Health

*Nationally

For the period to Jan 1- Jul 11th, 2015 there were 15,571 confirmed Influenza cases.

The majority of notifications have been in QLD with 4,374 , NSW had 3,079, SA 3,039, VIC 2,760, WA had 1,763, ACT 280, TAS 187 and NT 89.

For national data: National Notifiable Diseases Surveillance System

Australian Sentinel Practices Research Network (ASPREN)

No. 13, 2015 15th June - 28th June 2015

SYNDROMIC SURVEILLANCE
REPORTING
Reports were received from 276 GPs from 8
states and territories during the reporting
period. During weeks 25 and 26 a total of
19,540 and 19,017 consultations were made,
respectively.

INFLUENZA-LIKE-ILLNESS (ILI)
Nationally, ILI notifications increased over the period with 151
and 166 notifications in weeks 25 and 26 respectively. ILI
rates reported in this period increased with 10 and 12 cases
per 1000 consultations in weeks 25 and 26 respectively,
compared to 8 cases per 1000 consultations in weeks 23 and
24. For the same reporting period in 2014, ILI rates were
lower at 9 cases per 1000 consultations (see Figure 5). On a
state-by-state basis, it is important to note the increased ILI
rate in Rural SA (see Figure 2).


For more information: ASPREN

*Flu Tracking

Flutracking Weekly Interim Report
Week ending 5 July 2015

Low levels of influenza-like illness activity

This survey was sent on Monday, 06 July 2015 at 01:13 AM and by 09:00 AM, Thursday 09 July we had received 20352 responses (21019 last week) from 12658 people responding for themselves and 7694 household members across Australia.

Across Australia, fever and cough was reported by 2.8% of vaccinated participants and 2.9% of unvaccinated participants. Fever, cough and absence from normal duties was reported by 1.8% of vaccinated participants and 1.6% of unvaccinated participants

For participants this week, 12500/20352 (61.4 %) have received the seasonal vaccine so far. Of the 4228 participants who identified as working face-to-face with patients, 3390 (80.2%) have received the vaccine.

For more information: Flu Tracking


*Australian influenza report 2015 - Current report:

Australian Influenza Surveillance Report No 03 - 20 June to 03 July 2015
Summary

The annual increase in influenza activity has begun.
Influenza notifications are higher compared with the same time in previous years. However, the overall scale and clinical severity of this year?s influenza season will become apparent as the season progresses.
Influenza notification rates have been highest among those aged over 85 years with a secondary peak in those aged between 5 and 9 years.
Influenza B has been circulating at increasing levels nationally and is the predominant influenza virus type circulating in the most recent fortnight.
Influenza associated hospitalisations to sentinel sites have increased in the recent fortnight, with less than 10% of patients admitted directly to ICU. The majority of hospital admissions have been associated with influenza B infections.
Systems that monitor influenza-like illness (ILI) are reporting variable ILI activity which is not unusual at this point in the season. Influenza viruses are increasingly causing ILI in the community, with other respiratory viruses like Rhinovirus and RSV circulating at similar levels.
The seasonal influenza vaccines appear to be a good match for circulating strains.
...
Nationally Notified Influenza Associated Deaths
So far in 2015, 34 influenza associated deaths have been notified to the NNDSS, with a median age of 87 years (range 49 to 102 years). Influenza type A infection was reported in all but three of the influenza associated deaths. Influenza A(H3N2) was associated with deaths in older age groups. The number of influenza associated deaths reported to the NNDSS is reliant on the follow up of cases to determine the outcome of their infection and most likely does not represent the true mortality impact associated with this disease.

New South Wales Influenza and Pneumonia Death Registrations
Death registration data for the week ending 22 May 2015 show that there were 1.06 pneumonia or influenza associated deaths per 100,000 population in NSW, which is below the epidemic threshold of 1.44 per 100,000 NSW population (Figure 17). Up to 22 May 2015, out of 18,156 deaths in NSW, seven death certificates noted influenza and 1,574 noted pneumonia.
...

For more information: Department of Health
 
Updated information is indicated with a *

*New South Wales

NSW Health Influenza Surveillance Report
Week 28: 6 to 12 July 2015
Summary:
 All measures indicate that the influenza season has commenced, however hospital activity
remains low to moderate.
 Influenza activity is expected to continue to increase from now until the season peaks.
In this reporting week:
 Hospital surveillance ? presentations to NSW emergency departments for influenza-like illness
(ILI) were steady and were above the flu season threshold. Bronchiolitis presentations remained
high although appear to be trending downwards.
 Laboratory surveillance ? the proportion of respiratory samples positive for influenza was low
(10.0%) but continues to increase, with influenza B viruses predominant. Respiratory syncytial
virus (RSV) and rhinovirus activity remain high.
 Community surveillance ? influenza notifications were highest in metropolitan areas but low
overall. Data collected from ASPREN and FluTracking show low but increasing ILI activity as
expected for this time of year. There was one report of an influenza outbreak in an institution.
 National and international influenza surveillance ? Across Australia the influenza activity is variable.
While influenza notifications are higher than at this point last year, they are still at low levels.


For more information: NSW Health - Infectious Diseases

*Queensland

For Period 1 January - 12 July 2015

There were 458 notifications reported this week. Of these cases, 347 were attributed to influenza B virus. Of the 111 Influenza A samples, 13 were identified as A/H3N2, 6 as A/H1N1pdm09, 92 had subtype not available There were 18 hospital admissions including 1 to ICU.

YTD there were 4,651 notifications reported. Of these cases, 2,148 were attributed to influenza B virus. Of the 2,503 Influenza A samples, 86 were identified as A(H1N1)pdm09 and 625 as A/H3N2.

There have been 294 hospital admissions including 28 to ICU.

For more information: QLD Health

*South Australia

5 July- 11 July 2015

Four hundred and sixteen cases of influenza were reported this week. Of these, 144 were
characterised as influenza A and 272 were characterised as influenza B.

Cases comprised of 197 males and 219 females, with a median age of 26 years. One hundred and
thirty-six (33%) notifications were for children aged less than 10 years and 62 (15%) notifications for
persons aged 65 years or greater. Year-to-date there have been 3,187 cases of influenza, compared
to 1,129 cases reported for the same period last year.

The influenza chart shows that influenza activity in South Australia is increasing.

For more information: SA Health

Tasmania

This report describes flu activity in Tasmania up to Sunday 28 June 2015.
Available data over this period indicate:
 Increased flu in the South of the State indicated that the 2015 winter flu season has started
 Flu notifications and the amount of testing increased during June.
 Tasmanian FluTracking participants increasingly reported Influenza-like Illness (ILI) during June.
 Influenza A virus is responsible for the majority of recent influenza infections.

Flu Notifications
Tasmanian laboratories are required to notify the Director of Public Health of evidence of influenza infection (flu)
in specimens collected from patients. These specimens are usually nose or throat swabs, less often a blood
sample. The best test for flu involves PCR1 to detect influenza virus RNA present in a nose or throat swab.
Since the last fluTAS Report 61 notifications of laboratory-diagnosed flu in Tasmanian residents have been notified
to the Director of Public Health. A total of 160 notifications of flu have been notified since the start of 2015.
Notifications of flu increased during June indicating the commencement of the winter flu season (see Figure 1). Of
the 61 notifications since the last fluTAS Report, 41 were during the fortnight ending Sunday 28 June. This
increase in flu has been limited to the south of the State

For more information: DHHS Tasmania

*Victoria

Report No 11 Week ending 12/07/15
Summary
 Influenza-like illness (ILI) activity remained above baseline levels (4.0) this week with 4.7 cases per 1000 patients
seen, compared to 6.2 in the previous week. Data from the National Home Doctor Service (Victorian data)
remained above the baseline threshold (10.0) with a proportion of 20.6.
 This week we received 27 surveillance swabs of which 5 (19%) were positive for influenza. From the 194 swabs
received from surveillance GPs this season (27/4/15 ? 12/7/15) 43 (22%) have been positive for influenza, 3
A(untyped), 10 A(H3N2) and 30 influenza B.
 The majority of viruses detected through routine testing this week were picornavirus. Of the 88 influenza viruses
detected so far this year 5 were A(H1N1)pdm09, 48 were A(H3N2), 3 A(untyped) and 32 were influenza B.
 Since 13/4/2015 FluCAN have reported 100 hospitalisations with confirmed influenza, of which 40 were untyped
influenza A patients, 1 A(H1N1)pdm09 and 59 were influenza B, from the 4 Victorian sentinel hospitals. Of the
100, 3 have been in ICU/HDU, none have been pregnant and 72 have had medical comorbidities.
 Of the 32 influenza viruses analysed at the WHO Collaborating Centre for Reference and Research on Influenza
year to date from Victoria, 7 were A(H1N1)pdm09, 15 A(H3N2) and 10 influenza B.
 The total number of laboratory confirmed notifications to the National Notifiable Diseases Surveillance System
(NNDSS) year to date was 16,881, of which 3,054 (18%) were from Victoria.

For more information: Victorian Infectious Diseases Reference Laboratory

Western Australia

WEEK ENDING 5TH JULY 2015

Summary: ILI activity and more direct indicators of influenza virus activity all increased this week,
indicating influenza season has commenced.
• ILI presentations to sentinel emergency departments (EDs) and sentinel general practitioners
(GPs) increased this week.
• Hospitalisations with confirmed influenza have been relatively steady over recent weeks, at
around 10 per 1000 admissions.
• Influenza virus detections, notifications and test positivity rate in both sentinel and routinely
collected specimens all increased this week; influenza B viruses (80%) and influenza A/H3N2
(19%) viruses remain the dominantly detected subtypes, with very little influenza A/H1N1
circulating. The influenza B strains currently circulating are around 90% Yamagata lineage,
matching the trivalent influenza vaccine strain.
• Overall non-influenza respiratory virus detections increased, and respiratory syncytial virus
activity remains particularly high.

For more information: WA Dept.of Health

*Nationally

For the period to Jan 1- Jul 18th, 2015 there were 17,754 confirmed Influenza cases.

The largest number of notifications have been in QLD with 4,941 , NSW had 3,502, SA 3,471, VIC 3,228, WA had 1,949, ACT 353, TAS 216 and NT 94.

For national data: National Notifiable Diseases Surveillance System

Australian Sentinel Practices Research Network (ASPREN)

No. 13, 2015 15th June - 28th June 2015

SYNDROMIC SURVEILLANCE
REPORTING
Reports were received from 276 GPs from 8
states and territories during the reporting
period. During weeks 25 and 26 a total of
19,540 and 19,017 consultations were made,
respectively.

INFLUENZA-LIKE-ILLNESS (ILI)
Nationally, ILI notifications increased over the period with 151
and 166 notifications in weeks 25 and 26 respectively. ILI
rates reported in this period increased with 10 and 12 cases
per 1000 consultations in weeks 25 and 26 respectively,
compared to 8 cases per 1000 consultations in weeks 23 and
24. For the same reporting period in 2014, ILI rates were
lower at 9 cases per 1000 consultations (see Figure 5). On a
state-by-state basis, it is important to note the increased ILI
rate in Rural SA (see Figure 2).


For more information: ASPREN

*Flu Tracking

Flutracking Weekly Interim Report
Week ending 12 July 2015

Low levels of influenza-like illness activity

This survey was sent on Monday, 13 July 2015 at 01:13 AM and by 09:00 AM, Thursday 16 July we had received 20690 responses (20352 last week) from 12826 people responding for themselves and 7864 household members across Australia.

Across Australia, fever and cough was reported by 2.6% of vaccinated participants and 3.2% of unvaccinated participants. Fever, cough and absence from normal duties was reported by 1.8% of vaccinated participants and 1.9% of unvaccinated participants.

For participants this week, 12746/20690 (61.6 %) have received the seasonal vaccine so far. Of the 4289 participants who identified as working face-to-face with patients, 3446 (80.3%) have received the vaccine.

For more information: Flu Tracking


Australian influenza report 2015 - Current report:

Australian Influenza Surveillance Report No 03 - 20 June to 03 July 2015
Summary

The annual increase in influenza activity has begun.
Influenza notifications are higher compared with the same time in previous years. However, the overall scale and clinical severity of this year’s influenza season will become apparent as the season progresses.
Influenza notification rates have been highest among those aged over 85 years with a secondary peak in those aged between 5 and 9 years.
Influenza B has been circulating at increasing levels nationally and is the predominant influenza virus type circulating in the most recent fortnight.
Influenza associated hospitalisations to sentinel sites have increased in the recent fortnight, with less than 10% of patients admitted directly to ICU. The majority of hospital admissions have been associated with influenza B infections.
Systems that monitor influenza-like illness (ILI) are reporting variable ILI activity which is not unusual at this point in the season. Influenza viruses are increasingly causing ILI in the community, with other respiratory viruses like Rhinovirus and RSV circulating at similar levels.
The seasonal influenza vaccines appear to be a good match for circulating strains.
...
Nationally Notified Influenza Associated Deaths
So far in 2015, 34 influenza associated deaths have been notified to the NNDSS, with a median age of 87 years (range 49 to 102 years). Influenza type A infection was reported in all but three of the influenza associated deaths. Influenza A(H3N2) was associated with deaths in older age groups. The number of influenza associated deaths reported to the NNDSS is reliant on the follow up of cases to determine the outcome of their infection and most likely does not represent the true mortality impact associated with this disease.

New South Wales Influenza and Pneumonia Death Registrations
Death registration data for the week ending 22 May 2015 show that there were 1.06 pneumonia or influenza associated deaths per 100,000 population in NSW, which is below the epidemic threshold of 1.44 per 100,000 NSW population (Figure 17). Up to 22 May 2015, out of 18,156 deaths in NSW, seven death certificates noted influenza and 1,574 noted pneumonia.
...

For more information: Department of Health
 
Updated information is indicated with a *

*New South Wales

NSW Health Influenza Surveillance Report
Week 29: 13 to 19 July 2015
Summary:
 The influenza season is continuing with influenza B strains predominating.
 The impact on public hospitals is currently moderate overall but with higher levels of activity in some districts.
 Influenza activity is expected to continue to increase in coming weeks. Influenza seasons typically last from 8 to 17 weeks.
 On current trends, influenza activity is likely to peak in late August.

In this reporting week:
 Hospital surveillance ? presentations to NSW emergency departments for influenza-like illness (ILI) increased and remain above the flu season threshold. Bronchiolitis presentations remained high but continue to trend down.
 Laboratory surveillance ? the proportion of respiratory samples positive for influenza was low to moderate (11.8%) and continues to increase. Influenza B viruses continue to predominate.
 Community surveillance ? influenza notifications across the majority of LHDs are increasing. Data collected from ASPREN and FluTracking show low but increasing ILI activity as expected for this time of year. There were three reports of influenza outbreaks in institutions.
 National and international influenza surveillance ? Across Australia the influenza activity is variable. While influenza notifications are higher than at this point last year, they are still at low levels.

For more information: NSW Health - Infectious Diseases

*Queensland

For Period 1 January - 19 July 2015

There were 464 notifications reported this week. Of these cases, 341 were attributed to influenza B virus. Of the 123 Influenza A samples, 8 were identified as A/H3N2, 2 as A/H1N1pdm09, 113 had subtype not available There were 24 hospital admissions including 2 to ICU.

YTD there were 5,168 notifications reported. Of these cases, 2,513 were attributed to influenza B virus. Of the 2,655 Influenza A samples, 91 were identified as A(H1N1)pdm09 and 641 as A/H3N2.

There have been 326 hospital admissions including 30 to ICU.

For more information: QLD Health

*South Australia

12 July to 18 July 2015

Many cases of influenza are being reported and we advise people to get vaccinated as soon as possible if they have not had an influenza vaccination this year.

Four hundred and thirty-four cases of influenza were reported this week. Of these, 126 were
characterised as influenza A and 308 were characterised as influenza B.

Cases comprised of 216 males and 218 females, with a median age of 34 years. One hundred and
three (24%) notifications were for children aged less than 10 years and 76 (18%) notifications for
persons aged 65 years or greater. Year-to-date there have been 3,622 cases of influenza, compared
to 1,275 cases reported for the same period last year.

The influenza chart shows that influenza activity in South Australia is increasing.

For more information: SA Health

Tasmania

This report describes flu activity in Tasmania up to Sunday 28 June 2015.
Available data over this period indicate:
 Increased flu in the South of the State indicated that the 2015 winter flu season has started
 Flu notifications and the amount of testing increased during June.
 Tasmanian FluTracking participants increasingly reported Influenza-like Illness (ILI) during June.
 Influenza A virus is responsible for the majority of recent influenza infections.

Flu Notifications
Tasmanian laboratories are required to notify the Director of Public Health of evidence of influenza infection (flu)
in specimens collected from patients. These specimens are usually nose or throat swabs, less often a blood
sample. The best test for flu involves PCR1 to detect influenza virus RNA present in a nose or throat swab.
Since the last fluTAS Report 61 notifications of laboratory-diagnosed flu in Tasmanian residents have been notified
to the Director of Public Health. A total of 160 notifications of flu have been notified since the start of 2015.
Notifications of flu increased during June indicating the commencement of the winter flu season (see Figure 1). Of
the 61 notifications since the last fluTAS Report, 41 were during the fortnight ending Sunday 28 June. This
increase in flu has been limited to the south of the State

For more information: DHHS Tasmania

*Victoria

Report No 12 Week ending 19/07/15
Summary
 Influenza-like illness (ILI) activity remained above baseline levels (4.0) this week with 5.8 cases per 1000 patients
seen, compared to 4.7 in the previous week. Data from the National Home Doctor Service (Victorian data)
remained above the baseline threshold (10.0) with a proportion of 27.5.
 This week we received 25 surveillance swabs of which 5 (32%) were positive for influenza. From the 219 swabs
received from surveillance GPs this season (27/4/15 ? 19/7/15) 51 (23%) have been positive for influenza, 2
A(untyped), 14 A(H3N2) and 35 influenza B.
 The majority of viruses detected through routine testing this week were picornavirus. Of the 102 influenza viruses
detected so far this year 6 were A(H1N1)pdm09, 52 were A(H3N2), 5 A(untyped) and 39 were influenza B.
 Since 13/4/2015 FluCAN have reported 124 hospitalisations with confirmed influenza, of which 52 were untyped
influenza A patients, 1 A(H1N1)pdm09 and 71 were influenza B, from the 4 Victorian sentinel hospitals. Of the
124, 6 have been in ICU/HDU, one has been pregnant and 92 have had medical comorbidities.
 Of the 32 influenza viruses analysed at the WHO Collaborating Centre for Reference and Research on Influenza
year to date from Victoria, 7 were A(H1N1)pdm09, 15 A(H3N2) and 13 influenza B.
 The total number of laboratory confirmed notifications to the National Notifiable Diseases Surveillance System
(NNDSS) year to date was 19,277, of which 3,547 (18%) were from Victoria.

For more information: Victorian Infectious Diseases Reference Laboratory

*Western Australia

WEEK ENDING 19TH JULY 2015

Summary: Non-influenza virus activity, particularly respiratory syncytial virus (RSV), remains high.
Influenza activity, primarily due to influenza B virus, remains moderate in intensity.

 ILI presentations to sentinel general practitioners (GPs) increased this week, but conversely
presentations to sentinel emergency departments (EDs) decreased.
 Influenza virus detections and notifications decreased for the second consecutive week, while
percent positivity has fluctuated at around 20% over recent weeks.
 Hospitalisations with confirmed influenza increased to 17.5 per 1000 admissions, similar to the
average for this week in recent years. Over 60% of influenza admissions are due to influenza B
virus.
 Influenza B (68%) and influenza A/H3N2 (29%) viruses remain the dominantly detected
subtypes. The influenza B strains currently circulating are around 80% Yamagata lineage,
matching the trivalent influenza vaccine strain.
 Non-influenza respiratory virus (particularly RSV) activity remains high.

For more information: WA Dept.of Health

*Nationally

For the period to Jan 1- Jul 25th, 2015 there were 20,320 confirmed Influenza cases.

The largest number of notifications have been in QLD with 5,607 , NSW had 4,077, SA 3,964, VIC 3,721, WA had 2,176, ACT 424, TAS 251 and NT 100.

For national data: National Notifiable Diseases Surveillance System

*Australian Sentinel Practices Research Network (ASPREN)

No. 14, 2015
29th June - 12th July 2015

SYNDROMIC SURVEILLANCE
REPORTING
Reports were received from 274 GPs from 8
states and territories during the reporting
period. During weeks 27 and 28 a total of
17,884 and 17,337 consultations were made,
respectively.

INFLUENZA-LIKE-ILLNESS (ILI)
Nationally, ILI notifications increased over the period with 193
and 184 notifications in weeks 27 and 28 respectively. ILI
rates reported in this period increased with 16 and 15 cases
per 1000 consultations in weeks 27 and 28 respectively,
compared to 10 and 12 cases per 1000 consultations in
weeks 25 and 26 respectively. For the same reporting period
in 2014, ILI rates were lower at 10 cases per 1000
consultations (see Figure 5). On a state-by-state basis, it is
important to note the increased ILI rate in Urban SA .

For more information: ASPREN

*Flu Tracking

Flutracking Weekly Interim Report
Week ending 19 July 2015

Low levels of influenza-like illness activity

This survey was sent on Monday, 20 July 2015 at 01:13 AM and by 09:00 AM, Thursday 23 July we had received
21231 responses (20690 last week) from 13061 people responding for themselves and 8170 household members
across Australia.

Across Australia, fever and cough was reported by 2.5% of
vaccinated participants and 2.9% of unvaccinated
participants. Fever, cough and absence from normal duties
was reported by 1.6% of vaccinated participants and 1.6%
of unvaccinated participants.

For participants this week, 13093/21231 (61.7 %) have
received the seasonal vaccine so far. Of the 4369
participants who identified as working face-to-face with
patients, 3527 (80.7%) have received the vaccine.

For more information: Flu Tracking


*Australian influenza report 2015 - Current report:

Week ending 17 July 2015

SUMMARY
 Most surveillance systems indicate that the influenza season is well underway. It is not an unusual
influenza season thus far. (Figure 1).
 All States and Territories have shown increases in influenza activity in recent weeks with the exception of
the Northern Territory (Figure 2).
 The seasonal increase in influenza-like illness (ILI), detected through the sentinel GP ILI surveillance
system, appear to have eased (Figure 4). Non-influenza respiratory viruses continue to be the major driver
of ILI in the community.
 In the last fortnight, influenza B has been the dominant influenza type, comprising two thirds of all
notifications. (Figure 3).
 Hospitalisations with confirmed influenza have increased in recent weeks, and case counts are similar to
numbers seen in 2012 and 2014, and greater than those reported in 2011 and 2013. The proportion of
adult patients admitted to ICU is similar to those reported in previous years.
 Over 400 clinical isolates have been further characterised for similarity with the vaccine components. The
influenza A viruses appear to be well matched. Approximately 80% of the influenza B viruses characterised
are a match to the trivalent vaccine strain with the remaining influenza B viruses matching the additional
strain in the quadrivalent vaccine.

Australia.png

For more information: Department of Health
 
Updated information is indicated with a *

*New South Wales

NSW Health Influenza Surveillance Report
Week 30: 20 to 26 July 2015
Summary:
 The influenza season is continuing with influenza B strains predominating.
 The impact on public hospitals is currently moderate overall but with higher levels of
activity in some districts.
 Influenza activity is expected to continue to increase in coming weeks. Influenza seasons
typically last from 8 to 17 weeks.
 On current trends, influenza activity is likely to peak in late August.

In this reporting week:
 Hospital surveillance ? presentations to NSW emergency departments for influenza-like illness
(ILI) were steady and remain above the flu season threshold. Bronchiolitis presentations remained
high but continue to trend down.
 Laboratory surveillance ? the proportion of respiratory samples positive for influenza was
moderate (17.1%) and continues to increase. Influenza B viruses continue to predominate.
 Community surveillance ? influenza notifications across the majority of LHDs are increasing. Data
collected from ASPREN and FluTracking show low but increasing ILI activity as expected for this
time of year. There was one report of an influenza outbreak in an institution.
 National and international influenza surveillance ? Across Australia influenza activity is increasing
with the exception of the Northern Territory. Influenza B has been the dominant influenza virus
type, comprising two thirds of all notifications.

For more information: NSW Health - Infectious Diseases

*Queensland

For Period 1 January - 26 July 2015

There were 888 notifications reported this week. Of these cases, 641 were attributed to influenza B virus. Of the 247 Influenza A samples, 16 were identified as A/H3N2, 5 as A/H1N1pdm09, 226 had subtype not available There were 37 hospital admissions including 4 to ICU.

YTD there were 6,132 notifications reported. Of these cases, 3,199 were attributed to influenza B virus. Of the 2,933 Influenza A samples, 97 were identified as A(H1N1)pdm09 and 667 as A/H3N2.

There have been 389 hospital admissions including 37 to ICU.

For more information: QLD Health

*South Australia

19 July to 25 July 2015

Five hundred and forty cases of influenza were reported this week. Of these, 172 were characterised
as influenza A and 368 were characterised as influenza B.

Cases comprised of 252 males and 288 females, with a median age of 35 years. One hundred and
twenty-nine (24%) notifications were for children aged less than 10 years and 86 (16%) notifications
for persons aged 65 years or greater. Year-to-date there have been 4,170 cases of influenza,
compared to 1,474 cases reported for the same period last year.

The influenza chart shows that influenza activity in South Australia is increasing.

For more information: SA Health

Tasmania

This report describes flu activity in Tasmania up to Sunday 28 June 2015.
Available data over this period indicate:
 Increased flu in the South of the State indicated that the 2015 winter flu season has started
 Flu notifications and the amount of testing increased during June.
 Tasmanian FluTracking participants increasingly reported Influenza-like Illness (ILI) during June.
 Influenza A virus is responsible for the majority of recent influenza infections.

Flu Notifications
Tasmanian laboratories are required to notify the Director of Public Health of evidence of influenza infection (flu)
in specimens collected from patients. These specimens are usually nose or throat swabs, less often a blood
sample. The best test for flu involves PCR1 to detect influenza virus RNA present in a nose or throat swab.
Since the last fluTAS Report 61 notifications of laboratory-diagnosed flu in Tasmanian residents have been notified
to the Director of Public Health. A total of 160 notifications of flu have been notified since the start of 2015.
Notifications of flu increased during June indicating the commencement of the winter flu season (see Figure 1). Of
the 61 notifications since the last fluTAS Report, 41 were during the fortnight ending Sunday 28 June. This
increase in flu has been limited to the south of the State

For more information: DHHS Tasmania

*Victoria

Report No 13 Week ending 26/07/15
Summary
 Influenza-like illness (ILI) activity remained above baseline levels (4.0) this week with 5.5 cases per 1000 patients
seen, compared to 6.1 in the previous week.
 This week we received 26 surveillance swabs of which 9 (35%) were positive for influenza. From the 245 swabs
received from surveillance GPs this season (27/4/15 ? 26/7/15) 60 (35%) have been positive for influenza, 2
A(untyped), 17 A(H3N2) and 41 influenza B.
 The majority of viruses detected through routine testing this week were influenza B. Of the 118 influenza viruses
detected so far this year 6 were A(H1N1)pdm09, 56 were A(H3N2), 5 A(untyped) and 51 were influenza B.
 Since 13/4/2015 FluCAN have reported 152 hospitalisations with confirmed influenza, of which 66 were untyped
influenza A patients, 1 A(H1N1)pdm09 and 85 were influenza B, from the 4 Victorian sentinel hospitals. Of the
1152, 6 have been in ICU/HDU, one has been pregnant and 110 have had medical comorbidities.
 Of the 32 influenza viruses analysed at the WHO Collaborating Centre for Reference and Research on Influenza
year to date from Victoria, 7 were A(H1N1)pdm09, 20 A(H3N2) and 29 influenza B.
 The total number of laboratory confirmed notifications to the National Notifiable Diseases Surveillance System
(NNDSS) year to date was 22,366, of which 3,860 (17%) were from Victoria.

For more information: Victorian Infectious Diseases Reference Laboratory

*Western Australia

WEEK ENDING 26TH JULY 2015
KEY POINTS
INFLUENZA AND INFLUENZA-LIKE ILLNESSES (ILI)

Summary: Taken together, direct and indirect indicators suggest that influenza virus activity may have
now peaked, earlier than in recent seasons. Non-influenza virus activity also declined this week.

 ILI presentations to sentinel general practitioners (GPs) decreased this week and presentations
to sentinel emergency departments (EDs) were steady.
 Influenza virus detections, notifications and percent positivity appear to have reached a peak.
Influenza B (68%) and influenza A/H3N2 (29%) viruses remaining the dominantly detected
subtypes. The influenza B strains currently circulating are around 65% Yamagata lineage,
matching the trivalent influenza vaccine strain.
 Hospitalisations with confirmed influenza decreased this week, but remain over 10 cases per
1000 admissions. Over 70% of influenza admissions are due to influenza B virus, reflecting
overall detections in the community.
 Non-influenza respiratory virus activity decreased this week, primarily due to a drop in
respiratory syncytial virus detections.

For more information: WA Dept.of Health

*Nationally

For the period to Jan 1- Aug 1st, 2015 there were 23,611 confirmed Influenza cases.

The largest number of notifications have been in QLD with 6,818 , NSW had 4,977, SA 4,540, VIC 3,957, WA had 2,420, ACT 475, TAS 284 and NT 110.

For national data: National Notifiable Diseases Surveillance System

Australian Sentinel Practices Research Network (ASPREN)

No. 14, 2015
29th June - 12th July 2015

SYNDROMIC SURVEILLANCE
REPORTING
Reports were received from 274 GPs from 8
states and territories during the reporting
period. During weeks 27 and 28 a total of
17,884 and 17,337 consultations were made,
respectively.

INFLUENZA-LIKE-ILLNESS (ILI)
Nationally, ILI notifications increased over the period with 193
and 184 notifications in weeks 27 and 28 respectively. ILI
rates reported in this period increased with 16 and 15 cases
per 1000 consultations in weeks 27 and 28 respectively,
compared to 10 and 12 cases per 1000 consultations in
weeks 25 and 26 respectively. For the same reporting period
in 2014, ILI rates were lower at 10 cases per 1000
consultations (see Figure 5). On a state-by-state basis, it is
important to note the increased ILI rate in Urban SA .

For more information: ASPREN

*Flu Tracking

Flutracking Weekly Interim Report
Week ending 26 July 2015

Low levels of influenza-like illness activity

This survey was sent on Monday, 27 July 2015 at 01:13 AM and by 09:00 AM, Thursday 30 July we had received
21333 responses (21231 last week) from 13099 people responding for themselves and 8234 household members
across Australia.

Across Australia, fever and cough was reported by 2.5% of
vaccinated participants and 3.2% of unvaccinated
participants. Fever, cough and absence from normal duties
was reported by 1.6% of vaccinated participants and 2.1%
of unvaccinated participants

For participants this week, 13214/21333 (61.9 %) have
received the seasonal vaccine so far. Of the 4385
participants who identified as working face-to-face with
patients, 3540 (80.7%) have received the vaccine.

For more information: Flu Tracking


Australian influenza report 2015 - Current report:

Week ending 17 July 2015

SUMMARY
 Most surveillance systems indicate that the influenza season is well underway. It is not an unusual
influenza season thus far. (Figure 1).
 All States and Territories have shown increases in influenza activity in recent weeks with the exception of
the Northern Territory (Figure 2).
 The seasonal increase in influenza-like illness (ILI), detected through the sentinel GP ILI surveillance
system, appear to have eased (Figure 4). Non-influenza respiratory viruses continue to be the major driver
of ILI in the community.
 In the last fortnight, influenza B has been the dominant influenza type, comprising two thirds of all
notifications. (Figure 3).
 Hospitalisations with confirmed influenza have increased in recent weeks, and case counts are similar to
numbers seen in 2012 and 2014, and greater than those reported in 2011 and 2013. The proportion of
adult patients admitted to ICU is similar to those reported in previous years.
 Over 400 clinical isolates have been further characterised for similarity with the vaccine components. The
influenza A viruses appear to be well matched. Approximately 80% of the influenza B viruses characterised
are a match to the trivalent vaccine strain with the remaining influenza B viruses matching the additional
strain in the quadrivalent vaccine.

For more information: Department of Health
 
Updated information is indicated with a *

*New South Wales

NSW Health Influenza Surveillance Report
Week 31: 27 July to 2 August 2015
Summary:
 The influenza season is continuing with influenza B strains predominating.
 The impact on public hospitals is currently moderate overall but with higher levels of
activity in some districts.
 Influenza activity is expected to continue to increase in coming weeks. Influenza seasons
typically last from 8 to 17 weeks.
 On current trends, influenza activity is likely to peak in late August.
In this reporting week:
 Hospital surveillance ? presentations to NSW emergency departments for influenza-like illness
(ILI) increased and remain above the flu season threshold. Bronchiolitis increased this week and
remain high.
 Laboratory surveillance ? the proportion of respiratory samples positive for influenza was
moderate (21.9%) and continues to increase. Influenza B viruses continue to predominate, and up
to one third are of the B/Victoria lineage which are not included in the trivalent seasonal vaccines.
 Community surveillance ? influenza notifications across the majority of LHDs are increasing. Data
collected from ASPREN and FluTracking show low but increasing ILI activity as expected for this
time of year. There was one report of an influenza outbreak in an institution.
 National and international influenza surveillance ? Across Australia influenza activity is increasing
with the exception of the Northern Territory. Influenza B has been the dominant influenza virus
type, comprising two thirds of all notifications.

For more information: NSW Health - Infectious Diseases

*Queensland

For Period 1 January - 2 August 2015

There were 1,292 notifications reported this week. Of these cases, 999 were attributed to influenza B virus. Of the 293 Influenza A samples, 23 were identified as A/H3N2, 2 as A/H1N1pdm09, 268 had subtype not available There were 42 hospital admissions including 1 to ICU.

YTD there were 7,519 notifications reported. Of these cases, 4,251 were attributed to influenza B virus. Of the 3,268 Influenza A samples, 100 were identified as A(H1N1)pdm09 and 711 as A/H3N2.

There have been 465 hospital admissions including 42 to ICU.

For more information: QLD Health

*South Australia

26 July to 1 August 2015

Five hundred and ninety-eight cases of influenza were reported this week. Of these, 202 were
characterised as influenza A and 396 were characterised as influenza B.

Cases comprised of 283 males and 315 females, with a median age of 29 years. One hundred and
sixty (27%) notifications were for children aged less than 10 years and 78 (13%) notifications for
persons aged 65 years or greater. Year-to-date there have been 4,787 cases of influenza, compared
to 1,733 cases reported for the same period last year.

The influenza chart shows that influenza activity in South Australia is increasing.

For more information: SA Health

Tasmania

This report describes flu activity in Tasmania up to Sunday 28 June 2015.
Available data over this period indicate:
 Increased flu in the South of the State indicated that the 2015 winter flu season has started
 Flu notifications and the amount of testing increased during June.
 Tasmanian FluTracking participants increasingly reported Influenza-like Illness (ILI) during June.
 Influenza A virus is responsible for the majority of recent influenza infections.

Flu Notifications
Tasmanian laboratories are required to notify the Director of Public Health of evidence of influenza infection (flu)
in specimens collected from patients. These specimens are usually nose or throat swabs, less often a blood
sample. The best test for flu involves PCR1 to detect influenza virus RNA present in a nose or throat swab.
Since the last fluTAS Report 61 notifications of laboratory-diagnosed flu in Tasmanian residents have been notified
to the Director of Public Health. A total of 160 notifications of flu have been notified since the start of 2015.
Notifications of flu increased during June indicating the commencement of the winter flu season (see Figure 1). Of
the 61 notifications since the last fluTAS Report, 41 were during the fortnight ending Sunday 28 June. This
increase in flu has been limited to the south of the State

For more information: DHHS Tasmania

*Victoria

Report No 14 Week ending 02/08/15
Summary
 Influenza-like illness (ILI) activity remained above baseline levels (4.0) this week with 7.6 cases per 1000 patients
seen, compared to 5.2 in the previous week.
 This week we received 24 surveillance swabs of which 16 (67%) were positive for influenza. From the 269 swabs
received from surveillance GPs this season (27/4/15 ? 2/8/15) 76 (28%) have been positive for influenza, 4
A(untyped), 23 A(H3N2) and 49 influenza B.
 The majority of viruses detected through routine testing this week were influenza A and influenza B. Of the 144
influenza viruses detected so far this year 6 were A(H1N1)pdm09, 69 were A(H3N2), 7 A(untyped) and 62 were
influenza B.
 Since 13/4/2015 FluCAN have reported 197 hospitalisations with confirmed influenza, of which 87 were untyped
influenza A patients, 1 A(H1N1)pdm09 and 109 were influenza B, from the 4 Victorian sentinel hospitals. Of the
197, 6 have been in ICU/HDU, one has been pregnant and 138 have had medical comorbidities.
 Of the 64 influenza viruses analysed at the WHO Collaborating Centre for Reference and Research on Influenza
year to date from Victoria, 8 were A(H1N1)pdm09, 20 A(H3N2) and 36 influenza B.
 The total number of laboratory confirmed notifications to the National Notifiable Diseases Surveillance System
(NNDSS) year to date was 26,633, of which 4,397 (17%) were from Victoria.

For more information: Victorian Infectious Diseases Reference Laboratory

Western Australia

WEEK ENDING 26TH JULY 2015
KEY POINTS
INFLUENZA AND INFLUENZA-LIKE ILLNESSES (ILI)

Summary: Taken together, direct and indirect indicators suggest that influenza virus activity may have
now peaked, earlier than in recent seasons. Non-influenza virus activity also declined this week.

 ILI presentations to sentinel general practitioners (GPs) decreased this week and presentations
to sentinel emergency departments (EDs) were steady.
 Influenza virus detections, notifications and percent positivity appear to have reached a peak.
Influenza B (68%) and influenza A/H3N2 (29%) viruses remaining the dominantly detected
subtypes. The influenza B strains currently circulating are around 65% Yamagata lineage,
matching the trivalent influenza vaccine strain.
 Hospitalisations with confirmed influenza decreased this week, but remain over 10 cases per
1000 admissions. Over 70% of influenza admissions are due to influenza B virus, reflecting
overall detections in the community.
 Non-influenza respiratory virus activity decreased this week, primarily due to a drop in
respiratory syncytial virus detections.

For more information: WA Dept.of Health

*Nationally

For the period to Jan 1- Aug 8th, 2015 there were 28,962 confirmed Influenza cases.

The largest number of notifications have been in QLD with 8,637 , NSW had 6,324, SA 5,422, VIC 4,909, WA had 2,681, ACT 546, TAS 320 and NT 123.

For national data: National Notifiable Diseases Surveillance System

Australian Sentinel Practices Research Network (ASPREN)

No. 14, 2015
29th June - 12th July 2015

SYNDROMIC SURVEILLANCE
REPORTING
Reports were received from 274 GPs from 8
states and territories during the reporting
period. During weeks 27 and 28 a total of
17,884 and 17,337 consultations were made,
respectively.

INFLUENZA-LIKE-ILLNESS (ILI)
Nationally, ILI notifications increased over the period with 193
and 184 notifications in weeks 27 and 28 respectively. ILI
rates reported in this period increased with 16 and 15 cases
per 1000 consultations in weeks 27 and 28 respectively,
compared to 10 and 12 cases per 1000 consultations in
weeks 25 and 26 respectively. For the same reporting period
in 2014, ILI rates were lower at 10 cases per 1000
consultations (see Figure 5). On a state-by-state basis, it is
important to note the increased ILI rate in Urban SA .

For more information: ASPREN

*Flu Tracking

Flutracking Weekly Interim Report
Week ending 02 August 2015

Low levels of influenza-like illness activity

This survey was sent on Monday, 03 August 2015 at 01:13 AM and by 09:00 AM, Thursday 06 August we had
received 21194 responses (21333 last week) from 12995 people responding for themselves and 8199 household
members across Australia.

Across Australia, fever and cough was reported by 2.8% of
vaccinated participants and 3.9% of unvaccinated
participants. Fever, cough and absence from normal duties
was reported by 1.9% of vaccinated participants and 2.6%
of unvaccinated participants

For participants this week, 13072/21194 (61.7 %) have
received the seasonal vaccine so far. Of the 4353
participants who identified as working face-to-face with
patients, 3508 (80.6%) have received the vaccine.

For more information: Flu Tracking


Australian influenza report 2015 - Current report:

Week ending 17 July 2015

SUMMARY
 Most surveillance systems indicate that the influenza season is well underway. It is not an unusual
influenza season thus far. (Figure 1).
 All States and Territories have shown increases in influenza activity in recent weeks with the exception of
the Northern Territory (Figure 2).
 The seasonal increase in influenza-like illness (ILI), detected through the sentinel GP ILI surveillance
system, appear to have eased (Figure 4). Non-influenza respiratory viruses continue to be the major driver
of ILI in the community.
 In the last fortnight, influenza B has been the dominant influenza type, comprising two thirds of all
notifications. (Figure 3).
 Hospitalisations with confirmed influenza have increased in recent weeks, and case counts are similar to
numbers seen in 2012 and 2014, and greater than those reported in 2011 and 2013. The proportion of
adult patients admitted to ICU is similar to those reported in previous years.
 Over 400 clinical isolates have been further characterised for similarity with the vaccine components. The
influenza A viruses appear to be well matched. Approximately 80% of the influenza B viruses characterised
are a match to the trivalent vaccine strain with the remaining influenza B viruses matching the additional
strain in the quadrivalent vaccine.

For more information: Department of Health
 
Updated information is indicated with a *

*New South Wales

NSW Health Influenza Surveillance Report
Week 32: 3 to 9 August 2015
Summary:
 The influenza season is continuing with influenza B strains predominating.
 The impact on public hospitals is currently moderate overall but with higher levels of
activity in some districts.
 Influenza activity is expected to continue to increase in coming weeks. Influenza
seasons typically last from 8 to 17 weeks.
 On current trends, influenza activity is likely to peak in late August.

In this reporting week:
 Hospital surveillance – presentations to NSW emergency departments for influenza-like illness
(ILI) increased and remain above the flu season threshold. Bronchiolitis presentations
decreased this week but remained higher than usual for this time of year.
 Laboratory surveillance – the proportion of respiratory samples positive for influenza was
moderate to high (27.5%), continuing the upward trend. Influenza B viruses continue to
predominate.
 Community surveillance – influenza notifications across the majority of LHDs increased further.
Data collected from ASPREN and FluTracking show moderate seasonal ILI activity. There were
six reports of influenza outbreaks in residential care facilities.
Deaths - The NSW Registry of Births, Deaths, and Marriages have recorded 13 pneumonia
and influenza deaths in 2015; deaths remain below the epidemic threshold.

 National and international influenza surveillance – Across Australia influenza activity continues
to increase. Jurisdictional activity varied, suggesting that the season may be close to peaking
in some areas but may continue to increase in others.


For more information: NSW Health - Infectious Diseases

*Queensland

For Period 1 January - 9 August 2015

There were 1,823 notifications reported this week. Of these cases, 1,401 were attributed to influenza B virus. Of the 422 Influenza A samples, 36 were identified as A/H3N2, 6 as A/H1N1pdm09, 380 had subtype not available There were 76 hospital admissions including 6 to ICU.

YTD there were 9,480 notifications reported. Of these cases, 5,738 were attributed to influenza B virus. Of the 3,742 Influenza A samples, 107 were identified as A(H1N1)pdm09 and 757 as A/H3N2.

There have been 559 hospital admissions including 51 to ICU.

For more information: QLD Health

*South Australia

2 August to 8 August 2015

Nine hundred and thirty-nine cases of influenza were reported this week. Of these, 358 were
characterised as influenza A and 581 were characterised as influenza B.

Cases comprised of 444 males and 495 females, with a median age of 25 years. Two-hundred and
eighty-nine (31%) notifications were for children aged less than 10 years and 143 (15%) notifications
for persons aged 65 years or greater. Year-to-date there have been 5,763 cases of influenza,
compared to 2,107 cases reported for the same period last year.

The influenza chart shows that influenza activity in South Australia is increasing.

For more information: SA Health

*Tasmania

This report describes flu activity in Tasmania up to Sunday 2 August 2015. Available data over this period
indicate:
 Since the start of the 2015 winter flu season in June, flu notifications have further increased in all regions
of the State. The level of flu is unremarkable compared to previous flu seasons.
 Influenza A virus is responsible for most of recent flu infections.
 Laboratories in Tasmania report an increase in flu testing. General Practitioners participating in flu
monitoring are reporting an increase in patients presenting with an Influenza-like Illness (ILI).
 Influenza-like Illness (ILI) reports from Tasmanian FluTracking participants declined slightly during July.

Influenza Notifications
Since the last fluTAS Report, 147 notifications of laboratory-diagnosed flu in Tasmanian residents have been
notified to the Director of Public Health. A total of 307 notifications of flu have been notified since the start
of 2015.
Notifications of flu increased during June indicating the start of the winter flu season (see Figure 1). Notifications
increased during early July, then levelled out towards the end of July. During the six weeks ending Sunday 2
August, 168 notifications were received, representing 55 per cent of the notification since the start of the year.
This rate of flu notification is unremarkable when compared to the same period of past flu seasons.

For more information: DHHS Tasmania

*Victoria

Report No 15 Week ending 09/08/15
Summary
 Influenza-like illness (ILI) activity remained above baseline levels (4.0) this week with 8.4 cases per 1000 patients
seen, compared to 7.5 in the previous week.
 This week we received 38 surveillance swabs of which 23 (61%) were positive for influenza. From the 307 swabs
received from surveillance GPs this season (27/4/15 – 9/8/15) 99 (32%) have been positive for influenza, 9
A(untyped), 30 A(H3N2) and 60 influenza B.
 The majority of viruses detected through routine testing this week were influenza A and influenza B. Of the 189
influenza viruses detected so far this year 8 were A(H1N1)pdm09, 96 were A(H3N2), 15 A(untyped) and 70 were
influenza B.
 Since 13/4/2015 FluCAN have reported 251 hospitalisations with confirmed influenza, of which 110 were untyped
influenza A patients, 1 A(H1N1)pdm09 and 140 were influenza B, from the 4 Victorian sentinel hospitals. Of the
251, 12 have been in ICU/HDU, one has been pregnant and 181 have had medical comorbidities.
 Of the 120 influenza viruses analysed at the WHO Collaborating Centre for Reference and Research on Influenza
year to date from Victoria, 8 were A(H1N1)pdm09, 45 A(H3N2) and 67 influenza B.
 The total number of laboratory confirmed notifications to the National Notifiable Diseases Surveillance System
(NNDSS) year to date was 32,584, of which 5,468 (17%) were from Victoria.

For more information: Victorian Infectious Diseases Reference Laboratory

*Western Australia

WEEK ENDING 2ND AUGUST 2015
KEY POINTS
INFLUENZA AND INFLUENZA-LIKE ILLNESSES (ILI)
Summary: Indicators of influenza activity remain relatively steady, indicating we may be at or near the
peak of the influenza season. Non-influenza virus activity continues to decline.
 ILI presentations to sentinel general practitioners (GPs) and emergency departments (EDs)
increased slightly this week but appear to have plateaued.
 Influenza virus detections, notifications and percent positivity remain stable. The number and
proportion of detections due to influenza B (63%) declined this week, with a relative increase in
the proportion of influenza A/H3N2 (31%) cases.
 Hospitalisations with confirmed influenza decreased this week, and are consistent with average
levels for this time in recent seasons. The proportion of hospitalisations due to influenza B
decreased from 70% to 44% this week, with 56% of admissions now due to influenza A (mostly
A/H3N2).
 Non-influenza respiratory virus activity continued to decrease this week.

For more information: WA Dept.of Health

*Nationally

For the period to Jan 1- Aug 15th, 2015 there were 35,285 confirmed Influenza cases.

The largest number of notifications have been in QLD with 10,740 , NSW had 8,037, SA 6,495, VIC 5,870, WA had 2,978, ACT 625, TAS 404 and NT 136.

For national data: National Notifiable Diseases Surveillance System

Australian Sentinel Practices Research Network (ASPREN)

No. 14, 2015
29th June - 12th July 2015

SYNDROMIC SURVEILLANCE
REPORTING
Reports were received from 274 GPs from 8
states and territories during the reporting
period. During weeks 27 and 28 a total of
17,884 and 17,337 consultations were made,
respectively.

INFLUENZA-LIKE-ILLNESS (ILI)
Nationally, ILI notifications increased over the period with 193
and 184 notifications in weeks 27 and 28 respectively. ILI
rates reported in this period increased with 16 and 15 cases
per 1000 consultations in weeks 27 and 28 respectively,
compared to 10 and 12 cases per 1000 consultations in
weeks 25 and 26 respectively. For the same reporting period
in 2014, ILI rates were lower at 10 cases per 1000
consultations (see Figure 5). On a state-by-state basis, it is
important to note the increased ILI rate in Urban SA .

For more information: ASPREN

*Flu Tracking

Flutracking Weekly Interim Report
Week ending 09 August 2015

Moderate levels of influenza-like illness activity

This survey was sent on Monday, 10 August 2015 at 01:13 AM and by 09:00 AM, Thursday 13 August we had
received 21110 responses (21194 last week) from 12979 people responding for themselves and 8131 household members across Australia.

Across Australia, fever and cough was reported by 3.2% of vaccinated participants and 4.0% of unvaccinated participants.
Fever, cough and absence from normal duties was reported by 2.0% of vaccinated participants and 2.6% of unvaccinated participants.

For participants this week, 13072/21110 (61.9 %) have received the seasonal vaccine so far.
Of the 4381 participants who identified as working face-to-face with patients, 3511 (80.1%) have received the vaccine.

For more information: Flu Tracking


*Australian influenza report 2015 - Current report:

Australian Influenza Surveillance Report No 05 18 July to 31 July 2015
Summary
Influenza activity continued to increase nationally this fortnight. Across jurisdictions activity varied, suggesting that the season may be close to peaking in some areas
but may continue to increase in others.
The 2015 seasonal rise in notifications appears to have started nationally in early June.
Influenza notification rates have been highest among those aged over 85 years with secondary peaks in those aged 5-9 and 40-44 years.
Influenza B continues to be the dominant influenza virus type nationally, comprising two thirds of all notifications.
All systems that monitor influenza-like illness (ILI) activity are reporting increasing activity while remaining within the
range of previous seasons. Influenza, RSV and Rhinovirus are all contributing to increasing ILI in the community this fortnight.
Hospitalisations with confirmed influenza declined in the past fortnight. While less severe overall, presentations appear to be more
severe in children this year, with 16% of children presenting to sentinel hospitals with influenza admitted directly to ICU compared with 6% of adults.
The seasonal influenza vaccines appear to be a good match for circulating strains.

For more information: Department of Health
 
Updated information is indicated with a *

New South Wales

NSW Health Influenza Surveillance Report
Week 32: 3 to 9 August 2015
Summary:
 The influenza season is continuing with influenza B strains predominating.
 The impact on public hospitals is currently moderate overall but with higher levels of
activity in some districts.
 Influenza activity is expected to continue to increase in coming weeks. Influenza
seasons typically last from 8 to 17 weeks.
 On current trends, influenza activity is likely to peak in late August.

In this reporting week:
 Hospital surveillance ? presentations to NSW emergency departments for influenza-like illness
(ILI) increased and remain above the flu season threshold. Bronchiolitis presentations
decreased this week but remained higher than usual for this time of year.
 Laboratory surveillance ? the proportion of respiratory samples positive for influenza was
moderate to high (27.5%), continuing the upward trend. Influenza B viruses continue to
predominate.
 Community surveillance ? influenza notifications across the majority of LHDs increased further.
Data collected from ASPREN and FluTracking show moderate seasonal ILI activity. There were
six reports of influenza outbreaks in residential care facilities.
Deaths - The NSW Registry of Births, Deaths, and Marriages have recorded 13 pneumonia
and influenza deaths in 2015; deaths remain below the epidemic threshold.

 National and international influenza surveillance ? Across Australia influenza activity continues
to increase. Jurisdictional activity varied, suggesting that the season may be close to peaking
in some areas but may continue to increase in others.


For more information: NSW Health - Infectious Diseases

*Queensland

For Period 1 January - 16 August 2015

There were 2,401 notifications reported this week. Of these cases, 1,861 were attributed to influenza B virus. Of the 540 Influenza A samples, 32 were identified as A/H3N2, 9 as A/H1N1pdm09, 499 had subtype not available There were 92 hospital admissions including 9 to ICU.

YTD there were 12,003 notifications reported. Of these cases, 7,677 were attributed to influenza B virus. Of the 4,326 Influenza A samples, 117 were identified as A(H1N1)pdm09 and 804 as A/H3N2.

There have been 675 hospital admissions including 66 to ICU.

For more information: QLD Health

*South Australia

9 August to 15 August 2015

One thousand and eighty-six cases of influenza were reported this week. Of these, 419 were
characterised as influenza A and 667 were characterised as influenza B.

Cases comprised of 513 males and 573 females, with a median age of 23 years. Three hundred and
two (28%) notifications were for children aged less than 10 years and 148 (14%) notifications for
persons aged 65 years or greater. Year-to-date there have been 6,889 cases of influenza, compared
to 2,826 cases reported for the same period last year.

The influenza chart shows that influenza activity in South Australia is increasing.

For more information: SA Health

Tasmania

This report describes flu activity in Tasmania up to Sunday 2 August 2015. Available data over this period
indicate:
 Since the start of the 2015 winter flu season in June, flu notifications have further increased in all regions
of the State. The level of flu is unremarkable compared to previous flu seasons.
 Influenza A virus is responsible for most of recent flu infections.
 Laboratories in Tasmania report an increase in flu testing. General Practitioners participating in flu
monitoring are reporting an increase in patients presenting with an Influenza-like Illness (ILI).
 Influenza-like Illness (ILI) reports from Tasmanian FluTracking participants declined slightly during July.

Influenza Notifications
Since the last fluTAS Report, 147 notifications of laboratory-diagnosed flu in Tasmanian residents have been
notified to the Director of Public Health. A total of 307 notifications of flu have been notified since the start
of 2015.
Notifications of flu increased during June indicating the start of the winter flu season (see Figure 1). Notifications
increased during early July, then levelled out towards the end of July. During the six weeks ending Sunday 2
August, 168 notifications were received, representing 55 per cent of the notification since the start of the year.
This rate of flu notification is unremarkable when compared to the same period of past flu seasons.

For more information: DHHS Tasmania

*Victoria

Report No 16 Week ending 16/08/15
Summary
 Influenza-like illness (ILI) activity remained above baseline levels (4.0) this week with 10.5 cases per 1000 patients
seen, compared to 8.3 in the previous week.
 This week we received 41 surveillance swabs of which 16 (39%) were positive for influenza. From the 348 swabs
received from surveillance GPs this season (27/4/15 ? 16/8/15) 115 (33%) have been positive for influenza, 1
A(untyped), 44 A(H3N2) and 70 influenza B.
 The majority of viruses detected through routine testing this week were influenza A. Of the 189 influenza viruses
detected so far this year 8 were A(H1N1)pdm09, 109 were A(H3N2), 9 A(untyped) and 70 were influenza B.
 Since 13/4/2015 FluCAN have reported 280 hospitalisations with confirmed influenza, of which 122 were untyped
influenza A patients, 1 A(H1N1)pdm09 and 157 were influenza B, from the 4 Victorian sentinel hospitals. Of the
280, 13 have been in ICU/HDU, one has been pregnant and 207 have had medical comorbidities.
 Of the 120 influenza viruses analysed at the WHO Collaborating Centre for Reference and Research on Influenza
year to date from Victoria, 8 were A(H1N1)pdm09, 45 A(H3N2) and 67 influenza B.
 The total number of laboratory confirmed notifications to the National Notifiable Diseases Surveillance System
(NNDSS) year to date was 40,185, of which 6,188 (15%) were from Victoria.

For more information: Victorian Infectious Diseases Reference Laboratory

*Western Australia

WEEK ENDING 16TH AUGUST 2015
KEY POINTS
INFLUENZA AND INFLUENZA-LIKE ILLNESSES (ILI)
Summary: Indicators of influenza activity remain relatively steady, suggesting we are around the peak
of the influenza season. Non-influenza virus activity continues to decline.
? ILI presentations to sentinel general practitioners (GPs) and emergency departments (EDs)
remain relatively steady and within ranges seen in mild influenza seasons.
? Influenza virus detections, notifications and percent positivity appear to have plateaued.
Influenza B virus (57% of detections) continues to predominate, but appears to be declining in
absolute and relative terms; influenza A/H3N2 now comprises 41% of cases.
? Hospitalisations with confirmed influenza appear to be declining.
? Non-influenza respiratory virus activity, and particularly RSV, continues to decrease.


For more information: WA Dept.of Health

*Nationally

For the period to Jan 1- Aug 22nd, 2015 there were 43,207 confirmed Influenza cases.

The largest number of notifications have been in QLD with 13,384 , NSW had 10,964, SA 7,787, VIC 6,361, WA had 3,308, ACT 724, TAS 507 and NT 172.

For national data: National Notifiable Diseases Surveillance System

Australian Sentinel Practices Research Network (ASPREN)

No. 14, 2015
29th June - 12th July 2015

SYNDROMIC SURVEILLANCE
REPORTING
Reports were received from 274 GPs from 8
states and territories during the reporting
period. During weeks 27 and 28 a total of
17,884 and 17,337 consultations were made,
respectively.

INFLUENZA-LIKE-ILLNESS (ILI)
Nationally, ILI notifications increased over the period with 193
and 184 notifications in weeks 27 and 28 respectively. ILI
rates reported in this period increased with 16 and 15 cases
per 1000 consultations in weeks 27 and 28 respectively,
compared to 10 and 12 cases per 1000 consultations in
weeks 25 and 26 respectively. For the same reporting period
in 2014, ILI rates were lower at 10 cases per 1000
consultations (see Figure 5). On a state-by-state basis, it is
important to note the increased ILI rate in Urban SA .

For more information: ASPREN

*Flu Tracking

Flutracking Weekly Interim Report
Week ending 16 August 2015

Moderate levels of influenza-like illness activity

This survey was sent on Monday, 17 August 2015 at 01:13 AM and by 09:00 AM, Thursday 20 August we had received 21131 responses (21110 last week)
from 13003 people responding for themselves and 8128 household members across Australia.

Across Australia, fever and cough was reported by 3.6% of vaccinated participants and 4.9% of unvaccinated participants.
Fever, cough and absence from normal duties was reported by 2.4% of vaccinated participants and 3.6% of unvaccinated participants.

For participants this week, 13146/21131 (62.2 %) have received the seasonal vaccine so far.
Of the 4401 participants who identified as working face-to-face with patients, 3567 (81.0%) have received the vaccine.

For more information: Flu Tracking


Australian influenza report 2015 - Current report:

Australian Influenza Surveillance Report No 05 18 July to 31 July 2015
Summary
Influenza activity continued to increase nationally this fortnight. Across jurisdictions activity varied, suggesting that the season may be close to peaking in some areas
but may continue to increase in others.
The 2015 seasonal rise in notifications appears to have started nationally in early June.
Influenza notification rates have been highest among those aged over 85 years with secondary peaks in those aged 5-9 and 40-44 years.
Influenza B continues to be the dominant influenza virus type nationally, comprising two thirds of all notifications.
All systems that monitor influenza-like illness (ILI) activity are reporting increasing activity while remaining within the
range of previous seasons. Influenza, RSV and Rhinovirus are all contributing to increasing ILI in the community this fortnight.
Hospitalisations with confirmed influenza declined in the past fortnight. While less severe overall, presentations appear to be more
severe in children this year, with 16% of children presenting to sentinel hospitals with influenza admitted directly to ICU compared with 6% of adults.
The seasonal influenza vaccines appear to be a good match for circulating strains.

For more information: Department of Health
 
Updated information is indicated with a *

*New South Wales

NSW Health Influenza Surveillance Report
Week 34: 17 to 23 August 2015

Summary:
 The influenza season is at or near peak activity in the community with influenza B
strains continuing to predominate.
 The impact on Emergency Departments is high and very high in some districts.
 The overall trend in influenza activity is very similar to the high activity seen in 2014.
 Based on previous seasons, influenza activity is still most likely to peak in late August
then continue at lower levels during September.

In this reporting week:
 Hospital surveillance – presentations to NSW emergency departments for influenza-like illness
(ILI) increased and remain above the flu season threshold. Presentations for pneumonia
remain high, particularly in the 5-16 year old age-group.
 Laboratory surveillance – the proportion of respiratory samples positive for influenza was
moderate to high at 38.7%, continuing the upward trend. Influenza B viruses continue to
predominate.
 Community surveillance – influenza notifications across the majority of LHDs increased further.
Data collected from ASPREN and FluTracking show moderate seasonal ILI activity. There were
11 reports of influenza outbreaks in residential care facilities.
 National and international influenza surveillance – Across Australia influenza activity continues
to increase. All jurisdictions with the exception of WA report increasing activity.


For more information: NSW Health - Infectious Diseases

*Queensland

For Period 1 January - 23 August 2015

There were 3,176 notifications reported this week. Of these cases, 2,411 were attributed to influenza B virus. Of the 765 Influenza A samples, 56 were identified as A/H3N2, 2 as A/H1N1pdm09, 707 had subtype not available There were 100 hospital admissions including 8 to ICU.

YTD there were 15,403 notifications reported. Of these cases, 10,252 were attributed to influenza B virus. Of the 5,151 Influenza A samples, 119 were identified as A(H1N1)pdm09 and 874 as A/H3N2.

There have been 813 hospital admissions including 76 to ICU.

For more information: QLD Health

South Australia

9 August to 15 August 2015

One thousand and eighty-six cases of influenza were reported this week. Of these, 419 were
characterised as influenza A and 667 were characterised as influenza B.

Cases comprised of 513 males and 573 females, with a median age of 23 years. Three hundred and
two (28%) notifications were for children aged less than 10 years and 148 (14%) notifications for
persons aged 65 years or greater. Year-to-date there have been 6,889 cases of influenza, compared
to 2,826 cases reported for the same period last year.

The influenza chart shows that influenza activity in South Australia is increasing.

For more information: SA Health

Tasmania

This report describes flu activity in Tasmania up to Sunday 2 August 2015. Available data over this period
indicate:
 Since the start of the 2015 winter flu season in June, flu notifications have further increased in all regions
of the State. The level of flu is unremarkable compared to previous flu seasons.
 Influenza A virus is responsible for most of recent flu infections.
 Laboratories in Tasmania report an increase in flu testing. General Practitioners participating in flu
monitoring are reporting an increase in patients presenting with an Influenza-like Illness (ILI).
 Influenza-like Illness (ILI) reports from Tasmanian FluTracking participants declined slightly during July.

Influenza Notifications
Since the last fluTAS Report, 147 notifications of laboratory-diagnosed flu in Tasmanian residents have been
notified to the Director of Public Health. A total of 307 notifications of flu have been notified since the start
of 2015.
Notifications of flu increased during June indicating the start of the winter flu season (see Figure 1). Notifications
increased during early July, then levelled out towards the end of July. During the six weeks ending Sunday 2
August, 168 notifications were received, representing 55 per cent of the notification since the start of the year.
This rate of flu notification is unremarkable when compared to the same period of past flu seasons.

For more information: DHHS Tasmania

*Victoria

Report No 16 Week ending 16/08/15
Summary
 Influenza-like illness (ILI) activity remained above baseline levels (4.0) this week with 10.5 cases per 1000 patients
seen, compared to 8.3 in the previous week.
 This week we received 41 surveillance swabs of which 16 (39%) were positive for influenza. From the 348 swabs
received from surveillance GPs this season (27/4/15 ? 16/8/15) 115 (33%) have been positive for influenza, 1
A(untyped), 44 A(H3N2) and 70 influenza B.
 The majority of viruses detected through routine testing this week were influenza A. Of the 189 influenza viruses
detected so far this year 8 were A(H1N1)pdm09, 109 were A(H3N2), 9 A(untyped) and 70 were influenza B.
 Since 13/4/2015 FluCAN have reported 280 hospitalisations with confirmed influenza, of which 122 were untyped
influenza A patients, 1 A(H1N1)pdm09 and 157 were influenza B, from the 4 Victorian sentinel hospitals. Of the
280, 13 have been in ICU/HDU, one has been pregnant and 207 have had medical comorbidities.
 Of the 120 influenza viruses analysed at the WHO Collaborating Centre for Reference and Research on Influenza
year to date from Victoria, 8 were A(H1N1)pdm09, 45 A(H3N2) and 67 influenza B.
 The total number of laboratory confirmed notifications to the National Notifiable Diseases Surveillance System
(NNDSS) year to date was 40,185, of which 6,188 (15%) were from Victoria.

For more information: Victorian Infectious Diseases Reference Laboratory

*Western Australia

Report No 17 Week ending 23/08/15

Summary
 Influenza-like illness (ILI) activity remained above baseline levels (4.0) this week with 8.6 cases per 1000 patients
seen, compared to 10.1 in the previous week.
 This week we received 36 surveillance swabs of which 12 (33%) were positive for influenza. From the 384 swabs
received from surveillance GPs this season (27/4/15 – 23/8/15) 127 (33%) have been positive for influenza, 1
A(untyped), 48 A(H3N2) and 78 influenza B.
 The majority of viruses detected through routine testing this week were influenza A. Of the 219 influenza viruses
detected so far this year 8 were A(H1N1)pdm09, 124 were A(H3N2), 9 A(untyped) and 78 were influenza B.
 Since 13/4/2015 FluCAN have reported 305 hospitalisations with confirmed influenza, of which 131 were untyped
influenza A patients, 1 A(H1N1)pdm09 and 173 were influenza B, from the 4 Victorian sentinel hospitals. Of the
305, 14 have been in ICU/HDU, one has been pregnant and 228 have had medical comorbidities.
 Of the 130 influenza viruses analysed at the WHO Collaborating Centre for Reference and Research on Influenza
year to date from Victoria, 9 were A(H1N1)pdm09, 48 A(H3N2) and 73 influenza B.
 The total number of laboratory confirmed notifications to the National Notifiable Diseases Surveillance System
(NNDSS) year to date was 51,583, of which 6,828 (13%) were from Victoria.


For more information: WA Dept.of Health

*Nationally

For the period to Jan 1- Aug 30th, 2015 there were 54,636 confirmed Influenza cases.

The largest number of notifications have been in QLD with 17,713 , NSW had 15,209, SA 9,319, VIC 6,959, WA had 3,683, ACT 848, TAS 694 and NT 216.

For national data: National Notifiable Diseases Surveillance System

Australian Sentinel Practices Research Network (ASPREN)

No. 14, 2015
29th June - 12th July 2015

SYNDROMIC SURVEILLANCE
REPORTING
Reports were received from 274 GPs from 8
states and territories during the reporting
period. During weeks 27 and 28 a total of
17,884 and 17,337 consultations were made,
respectively.

INFLUENZA-LIKE-ILLNESS (ILI)
Nationally, ILI notifications increased over the period with 193
and 184 notifications in weeks 27 and 28 respectively. ILI
rates reported in this period increased with 16 and 15 cases
per 1000 consultations in weeks 27 and 28 respectively,
compared to 10 and 12 cases per 1000 consultations in
weeks 25 and 26 respectively. For the same reporting period
in 2014, ILI rates were lower at 10 cases per 1000
consultations (see Figure 5). On a state-by-state basis, it is
important to note the increased ILI rate in Urban SA .

For more information: ASPREN

*Flu Tracking

Flutracking Weekly Interim Report
Week ending 23 August 2015

Moderate levels of influenza-like illness activity

This survey was sent on Monday, 24 August 2015 at 01:13 AM and by 09:00 AM, Thursday 27 August we had received 21022 responses (21131 last week) from 12938 people responding for themselves and 8084 household members across Australia.

Across Australia, fever and cough was reported by 3.8% of vaccinated participants and 5.0% of unvaccinated participants.
Fever, cough and absence from normal duties was reported by 2.5% of vaccinated participants and 3.6% of unvaccinated participants.

For participants this week, 13044/21022 (62.0 %) have received the seasonal vaccine so far.
Of the 4351 participants who identified as working face-to-face with patients, 3525 (81.0%) have received the vaccine.

For more information: Flu Tracking


*Australian influenza report 2015 - Current report:

Australian Influenza Surveillance Report No 06 - 1 August to 14 August 2015
Summary
Influenza activity continued to increase nationally this fortnight. All jurisdictions with the exception of Western Australia are continuing to increase in activity.
Influenza notification rates have been highest among those aged between 5 and 9 and over 85 years with a secondary peak in those aged 40-44 years.
Influenza B continues to be the dominant influenza virus type nationally, comprising two thirds of all notifications. In South Australia, Victoria and Western Australia, the proportion of influenza A has increased.
All systems that monitor influenza-like illness (ILI) activity are reporting increasing activity while remaining within the range of previous seasons. Influenza is the primary cause of ILI in the community this fortnight.
Hospitalisations with confirmed influenza increased in the past fortnight. While less severe overall, presentations appear to be more severe in children this year, with 11% of children presenting to sentinel hospitals with influenza admitted directly to ICU compared with 6% of adults.
The seasonal influenza vaccines appear to be a good match for circulating strains. However approximately one-quarter of influenza B viruses tested are due to the lineage not contained in the trivalent seasonal vaccine (TIV). The mis-match compared to the TIV is most evident in Queensland and New South Wales.
Australia.png


Australia 2.png

Deaths Associated with Influenza and Pneumonia
Nationally Notified Influenza Associated Deaths
So far in 2015, 60 influenza associated deaths have been notified to the NNDSS, an increase of 14 from the
previous fortnight. The median age of deaths notified is 84 years (range 40 to 102 years). The number of
deaths due to influenza B has increased from nine to 18 during this reporting period, the majority occurring in
the 85+ years age group. Influenza A(H3N2) continues to be associated with deaths in older age groups. The
number of influenza associated deaths reported to the NNDSS is reliant on the follow up of cases to determine
the outcome of their infection and most likely does not represent the true mortality associated with this
disease
For more information: Department of Health
 
Updated information is indicated with a *

*New South Wales

NSW Health Influenza Surveillance Report
Week 35: 24 to 30 August 2015

Summary:
The majority of influenza surveillance indicators suggest activity peaked last week and
that activity is now declining.

 Influenza activity remains high with influenza B strains continuing to predominate.
 The impact on Emergency Departments has decreased but remains high in some
districts and in the 5-16 years and 65 years and over age-groups.
 The overall trend in influenza activity is very similar to the high activity seen in 2014.

In this reporting week:
 Hospital surveillance – presentations to NSW emergency departments for influenza-like illness
(ILI) decreased indicating that presentations have reached the peak but still remain above the
flu season threshold. Presentations for pneumonia remain high, particularly in the 5-16 and the
65 years and over age-groups.
 Laboratory surveillance – the proportion of respiratory samples positive for influenza was
moderate to high at 37.3%, the first downward trend since the season began in early July.
Influenza B viruses continue to predominate.
 Community surveillance influenza notifications across the majority of LHDs increased this week
but are expected to decline in the coming weeks. Data collected from ASPREN and
FluTracking showed declines in seasonal ILI activity, while eGPS showed a rise in activity.
There were 10 reports of influenza outbreaks in residential care facilities.
 National and international influenza surveillance – Across Australia influenza activity continues
to increase. All jurisdictions with the exception of WA report increasing activity.


For more information: NSW Health - Infectious Diseases

*Queensland

For Period 1 January - 30 August 2015

There were 2,933 notifications reported this week. Of these cases, 2,227 were attributed to influenza B virus. Of the 706 Influenza A samples, 55 were identified as A/H3N2, 3 as A/H1N1pdm09, 648 had subtype not available There were 109 hospital admissions including 6 to ICU.

YTD there were 18,600 notifications reported. Of these cases, 12,645 were attributed to influenza B virus. Of the 5,955 Influenza A samples, 123 were identified as A(H1N1)pdm09 and 955 as A/H3N2.

There have been 976 hospital admissions including 88 to ICU.

For more information: QLD Health

*South Australia

16 August to 23 August 2015

One thousand, three hundred and four case of influenza were reported this week. Of these, 491 were
characterised as influenza A and 813 were characterised as influenza B.

Cases comprised of 591 males and 713 females, with a median age of 22 years. Three hundred and
two (29%) notifications were for children aged less than 10 years and 188 (14%) notifications for
persons aged 65 years or greater. Year-to-date there have been 8,239 cases of influenza, compared
to 3,808 cases reported for the same period last year.

The influenza chart shows that influenza activity in South Australia is increasing.

For more information: SA Health

Tasmania

This report describes flu activity in Tasmania up to Sunday 2 August 2015. Available data over this period
indicate:
 Since the start of the 2015 winter flu season in June, flu notifications have further increased in all regions
of the State. The level of flu is unremarkable compared to previous flu seasons.
 Influenza A virus is responsible for most of recent flu infections.
 Laboratories in Tasmania report an increase in flu testing. General Practitioners participating in flu
monitoring are reporting an increase in patients presenting with an Influenza-like Illness (ILI).
 Influenza-like Illness (ILI) reports from Tasmanian FluTracking participants declined slightly during July.

Influenza Notifications
Since the last fluTAS Report, 147 notifications of laboratory-diagnosed flu in Tasmanian residents have been
notified to the Director of Public Health. A total of 307 notifications of flu have been notified since the start
of 2015.
Notifications of flu increased during June indicating the start of the winter flu season (see Figure 1). Notifications
increased during early July, then levelled out towards the end of July. During the six weeks ending Sunday 2
August, 168 notifications were received, representing 55 per cent of the notification since the start of the year.
This rate of flu notification is unremarkable when compared to the same period of past flu seasons.

For more information: DHHS Tasmania

*Victoria

Report No 18 Week ending 30/08/15
Summary
 Influenza-like illness (ILI) activity remained above baseline levels (4.0) this week with 7.8 cases per 1000 patients
seen, compared to 8.5 in the previous week.
 This week we received 29 surveillance swabs of which 15 (52%) were positive for influenza. From the 413 swabs
received from surveillance GPs this season (27/4/15 – 30/8/15) 142 (34%) have been positive for influenza, 1
A(untyped), 54 A(H3N2) and 88 influenza B.
 The majority of viruses detected through routine testing this week were influenza A. Of the 258 influenza viruses
detected so far this year 8 were A(H1N1)pdm09, 152 were A(H3N2), 11 A(untyped) and 87 were influenza B.
 Since 13/4/2015 FluCAN have reported 396 hospitalisations with confirmed influenza, of which 177 were untyped
influenza A patients, 1 A(H1N1)pdm09 and 218 were influenza B, from the 4 Victorian sentinel hospitals. Of the
396, 19 have been in ICU/HDU, three have been pregnant and 302 have had medical comorbidities.
 Of the 130 influenza viruses analysed at the WHO Collaborating Centre for Reference and Research on Influenza
year to date from Victoria, 9 were A(H1N1)pdm09, 48 A(H3N2) and 80 influenza B.
 The total number of laboratory confirmed notifications to the National Notifiable Diseases Surveillance System
(NNDSS) year to date was 58,765, of which 7,301 (12%) were from Victoria.

For more information: Victorian Infectious Diseases Reference Laboratory

Western Australia

Report No 17 Week ending 23/08/15

Summary
 Influenza-like illness (ILI) activity remained above baseline levels (4.0) this week with 8.6 cases per 1000 patients
seen, compared to 10.1 in the previous week.
 This week we received 36 surveillance swabs of which 12 (33%) were positive for influenza. From the 384 swabs
received from surveillance GPs this season (27/4/15 – 23/8/15) 127 (33%) have been positive for influenza, 1
A(untyped), 48 A(H3N2) and 78 influenza B.
 The majority of viruses detected through routine testing this week were influenza A. Of the 219 influenza viruses
detected so far this year 8 were A(H1N1)pdm09, 124 were A(H3N2), 9 A(untyped) and 78 were influenza B.
 Since 13/4/2015 FluCAN have reported 305 hospitalisations with confirmed influenza, of which 131 were untyped
influenza A patients, 1 A(H1N1)pdm09 and 173 were influenza B, from the 4 Victorian sentinel hospitals. Of the
305, 14 have been in ICU/HDU, one has been pregnant and 228 have had medical comorbidities.
 Of the 130 influenza viruses analysed at the WHO Collaborating Centre for Reference and Research on Influenza
year to date from Victoria, 9 were A(H1N1)pdm09, 48 A(H3N2) and 73 influenza B.
 The total number of laboratory confirmed notifications to the National Notifiable Diseases Surveillance System
(NNDSS) year to date was 51,583, of which 6,828 (13%) were from Victoria.


For more information: WA Dept.of Health

*Nationally

For the period to Jan 1- Sep 5th, 2015 there were 62,051 confirmed Influenza cases.

The largest number of notifications have been in QLD with 20,034 (new record high) , NSW had 18,197, SA 10,391, VIC 7,485, WA had 3,943, ACT 923, TAS 829 and NT 249.

For national data: National Notifiable Diseases Surveillance System

Australian Sentinel Practices Research Network (ASPREN)

No. 14, 2015
29th June - 12th July 2015

SYNDROMIC SURVEILLANCE
REPORTING
Reports were received from 274 GPs from 8
states and territories during the reporting
period. During weeks 27 and 28 a total of
17,884 and 17,337 consultations were made,
respectively.

INFLUENZA-LIKE-ILLNESS (ILI)
Nationally, ILI notifications increased over the period with 193
and 184 notifications in weeks 27 and 28 respectively. ILI
rates reported in this period increased with 16 and 15 cases
per 1000 consultations in weeks 27 and 28 respectively,
compared to 10 and 12 cases per 1000 consultations in
weeks 25 and 26 respectively. For the same reporting period
in 2014, ILI rates were lower at 10 cases per 1000
consultations (see Figure 5). On a state-by-state basis, it is
important to note the increased ILI rate in Urban SA .

For more information: ASPREN

*Flu Tracking

Flutracking Weekly Interim Report
Week ending 30 August 2015

Moderate levels of influenza-like illness activity

This survey was sent on Monday, 31 August 2015 at 01:13 AM and by 09:00 AM, Thursday 03 September we had received 20868 responses (21022 last week) from 12840 people responding for themselves and 8028 household members across Australia.

Across Australia, fever and cough was reported by 3.3% of vaccinated participants and 4.7% of unvaccinated participants.
Fever, cough and absence from normal duties was reported by 2.2% of vaccinated participants and 3.3% of unvaccinated participants.

For participants this week, 12987/20868 (62.2 %) have received the seasonal vaccine so far.
Of the 4294 participants who identified as working face-to-face with patients, 3489 (81.3%) have received the vaccine.

For more information: Flu Tracking


Australian influenza report 2015 - Current report:

Australian Influenza Surveillance Report No 06 - 1 August to 14 August 2015
Summary
Influenza activity continued to increase nationally this fortnight. All jurisdictions with the exception of Western Australia are continuing to increase in activity.
Influenza notification rates have been highest among those aged between 5 and 9 and over 85 years with a secondary peak in those aged 40-44 years.
Influenza B continues to be the dominant influenza virus type nationally, comprising two thirds of all notifications. In South Australia, Victoria and Western Australia, the proportion of influenza A has increased.
All systems that monitor influenza-like illness (ILI) activity are reporting increasing activity while remaining within the range of previous seasons. Influenza is the primary cause of ILI in the community this fortnight.
Hospitalisations with confirmed influenza increased in the past fortnight. While less severe overall, presentations appear to be more severe in children this year, with 11% of children presenting to sentinel hospitals with influenza admitted directly to ICU compared with 6% of adults.
The seasonal influenza vaccines appear to be a good match for circulating strains. However approximately one-quarter of influenza B viruses tested are due to the lineage not contained in the trivalent seasonal vaccine (TIV). The mis-match compared to the TIV is most evident in Queensland and New South Wales.

Deaths Associated with Influenza and Pneumonia
Nationally Notified Influenza Associated Deaths
So far in 2015, 60 influenza associated deaths have been notified to the NNDSS, an increase of 14 from the
previous fortnight. The median age of deaths notified is 84 years (range 40 to 102 years). The number of
deaths due to influenza B has increased from nine to 18 during this reporting period, the majority occurring in
the 85+ years age group. Influenza A(H3N2) continues to be associated with deaths in older age groups. The
number of influenza associated deaths reported to the NNDSS is reliant on the follow up of cases to determine
the outcome of their infection and most likely does not represent the true mortality associated with this
disease

For more information: Department of Health
 
Back
Top