• FluTrackers.com Inc. does not provide medical advice. Information on this web site is collected from various internet resources, and the FluTrackers board of directors makes no warranty to the safety, efficacy, correctness or completeness of the information posted on this site by any author or poster. The information collated here is for instructional and/or discussion purposes only and is NOT intended to diagnose or treat any disease, illness, or other medical condition. Every individual reader or poster should seek advice from their personal physician/healthcare practitioner before considering or using any interventions that are discussed on this website. By continuing to access this website you agree to consult your personal physican before using any interventions posted on this website, and you agree to hold harmless FluTrackers.com Inc., the board of directors, the members, and all authors and posters for any effects from use of any medication, supplement, vitamin or other substance, device, intervention, etc. mentioned in posts on this website, or other internet venues referenced in posts on this website.
  • We are not asking for any donations. Do not donate to any entity who says they are raising funds for us.

Australia Influenza surveillance 2012

Ronan Kelly

Retired 2020
Flutracking Weekly Interim Report
Week #7 - ending 17 June 2012
Low level influenza-like illness activity detected
This survey was sent on Monday 18 June 9:44 AM and by Thursday 21 June 9:00 AM we had received 12624 responses (12130 last week) from 8289 people responding for themselves and 4335 household members across Australia.
Across Australia, fever and cough was reported by 3.0% of vaccinated participants and 3.8% of unvaccinated participants. Fever, cough and absence from normal duties was reported by 1.7% of vaccinated participants and 2.3% of unvaccinated participants.
For participants this week, 6562/12624 (52.0%) have received the seasonal vaccine so far. Of the 2596 participants who identified as working face-to-face with patients, 1860 (71.6%) have received the vaccine.
...
http://www9.health.gov.au/cda/Sourc...essionid=72306d6e8e0ca9ba1e766f8496b547534333

Influenza Surveillance Reports

Surveillance of Influenza activity in Australia & New Zealand

This report provides a summary of surveillance data collected from around Australia and New Zealand. Regional reporting in some areas ceases when flu activity is low (out of season).

Australia

New South Wales

Week ending 8 June 2012

The total number of patients presenting to EDs with influenza-like illness (ILI) increased further this week (rate of 2.0 cases per 1000 presentations) and was above the usual range for this time of year.

1233 tests for respiratory viruses were performed at sentinel NSW laboratories. 196 specimens tested positive for influenza A. Of these, 104 tested positive for influenza A(H3N2). The remainder tested negative to influenza A(pH1N1) and are assumed to have been A(H3N2).

11 cases of influenza B were reported. The proportion of respiratory samples that tested positive for influenza increased compared to the previous week and remained markedly higher than the average for this time of year.

Fewer specimens tested positive for Respiratory syncytial virus (RSV) this week and is now below the usual range seen for this time of year

An 74 year old with confirmed influenza A(H3) died At least four confirmed cases with influenza were admitted to intensive care units (ICU). The rate of deaths due to pneumonia or influenza remained below the seasonal threshold.

For more information: NSW Health - Infectious Diseases Alert

Queensland

Year to date 6 May 2012

Year to date (YTD) there have been 580 notifications of influenza in Queensland.

For more information: QLD Health - Preventable Diseases
South Australia

Week ending 2 June 2012

Seventy cases of influenza were reported this week, a marked increase from 26 cases reported in the previous week. Cases included 32 males and 38 females with an age range of 1 to 89 years.

Fifty-seven infections were due to Influenza A virus and 12 infections were due to Influenza B virus. There was one case identified as the pandemic (H1N1) 2009 strain in the current week. Year-to-date, 348 cases of influenza have been notified compared to 434 cases for the same period last year.

For more information: Communicable Diseases Control Branch

Tasmania

Review of 2011 Flu Season

Surveillance of influenza-like illness activity via FluTracking has now ceased for the year. Doctors are testing less for influenza; influenza diagnoses and notifications are now uncommon.

In 2011:

A total of 359 notifications of influenza were received from 1 January to 30 November. Influenza notifications peaked in weeks 30 to 34 (25 July–28 August) at approximately 26 notifications received per week.

Influenza A was responsible for 52 per cent of the total notifications (133 by PCR and 51 by serology). Of the PCR-based detections, 97 were sub-typed with:

78 per cent H1N1.
22 per cent H3N2.
Influenza B was responsible for 48 per cent of the notifications (156 by PCR and 16 by serology). An outbreak of Influenza B was notified from a northern residential-care facility in August.

An outbreak of Influenza A (not further typed) was notified from a southern residential-care facility in August.

There were significant differences in the strains of influenza virus causing disease in Tasmania as the season evolved.

During the early part of the 2011 season (mid-April to late-June) the predominant influenza strain was H1N1 (A). Notifications of Influenza B began to increase in early June, and predominated during the peak of the 2011 season (early-July to late-September), and notifications of H1N1 (A) also continued. As the 2011 season concluded, (early-October to early-November) notifications of both H1N1 (A) and Influenza B declined. A small number of H3N2 (A) notifications were received throughout the season.

For more information: DHHS Communicable Diseases - FluTas

Victoria

Week ending 10 June 2012

Influenza-like illness (ILI) activity was slightly higher than reported for the previous period, with a presentation rate of 5.3 cases per 1000 patients seen, just above baseline levels of activity.

From the 100 swabs received from surveillance GPs this season (30/4/12 – 10/6/12) 18 (18%) have been positive for influenza, of which 2 were A(H1N1)pdm09, 11 were H3N2, 3 were untyped and 2 were influenza B.

This week we received 12 surveillance swabs of which 3 (25%) were positive for influenza, all of which were influenza A (untyped).

The majority of viruses detected through routine testing this week were picornavirus and RSV, with 1 influenza A (untyped) and 1 influenza B detected. Of the 21 influenza viruses detected so far this year 5 have been A(H1N1)pdm09, 9 have been H3, 3 have been untyped and 4 influenza B.

For more information: Victorian Infectious Diseases Reference Laboratory

Western Australia

Week ending 10 June 2012.


ILI presentations to SPN(WA) GPs have increased steadily over recent weeks and remain higher than at the same time in the past two years. Presentations to Perth EDs also continue to increase, but the proportion of cases requiring admission decreased this week.

Influenza positive samples comprised 53% (19) influenza AH3N2 virus and 47% (17) influenza B virus, with no AH1N1 pandemic strain detections.

For more information: WA Virus Watch

Nationally

Dept of Health & Ageing

For the period to 18 June 2012

There have been a total of 3774 laboratory confirmed notifications of Influenza in Australia in 2012 to 18 June.

The majority of notifications have been in QLD with 1211, NSW 810, and WA 563. Victoria has had 462, SA 548, NT 117, ACT 42 and Tasmania 21.

For national data: National Notifiable Diseases Surveillance System

Australian Sentinel Practices Research Network (ASPREN)

ASPREN is a national syndromic surveillance program co-ordinated by the Discipline of General Practice at the University of Adelaide and The Royal Australian College of General Practitioners. One of the conditions under surveillance is influenza like illness (ILI). General practitioners participating in the ASPREN program contribute data on the proportion of consultations which are ILI related.

For the period 30 April to 13 May 2012

Reports were received from 135 GPs from 8 states and territories over the two week period to the 13th May 2012, based on a total of 23,860 consultations.

Nationally, ILI notifications increased over the period with 49 and 85 notifications in week 19 and 20 respectively.

The age and sex breakdown of ILI cases from 30th April to 13th May 2012 show the most reported cases in working age adults, aged 20—49.

56% of all ILI patients were swab tested during weeks 19—20. Notably, there were 10 cases of Influenza detected during this period, 6 Flu A (untyped), 0 H1N1 (2009), and 4 Flu B. There were 20 cases of Rhinovirus detected making it the most common respiratory viruses circulating the nation at present.

For more information: ASPREN

http://www.influenzaspecialistgroup.org.au/surveillance
 
Last edited:
Re: Australia Influenza surveillance 2012

Flutracking Weekly Interim Report
Week #8 - ending 24 June 2012
Low to moderate influenza-like illness activity detected - NSW is experiencing an increasing level of fever, cough and absence from normal duties.
This survey was sent on Monday 25 June 7:48 AM and by Thursday 28 June 9:00 AM we had received 12779 responses (12669 last week) from 8374 people responding for themselves and 4405 household members across Australia.
Across Australia, fever and cough was reported by 3.1% of vaccinated participants and 4.5% of unvaccinated participants. Fever, cough and absence from normal duties was reported by 1.8% of vaccinated participants and 2.6% of unvaccinated participants. For participants this week, 6680/12779 (52.3%) have received the seasonal vaccine so far. Of the 2623 participants who identified as working face-to-face with patients, 1889 (72.0%) have received the vaccine.
...
http://www.influenzaspecialistgroup.org.au/surveillance

Australia

New South Wales

Week ending 15 June 2012

The total number of patients presenting to EDs with influenza-like illness (ILI) increased further this week (rate of 3.0 cases per 1000 presentations) and was above the usual range for this time of year.

Laboratory testing data indicated a further marked increase in influenza A/H3N2 activity.

The proportion of respiratory samples that tested positive for influenza increased compared to the previous week and remained markedly higher than the average for this time of year.

The rate of deaths due to pneumonia or influenza remained below the seasonal threshold.

For more information: NSW Health - Infectious Diseases Alert

Queensland

Year to date 3 June 2012

Year to date (YTD) there have been 923 notifications of influenza in Queensland.

For more information: QLD Health - Preventable Diseases

South Australia

Week ending 20 June 2012

There were 159 cases of influenza virus infection reported this week, an increase from 126 cases reported in the previous week. Cases comprised of 73 males and 86 females with an age range of <1 to 87 years with a median age of 27.Of these cases, four cases were attributed to influenza B virus and 153 were typed as Influenza A virus. One case was identified as the pandemic Influenza A H1N1 2009 strain.

There have been 630 cases of influenza notified year to date, similar 627 cases notified at the same time last year.

For more information: Communicable Diseases Control Branch

Tasmania

Review of 2011 Flu Season

Summary

Influenza activity remains low and relatively stable.
Influenza A and B are currently circulating in Tasmania.
The level of flu testing declined in early June and a slight increase in Influenza positive results were observed.

Flu notifications

There have been five notifications of Influenza during the current month equivalent to the total reported during May. As of 17 June 24 notifications have been received (compared with 68 in the same period last year). These numbers only tell part of the story of flu levels in the community. For every notified case, there are many more illnesses in the community.

For more information: DHHS Communicable Diseases - FluTas

Victoria

Week ending 24 June 2012

Influenza-like illness (ILI) activity was slightly lower than reported for the previous period, with a presentation rate of 5.8 cases per 1000 patients seen, just above baseline levels of activity.

From the 169 swabs received from surveillance GPs this season (30/4/12 – 24/6/12) 43 (25%) have been positive for influenza, of which 5 were A(H1N1)pdm09, 28 were H3N2, 7 were untyped and 3 were influenza B.

This week we received 31 surveillance swabs of which 12 (39%) were positive for influenza, of which 5 were influenza A(H1N1)pdm2009, 6 were influenza A (untyped) and 1 was influenza B.

The majority of viruses detected through routine testing this week were influenza A, picornavirus and RSV. Of those positive 1 was A(H1N1)pdm09, 8 were H3N2, 5 were untyped and 2 were influenza B. Of the 45 influenza viruses detected so far this year 6 have been A(H1N1)pdm09, 22 have been H3N2, 8 are untyped and 9 influenza B.

For more information: [URL="http://www.vidrl.org.au/surveillance/flu%20reports/flu_idx.html"]Victorian Infectious Diseases Reference Laboratory


Western Australia

Week ending 24th June
INFLUENZA AND INFLUENZA-LIKE ILLNESSES
· ILI presentations to SPN(WA) GPs continue to increase steadily and are higher than in the previous two
years. Presentations to Perth EDs also increased this week but the proportion of cases requiring admission
remains stable.
· 31% of specimens collected in sentinel practices were positive for influenza virus.
· Influenza laboratory detections stabilised this week and comprised 52% (25) influenza AH3N2 virus, 38%
(18) influenza B virus and 8% (4) influenza A unspecified virus and 2% (1) influenza AH1N1 pandemic strain.
· Laboratory detections of RSV increased this week.

For more information: WA Virus Watch

Nationally

Dept of Health & Ageing

For the period to 28 June 2012

There have been a total of 5721 laboratory confirmed notifications of Influenza in Australia in 2012 to 28 June.

The majority of notifications have been in QLD with 1713 and NSW with 1426. WA has had 675, Victoria 645, SA 1002, NT 142, ACT 80 and Tasmania 38.

For national data: National Notifiable Diseases Surveillance System

Australian Sentinel Practices Research Network (ASPREN)

ASPREN is a national syndromic surveillance program co-ordinated by the Discipline of General Practice at the University of Adelaide and The Royal Australian College of General Practitioners. One of the conditions under surveillance is influenza like illness (ILI). General practitioners participating in the ASPREN program contribute data on the proportion of consultations which are ILI related.

For the period 14 to 27 May 2012

Reports were received from 137 GPs from 8 states and territories over the two week period to the 27th May 2012, based on a total of 24,703 consultations.

Nationally, ILI notifications greatly increased over the period with 131 and 130 notifications in week 21 and 22 respectively.

The age and sex breakdown of ILI cases from 14th May to 27th May 2012 show the most reported cases in working age adults, aged 20—49

40% of all ILI patients were swab tested during weeks 21—22. Notably, there were 18 cases of Influenza detected during this period, 11 Flu A (untyped), 0 H1N1 (2009), and 7 Flu B. There were 14 cases of Rhinovirus detected making it the second most common respiratory virus circulating the nation at present.

For more information: ASPREN
...

Adapted from http://www.influenzaspecialistgroup.org.au/surveillance
 
Re: Australia Influenza surveillance 2012

New South Wales

Week ending 22 June 2012

The influenza-like illness (ILI) presentation rate to selected emergency departments (ED) decreased but remained above the usual range for this time of year.

The number of ED admissions to critical care units for ILI and pneumonia decreased this week and was within the usual range for this time of year.

ED activity in a range of respiratory illness categories was at or above peak levels for people aged 65 years or older.

Laboratory testing data shows that influenza A/H3N2 activity remains high.

Almost all circulating influenza A (H3N2) viruses are A/Victoria/361/2011-like.
For more information: NSW Health - Infectious Diseases Alert

Queensland

No update

For more information: QLD Health - Preventable Diseases

South Australia

Week ending 23 June 2012

There were 286 cases of influenza virus infection reported this week, an increase from 155 cases reported in the previous week. Cases comprised of 136 males and 150 females with an age range of <1 to 101 years.

Of these cases, 14 cases were attributed to influenza B virus and 272 were typed as Influenza A virus. No cases were identified as the pandemic Influenza A H1N1 2009 strain.

For more information: Communicable Diseases Control Branch

Tasmania
Week ending June 20 2012

Influenza activity remains low and relatively stable.
Influenza A and B are currently circulating in Tasmania.
The level of flu testing declined in early June and a slight increase in Influenza positive results were observed.

Flu notifications

There have been five notifications of Influenza during the current month equivalent to the total reported during May. As of 17 June 24 notifications have been received (compared with 68 in the same period last year). These numbers only tell part of the story of flu levels in the community. For every notified case, there are many more illnesses in the community.

The predominant flu strain notified in Tasmania has been Influenza A, accounting for approximately two-thirds of all notifications to date. The remaining notifications are due to Influenza B.

For more information: DHHS Communicable Diseases - FluTas

Victoria

Week ending 24 June 2012

Influenza-like illness (ILI) activity was slightly lower than reported for the previous period, with a presentation rate of 5.8 cases per 1000 patients seen, just above baseline levels of activity.

From the 169 swabs received from surveillance GPs this season (30/4/12 – 24/6/12) 43 (25%) have been positive for influenza, of which 5 were A(H1N1)pdm09, 28 were H3N2, 7 were untyped and 3 were influenza B.

This week we received 31 surveillance swabs of which 12 (39%) were positive for influenza, of which 5 were influenza A(H1N1)pdm2009, 6 were influenza A (untyped) and 1 was influenza B.

The majority of viruses detected through routine testing this week were influenza A, picornavirus and RSV. Of those positive 1 was A(H1N1)pdm09, 8 were H3N2, 5 were untyped and 2 were influenza B. Of the 45 influenza viruses detected so far this year 6 have been A(H1N1)pdm09, 22 have been H3N2, 8 are untyped and 9 influenza B.

For more information: Victorian Infectious Diseases Reference Laboratory

Western Australia

Week ending 24 June 2012.


ILI presentations to SPN(WA) GPs continue to increase steadily and are higher than in the previous two years. Presentations to Perth EDs also increased this week but the proportion of cases requiring admission remains stable.

31% of specimens collected in sentinel practices were positive for influenza virus.

Influenza laboratory detections stabilised this week and comprised 52% (25) influenza AH3N2 virus, 38% (18) influenza B virus and 8% (4) influenza A unspecified virus and 2% (1) influenza AH1N1 pandemic strain.

Laboratory detections of RSV increased this week.

For more information: WA Virus Watch

Nationally

Dept of Health & Ageing

For the period to 3 July 2012

There have been a total of 6793 laboratory confirmed notifications of Influenza in Australia in 2012 to 3 July.

The majority of notifications have been in QLD with 1999 and NSW with 1720. WA has had 758, Victoria 790, SA 1209, NT 160, ACT 106 and Tasmania 51.

For national data: National Notifiable Diseases Surveillance System

Australian Sentinel Practices Research Network (ASPREN)

ASPREN is a national syndromic surveillance program co-ordinated by the Discipline of General Practice at the University of Adelaide and The Royal Australian College of General Practitioners. One of the conditions under surveillance is influenza like illness (ILI). General practitioners participating in the ASPREN program contribute data on the proportion of consultations which are ILI related.

No update
For more information: ASPREN

Flu Tracking

FluTracking is a pilot online health surveillance system which aims to detect epidemics of influenza. It is a joint initiative of The University of Newcastle, Hunter New England Area Health Service (NSW Health) and Hunter Medical Research Institute. Participation is voluntary and involves the completion of a weekly online survey during the influenza season. Data are collected on basic demographics, symptoms of ILI and absenteeism.

Week ending 24 June 2012

Across Australia, fever and cough was reported by 3.1% of vaccinated participants and 4.5% of unvaccinated participants. Fever, cough and absence from normal duties was reported by 1.8% of vaccinated participants and 2.6% of unvaccinated participants.

For participants this week, 6680/12779 (52.3%) have received the seasonal vaccine so far. Of the 2623 participants who identified as working face-to-face with patients, 1889 (72.0%) have received the vaccine.

For more information, or to enrol: Flu Tracking

Adapted from; http://www.influenzaspecialistgroup.org.au/surveillance
 
Re: Australia Influenza surveillance 2012

New South Wales

Week ending 29 June 2012

In summary:

The influenza-like illness (ILI) presentation rate to selected emergency departments (ED) decreased but remained above the usual range for this time of year.
The number of ED admissions to critical care units for ILI and pneumonia increased this week and was within the usual range seen for this time of year.
ED activity in a range of respiratory illness categories was at or above peak levels for people aged 65 years or older.
Laboratory testing data shows that influenza A/H3N2 activity remains high.
Almost all circulating influenza A (H3N2) viruses are A/Victoria/361/2011-like. The WHO Collaborating Centre for Reference and Research on Influenza advises that current influenza vaccines are likely to induce significant protection against this new H3N2 lineage.

For more information: NSW Health - Infectious Diseases Alert

Queensland

No update

For more information: QLD Health - Preventable Diseases

South Australia

Week ending 30 June 2012

There were 441 cases of influenza virus infection reported this week, an increase from 276 cases reported in the previous week. Cases comprised of 194 males and 247 females with an age range of <1 to 100 years.

Of these cases, eight cases were attributed to influenza B virus and 433 were typed as Influenza A virus. No cases were identified as the pandemic Influenza A H1N1 2009 strain.

For more information: Communicable Diseases Control Branch

Tasmania
Week ending July 5 2012

Summary

Influenza activity has increased during the last fortnight. The majority of notifications relate to the South and North-West regions of Tasmania.
Influenza A virus is responsible for most infections; however influenza B also continues to circulate.
The level of flu testing has roughly doubled in the last fortnight.

Flu notifications

There was a marked increase in notifications during June signalling the beginning of the 2012 flu season. Thirty-nine notifications were received, over half of the 59 notifications received since the start of the year. At the same time last year 84 notifications had been received as that flu season had commenced earlier in the year.

The predominant flu strain notified in Tasmania continues to be Influenza A, accounting for approximately 85 per cent of all notifications to date.

For more information: DHHS Communicable Diseases - FluTas

Victoria

Week ending 1 July 2012

Summary

? Influenza-like illness (ILI) activity was slightly higher than reported for the previous period, with a presentation rate of 7.0 cases per 1000 patients seen, still within average levels of activity.
? From the 215 swabs received from surveillance GPs this season (30/4/12 ? 1/7/12) 68 (32%) have been positive for influenza, of which 6 were A(H1N1)pdm09, 50 were H3N2, 7 were untyped and 5 were influenza B.
? This week we received 38 surveillance swabs of which 20 (53%) were positive for influenza, of which 15 were influenza A(H3N2), 3 were influenza A (untyped) and 2 were influenza B.
? The majority of viruses detected through routine testing this week were influenza A and picornavirus. Of those positive for influenza, 9 were H3N2 and 7 were untyped. Of the 61 influenza viruses detected so far this year 6 have been A(H1N1)pdm09, 35 have been H3N2, 11 are untyped and 9 influenza B.
? This week the Influenza Complications Network (FluCAN) reported 5 hospitalisations from influenza A, 2 A(H1N1)pdm09 and 3 (untyped). Since 19/3/2012 FluCAN have reported 28 hospitalisations with confirmed influenza, of which 20 were untyped influenza A patients, 3 was A(H1N1)pdm09 and 5 were influenza B, from the four Victorian sentinel hospitals.
? Of the 88 influenza viruses analysed at the WHO Collaborating Centre for Reference and Research on Influenza year to date from Victoria, 8 were A(H1N1)pdm09, 56 H3N2 and 24 influenza B.
? The total number of laboratory confirmed notifications to the National Notifiable Diseases Surveillance System (NNDSS) to date was 7,092, of which 790 (11%) were from Victoria.

For more information: Victorian Infectious Diseases Reference Laboratory

Western Australia

Week ending 1 July 2012.

?The rate of ILI presentations to SPN(WA) GPs more than doubled this week and are higher than in
the previous two years. Presentations to Perth EDs continue to increase but the proportion of
cases requiring admission remains stable.
? 43% of specimens collected in sentinel practices were positive for influenza virus.
? Influenza laboratory detections doubled this week and 40.8% (58) influenza B virus, 10.6% (15)
influenza A unspecified virus and 2.1% (3) influenza AH1N1 pandemic strain virus.
? Laboratory detections of RSV continue to increase.

For more information: WA Virus Watch

Nationally

Dept of Health & Ageing

For the period to 1-10 July 2012 there were 1,558 confirmed Influenza cases (9,493 YTD)

The majority of notifications have been in QLD with 600 and SA with 486. WA had 148, NSW 126, Victoria 77, ACT 64, Tas 40 and NT 17.

For national data: National Notifiable Diseases Surveillance System

Australian Sentinel Practices Research Network (ASPREN)

ASPREN is a national syndromic surveillance program co-ordinated by the Discipline of General Practice at the University of Adelaide and The Royal Australian College of General Practitioners. One of the conditions under surveillance is influenza like illness (ILI). General practitioners participating in the ASPREN program contribute data on the proportion of consultations which are ILI related.

For the period 28th May ? 10th June 2012

Reports were received from 147 GPs from 8 states and territories over the two week period to the 27th May 2012, based on a total of 23,209 consultations. During weeks 23 and 24 a total of 12,249 and 10,960 consultations were made, respectively.

Nationally, ILI notifications greatly increased over the period with 183 and 185 notifications in week 23 and 24 respectively.
ILI rates reported in this period greatly increased with 15 and 17 cases per 1000 consultations in weeks 23 and 24 respectively, com-pared to 10 and 11 cases per 1000 in weeks 21 and 22 respectively. For the same reporting period in 2011, ILI rates were 9 and 11 cases per 1000 consultations, for weeks 23 and 24.
On a state-by-state basis, it is impor-tant to note the increase of ILI cases per 1000 consultations in Urban NSW, TAS and Rural WA.

For more information: ASPREN

Flu Tracking

FluTracking is a pilot online health surveillance system which aims to detect epidemics of influenza. It is a joint initiative of The University of Newcastle, Hunter New England Area Health Service (NSW Health) and Hunter Medical Research Institute. Participation is voluntary and involves the completion of a weekly online survey during the influenza season. Data are collected on basic demographics, symptoms of ILI and absenteeism.

Week ending 1 July 2012

Across Australia, fever and cough was reported by
3.5% of vaccinated participants and 4.8% of
unvaccinated participants. Fever, cough and absence
from normal duties was reported by 2.1% of vaccinated
participants and 2.9% of unvaccinated participants.
For participants this week, 6400/12099 (52.9%) have
received the seasonal vaccine so far. Of the 2522
participants who identified as working face-to-face with
patients, 1792 (71.1%) have received the vaccine.

For more information, or to enrol: Flu Tracking

Adapted from; http://www.influenzaspecialistgroup.org.au/surveillance
 
Re: Australia Influenza surveillance 2012

New South Wales

Week ending 6 July 2012

In summary:

The influenza-like illness (ILI) presentation rate to selected emergency departments (ED) increased and remained above the usual range for this time of year.
The number of ED admissions to critical care units for ILI and pneumonia decreased this week but were above peak levels in recent years, particularly in the over 65 age group.
ED activity in a range of respiratory illness categories continued to be at or above peak levels for people aged 65 years or older.
Laboratory testing data shows that influenza A/H3N2 activity remains high.
Almost all circulating influenza A (H3N2) viruses are A/Victoria/361/2011-like. The WHO Collaborating Centre for Reference and Research on Influenza advises that current influenza vaccines are likely to induce significant protection against this new H3N2 lineage.
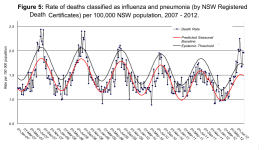
The population death rate for influenza and pneumonia was just below the epidemic threshold (as of June 15)

For more information: NSW Health - Infectious Diseases Alert

Queensland

No Update; Latest week ending June 3rd 2012 (see earlier post)

For more information: QLD Health - Preventable Diseases

South Australia
For the week ending July 7th;
There were 493 cases of influenza virus infection reported this week, an increase from 437 cases reported in the previous week. Cases comprised of 216 males and 277 females with an age range of <1 to 97 years.

Of these cases, five were attributed to influenza B virus and 488 were typed as Influenza A virus. No cases were identified as the pandemic Influenza A H1N1 2009 strain.

Since the beginning of 2012, 30% of notified Influenza cases were reported in children less than 10 years of age.

Annual flu vaccination is recommended for any person from six months of age who wishes to reduce the chance of being ill with the flu. We remind people to have a flu vaccination this year if they haven?t already done so.

For more information: Communicable Diseases Control Branch

Tasmania
No Update; Latest week ending July 5 2012 (see earlier post)

For more information: DHHS Communicable Diseases - FluTas

Victoria
No Update; Latest week ending July 1 2012 (see earlier post)

For more information: Victorian Infectious Diseases Reference Laboratory

Western Australia

Week ending 8 July 2012.

ILI presentations to SPN(WA) GPs continue to increase and remain higher than at the same time
in the past two years. Presentations to Perth EDs also continue to increase, but the proportion of
cases requiring admission remains stable.
? Routine laboratory detections made by PCR at PathWest have stabilised this week where as the
number (117) and proportion of (56%) of specimens collected in sentinel practices that were
influenza positive continues to increase.
? Overall detections comprised 51.6% (99) influenza AH3N2 virus, 39.6% (76) influenza B virus,
7.3% (14) influenza A unspecified virus and 1.5% (3) influenza AH1N1 pandemic strain virus.
? Laboratory detections of RSV continue to remain at high levels.

For more information: WA Virus Watch

Nationally

Dept of Health & Ageing

For the period to 1-14 July 2012 there were 3,026 confirmed Influenza cases (11,379 YTD)

The majority of notifications have been in QLD with 1,027 and SA with 683. NSW had 439, Victoria 364, WA 326, ACT 91, Tas 67 and NT 29.

For national data: National Notifiable Diseases Surveillance System

Australian Sentinel Practices Research Network (ASPREN)

ASPREN is a national syndromic surveillance program co-ordinated by the Discipline of General Practice at the University of Adelaide and The Royal Australian College of General Practitioners. One of the conditions under surveillance is influenza like illness (ILI). General practitioners participating in the ASPREN program contribute data on the proportion of consultations which are ILI related.

For the period 11th-24th June 2012

Reports were received from 153 GPs from 8 states and territories over the two week period to the 24th June 2012, based on a total of 24,921 consultations. During weeks 25 and 26 a total of 12,251 and 12,670 consultations were made, respectively.
Influenza Like Illness (ILI)
Nationally, ILI notifications greatly increased over the period with 152 and 231
notifications in week 25 and 26 respectively. ILI rates reported in this period slightly increased with 12 and 18 cases per 1000 consultations in weeks 25 and 26 respectively, compared to 15 and 17 cases per 1000 in weeks 23 and 24 respectively. For the same reporting period in 2011, ILI rates were lower at 13 and 11 cases per 1000 consultations, for weeks 25 and 26.
On a state-by-state basis, it is important to note the vast increase in ILI rate in the ACT and urban Queensland.

For more information: ASPREN

Flu Tracking
FluTracking is a pilot online health surveillance system which aims to detect epidemics of influenza. It is a joint initiative of The University of Newcastle, Hunter New England Area Health Service (NSW Health) and Hunter Medical Research Institute. Participation is voluntary and involves the completion of a weekly online survey during the influenza season. Data are collected on basic demographics, symptoms of ILI and absenteeism.

Week ending 8 July 2012

Moderate influenza-like illness activity detected
This survey was sent on Monday 9 July 1:32 AM and by Thursday 12 July 9:00 AM we had received 12219 responses (12089 last week) from 8049 people responding for themselves and 4170 household members across Australia.
Across Australia, fever and cough was reported by
3.6% of vaccinated participants and 4.7% of
unvaccinated participants. Fever, cough and absence
from normal duties was reported by 2.2% of vaccinated
participants and 2.8% of unvaccinated participants.
For participants this week, 6512/12219 (53.3%) have
received the seasonal vaccine so far. Of the 2590
participants who identified as working face-to-face with
patients, 1866 (72.0%) have received the vaccine.

For more information, or to enrol: Flu Tracking

Adapted from; http://www.influenzaspecialistgroup.org.au/surveillance
 
Re: Australia Influenza surveillance 2012

New South Wales

For the week ending 13 July 2012:
? The influenza-like illness (ILI) presentation increased and remained above the usual range for this time of year.
? ED admissions to critical care units for ILI and pneumonia decreased this week, but were above peak levels in recent years, particularly in the over 65 year age group.
? ED activity in a range of respiratory illness categories continued to be at or above peak levels in the over 65 year age group.
? Laboratory testing data shows that influenza A(H3N2) activity remains high.
? Almost all circulating influenza A (H3N2) viruses are A/Victoria/361/2011 like. The WHOCollaborating Centre for Reference and Research on Influenza advises that current influenza vaccines are likely to induce significant protection against this new H3N2 lineage.
? The population death rate for influenza and pneumonia was below the epidemic threshold(as of 22 June).

For more information: NSW Health - Infectious Diseases Alert

Queensland

For the week ending July 15th

Year to Date there have been 3,390 notifications of influenza in Queensland. Subtype is recorded for 756 of the 2,644 notifications of Influenza A comprising 24 A(H1N1)pdm09 and 732 H3N2. 22% (746) of the notifications have been Influenza B.
There have been 335 hospitalizations, including 37 to ICU, with a rising trend over the past four weeks.

For more information: QLD Health - Preventable Diseases

South Australia

Week ending July 14th

There were 539 cases of influenza virus infection reported this week, an increase from 492 cases reported in the previous week. Cases comprised of 254 males and 285 females with an age range of <1 to 97 years.

Of these cases, five were attributed to influenza B virus and 528 were typed as Influenza A virus. Six cases were identified as the pandemic Influenza A H1N1 2009 strain.

Since the beginning of 2012, 30% of notified Influenza cases were reported in children less than 10 years of age.

For more information: Communicable Diseases Control Branch

Tasmania

Week ending July 15th

The two-week period ending 15 July has shown an even greater increase in flu notifications than was observed during June. Of the 172 flu notifications now received since the beginning of the 2012, 133 (66%) were in this two-week period alone. The number of notifications received to date in 2012 is greater than over the same period last year. Notifications of influenza are only those people who test positive for influenza; the true level of influenza illness in the community will always be higher.
The predominant flu strain notified in Tasmania continues to be Influenza A, accounting for approximately 94 per cent of all notifications to date.

For more information: DHHS Communicable Diseases - FluTas

Victoria

Week ending July 15th

? Influenza-like illness (ILI) activity was higher than reported for the previous period, with a presentation rate of 12.0 cases per 1000 patients seen, still within average levels of activity.
? From the 319 swabs received from surveillance GPs this season (30/4/12 ? 15/7/12), 118 (37%) have been positive for influenza, of which 10 were A(H1N1)pdm09, 92 were A(H3N2), 8 were A(untyped) and 8 were influenza B.
? This week we received 57 surveillance swabs of which 23 (40%) were positive for influenza. Of these swabs, 18 were A(H3N2),1 was A(H1N1)09pdm, and 4 were A(untyped).
? The majority of viruses detected through routine testing this week were influenza A and picornavirus. Of those positive for influenza, 12 were A(H3N2), 7 were A(untyped), and 2 were influenza B. Of the 95 influenza viruses detected so far this year 9 have been A(H1N1)pdm09, 58 have been A(H3N2), 17 are A(untyped) and 11 influenza B.
? This week the Influenza Complications Network (FluCAN) reported 19 hospitalisations from A(untyped). Since 19/3/2012 FluCAN have reported 72 hospitalisations with confirmed influenza, of which 63 were influenza A(untyped) patients, 4 were A(H1N1)pdm09 and 5 were influenza B, from the four Victorian sentinel hospitals.
? Of the 128 influenza viruses analysed at the WHO Collaborating Centre for Reference and Research on Influenza year to date from Victoria, 9 were A(H1N1)pdm09, 89 A(H3N2) and 30 influenza B.
? The total number of laboratory confirmed notifications to the National Notifiable Diseases Surveillance System (NNDSS) to date was 12,061, of which 1,354 (11%) were from Victoria.

For more information: Victorian Infectious Diseases Reference Laboratory

Western Australia

No update - for latest week (ending July 8th) see previous post.

For more information: WA Virus Watch

Nationally

Dept of Health & Ageing

For the period to 1-20 July 2012 there were 6,215 confirmed Influenza cases (14,679 YTD)

The majority of notifications have been in QLD with 2,070 and SA with 1,186. NSW had 987, WA 774, Victoria 740, Tas 216, ACT 190 and NT 52.

For national data: National Notifiable Diseases Surveillance System

Australian Sentinel Practices Research Network (ASPREN)

ASPREN is a national syndromic surveillance program co-ordinated by the Discipline of General Practice at the University of Adelaide and The Royal Australian College of General Practitioners. One of the conditions under surveillance is influenza like illness (ILI). General practitioners participating in the ASPREN program contribute data on the proportion of consultations which are ILI related.

No update - for latest week (ending June 24th) see previous post.

For more information: ASPREN

Flu Tracking
FluTracking is a pilot online health surveillance system which aims to detect epidemics of influenza. It is a joint initiative of The University of Newcastle, Hunter New England Area Health Service (NSW Health) and Hunter Medical Research Institute. Participation is voluntary and involves the completion of a weekly online survey during the influenza season. Data are collected on basic demographics, symptoms of ILI and absenteeism.

Week ending July 15th.

Moderate influenza-like illness activity detected
This survey was sent on Monday 16 July 12:43 AM and by Thursday 19 July 9:00 AM we had received 12795 responses (12246 last week) from 8364 people responding for themselves and 4431 household members across
Australia.
Across Australia, fever and cough was reported by
4.4% of vaccinated participants and 4.8% of
unvaccinated participants. Fever, cough and absence
from normal duties was reported by 2.6% of vaccinated
participants and 3.1% of unvaccinated participants.
For participants this week, 6842/12795 (53.5%) have
received the seasonal vaccine so far. Of the 2680
participants who identified as working face-to-face with
patients, 1954 (72.9%) have received the vaccine.

For more information, or to enrol: Flu Tracking

Australian influenza report 2012 - Current report: No 2 - 9 June to 22 June 2012

Summary

Across all surveillance systems, influenza activity has continued to increase this fortnight.
All jurisdictions have reported increases in influenza detections above background levels, with South Australia, Victoria, New South Wales, the Australian Capital Territory and the centre of the Northern Territory reporting significant recent increases in activity.
Influenza-like illness (ILI) activity has continued to increase, with the seasonal increase occurring slightly earlier than in previous years (excluding 2009).
During this fortnight there were 2,233 laboratory confirmed notifications of influenza, almost double the number of notifications from the previous fortnight. New South Wales, Queensland and South Australia continue to report the highest number of notifications.
Nationally, influenza A(H3N2) is the predominant circulating strain with some co-circulation of influenza B. Influenza A(H3N2) is predominant across most states and territories, however influenza B represents around 75% and 40% of all notifications in the Northern Territory and Western Australia, respectively. So far in 2012 there have been very few notifications of pandemic (H1N1) 2009.
As at 22 June 2012, there have been 6,027 confirmed cases of influenza reported. Excluding 2009, notifications of influenza in 2012 have started their seasonal increase slightly earlier in comparison with previous years.
Influenza associated hospitalisations have continued to increase this fortnight, particularly at the South Australian and Northern Territory sites. Overall, 40% of hospitalisations have been associated with influenza B infections, mostly reported from the Northern Territory. Amongst other jurisdictional sites, influenza A is more common.
The WHO has reported that the influenza season has not yet started in the temperate countries of the southern hemisphere, although several countries, including Australia, Chile, Paraguay and South Africa have reported small but sustained increases of influenza virus detections. Influenza A(H3N2) viruses have been the most commonly detected in recent weeks in the southern hemisphere temperate region.

For more information see Department of Health and Ageing

Adapted from; http://www.influenzaspecialistgroup.org.au/surveillance
 
Re: Australia Influenza surveillance 2012

New South Wales

For the week ending 20 July 2012:

 The influenza-like illness (ILI) presentation rate to selected emergency departments (ED) decreased and was within the usual range for this time of year.
 ED admissions to critical care units for ILI and pneumonia continued to decrease this week, but were within the usual range for this time of year.
 In the over 65 years age-group, ED presentations and admissions continued to be higher than usual for a range of respiratory illness categories including ILI.
 There has been an increase in reports of respiratory outbreaks due to influenza A in aged care facilities.
 Laboratory testing data shows that influenza A(H3N2) activity remains high but is declining.
 Almost all circulating influenza A (H3N2) viruses are A/Victoria/361/2011-like. The WHO Collaborating Centre for Reference and Research on Influenza advises that current influenza vaccines are likely to induce significant protection against this new H3N2 lineage.
 The population death rate for influenza and pneumonia was below the epidemic threshold.

For more information: NSW Health - Infectious Diseases Alert

Queensland

No Update - Latest week ending July 15th see post above.
For more information: QLD Health - Preventable Diseases

South Australia

Week ending July 21st

There were 483 cases of influenza virus infection reported this week, a decrease from 542 cases reported in the previous week. Of these cases, 18 were attributed to influenza B virus and 465 were typed as Influenza A virus. None were identified as the pandemic Influenza A H1N1 2009 strain

Cases comprised of 207 males and 276 females. Of these, 20% were children <10 years of age and 17% were reported in persons aged of 65 years. Since the beginning of 2012, 30% of notified influenza cases were reported in children less than 10 years of age.

For more information: Communicable Diseases Control Branch

Tasmania

No Update - Latest week ending July 15th see post above.

For more information: DHHS Communicable Diseases - FluTas

Victoria

No Update - Latest week ending July 15th see post above.

For more information: Victorian Infectious Diseases Reference Laboratory

Western Australia

Week ending July 22nd

? Summary: High levels of influenza actvity, both infuenza A/H3 and influenza B continued
last week. However, the community and hospital indicators have stabilised over the past
two weeks and it is possible that activity has peaked. RSV activity is also high and
increasing.
? The number of influenza notifications to the Department of Health decreased slightly this week,
possibly indicating the peak has been reached.
? The rate of ILI presentations to SPN(WA) GPs appears to have plateaued at a presentation rate
around 30 ILI cases per 1000 patients seen, half the peak rate seen in 2009.
? Respiratory viral presentations to Perth EDs decreased slightly this week but remain higher than peak
levels experienced in 2010 and 2011.
? Influenza test requests and influenza detections at PathWest have stabilised this week. The
proportion of influenza virus test requests yielding a positive influenza result, irrespective of type,
peaked at 50% in week 28 but decreased to 41% last week. This peak was as high as that
experienced in the 2009 season.
? Influenza virus detections at PathWest this week comprised: 45.3% (145) A/H3N2 virus, 39.4%
(126) influenza B virus, 15.0% (48) influenza A unspecified virus and 0.3% (1) influenza A/H1N1
pandemic strain virus.
? Laboratory detections of RSV continue to increase, contributing to the overall burden of ILI in the
community.

For more information: WA Virus Watch

Nationally

For the period to 1-26 July 2012 there were 9,076 confirmed Influenza cases (17,588 YTD)

The majority of notifications have been in QLD with 3,026, NSW with 1,525 and SA with 1,521. Victoria had 1,159, WA 1,143, Tas 399, ACT 237 and NT 66.

For national data: National Notifiable Diseases Surveillance System

Australian Sentinel Practices Research Network (ASPREN)

ASPREN is a national syndromic surveillance program co-ordinated by the Discipline of General Practice at the University of Adelaide and The Royal Australian College of General Practitioners. One of the conditions under surveillance is influenza like illness (ILI). General practitioners participating in the ASPREN program contribute data on the proportion of consultations which are ILI related.

No update - for latest week (ending June 24th) see previous post.

For more information: ASPREN

Flu Tracking
FluTracking is a pilot online health surveillance system which aims to detect epidemics of influenza. It is a joint initiative of The University of Newcastle, Hunter New England Area Health Service (NSW Health) and Hunter Medical Research Institute. Participation is voluntary and involves the completion of a weekly online survey during the influenza season. Data are collected on basic demographics, symptoms of ILI and absenteeism.

Week ending July 22nd

Moderate influenza-like illness activity detected
This survey was sent on Monday 23 July 6:30 AM and by Thursday 26 July 9:00 AM we had received 12876
responses (12743 last week) from 8412 people responding for themselves and 4464 household members across
Australia.
Across Australia, fever and cough was reported by
3.8% of vaccinated participants and 4.5% of
unvaccinated participants. Fever, cough and absence
from normal duties was reported by 2.6% of vaccinated
participants and 2.8% of unvaccinated participants.
For participants this week, 6876/12876 (53.4%) have
received the seasonal vaccine so far. Of the 2670
participants who identified as working face-to-face with
patients, 1956 (73.3%) have received the vaccine.

For more information, or to enrol: Flu Tracking

Australian influenza report 2012 - Current report: No 3 - 23 June to 6 July 2012

Summary

Across all surveillance systems, influenza activity has continued to increase this fortnight.
Almost all jurisdictions have reported widespread activity above baseline levels. South Australia, Victoria, New South Wales, the Australian Capital Territory and Western Australia have reported significant recent increases in activity.
Influenza-like illness (ILI) activity has continued to increase. The seasonal increase in activity has occurred slightly earlier than in previous years (excluding 2009), and currently ILI activity levels are above the seasonal peaks reported in 2010 and 2011.
During this fortnight there were 4,174 laboratory confirmed notifications of influenza, almost double the number of notifications from the previous fortnight. Recent sharp increases in notifications have been reported across most jurisdictions. Over the past fortnight notifications have either stabilised or decreased in South Australia, the Northern Territory and New South Wales.
Nationally, influenza A(H3N2) is the predominant circulating virus with some co-circulation of influenza B, however this varies by jurisdiction. So far in 2012 there have been very few notifications of pandemic (H1N1) 2009.
As at 6 July 2012, there have been 10,400 confirmed cases of influenza reported. Excluding 2009, notifications of influenza in 2012 have started their seasonal increase slightly earlier compared with previous years.
Influenza associated hospitalisations have continued to increase this fortnight. Almost 30% of hospitalisations have been associated with influenza B infections, mostly reported from the Northern Territory and Queensland; amongst other jurisdictional sites, influenza A is more common. Known medical co-morbidities have been reported in almost 70% of hospitalised cases. There is a bimodal age distribution trend in hospitalisations, with peaks among those aged 0-9 years and over 70 years.
The WHO has reported that the influenza season has started in the temperate countries of the southern hemisphere. Influenza A(H3N2) viruses have been the most commonly detected in recent weeks in the southern hemisphere temperate region; however, significant numbers of influenza B were also reported in South Africa. Although there have been very few reports of pandemic (H1N1) 2009 in the southern hemisphere temperate region, pandemic (H1N1) 2009 is currently the most commonly detected virus in Central and tropical South America.

For more information see Department of Health and Ageing

Adapted from; http://www.influenzaspecialistgroup.org.au/surveillance
 
Re: Australia Influenza surveillance 2012

...................charts..................
 

Attachments

  • fluaus29.JPG
    fluaus29.JPG
    245.1 KB · Views: 0
  • nsw36.png
    nsw36.png
    101.4 KB · Views: 1
Re: Australia Influenza surveillance 2012

New South Wales

For the week ending 27 July 2012:

 The influenza-like illness (ILI) presentation rate to selected emergency departments (ED) decreased further and was within the usual range for this time of year.
 ED admissions to critical care units for ILI and pneumonia increased slightly this week, but were within the usual range for this time of year.
 In the over 65 years age-group, ED presentations and admissions continued to be higher than usual for a range of respiratory illness categories including ILI.
 Reports of respiratory outbreaks in residential case facilities due to influenza A are increased compared to 2009-2011, but similar to 2007.
 Laboratory testing data shows that influenza A(H3N2) activity remains high but is declining.


For more information: NSW Health - Infectious Diseases Alert

Queensland

For the week ending July 22nd

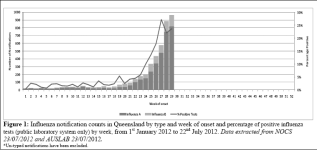
Year to date (YTD) there have been 4510 notifications of influenza in Queensland. Subtype is recorded for 948 of the 3590 notifications of influenza A, comprising 27 A(H1N1)pdm09 and 921 H3N2. Twenty percent (920) of notifications have been influenza B.
Queensland.PNG

For more information: QLD Health - Preventable Diseases

South Australia

Week ending July 28th

There were 435 cases of influenza virus infection reported this week, a decrease from 483 cases reported in the previous week. Of these cases, 21 were attributed to influenza B virus, 412 were typed as Influenza A virus and two were identified as the pandemic Influenza A H1N1 2009 strain. There have been 3,274 cases year-to-date, an increase from the 1,800 cases reported for the same period last year.

Cases comprised of 210 males and 225 females. Of these, 25% were children <10 years of age and 15% were reported in persons aged of 65 years or older. Since the beginning of 2012, 26% of notified influenza cases were reported in children less than 10 years of age.

For more information: Communicable Diseases Control Branch

Tasmania

Week ending July 29th

Influenza was widespread and very common in Tasmania during July. Two thirds of the year’s notifications were received during the second half of July.
The most common strain of influenza in Tasmania so far year this is influenza A H3N2.
Syndromic illness surveillance also confirms high levels of Tasmanians reporting an influenza-like illness (ILI).

Flu notifications

The rate of influenza notifications increased sharply throughout July. In the fortnight ending 29 July, 387 notifications were received, taking the annual total to 560. Notifications of influenza are only those people who are tested and then test positive for influenza; the true level of influenza illness in the community will always be higher.

Tasmania.jpg

For more information: DHHS Communicable Diseases - FluTas

Victoria

No Update - Latest week ending July 15th see post above.

For more information: Victorian Infectious Diseases Reference Laboratory

Western Australia

Week ending July 29th

Summary: Whilst levels remains high, the combined evidence from notifications, laboratory
detections and sentinel GP and Emergency Department indicators of community influenza-like
illness, indicates that influenza activity has peaked and is now declining. Influenza AH3 and
influenza B viruses, along with RSV, are the predominant circulating respiratory viruses.
• The number of influenza notifications to the Department of Health decreased.
• The rate of ILI presentations to SPN(WA) GPs decreased further this week, and the current level is
similar to that of the peak in 2011, which came much later in the season.
• Respiratory viral presentations to Perth EDs continue to decrease but still remain higher than peak
levels experienced in 2010 and 2011.
• Influenza test requests and influenza detections at PathWest remain high and relatively stable.
The proportion of influenza virus test requests yielding a positive influenza result, irrespective of
type, peaked at 50% in week 28 and has decreased to 45% this week.
• Overall detections comprised; 55.7% (186) A/H3N2 virus, 34.1% (114) influenza B virus, 9.6%
(32) influenza A unspecified virus and 0.6% (2) influenza A/H1N1 pandemic strain virus.
• Laboratory detections of RSV remain high.

For more information: WA Virus Watch

Nationally

For the period to 1-31 July 2012 there were 12,345 confirmed Influenza cases (20,890 YTD)

The majority of notifications have been in QLD with 4,353, NSW with 1,948 and SA with 1,942. WA had 1,670, Victoria 1,494, Tas 570, ACT 282 and NT 86.

For national data: National Notifiable Diseases Surveillance System

Australian Sentinel Practices Research Network (ASPREN)

ASPREN is a national syndromic surveillance program co-ordinated by the Discipline of General Practice at the University of Adelaide and The Royal Australian College of General Practitioners. One of the conditions under surveillance is influenza like illness (ILI). General practitioners participating in the ASPREN program contribute data on the proportion of consultations which are ILI related.

No update - for latest week (ending June 24th) see previous post.

For more information: ASPREN

Flu Tracking
FluTracking is a pilot online health surveillance system which aims to detect epidemics of influenza. It is a joint initiative of The University of Newcastle, Hunter New England Area Health Service (NSW Health) and Hunter Medical Research Institute. Participation is voluntary and involves the completion of a weekly online survey during the influenza season. Data are collected on basic demographics, symptoms of ILI and absenteeism.

Week ending July 29th

Low levels of influenza-like illness activity detected but moderate activity persists in Tasmania
and Queensland
This survey was sent on Monday 30 July 5:56 AM and by Thursday 2 August 9:00 AM we had received 12818
responses (12889 last week) from 8395 people responding for themselves and 4423 household members across
Australia.
Across Australia, fever and cough was reported by
3.8% of vaccinated participants and 3.9% of
unvaccinated participants. Fever, cough and absence
from normal duties was reported by 2.5% of vaccinated
participants and 2.4% of unvaccinated participants.
For participants this week, 6921/12818 (54.0%) have
received the seasonal vaccine so far. Of the 2633
participants who identified as working face-to-face with
patients, 1933 (73.4%) have received the vaccine.

For more information, or to enrol: Flu Tracking

Australian influenza report 2012 - Current report: No 4 - 7 July to 20 July 2012

Summary
 Nationally across most surveillance systems influenza activity started to decrease this fortnight.
 Almost all jurisdictions have reported widespread activity above baseline levels. South Australia, New South Wales and parts of the Northern Territory and Western Australia, have reported either a decrease or no change in activity.
 Influenza-like illness (ILI) activity has started to decrease. Seasonal activity started slightly earlier than in previous years (excluding 2009). Currently ILI activity levels are above the seasonal peaks reported in 2010 and 2011.
 During this fortnight there were 5,995 laboratory confirmed notifications of influenza, with a slight decrease in the most recent week. Although there continues to be increases in Queensland, Western Australia and Tasmania, notifications across all other jurisdictions have either remained stable or started to decrease.
 Nationally, influenza A(H3N2) remains the predominant circulating virus with some co-circulation of influenza B, however this varies by jurisdiction. So far in 2012 there have been very few notifications of pandemic (H1N1) 2009.
 As at 20 July 2012, there have been 16,897 confirmed cases of influenza reported. Excluding 2009, notifications of influenza in 2012 started their seasonal increase slightly earlier compared with previous years.
 Influenza associated hospitalisations have continued to increase this fortnight. Almost 20% of hospitalisations have been associated with influenza B infections, mostly reported from the Northern Territory and Queensland; amongst other jurisdictional sites, influenza A is more common. Known medical co-morbidities have been reported in almost 75% of hospitalised cases. There is a bimodal age distribution trend in hospitalisations, with peaks among those aged 0-9 years and over 70 years.
 The WHO has reported that the influenza season has started in the temperate countries of the southern hemisphere. Influenza A(H3N2) viruses have been the most commonly detected in recent weeks in the southern hemisphere temperate region; however, significant numbers of influenza B were also reported in South Africa. Although there have been very few reports of pandemic (H1N1) 2009 in the southern hemisphere temperate region, pandemic (H1N1) 2009 is currently the most commonly detected virus in some counties of central and tropical South America.

For more information see Department of Health and Ageing

Adapted from; http://www.influenzaspecialistgroup.org.au/surveillance
 
Re: Australia Influenza surveillance 2012

New South Wales

For the week ending 3 August 2012:

 The influenza-like illness (ILI) presentation rate to selected emergency departments (ED) decreased further and was within the usual range for this time of year.
 ED admissions to critical care units for ILI and pneumonia decreased this week, but were within the usual range for this time of year.
 Reports of respiratory outbreaks in residential care facilities due to influenza A are increased compared to 2009-2011, but are similar to the number of outbreaks reported in earlier years.
 Laboratory testing data shows that influenza A(H3N2) activity remains high but is declining.

For more information: NSW Health - Infectious Diseases Alert

Queensland

For the week ending July 29th

Year to date (YTD) there have been 5,729 notifications of influenza in Queensland. Subtype is recorded for 1,121 of the 4,631 notifications of influenza A, comprising 28 A(H1N1)pdm09 and 1,093 H3N2. Nineteen percent (1,098) of notifications have been influenza B.

For more information: QLD Health - Preventable Diseases

South Australia

Week ending Aug 4th

There were 413 cases of influenza virus infection reported this week, a decrease from 435 cases reported in the previous week. Of these cases, 19 were attributed to influenza B virus and 394 were typed as Influenza A. There have been 3,687 cases year-to-date, an increase from the 2,107 cases reported for the same period last year.

Cases comprised of 210 males and 203 females. Of these, 27% were children <10 years of age and 13% were reported in persons aged of 65 years or older. Since the beginning of 2012, 26% of notified influenza cases were reported in children <10 years of age.

For more information: Communicable Diseases Control Branch

Tasmania

No Update. See post above.

For more information: DHHS Communicable Diseases - FluTas

Victoria

Week ending July 8th

Summary

? Influenza-like illness (ILI) activity was slightly higher than reported for the previous period, with a presentation rate of 8.6 cases per 1000 patients seen, still within average levels of activity.
? From the 262 swabs received from surveillance GPs this season (30/4/12 ? 8/7/12) 95 (36%) have been positive for influenza, of which 9 were A(H1N1)pdm09, 72 were H3N2, 6 were untyped and 8 were influenza B.
? This week we received 35 surveillance swabs of which 18 (51%) were positive for influenza, of which 13 were influenza A(H3N2),1 was A(H1N1)09pdm, 2 were influenza A (untyped) and 2 were influenza B.
? The majority of viruses detected through routine testing this week were influenza A and picornavirus. Of those positive for influenza, 9 were H3N2, 3 were A(H1N1)pdm2009 and 4 were untyped. Of the 73 influenza viruses detected so far this year 9 have been A(H1N1)pdm09, 44 have been H3N2, 11 are untyped and 9 influenza B.
? This week the Influenza Complications Network (FluCAN) reported 16 hospitalisations from influenza A, 1 A(H1N1)pdm09 and 15 (untyped). Since 19/3/2012 FluCAN have reported 51 hospitalisations with confirmed influenza, of which 44 were untyped influenza A patients, 4 were A(H1N1)pdm09 and 3 were influenza B, from the four Victorian sentinel hospitals.
? Of the 120 influenza viruses analysed at the WHO Collaborating Centre for Reference and Research on Influenza year to date from Victoria, 9 were A(H1N1)pdm09, 83 H3N2 and 28 influenza B.
? The total number of laboratory confirmed notifications to the National Notifiable Diseases Surveillance System (NNDSS) to date was 10,328, of which 1,211 (12%) were from Victoria.

For more information: Victorian Infectious Diseases Reference Laboratory

Western Australia

Week ending Aug 5th

Summary: Whilst levels remains high, and despite the number of influenza notifications
increasing this week, the combined evidence from laboratory detections and sentinel GP and
Emergency Department indicators of community influenza-like illness, indicates that influenza
activity has peaked and is declining. Influenza AH3 and influenza B viruses, along with RSV,
are the predominant circulating respiratory viruses.
? The number of influenza notifications to the Department of Health increased, but remain below the
peak level.
? The rate of ILI presentations to SPN(WA) GPs decreased further this week, and the current level is
below the peak experienced in 2011, which came much later in the season.
? Respiratory viral presentations to Perth EDs continue to decrease and are now similar to the peak
levels experienced in 2010 and 2011.
? Influenza test requests and influenza detections at PathWest remain high and relatively stable.
The proportion of influenza virus test requests yielding a positive influenza result was relatively
stable at 45% this week.
? Overall detections comprised; 64.6% (227) A/H3N2 virus, 26.2% (92) influenza B virus, 7.4%
influenza A virus unsubtyped, 0.9% (3) influenza A/H1N1 pandemic strain virus and 0.9% were
mixed infection samples.
? Laboratory detections of RSV remain high.

For more information: WA Virus Watch

Nationally

For the period to 1-10 August 2012 there were 2,347 confirmed Influenza cases (24,396 YTD)

The majority of notifications have been in QLD with 1,481. SA had 311, WA 263, Tas 92, Victoria 92, NSW 79, ACT 23 and NT 6.

For national data: National Notifiable Diseases Surveillance System

Australian Sentinel Practices Research Network (ASPREN)

ASPREN is a national syndromic surveillance program co-ordinated by the Discipline of General Practice at the University of Adelaide and The Royal Australian College of General Practitioners. One of the conditions under surveillance is influenza like illness (ILI). General practitioners participating in the ASPREN program contribute data on the proportion of consultations which are ILI related.

No update - for latest week (ending June 24th) see previous post.

For more information: ASPREN

Flu Tracking
FluTracking is a pilot online health surveillance system which aims to detect epidemics of influenza. It is a joint initiative of The University of Newcastle, Hunter New England Area Health Service (NSW Health) and Hunter Medical Research Institute. Participation is voluntary and involves the completion of a weekly online survey during the influenza season. Data are collected on basic demographics, symptoms of ILI and absenteeism.

Week ending Aug 5th

Low levels of influenza-like illness activity detected but moderate activity persists in Queensland
This survey was sent on Monday 6 August 5:58 AM and by Thursday 9 August 9:00 AM we had received 12862
responses (12818 last week) from 8389 people responding for themselves and 4473 household members across
Australia.
Across Australia, fever and cough was reported by 3.6% of vaccinated participants and 4.4% of unvaccinated participants. Fever, cough and absence from normal duties was reported by 2.4% of vaccinated participants and 2.9% of unvaccinated participants.
For participants this week, 6931/12862 (53.9%) have received the seasonal vaccine so far. Of the 2635 participants who identified as working face-to-face with patients, 1925 (73.1%) have received the vaccine.

For more information, or to enrol: Flu Tracking

Australian influenza report 2012 - Current report: No 4 - 7 July to 20 July 2012
not updated

For more information see Department of Health and Ageing

Adapted from; http://www.influenzaspecialistgroup.org.au/surveillance
 
Re: Australia Influenza surveillance 2012

New South Wales

For the week ending 10 August 2012:

The influenza-like illness (ILI) presentation rate to selected emergency departments (ED) was steady and was within the usual range for this time of year, and well below the peak seen in mid-July. ED admissions to critical care units for ILI and pneumonia were steady this week, and are within the usual range for this time of year. Three influenza outbreaks were reported in residential care facilities. Laboratory testing data showed that influenza A(H3N2) activity remained high but was declining. Influenza B activity increased. The population death rate for influenza and pneumonia was above the epidemic threshold (as of 20 July). CDC reported human infections with variant influenza A (H3N2v) viruses have continued to be reported across the United States related to exposure to infected swine. No sustained human to human transmission has been reported.

For more information: NSW Health - Infectious Diseases Alert

Queensland

For the week ending August 12th

Year to date (YTD) there have been 8,896 notifications of influenza in Queensland. Subtype is recorded for 1,463 of the 7,306 notifications of influenza A, comprising 31 A(H1N1)pdm09 and 1,432 H3N2. Eighteen percent (1,590) of notifications have been influenza B.

For more information: QLD Health - Preventable Diseases

South Australia

Week ending August 11th

There were 407 cases of influenza virus infection reported this week, similar to 411 cases reported in the previous week. Of these cases, 28 were attributed to influenza B virus, 377 were typed as Influenza A, and two were identified as the pandemic Influenza A H1N1 2009 strain. There have been 4,090 cases year-to-date, an increase from the 2,375 cases reported for the same period last year.

Cases comprised of 199 males and 208 females. Of these, 25% were children <10 years of age and 15% were reported in persons aged 65 years or older. Since the beginning of 2012, 26% of notified influenza cases were reported in children <10 years of age.

For more information: Communicable Diseases Control Branch

Tasmania

Week ending August 12th

Summary

Influenza remains widespread and common in Tasmania in early August. The latest data indicate declines in notifications, testing and influenza-like illness.
The most common type of influenza in Tasmania so far year this is influenza A H3N2.

Flu notifications

The 2012 influenza season to date has featured a rapid increase in cases from baseline in May to a peak in late July/early August. Notifications are now declining. There were 136 notifications in the last week ending 12 August, compared to 179 the week prior. Notifications of influenza are only those people who are tested and then test positive for influenza; the true level of influenza illness in the community will always be higher.

For more information: DHHS Communicable Diseases - FluTas

Victoria

Week ending July 15th

Summary

• Influenza-like illness (ILI) activity was higher than reported for the previous period, with a presentation rate of 12.0 cases per 1000 patients seen, still within average levels of activity.
• From the 319 swabs received from surveillance GPs this season (30/4/12 – 15/7/12), 118 (37%) have been positive for influenza, of which 10 were A(H1N1)pdm09, 92 were A(H3N2), 8 were A(untyped) and 8 were influenza B.
• This week we received 57 surveillance swabs of which 23 (40%) were positive for influenza. Of these swabs, 18 were A(H3N2),1 was A(H1N1)09pdm, and 4 were A(untyped).
• The majority of viruses detected through routine testing this week were influenza A and picornavirus. Of those positive for influenza, 12 were A(H3N2), 7 were A(untyped), and 2 were influenza B. Of the 95 influenza viruses detected so far this year 9 have been A(H1N1)pdm09, 58 have been A(H3N2), 17 are A(untyped) and 11 influenza B.
• This week the Influenza Complications Network (FluCAN) reported 19 hospitalisations from A(untyped). Since 19/3/2012 FluCAN have reported 72 hospitalisations with confirmed influenza, of which 63 were influenza A(untyped) patients, 4 were A(H1N1)pdm09 and 5 were influenza B, from the four Victorian sentinel hospitals.
• Of the 128 influenza viruses analysed at the WHO Collaborating Centre for Reference and Research on Influenza year to date from Victoria, 9 were A(H1N1)pdm09, 89 A(H3N2) and 30 influenza B.
• The total number of laboratory confirmed notifications to the National Notifiable Diseases Surveillance System (NNDSS) to date was 12,061, of which 1,354 (11%) were from Victoria.

For more information: Victorian Infectious Diseases Reference Laboratory

Western Australia

No Update. For week ending Aug 5th see above.

For more information: WA Virus Watch

Nationally

For the period to 1-17 August 2012 there were 6,255 confirmed Influenza cases (28,606 YTD)

The majority of notifications have been in QLD with 3,547. WA had 713, SA 678, Victoria 565, NSW 466, Tas 216, ACT 42 and NT 28.

For national data: National Notifiable Diseases Surveillance System

Australian Sentinel Practices Research Network (ASPREN)

ASPREN is a national syndromic surveillance program co-ordinated by the Discipline of General Practice at the University of Adelaide and The Royal Australian College of General Practitioners. One of the conditions under surveillance is influenza like illness (ILI). General practitioners participating in the ASPREN program contribute data on the proportion of consultations which are ILI related.

No update - for latest week (ending June 24th) see earlier post.

For more information: ASPREN

Flu Tracking
FluTracking is a pilot online health surveillance system which aims to detect epidemics of influenza. It is a joint initiative of The University of Newcastle, Hunter New England Area Health Service (NSW Health) and Hunter Medical Research Institute. Participation is voluntary and involves the completion of a weekly online survey during the influenza season. Data are collected on basic demographics, symptoms of ILI and absenteeism.

Week ending August 12th

Moderate levels of influenza-like illness activity detected but high activity persists in Queensland
This survey was sent on Monday 13 August 12:23 AM and by Thursday 16 August 9:00 AM we had received
12863 responses (12959 last week) from 8387 people responding for themselves and 4476 household members
across Australia.
Across Australia, fever and cough was reported by 3.9% of vaccinated participants and 4.9% of unvaccinated participants. Fever, cough and absence from normal duties was reported by 2.5% of vaccinated participants and 3.2% of unvaccinated participants. For participants this week, 6950/12862 (54.0%) have received the seasonal vaccine so far. Of the 2641
participants who identified as working face-to-face with patients, 1941 (73.5%) have received the vaccine.

For more information, or to enrol: Flu Tracking

Australian influenza report 2012 - Current report: No 5 - 21 July to 3 August 2012

Summary

Nationally across most surveillance systems influenza activity continued to decrease this fortnight.
Although some jurisdictions have continued to report widespread activity above baseline levels, influenza activity decreased across most of Australia.
Influenza-like illness (ILI) activity has continued to decrease, with current ILI activity levels similar to the peak levels experienced during the 2010 and 2011 seasons.
During this fortnight there were 6,095 laboratory confirmed notifications of influenza. Nationally, notifications appear to have plateaued. However, almost 45% of notifications this fortnight were from Queensland, where there continues to be an increasing trend.
Nationally, influenza A(H3N2) remains the predominant circulating virus with some co-circulation of influenza B, however this varies by jurisdiction. So far in 2012 there have been very few notifications of pandemic (H1N1) 2009.
In 2010 and 2011 with the predominance of the pandemic (H1N1) 2009 virus, the age distribution of notifications showed a downward trend with increasing age. With the predominance of influenza A(H3N2) in 2012, the age distribution of notifications are currently reflective of traditional pre-pandemic seasons with peaks among those aged 0-4 and over 70 years.
As at 3 August 2012, there have been 23,553 confirmed cases of influenza reported. Excluding 2009, notifications of influenza in 2012 started their seasonal increase earlier and rose sharply in comparison to previous years. The intensity of the rise in cases for 2012 has also meant a higher peak in notifications, however the total number of notifications for the entire season may not result in a substantial variance compared to previous seasons.
Influenza associated hospitalisations have decreased this fortnight. Known medical co-morbidities have been reported in 76% of hospitalised cases and there is a bimodal age distribution trend in hospitalisations, with peaks among those aged 0-9 years and over 70 years.
The WHO has reported that the influenza season has continued in the temperate countries of the southern hemisphere. Influenza A(H3N2) viruses have been the most commonly reported, however there is a predominance of pandemic (H1N1) 2009 in some counties of central and tropical South America.
The United States have reported an additional 153 human cases associated with a variant swine influenza A(H3N2) virus since July 2012. All of the current cases are associated with direct or indirect contact with swine, the majority at agricultural fairs. Viruses detected in the current cases are similar to the variant viruses identified during July 2011 to April 2012.

For more information see Department of Health and Ageing

Adapted from; http://www.influenzaspecialistgroup.org.au/surveillance
 
Re: Australia Influenza surveillance 2012

New South Wales

For the week ending August 17th 2012

The influenza-like illness (ILI) presentation rate to selected emergency departments (ED) increased slightly but was within the usual range for this time of year, and well below the peak seen in mid-July. ED admissions to critical care units for ILI and pneumonia increased slightly this week however were within the usual range for this time of year. Two influenza outbreaks were reported in residential care facilities. Laboratory testing data showed that overall influenza activity remained high, but below the peak seen in the last week of June. Activity increased slightly this week, predominantly due to a further increase in influenza B activity. The population death rate for influenza and pneumonia was above the epidemic threshold (as of 27 July). CDC reported human infections with variant influenza A (H3N2v) viruses have continued to be reported across the United States related to exposure to infected swine. No sustained human to human transmission has been reported.


For more information: NSW Health - Infectious Diseases Alert

Queensland

No update. For week ending Aug 12th, see above.

For more information: QLD Health - Preventable Diseases

South Australia

Week ending August 18th.

Influenza
There were 330 cases of influenza virus infection reported this week, a decrease from 409 cases reported in the previous week. Of these cases, 35 were attributed to influenza B virus, 292 were typed as Influenza A, and three were identified as the pandemic Influenza A H1N1 2009 strain. There have been 4,422 influenza cases year-to-date compared to 2,653 cases reported for the same period last year.

Cases comprised of 160 males and 170 females. Of these, 27% were children <10 years of age and 15% were reported in persons aged 65 years or older. Since the beginning of 2012, 26% of notified influenza cases were reported in children <10 years of age.

For more information: Communicable Diseases Control Branch

Tasmania

No update. For week ending August 12th see above.

For more information: DHHS Communicable Diseases - FluTas

Victoria

No update. For week ending July 15th see above.

For more information: Victorian Infectious Diseases Reference Laboratory

Western Australia

For week ending August 12th.

INFLUENZA AND INFLUENZA-LIKE ILLNESSES
In view of relatively high levels of influenza activity currently being experienced, this section of Virus
WAtch has been temporarily expanded.
Summary: The combined evidence from Department of Health influenza notifications,
laboratory detections and sentinel GP and Emergency Department indicators of community
influenza-like illness, indicates that influenza activity is continuing to decline. Influenza AH3
and influenza B viruses, along with RSV, remain the predominant circulating respiratory
viruses.
? The number of influenza notifications to the Department of Health decreased by 17% this week.
? The rate of ILI presentations to SPN(WA) GPs decreased further this week, and the current level is
below the peak experienced in 2011, which came much later in the season.
? Respiratory viral presentations to Perth EDs remain relatively stable and similar to the peak levels
experienced in 2010 and 2011.
? Influenza test requests and influenza detections at PathWest remain high but are steadily
declining. The proportion of influenza virus test requests yielding a positive influenza result was
relatively stable at 43% this week.
? Overall detections comprised; 70.5% (211) A/H3N2 virus, 28.5% (85) influenza B virus and 1% (2)
were mixed infection samples. In addition, 14 samples remain unsubtyped.
? Laboratory detections of RSV remain high.

For more information: WA Virus Watch

Nationally

For the period to 1-24 August 2012 there were 9,726 confirmed Influenza cases (32,164 YTD)

The majority of notifications have been in QLD with 5,529. WA had 1,106, Victoria 1,009, SA 957, NSW 755, Tas 258, ACT 66 and NT 46.

For national data: National Notifiable Diseases Surveillance System

Australian Sentinel Practices Research Network (ASPREN)

ASPREN is a national syndromic surveillance program co-ordinated by the Discipline of General Practice at the University of Adelaide and The Royal Australian College of General Practitioners. One of the conditions under surveillance is influenza like illness (ILI). General practitioners participating in the ASPREN program contribute data on the proportion of consultations which are ILI related.


No update - for latest week (ending June 24th) see earlier post.

For more information: ASPREN

Flu Tracking
FluTracking is a pilot online health surveillance system which aims to detect epidemics of influenza. It is a joint initiative of The University of Newcastle, Hunter New England Area Health Service (NSW Health) and Hunter Medical Research Institute. Participation is voluntary and involves the completion of a weekly online survey during the influenza season. Data are collected on basic demographics, symptoms of ILI and absenteeism.

For week ending August 19th.

Moderate levels of influenza-like illness activity detected
This survey was sent on Monday 20 August 12:03 AM and by Thursday 23 August 9:00 AM we had received 12728 responses (12872 last week) from 8335 people responding for themselves and 4393 household members
across Australia.
Across Australia, fever and cough was reported by 3.5% of vaccinated participants and 4.4% of unvaccinated participants. Fever, cough and absence from normal duties was reported by 2.4% of vaccinated
participants and 2.9% of unvaccinated participants.
For participants this week, 6914/12726 (54.3%) have received the seasonal vaccine so far. Of the 2599 participants who identified as working face-to-face with patients, 1931 (74.3%) have received the vaccine.

For more information, or to enrol: Flu Tracking

Australian influenza report 2012 - Current report: No 5 - 21 July to 3 August 2012

For summary, see previous post.

For more information see Department of Health and Ageing

Adapted from; http://www.influenzaspecialistgroup.org.au/surveillance
 
Re: Australia Influenza surveillance 2012

New South Wales

For the week ending August 24th 2012

The influenza-like illness (ILI) presentation rate to selected emergency departments (ED) decreased this week. The rate was within the usual range for this time of year and well below the peak of activity seen in mid-July. ED admissions to critical care units for ILI and pneumonia increased further this week but were within the usual range for this time of year. Six influenza outbreaks were reported in residential care facilities. Laboratory testing data showed that influenza A activity continued to decline from its peak in late June, while there was a further small increase in influenza B activity. As of 3 August, the population death rate for influenza and pneumonia continued to decline, and was just below the epidemic threshold. Sporadic cases of human infection with variant influenza A (H3N2v) viruses have continued to be reported across the United States but without sustained human to human transmission.

For more information: NSW Health - Infectious Diseases Alert

Queensland

For week ending August 27th.

Year to date (YTD) there have been 12,704 notifications of influenza in Queensland. Subtype is recorded for 1,698 of the 10,229 notifications of influenza A, comprising 32 A(H1N1)pdm09 and 1,666 H3N2. Nineteen percent (2,475) of notifications have been influenza B.

For more information: QLD Health - Preventable Diseases

South Australia

Week ending August 25th.

There were 275 cases of influenza virus infection reported this week, a decrease from 330 cases reported in the previous week. Of these cases, 24 were attributed to influenza B virus, 249 were typed as Influenza A, and two were identified as the pandemic Influenza A H1N1 2009 strain. There have been 4,693 influenza cases year-to-date compared to 2,921 cases reported for the same period last year.

Cases comprised of 138 males and 137 females. Of these, 18% were children <10 years of age and 26% were reported in persons aged 65 years or older. Since the beginning of 2012, 26% of notified influenza cases were reported in children <10 years of age.

For more information: Communicable Diseases Control Branch

Tasmania

No update. For week ending August 12th see above.

For more information: DHHS Communicable Diseases - FluTas

Victoria

Week ending August 19th.

? Influenza-like illness (ILI) activity was similar to the previous three weeks, with a presentation rate of 7.6 cases per 1000 patients seen, still within average levels of activity.
? From the 545 swabs received from surveillance GPs this season (30/4/12 ? 19/8/12), 215 (39%) have been positive for influenza, of which 18 were A(H1N1)pdm09, 152 were A(H3N2), 25 were A(untyped), 2 were influenza C and 18 were influenza B.
? This week we received 45 surveillance swabs of which 17 (38%) were positive for influenza. Of these swabs 1 was A(H3N2), 11 were untyped, 2 were influenza C and 3 influenza B.
? The majority of viruses detected through routine testing this week were influenza A, RSV and picornavirus. Of those positive for influenza 6 were A(H3N2) and 7 were untyped. Of the 188 influenza viruses detected so far this year 19 have been A(H1N1)pdm09, 134 have been A(H3N2), 20 are A(untyped) and 15 influenza B.
? Of the 280 influenza viruses analysed at the WHO Collaborating Centre for Reference and Research on Influenza year to date from Victoria, 11 were A(H1N1)pdm09, 277 H3N2 and 50 influenza B.
? This week the Influenza Complications Network (FluCAN) reported 18 hospitalisations (40 in the past fortnight), 15 due to influenza A(untyped) and 3 influenza B. Since 19/3/2012 FluCAN have reported 236 hospitalisations with confirmed influenza, of which 215 were influenza A(untyped) patients, 5 were A(H1N1)pdm09 and 17 were influenza B, from the four Victorian sentinel hospitals.
? The total number of laboratory confirmed notifications to the National Notifiable Diseases Surveillance System (NNDSS) to date was 29,632, of which 3,483 (12%) were from Victoria.

For more information: Victorian Infectious Diseases Reference Laboratory

Western Australia

For week ending August 26th.

Summary: The combined evidence from Department of Health influenza notifications,
laboratory detections and sentinel GP and Emergency Department indicators of community
influenza-like illness, indicates that influenza activity is continuing to decline. Influenza AH3
and influenza B viruses, along with RSV, remain the predominant circulating respiratory
viruses.
? The number of influenza notifications to the Department of Health declined further this week.
? The rate of ILI presentations to SPN(WA) GPs decreased with the current level remaining well below
this year?s peak, and also now below the peaks experienced in 2010 and 2011.
? Respiratory viral presentations to Perth EDs are gradually declining and are now just below the peak
levels experienced in 2010 and 2011.
? Influenza test requests received by PathWest remained stable compared to last week, but the
proportion positive in both sentinel and routine samples continues to decline, reaching 36% this
week.
? Overall detections comprised; 65.6% (145) A/H3N2 virus, 32.6% (72) influenza B virus, 1.3% (3)
AH1N1 and 0.5% (1) were mixed infection..
? Laboratory detections of RSV remain relatively high but continue to decline.

For more information: WA Virus Watch

Nationally

For the period to 1-31 August 2012 there were 11,914 confirmed Influenza cases (34,385 YTD)

The majority of notifications have been in QLD with 6,679. WA had 1,377, Victoria 1,236, SA 1,140, NSW 1,068, Tas 277, ACT 83 and NT 54.

For national data: National Notifiable Diseases Surveillance System

Australian Sentinel Practices Research Network (ASPREN)

ASPREN is a national syndromic surveillance program co-ordinated by the Discipline of General Practice at the University of Adelaide and The Royal Australian College of General Practitioners. One of the conditions under surveillance is influenza like illness (ILI). General practitioners participating in the ASPREN program contribute data on the proportion of consultations which are ILI related.

No update - for latest week (ending June 24th) see earlier post.

For more information: ASPREN

Flu Tracking
FluTracking is a pilot online health surveillance system which aims to detect epidemics of influenza. It is a joint initiative of The University of Newcastle, Hunter New England Area Health Service (NSW Health) and Hunter Medical Research Institute. Participation is voluntary and involves the completion of a weekly online survey during the influenza season. Data are collected on basic demographics, symptoms of ILI and absenteeism.

For week ending August 26th.

Moderate but declining levels of influenza-like illness activity detected
This survey was sent on Monday 27 August 12:18 AM and by Thursday 30 August 9:00 AM we had received
12669 responses (12715 last week) from 8276 people responding for themselves and 4393 household members
across Australia.
Across Australia, fever and cough was reported by
3.2% of vaccinated participants and 3.6% of
unvaccinated participants. Fever, cough and absence
from normal duties was reported by 1.9% of vaccinated
participants and 2.3% of unvaccinated participants.
For participants this week, 6900/12669 (54.5%) have
received the seasonal vaccine so far. Of the 2586
participants who identified as working face-to-face with
patients, 1905 (73.7%) have received the vaccine.

For more information, or to enrol: Flu Tracking

Australian influenza report 2012 - Current report: No 5 - 21 July to 3 August 2012

For summary, see previous post.

For more information see Department of Health and Ageing

Adapted from; http://www.influenzaspecialistgroup.org.au/surveillance
 
Re: Australia Influenza surveillance 2012

New South Wales

For the week ending August 31st.

? The influenza-like illness (ILI) presentation rate to selected emergency departments (ED) decreased further this week. The rate was within the usual range for this time of year and well below the peak of activity seen in mid-July.
? ED admissions to critical care units for ILI and pneumonia decreased this week but were within the usual range for this time of year.
? One influenza outbreak was reported in a residential care facility.
? Laboratory testing data showed that influenza A activity continued to decline from its peak in late June, while influenza B activity was steady.
? As of 10 August, the population death rate for influenza and pneumonia continued to decline, and was just below the epidemic threshold.
? Sporadic cases of human infection with variant influenza A (H3N2v) viruses have continued to be reported across the United States but without sustained human to human transmission. One death was reported.

For more information: NSW Health - Infectious Diseases Alert

Queensland

No update - for week ending August 27th see previous post.

For more information: QLD Health - Preventable Diseases

South Australia

Week ending September 1st.

There were 187 cases of influenza virus infection reported this week, a decrease from 279 cases reported in the previous week. Of these cases, 27 were attributed to influenza B virus and 160 were typed as Influenza A. There have been 4,883 influenza cases year-to-date compared to 3,178 cases reported for the same period last year.

Cases comprised of 79 males and 108 females. Of these, 21% were children <10 years of age and 17% were reported in persons aged 65 years or older. Since the beginning of 2012, 26% of notified influenza cases were reported in children <10 years of age.

For more information: Communicable Diseases Control Branch

Tasmania

Week ending August 26th.

Summary

Influenza has continued to decline across Tasmania during the second half of August, evident in reductions in notifications, testing and influenza-like illness.
The most common type of influenza in Tasmania so far year this remains influenza A H3N2.
Notifications of influenza B increased during August, but still comprised less than 10 per cent of all influenza cases for the month.

Flu notifications

The 2012 influenza season to date has featured a rapid increase in cases from baseline in May to a peak in late July/early August. Notifications continued to decline during the second half of August. There were 44 notifications received in the last week ending 26 August, compared to 75 the week prior. Notifications of influenza are only those people who are tested and then test positive for influenza; the true level of influenza illness in the community will always be higher.

For more information: DHHS Communicable Diseases - FluTas

Victoria

No Update - for week ending August 19th see previous post

For more information: Victorian Infectious Diseases Reference Laboratory

Western Australia

For week ending September 2nd.

Summary: Influenza activity is continuing to decline, based on the combined evidence from
Department of Health influenza notifications, laboratory detections and sentinel GP and
Emergency Department indicators of community influenza-like illness. Influenza AH3 and
influenza B viruses, along with RSV, remain the predominant circulating respiratory viruses.
? The number of influenza notifications to the Department of Health declined further this week.
? The rate of ILI presentations to SPN(WA) GPs continues to decrease, and the current level is below
levels experienced at the corresponding time in both 2010 and 2011.
? Respiratory viral presentations to Perth EDs stabilised this week and current levels are just below
those experienced at the corresponding time in both 2010 and 2011.
? Influenza test requests received by PathWest and the proportion positive in both sentinel and
routine samples continue to decrease, currently sitting at 30% and 42% respectively.
? Subtyping of influenza viruses in the past week comprised; 54.5% (91) A/H3N2 virus, 44.9% (75)
influenza B virus and 0.6% (1) AH1N1 virus.
? Laboratory detections of RSV remain moderately high but are declining.

For more information: WA Virus Watch

Nationally

For the period to 1-8 September 2012 there were 684 confirmed Influenza cases (37,005 YTD)

The majority of notifications have been in QLD with 505. SA had 65, WA 54, NSW 28, Victoria 21, Tas 4, ACT 4 and NT 3.

For national data: National Notifiable Diseases Surveillance System

Australian Sentinel Practices Research Network (ASPREN)

ASPREN is a national syndromic surveillance program co-ordinated by the Discipline of General Practice at the University of Adelaide and The Royal Australian College of General Practitioners. One of the conditions under surveillance is influenza like illness (ILI). General practitioners participating in the ASPREN program contribute data on the proportion of consultations which are ILI related.

No update - for latest week (ending June 24th) see earlier post.

For more information: ASPREN

Flu Tracking
FluTracking is a pilot online health surveillance system which aims to detect epidemics of influenza. It is a joint initiative of The University of Newcastle, Hunter New England Area Health Service (NSW Health) and Hunter Medical Research Institute. Participation is voluntary and involves the completion of a weekly online survey during the influenza season. Data are collected on basic demographics, symptoms of ILI and absenteeism.

For week ending September 2nd.

Low levels of influenza-like illness detected
This survey was sent on Monday 3 September 12:09 AM and by Thursday 6 September 9:00 AM we had
received 12701 responses (12673 last week) from 8265 people responding for themselves and 4436 household
members across Australia.
Across Australia, fever and cough was reported by 3.0% of vaccinated participants and 3.2% of unvaccinated participants. Fever, cough and absence from normal duties was reported by 1.9% of vaccinated
participants and 1.9% of unvaccinated participants.
For participants this week, 6905/12701 (54.4%) have received the seasonal vaccine so far. Of the 2622 participants who identified as working face-to-face with patients, 1931 (73.6%) have received the vaccine.

For more information, or to enrol: Flu Tracking

Australian influenza report 2012?4 to 17 August 2012 (#6/2012)
Summary

Nationally across most surveillance systems influenza activity continued to decrease this fortnight.
Although some jurisdictions have continued to report widespread activity above baseline levels, influenza activity continued to decrease across most of Australia.
Influenza-like illness (ILI) activity has continued to decrease, with current ILI activity levels similar to the levels during the same period in the 2010 and 2011 seasons.
During this fortnight there were 6,614 laboratory confirmed notifications of influenza. Nationally, notifications continue to plateau. However, almost 56% of notifications this fortnight were from Queensland, where there continues to be an increasing, although slowing, trend.
Nationally, influenza A(H3N2) remains the predominant circulating virus with some co-circulation of influenza B, however this varies by jurisdiction. So far in 2012 there have been very few notifications of pandemic (H1N1) 2009.
In 2010 and 2011 with the predominance of the pandemic (H1N1) 2009 virus, the age distribution of notifications showed a downward trend with increasing age. With the predominance of influenza A(H3N2) in 2012, the age distribution of notifications are currently reflective of traditional pre-pandemic seasons with peaks among those aged 0-4 and over 70 years.
As at 17 August 2012, there have been 30,733 confirmed cases of influenza reported. Excluding 2009, notifications of influenza in 2012 started their seasonal increase earlier and rose sharply in comparison to previous years. The intensity of the rise in cases for 2012 has also meant a higher peak in notifications, however the total number of notifications for the entire season may not result in a substantial variance compared to previous seasons.
Influenza associated hospitalisations have continued to decrease following a peak in mid-July. Known medical co-morbidities have been reported in 75% of hospitalised cases.
The WHO has reported that influenza activity has decreased in the majority of the temperate countries of the southern hemisphere. Influenza A(H3N2) viruses have been the most commonly reported across the southern hemisphere region, however in some counties of central and tropical South America there is a predominance of pandemic (H1N1) 2009 or influenza B.
The United States have reported an additional 71 human cases associated with a variant swine influenza A(H3N2) virus, increasing the total number of cases since July 2012, to 224. All cases in 2012 have been associated with direct or indirect contact with swine, though during 2011 there was some limited human to human transmission reported. Viruses detected in the current cases are similar to the variant viruses identified during July 2011 to April 2012.

For more information see Department of Health and Ageing

Adapted from; http://www.influenzaspecialistgroup.org.au/surveillance
 
Re: Australia Influenza surveillance 2012

New South Wales

For the week ending 7 September 2012:

The influenza-like illness (ILI) presentation rate to selected emergency departments (ED) decreased further this week. The rate was below the usual range for this time of year and well below the peak of activity seen in mid-July. ED admissions to critical care units for ILI and pneumonia decreased this week but were within the usual range for this time of year. Two influenza outbreaks were reported in a residential care facility. Laboratory testing data showed that influenza A activity continued to decline from its peak in late June, while influenza B activity increased. As of 17 August, the population death rate for influenza and pneumonia increased slightly and was above the epidemic threshold. Sporadic cases of human infection with variant influenza A (H3N2v) viruses have continued to be reported across the United States but without sustained human to human transmission. One death was reported.


For more information: NSW Health - Infectious Diseases Alert

Queensland

No update - for week ending August 27th see earlier post.

For more information: QLD Health - Preventable Diseases

South Australia

No update. For week ending September 1st see previous post.

For more information: Communicable Diseases Control Branch

Tasmania

For week ending September 13th.

Summary

Influenza has continued to decline across Tasmania during early September. Notifications, testing and reports of influenza-like illness have all fallen steadily since mid-August.
Influenza A has been by far the most common type of influenza detected in Tasmania during 2012.
Notifications of influenza B increased in late August. Although absolute numbers are small these now comprise approximately one-third of all recent notifications.

Flu notifications

Following the July-August 2012 peak in influenza, notifications continued to decline. Only 18 notifications were received in the last reporting week, 24 the week before. Notifications of influenza are only those people who are tested and then test positive for influenza; the true level of influenza illness in the community will always be higher.

For more information: DHHS Communicable Diseases - FluTas

Victoria

For week ending September 9th.

Summary

? Influenza-like illness (ILI) activity was slightly higher than reported for the previous period, with a presentation rate of 5.1 cases per 1000 patients seen, remaining just above baseline levels of activity.
? From the 656 swabs received from surveillance GPs this season (30/4/12 ? 9/9/12), 261 (40%) have been positive for influenza, of which 25 were A(H1N1)pdm09, 196 were A(H3N2), 10 are A(untyped), 2 were influenza C and 28 were influenza B.
? This week we received 33 surveillance swabs of which 17 (52%) were positive for influenza. Of these swabs 1 was A(H1N1)pdm09, 8 were A(H3N2), 3 were untyped and 5 were influenza B.
? The majority of viruses detected through routine testing this week were RSV and picornavirus. Of those positive for influenza 4 were A(H3N2) and 1 was untyped. Of the 216 influenza viruses detected so far this year 19 have been A(H1N1)pdm09, 167 have been A(H3N2), 14 are A(untyped) and 16 influenza B.
? Of the 394 influenza viruses analysed at the WHO Collaborating Centre for Reference and Research on Influenza year to date from Victoria, 11 were A(H1N1)pdm09, 318 H3N2 and 65 influenza B.
? This week the Influenza Complications Network (FluCAN) reported 14 hospitalisations (29 in the past fortnight), 12 due to influenza A(untyped) and 2 influenza B. Since 19/3/2012 FluCAN have reported 312 hospitalisations with confirmed influenza, of which 283 were influenza A(untyped) patients, 5 were A(H1N1)pdm09 and 24 were influenza B, from the four Victorian sentinel hospitals.
? The total number of laboratory confirmed notifications to the National Notifiable Diseases Surveillance System (NNDSS) to date was 37,305, of which 4,510 (12.1%) were from Victoria.

For more information: Victorian Infectious Diseases Reference Laboratory

Western Australia

For Week ending September 9th.

Summary: Influenza activity is continuing to decline, based on the combined evidence from
Department of Health influenza notifications, laboratory detections and sentinel GP and
Emergency Department indicators of community influenza-like illness. Influenza AH3 and
influenza B viruses, along with RSV, remain the predominant circulating respiratory viruses.
? The number of influenza notifications to the Department of Health continues to decline sharply.
? The rate of ILI presentations to SPN(WA) GPs continues to decrease, and the current level is well
below levels experienced at the corresponding time in both 2010 and 2011.
? Respiratory viral presentations to Perth EDs decreased further this week and are moving towards
baseline level.
? Influenza test requests received by PathWest and the proportion positive in both sentinel and
routine samples continue to decrease, currently sitting at 20% and 26% respectively.
? Routine influenza detections at PathWest decreased by 49% this week.
? Subtyping of influenza viruses in the past week comprised; 68.4% (67) A/H3N2 virus and 31.6%
(31) influenza B virus. No A/H1N1 virus was detected.
? Laboratory detections of RSV continue to decline.

For more information: WA Virus Watch

Nationally

For the period to 1-14 September 2012 there were 1,972 confirmed Influenza cases (38,613 YTD)

The majority of notifications have been in QLD with 1,123. Victoria had 309, WA 199, NSW 156, SA 147, ACT 15, NT 13 and Tas 10.

For national data: National Notifiable Diseases Surveillance System

Australian Sentinel Practices Research Network (ASPREN)

ASPREN is a national syndromic surveillance program co-ordinated by the Discipline of General Practice at the University of Adelaide and The Royal Australian College of General Practitioners. One of the conditions under surveillance is influenza like illness (ILI). General practitioners participating in the ASPREN program contribute data on the proportion of consultations which are ILI related.

No update - for latest week (ending June 24th) see earlier post.

For more information: ASPREN

Flu Tracking
FluTracking is a pilot online health surveillance system which aims to detect epidemics of influenza. It is a joint initiative of The University of Newcastle, Hunter New England Area Health Service (NSW Health) and Hunter Medical Research Institute. Participation is voluntary and involves the completion of a weekly online survey during the influenza season. Data are collected on basic demographics, symptoms of ILI and absenteeism.

For Week ending September 9th.


Low levels of influenza-like illness detected
This survey was sent on Monday 10 September 12:10 AM and by Thursday 13 September 9:00 AM we had
received 12462 responses (12700 last week) from 8130 people responding for themselves and 4332 household
members across Australia.

Across Australia, fever and cough was reported by 2.5% of vaccinated participants and 3.3% of unvaccinated participants. Fever, cough and absence from normal duties was reported by 1.4% of vaccinated participants and 1.9% of unvaccinated participants.
For participants this week, 6756/12462 (54.2%) have received the seasonal vaccine so far. Of the 2547 participants who identified as working face-to-face with patients, 1858 (72.9%) have received the vaccine.

For more information, or to enrol: Flu Tracking

Australian influenza report 2012?4 to 17 August 2012 (#6/2012)

See earlier post for summary.

For more information see Department of Health and Ageing

Adapted from; http://www.influenzaspecialistgroup.org.au/surveillance
 
Re: Australia Influenza surveillance 2012

New South Wales

For the week ending September 14th.

For the week ending 14 September 2012: The influenza-like illness (ILI) presentation rate to selected emergency departments (ED) decreased further this week. The rate was below the usual range for this time of year and well below the peak of activity seen in mid-July. ED admissions to critical care units for ILI and pneumonia increased this week but were above the usual range for this time of year. One influenza outbreak was reported in a residential care facility. Laboratory testing data showed that influenza A activity continued to decline from its peak in late June, while influenza B activity was steady. As of 24 August, the population death rate for influenza and pneumonia remained steady and remains above the epidemic threshold.

For the week ending 24 August: There were 1.96 pneumonia or influenza deaths per 100,000 NSW population, which is above the epidemic threshold of 1.71 per 100,000 population (Figure 5).* Between 1 July and 24 August 2012, out of 9026 deaths there were 21 death certificates mentioning influenza, and 1121 mentioning pneumonia. The majority of these influenza and pneumonia deaths were in persons aged greater than 65 years. The updated data on pneumonia and influenza deaths indicates that the rate of deaths in this category was above the epidemic threshold for most of July. As expected, the increase in the death rate has mirrored the increases seen in laboratory isolations of influenza and Emergency Department ILI activity, but with a delay of one to two weeks.

For more information: NSW Health - Infectious Diseases Alert

Queensland

No update - for week ending August 27th see earlier post.

For more information: QLD Health - Preventable Diseases

South Australia

For the week ending September 16th.

There were 133 cases of influenza virus infection reported this week, a decrease from 165 cases reported in the previous week. Of these cases, 31 were attributed to influenza B virus and 102 were typed as influenza A. There have been 5,179 influenza cases year-to-date compared to 3,692 cases reported for the same period last year.

Cases comprised of 66 males and 67 females. Of these, 23% were children <10 years of age and 23% were reported in persons aged 65 years or older. Since the beginning of 2012, 25% of notified influenza cases were reported in children <10 years of age.

For more information: Communicable Diseases Control Branch

Tasmania

No Update. For week ending Sep 13th, see previous post.

For more information: DHHS Communicable Diseases - FluTas

Victoria

No Update. For week ending September 9th, see previous post.

For more information: Victorian Infectious Diseases Reference Laboratory

Western Australia

No Update. For week ending September 9th, see previous post.

For more information: WA Virus Watch

Nationally

For the period to 1-21 September 2012 there were 2,923 confirmed Influenza cases (39,649 YTD)

The majority of notifications have been in QLD with 1,521. Victoria had 529, WA 277, NSW 274, SA 255, ACT 29, Tas 20 and NT 18.

For national data: National Notifiable Diseases Surveillance System

Australian Sentinel Practices Research Network (ASPREN)

ASPREN is a national syndromic surveillance program co-ordinated by the Discipline of General Practice at the University of Adelaide and The Royal Australian College of General Practitioners. One of the conditions under surveillance is influenza like illness (ILI). General practitioners participating in the ASPREN program contribute data on the proportion of consultations which are ILI related.

No update - for latest week (ending June 24th) see earlier post.

For more information: ASPREN

Flu Tracking
FluTracking is a pilot online health surveillance system which aims to detect epidemics of influenza. It is a joint initiative of The University of Newcastle, Hunter New England Area Health Service (NSW Health) and Hunter Medical Research Institute. Participation is voluntary and involves the completion of a weekly online survey during the influenza season. Data are collected on basic demographics, symptoms of ILI and absenteeism.

For week ending September 16th.

Low levels of influenza-like illness detected
This survey was sent on Monday 17 September 12:12 AM and by Thursday 20 September 9:00 AM we had
received 12471 responses (12462 last week) from 8139 people responding for themselves and 4332 household
members across Australia.

Across Australia, fever and cough was reported by
2.1% of vaccinated participants and 2.5% of
unvaccinated participants. Fever, cough and absence
from normal duties was reported by 1.2% of vaccinated
participants and 1.4% of unvaccinated participants.
For participants this week, 6761/12471 (54.2%) have
received the seasonal vaccine so far. Of the 2575
participants who identified as working face-to-face with
patients, 1886 (73.2%) have received the vaccine.

For more information, or to enrol: Flu Tracking

Australian influenza report 2012?18 to 31 August 2012 (#7/2012)

Summary

Nationally, influenza activity continued to decrease this fortnight.
Although some jurisdictions have continued to report widespread activity above baseline levels, influenza activity was reported as decreasing or stable across all jurisdictions.
Influenza-like illness (ILI) activity has continued to decrease across all ILI surveillance systems.
During this fortnight there were 5,045 laboratory confirmed notifications of influenza. Nationally, notifications have started to decrease, following a prolonged peak of around 6 weeks. Almost 58% of notifications this fortnight were from Queensland, where there is now a decreasing trend.
Nationally, influenza A(H3N2) remains the predominant circulating virus with some increasing co-circulation of influenza B, however this varies by jurisdiction. So far in 2012 there have been very few notifications of pandemic (H1N1) 2009.
In 2010 and 2011 with the predominance of the pandemic (H1N1) 2009 virus, the age distribution of notifications showed a downward trend with increasing age. With the predominance of influenza A(H3N2) in 2012, the age distribution of notifications are currently reflective of traditional pre-pandemic seasons with peaks among those aged 0-4 and over 70 years.
As at 31 August 2012, there have been 36,321 laboratory confirmed cases of influenza reported. Excluding 2009, notifications of influenza in 2012 started their seasonal increase earlier and rose sharply in comparison to previous years. The intensity of the rise in cases for 2012 has resulted in a higher and prolonged peak in notifications.
Influenza associated hospitalisations have continued to decrease following a peak in mid-July. Known medical co-morbidities have been reported in 75% of hospitalised cases and hospitalisations have peaked among those aged 0-9 and over 70 years.
The WHO has reported that influenza activity has decreased in the majority of the temperate countries of the southern hemisphere. Influenza A(H3N2) viruses have been the most commonly reported across the southern hemisphere region, however the previous predominance of pandemic (H1N1) 2009 reported in Central America has transitioned to a predominance of influenza B.
Since July 2012, the United States reported 288 cases associated with a variant swine influenza A(H3N2) virus, including 15 hospitalisations and one death. Most cases have been associated with contact with swine and though limited human to human transmission has occurred, this variant is not readily spreading between people. Additionally the United States have also reported three human cases of a variant swine influenza A(H1N2) virus also associated with swine contact.
...
So far in 2012, 43 influenza associated deaths have been notified to the NNDSS, with a median age of 80 years. Almost all cases were reported as having influenza A(unsubtyped) or A(H3N2), with the A(unsubtyped) infections also likely to be attributable to A(H3N2). The number of influenza associated deaths reported to the NNDSS are reliant on the follow up of cases to determine the outcome of their infection and most likely do not represent the true mortality impact associated with this disease.

For more information see Department of Health and Ageing

Adapted from; http://www.influenzaspecialistgroup.org.au/surveillance
 
Re: Australia Influenza surveillance 2012

New South Wales

Week ending Sep 21 is published, but not available at time of post.

For more information: NSW Health - Infectious Diseases Alert

Queensland

For week ending September 16th.

Year to date (YTD) there have been 15,336 notifications of influenza in Queensland. Subtype is recorded for 1,804 of the 11,780 notifications of influenza A, comprising 33 A(H1N1)pdm09 and 1,771 H3N2. Twenty-three percent (3,556) of notifications have been influenza B.

For more information: QLD Health - Preventable Diseases

South Australia

For week ending September 22nd

There were 108 cases of influenza virus infection reported this week, a decrease from 134 cases reported in the previous week. Of these cases, 33 were attributed to influenza B virus, 73 were typed as influenza A and two were identified as the pandemic Influenza A H1N1 2009 strain. There have been 5,288 influenza cases year-to-date compared to 3,918 cases reported for the same period last year.

Cases comprised of 53 males and 55 females. Of these, 22% were children <10 years of age and 21% were reported in persons aged 65 years or older. Since the beginning of 2012, 25% of notified influenza cases were reported in children <10 years of age.

For more information: Communicable Diseases Control Branch

Tasmania

No Update. For week ending Sep 13th, see earlier post.

For more information: DHHS Communicable Diseases - FluTas

Victoria

Week ending September 23rd.

? Influenza-like illness (ILI) activity was lower than reported for the previous period, with a presentation rate of 2.8 cases per 1000 patients seen, falling below baseline levels of activity.
? From the 675 swabs received from surveillance GPs this season (30/4/12 ? 23/9/12), 270 (40%) have been positive for influenza, of which 25 were A(H1N1)pdm09, 199 were A(H3N2), 12 are A(untyped), 2 were influenza C and 32 were influenza B.
? This week we received 10 surveillance swabs of which 5 (50%) were positive for influenza. Of these 4 were influenza A (untyped) and 1 was influenza B.
? Of the viruses detected through routine testing this week, again there were unusually high levels of influenza B and HMV. Of the 236 influenza viruses detected so far this year 19 have been A(H1N1)pdm09, 173 have been A(H3N2), 21 are A(untyped) and 23 influenza B.
? Of the 436 influenza viruses analysed at the WHO Collaborating Centre for Reference and Research on Influenza year to date from Victoria, 11 were A(H1N1)pdm09, 348 H3N2 and 77 influenza B.
? This week the Influenza Complications Network (FluCAN) reported 4 hospitalisations (17 in the past fortnight), all due to influenza A(untyped). Since 19/3/2012 FluCAN have reported 332 hospitalisations with confirmed influenza, of which 297 were influenza A(untyped) patients, 6 were A(H1N1)pdm09 and 29 were influenza B, from the four Victorian sentinel hospitals.
? The total number of laboratory confirmed notifications to the National Notifiable Diseases Surveillance System (NNDSS) to date was 40,218, of which 5,132 (13%) were from Victoria.

For more information: Victorian Infectious Diseases Reference Laboratory

Western Australia

Week ending September 16th.

Summary: Influenza activity is continuing to decline, and most indicators are now at levels
below those experienced for the corresponding period in the past two years. Influenza AH3 and
influenza B viruses, along with RSV, remain the predominant circulating respiratory viruses.
? The number of influenza notifications to the Department of Health continues to decline sharply.
? The rate of ILI presentations to SPN(WA) GPs stabilised this week. The current level is well below
levels experienced at the corresponding time in both 2010 and 2011.
? Respiratory viral presentations to Perth EDs increased this week but the proportion of cases admitted
decreased to 5.5% compared to 6.9% last week.
? Influenza test requests received by PathWest and the proportion positive in both sentinel and
routine samples continue to decrease, currently sitting at 14% and 22% respectively.
? Routine influenza detections at PathWest continue to decrease.
? Subtyping of influenza viruses in the past week comprised; 55.3% (31) A/H3N2 virus,42.8% (24)
influenza B virus and 1.9% (1) A/H1N1 virus.
? Laboratory detections of RSV are fluctuating at moderately high levels.

For more information: WA Virus Watch

Nationally

For the period to 1-29 September 2012 there were 3,766 confirmed Influenza cases (40,510 YTD)

The majority of notifications have been in QLD with 1,866. Victoria had 572, NSW 490, WA 372, SA 366, ACT 39, NT 33 and Tas 28.

For national data: National Notifiable Diseases Surveillance System

Australian Sentinel Practices Research Network (ASPREN)

ASPREN is a national syndromic surveillance program co-ordinated by the Discipline of General Practice at the University of Adelaide and The Royal Australian College of General Practitioners. One of the conditions under surveillance is influenza like illness (ILI). General practitioners participating in the ASPREN program contribute data on the proportion of consultations which are ILI related.

No update - for latest week (ending June 24th) see earlier post.

For more information: ASPREN

Flu Tracking
FluTracking is a pilot online health surveillance system which aims to detect epidemics of influenza. It is a joint initiative of The University of Newcastle, Hunter New England Area Health Service (NSW Health) and Hunter Medical Research Institute. Participation is voluntary and involves the completion of a weekly online survey during the influenza season. Data are collected on basic demographics, symptoms of ILI and absenteeism.

Week #21 - ending 23 September 2012
Low levels of influenza-like illness detected
This survey was sent on Monday 24 September 12:04 AM and by Thursday 27 September 9:00 AM we had
received 11793 responses (12473 last week) from 7801 people responding for themselves and 3992 household
members across Australia.
Across Australia, fever and cough was reported by
2.3% of vaccinated participants and 2.1% of
unvaccinated participants. Fever, cough and absence
from normal duties was reported by 1.4% of vaccinated
participants and 1.1% of unvaccinated participants.
For participants this week, 6461/11793 (54.8%) have
received the seasonal vaccine so far. Of the 2475
participants who identified as working face-to-face with
patients, 1810 (73.1%) have received the vaccine.

For more information, or to enrol: Flu Tracking

Australian influenza report 2012?18 to 31 August 2012 (#7/2012)

See previous post for summary.

For more information see Department of Health and Ageing

Adapted from; http://www.influenzaspecialistgroup.org.au/surveillance
 
Re: Australia Influenza surveillance 2012

AUSTRALIAN INFLUENZA SURVEILLANCE REPORT
No. 9, 2012, REPORTING PERIOD:
15 September to 28 September 2012

SUMMARY
 Nationally influenza activity continued to decrease this fortnight.
 Although South Australia continues to report widespread activity above baseline levels, the majority of jurisdictions have reported localised and sporadic activity. Influenza activity was reported as decreasing or stable across all jurisdictions.
 Influenza-like illness (ILI) activity has continued to decrease across all ILI surveillance systems.
 During this fortnight there were 1,470 laboratory confirmed notifications of influenza. Nationally, notifications have continued to decrease. Over 40% of notifications this fortnight were from Queensland, where there continues to be a decreasing trend.
 Influenza B is now the predominant circulating virus comprising 53% of notifications over the reporting period, followed by influenza A(H3N2). So far this year there have been very few notifications of pandemic (H1N1) 2009.
 In 2010 and 2011 with the predominance of the pandemic (H1N1) 2009 virus, the age distribution of notifications showed a downward trend with increasing age. With the predominance of influenza A(H3N2) in 2012, the age distribution of notifications are currently reflective of traditional pre-pandemic seasons with peaks among those aged 0-4 and over 70 years.
 As at 28 September 2012, there have been 41,201 laboratory confirmed cases of influenza reported. Excluding 2009, notifications of influenza in 2012 started their seasonal increase earlier and rose sharply in comparison to previous years. The intensity of the rise in cases for 2012 has resulted in a higher and prolonged peak in notifications.
 Influenza associated hospitalisations were relatively stable over the reporting period and remain well below the peak in mid-July. Known medical co-morbidities have been reported in 75% of hospitalised cases and hospitalisations peak among those aged over 70 years, with a secondary peak for those aged 0-9.
 The WHO has reported that influenza activity is decreasing in all temperate countries of the southern hemisphere.
 On 19 September 2012, the WHO recommended that vaccines for the 2013 southern hemisphere influenza season contain the following: an A/California/7/2009 (H1N1)pdm09-like virus; an A/Victoria/361/2011 (H3N2)-like virus; and a B/Wisconsin/1/2010-like virus. This composition is consistent with the 2012-13 northern hemisphere vaccine recommendations, in which the A(H3N2) and influenza B viruses were changed.
...
Deaths Associated with Influenza and Pneumonia
Nationally Notified Influenza Associated Deaths
So far in 2012, 57 influenza associated deaths have been notified to the NNDSS, with a median age of 79 years. Almost 90% of cases were reported as having influenza A(unsubtyped) or A(H3N2), with the A(unsubtyped) infections also likely to be attributable to A(H3N2). The number of influenza associated deaths reported to the NNDSS are reliant on the follow up of cases to determine the outcome of their infection and most likely do not represent the true mortality impact associated with this disease.
New South Wales Influenza and Pneumonia Death Registrations
Death registration data for the week ending 7 September 2012 show that there were 1.62 pneumonia or influenza associated deaths per 100,000 population in NSW, which is below the epidemic threshold of 1.67 per 100,000 NSW population (Figure 18).4 Between 1 July and 7 September 2012, the majority of deaths were in persons aged over 65 years. The rate of deaths classified as influenza and pneumonia was above the epidemic threshold for most of July. The increase in the death rate is consistent with trends observed in laboratory isolations of influenza and emergency department ILI activity.
...
 
Re: Australia Influenza surveillance 2012

AUSTRALIAN INFLUENZA SURVEILLANCE REPORT
No. 10, 2012, REPORTING PERIOD:
29 September to 12 October 2012
...
SUMMARY
 Nationally, influenza activity continued to decrease this fortnight.
 All jurisdictions have reported localised and sporadic influenza activity. Influenza activity was reported as decreasing or stable across all jurisdictions, with the exception of Central Australia.
 Compared with the previous year, influenza activity during the 2011/12 inter-seasonal period remained relatively low.
 As at 12 October 2012, there have been 41,981 laboratory confirmed cases of influenza reported. Excluding 2009, notifications of influenza in 2012 started their seasonal increase earlier, rose sharply and peaked higher in comparison with previous years.
 The majority of jurisdictions peaked in activity around mid-July, however, ongoing increased activity continued to be reported in Queensland until the peak in mid-August.
 Through 2012 there have been very few notifications of pandemic (H1N1) 2009. Nationally, influenza A(H3N2) was the predominant circulating virus this influenza season, along with increasing co-circulation of influenza B. Influenza B was the predominant circulating virus this reporting period, comprising 53% of notifications.
 In 2010 and 2011 with the predominance of the pandemic (H1N1) 2009 virus, the age distribution of notifications showed a downward trend with increasing age. With the predominance of influenza A(H3N2) in 2012, the age distribution of notifications are currently reflective of traditional pre-pandemic seasons with peaks among those aged 0-4 and over 70 years.
 Influenza associated hospitalisations have continued to decrease following a peak in mid-July. Known medical co-morbidities have been reported in 75% of hospitalised cases and the rate of hospitalisations was highest amongst cases aged over 70 years, followed by those aged 0-9 years.
 The WHO has reported that influenza activity has continued to decline in all temperate countries of the southern hemisphere. Seasonal influenza transmission has not yet been detected in the northern temperate zone.
 The Australian Influenza Vaccine Committee (AIVC) has agreed to adopt the WHO recommendations for the composition of the 2013 southern hemisphere influenza season vaccine. In comparison to the current 2012 southern hemisphere vaccine, the recommended A(H3N2) and B viruses have been changed in line with the WHO recommended 2012-13 northern hemisphere vaccine.
 This will be the final Australian Influenza Surveillance Report for 2012, unless unusual activity becomes apparent over the summer months.
...
http://www.health.gov.au/internet/main/publishing.nsf/Content/6EE650550BD9C27DCA25736B001219D0/$File/ozflu-no10-2012.pdf
 
Re: Australia Influenza surveillance 2012

all Australia:
http://www.health.gov.au/internet/main/publishing.nsf/Content/cda-surveil-ozflu-flucurr.htm
http://www.health.gov.au/internet/m...27DCA25736B001219D0/$File/ozflu-no10-2012.pdf

chart with vaccinated vs. unvaccinated ILI:
http://www.health.gov.au/internet/m...geBody/0.744E?OpenElement&FieldElemFormat=gif


ASPREN:
http://www.dmac.adelaide.edu.au/aspren/documents/Fortnight reports/12/ASPREN Report No 23 2012.pdf


flutracking map: http://www.flutracking.net/maps.php
report: http://www.flutracking.net/survey/reports/LatestReport.pdf


virus watch: http://www.public.health.wa.gov.au/cproot/5043/2/20121230_virus_watch.pdf


Queensland: http://www.health.qld.gov.au/ph/documents/cdb/influenza-qld-121015.pdf

NSW:
http://www.health.nsw.gov.au/resources/publichealth/infectious/influenza/pdf/weekending_05102012.pdf
http://www0.health.nsw.gov.au/resou...ous/influenza/pdf/20121130_monthly_report.pdf

South Australia:
http://www.dh.sa.gov.au/pehs/publications/PHB Dec 2012 final.pdf

Victoria:
http://www.vidrl.org.au/surveillance/flu reports/flurpt12/pdffiles/flu1226.pdf

-------------------------------------
The WHOCC has analysed some of the currently circulating influenza viruses.
Whilst almost all of the influenza A(H3N2) viruses are of a more recent strain
that differs from the A(H3N2) strain in the 2012 Southern
Hemisphere seasonal influenza vaccine, it is expected that
the vaccine will still offer significant protection.
------------------------------------------------------------


http://www.tga.gov.au/about/committees-aivc.htm
http://www.who.int/influenza/vaccines/virus/recommendations/2013_south/en/
http://www.who.int/influenza/survei.../latest_update_GIP_surveillance/en/index.html
http://www.surv.esr.cri.nz/PDF_surveillance/Virology/FluMthRpt/2012/FluMthRpt201209.pdf
http://www.surv.esr.cri.nz/virology/influenza_weekly_update.php
http://www.who.int/influenza/gisrs_laboratory/updates/summaryreport/en/index.html#
 
Back
Top