gsgs
Registered User
http://www.healthemergency.gov.au/internet/healthemergency/publishing.nsf/Content/ozflu2010.htm
week 28: http://www.healthemergency.gov.au/i...apr-jun-pdf-cnt.htm/$File/ozflu-no28-2010.pdf
week 29: http://www.healthemergency.gov.au/i...jul-sep-pdf-cnt.htm/$File/ozflu-no29-2010.pdf
week 30
week 31
week 32

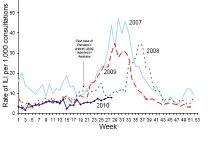
I think, they had an additional system in 2009, so the 2009-curve does not
represent all cases ?
in total there should have been ~twice as much flu in Australia in 2009 than in 2007 ? (my guess)
but fewer deaths from flu
could it be that ****** finally was good, that it reduces the total amount of flu now ?
Like flu in UK which mysterically went down since ~2000, when a new strain
of H1N1 appeared. But then, it didn't go down so much in other countries
although they had the same viruses
week 28: http://www.healthemergency.gov.au/i...apr-jun-pdf-cnt.htm/$File/ozflu-no28-2010.pdf
week 29: http://www.healthemergency.gov.au/i...jul-sep-pdf-cnt.htm/$File/ozflu-no29-2010.pdf
week 30
week 31
week 32
I think, they had an additional system in 2009, so the 2009-curve does not
represent all cases ?
in total there should have been ~twice as much flu in Australia in 2009 than in 2007 ? (my guess)
but fewer deaths from flu
could it be that ****** finally was good, that it reduces the total amount of flu now ?
Like flu in UK which mysterically went down since ~2000, when a new strain
of H1N1 appeared. But then, it didn't go down so much in other countries
although they had the same viruses