
• FluTrackers.com Inc. does not provide medical advice. Information on this web site is collected from various internet resources, and the FluTrackers board of directors makes no warranty to the safety, efficacy, correctness or completeness of the information posted on this site by any author or poster. The information collated here is for instructional and/or discussion purposes only and is NOT intended to diagnose or treat any disease, illness, or other medical condition. Every individual reader or poster should seek advice from their personal physician/healthcare practitioner before considering or using any interventions that are discussed on this website. By continuing to access this website you agree to consult your personal physican before using any interventions posted on this website, and you agree to hold harmless FluTrackers.com Inc., the board of directors, the members, and all authors and posters for any effects from use of any medication, supplement, vitamin or other substance, device, intervention, etc. mentioned in posts on this website, or other internet venues referenced in posts on this website.
  • We are not asking for any donations. Do not donate to any entity who says they are raising funds for us.

ancient deaths from cold weather

gsgs

Registered User
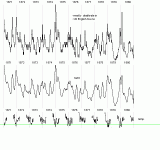
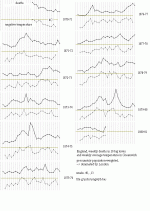
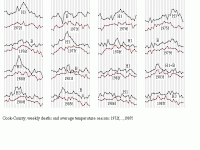
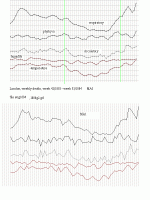
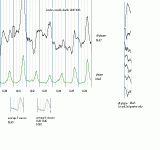
they observed a connection between increased death counts and
cold temperature in England, 1860-1890 in the (almost) flu-free period
you can see how deaths go up(down) the next week after
a cold(warm) week.

Farr, W. (1885) Vital statistics, London, Office of the Sanitary Institute, p. 413-416
(increased mortality during 6 cold weeks in England 1855,1874/5)
https://archive.org/details/vitalstatisticsm00farruoft

=============
If there was no flu in England 1860-1890, then what gave them immunity
for 1918 in the -then- elderly ? (>30-40y)

----------------------------------------------------
looking at the English excess deaths in the cold years 1875,1879 ...
either cold weather and influenza cause excess deaths from many identical causes
or 1874,1879 had an undetected mild flu-wave in England
In 1870-1880 (and probably other years, not examined yet) deaths rose suddenly after
weeks of cold temp. and just as suddenly went down after warmer temp.


add missing values, add 1951 , Italy,USA

condition,deaths in 1875,1876,1879,1880,1891,1892, male and female
---------------------------------------------
all,282202,264251,265076,245289,271496,254759,273442,255182,302491,285431,286062,273622
nerve,37575,32639,36488,31249,37495,33390,36255,33731,38126,34891,35622,32874
laryngitis,822,672,676,548,614,463,596,426,765,637,766,634
bronchitis,31908,31181,27899,26156,35595,35824,29617,28322,37802,37621,33071,33787
pleurisy,744,583,657,478,620,523,618,449,1213,792,1033,677
pneumonia,15968,11193,14085,10407,15721,11458,14606,10560,25332,17467,21231,15660
emphysema,257,193,271,164,373,247,316,161,1752,1302,1672,1210
lung_congestion,2298,1843,2029,1614,2141,1882,2012,1754,1,1,1,1
lung?,1041,764,1032,704,1091,812,967,724,2880,2428,2490,2139
pericarditis,282,240,210,187,280,206,260,174,363,305,346,262
heart?,13368,14740,13115,14404,15134,16957,13983,15190,16412,19404,15916,17998
asthma,1842,1321,1395,956,1298,950,972,696,1752,1302,1672,1210
edema_glettidis,47,30,29,20,39,28,35,20,1,1,1,1
teething,2844,2368,2694,2192,2392,1864,2259,928,2534,2107,2351,1891
childbirth,0,828,0,658,0,420,0,395,0,1234,0,1284
other_malformations,340,126,126,102,154,92,123,111,1,1,1,1
kidney,933,640,826,559,640,407,610,376,657,416,576,356
liver,2385,2454,2197,2341,2000,2079,1898,1953,2213,2256,1973,2071
brain,1956,1633,1773,1400,1768,1424,1546,1350,1748,1635,1618,1520
otitis,67,60,75,58,137,106,167,115,316,251,349,265
necrencephalus,1873,1228,1722,1171,2002,1440,1877,1408,1,1,1,1
insanity,414,478,382,447,732,831,735,788,1671,1124,1638,1040
paralysis,6383,6353,6051,5839,6339,6254,6034,5739,3881,4670,3630,4311
gangrema_senila,400,298,368,266,445,308,376,246,851,717,805,603
dropsy,1312,1878,1257,1664,942,1415,860,1271,109,162,96,152
rheumatism_heart,962,855,810,781,696,660,984,918,1278,1269,1306,1217
rheumatism,1136,1091,1031,1018,1032,1007,729,723,494,573,454,575
influenza,218,231,103,100,121,145,85,86,8621,8065,7673,8064
not_specified,1690,1544,1257,1087,842,713,725,614,1552,1142,1341,989
old_age,12330,16184,10870,14591,13072,16453,11408,14415,12487,16930,11813,16053
epilepsy,1496,1418,1539,1300,1555,1421,1421,1300,1563,1491,1458,1351


1891vs1892,gout,convulsions,peritonitis,other_locomotion
---------------------------------------------------------------------------
http://catalog.hathitrust.org/Record/012306663
Weekly return of births and deaths in London, and ... v. 46 (1885).
Copyright: Public Domain in the United States, Google-digitized.
table 2 Mean Temperature at the Royal Observatory Greenwich, and Annual Rate of Mortality
per 1000 Persons living in Twenty Large Towns of the United Kingdom, in each Week of 1870
weekly return of births and deaths in london and
annual summary of births, deaths, and causes of death in london and
Book digitized by Google from the library of Oxford University and uploaded to the Internet Archive by user tpb.

-----------------------------------------------------------------------
http://www.palgrave-journals.com/hsq/journal/v48/n1/full/hsq201021a.html
Data on deaths occurring in England and Wales on each day
from 1993 to 2007 were
extracted from the death registrations database held by ONS
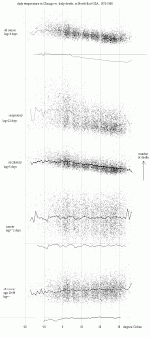
Excess mortality = -2.4 (9.5) - 6.5 (2.3) * Minimum Temperature (lag 4)
is the data (daily counts) available ?
-------------------------------------------------------------------------
Liverpool,1951 thread : http://www.flutrackers.com/forum/showthread.php?t=201877
-------------------------------------------------------------------------
Japan-thread: http://www.flutrackers.com/forum/showthread.php?t=211787
------------------------------------------------------------------------
Italy-thread: http://www.flutrackers.com/forum/showthread.php?t=219481
-------------------------------------------------------------------------------
 

Attachments

  • engw0.gif
    engw0.gif
    17.7 KB · Views: 1
  • ENGWYB0.GIF
    ENGWYB0.GIF
    22.3 KB · Views: 0
  • COOK03.GIF
    COOK03.GIF
    15.9 KB · Views: 1
  • farr4.GIF
    farr4.GIF
    208.4 KB · Views: 2
  • MASD5c.GIF
    MASD5c.GIF
    13.7 KB · Views: 0
  • 1884g2.gif
    1884g2.gif
    19.1 KB · Views: 1
  • daily04.GIF
    daily04.GIF
    38.6 KB · Views: 1
  • cold3.GIF
    cold3.GIF
    12.6 KB · Views: 1
Re: ancient deaths from cold weather

This study has shown that seasonal variation in mortality in Scotland is still a significant
public health problem. The annual average seasonal increase in mortality between 1981
and 1993 was 29% for females and 34% for males. During the study period influenza
epidemics occurred every 3–4 years. For each recorded death from influenza, there
was an increase in deaths from all causes of 1.4%. However during an influenza epidemic
the increase in all-cause mortality associated with the epidemic was considerably greater.
One hypothesis to explain these seasonal variations in mortality is that they simply represent
shifts in the timing of events that lead to death. The effects of season or temperature could
be seen as a kind of ‘harvesting’ of vulnerable members of the population. This view
might be supported by the age gradients and causes of death, which demonstrate the
greatest seasonal variation. However, it would require a detailed prospective study
involving information about the prior health of those dying in different seasons to investigate
this hypothesis further.
The fact that seasonal variation in mortality fell during the study period, that the degree of
change was greater in deprived areas compared to affluent areas and that social class
differences were only evident in the winter weeks would also lend support to this hypothesis.
Although no significant differences were found these observations indicate that while
socioeconomic status has some effect on seasonal variation the strength of this association
has declined. Indeed an analysis of seasonal variation according to deprivation category
failed to display a similar pattern to that for social class. Similar results were found recently
for London.27
Improvements in environmental characteristics such as the quality of housing, increased
use of central heating and other factors closely related to socioeconomic progress could
explain this apparent fall in seasonal variation in mortality. The lack of substantial evidence
of a relationship between socioeconomic status and seasonal mortality may be due to the
fact that area-based measures of deprivation and individual-based social class data are
not adequate proxy measures of housing conditions and fuel poverty.
The observed patterns of seasonal variation are ‘driven’ by temperature.
On average a fall in temperature of 1°C was associated with an increase in mortality of 1%.
Many studies28–,30 have examined the methods by which falling temperatures can affect
the physiological mechanisms of the human body. Seasonal variations have been demonstrated
in several risk factors for vascular disease, high blood pressure,31 cholesterol levels32,,33
and fibrinogen concentration in the blood.34–,36 The U-shaped relationship between
temperature and mortality, with very hot temperatures also having an adverse effect on health,
has also been described elsewhere.18,20,,21
Clearly the relationship between temperature and mortality influences seasonal patterns.
However it is the vulnerability of a population and the ability of the population to protect
themselves from this relationship which may determine the degree of seasonal variation
in mortality experienced. Britain is generally considered to have a mild climate and, perhaps
because of the perception of climate, has less strict building legislation than countries
such as Finland.37 The fact that Scotland still experiences seasonal increases in mortality
of the order of 30% while other European countries experience lower rates may be to
do with the ‘susceptibility’ of the population to changes in temperature rather
than the changes in temperature themselves. This study has also shown that while
slight differences in seasonal patterns in mortality can be related to socioeconomic
status the susceptibility of the population is not identified by these measures.
It would be difficult experimentally to isolate and modify specific aspects of lifestyle or
environment as a way of demonstrating cause and effect. However specific housing
characteristics such as fuel poverty,27,,38 or the presence of dampness and condensation
in homes may be related to the seasonal patterns in mortality experienced in the UK.
This type of information is available from sample-based house condition surveys but
relating sample-based explanatory variables to population-based mortality measures
could lead to spurious results. A further study using housing measures available from
the census such as tenure and amenities might provide more reliable insights into the
relationship. Housing improvement schemes of various kinds are now fairly widespread
in Scotland. With specifically collected data it is possible to envisage more focused
case-control studies of housing improvements in terms of the health outcomes they achieve.

International Epidemiological Association 2000

References
Langmuir AD. William Farr. Founder of modern concepts of surveillance. Int J Epidemiol 1976;5:13 18.
GRO(S). Quarterly Variation in Mortality in Scotland and 12 Selected Countries, since 1977. 1987. GRO(S).
Vital Events Report.
Douglas AS, Allan TM, Rawles JM. Composition of seasonality of disease. Scot Med J 1991;36:76 82.
Curwen M. Excess winter mortality: a British phenomenon? Health Trends 1991;22:169 75.
McDowell M. Long term trends in seasonal mortality. Popul Trends 1981;26:16–19.
Kunst AE, Looman CWN, Mackenbach JP. The decline in winter excess mortality in The Netherlands.
Int J Epidemiol 1990;20:971 77.
Mackenbach JP, Kunst AE, Looman CWN. Seasonal variation in mortality in The Netherlands.
J Epidemiol Community Health 1992;46: 261 65.
Green MS, Harari G, Kristal-Boneh E. Excess winter mortality from ischaemic heart disease and
stroke during colder and warmer years in Israel An evaluation and review of the role of
environmental temperature. Eur J Public Health 1994;4:3 11.
Douglas AS, Russell D, Allan TM. Seasonal, regional and secular variations of cardiovascular and
cerebrovascular mortality in New Zealand. Aust NZ J Med 1990;20:669 76.
MedlineWeb of Science
Becker S, Weng S. Seasonal patterns of deaths in Matlab, Bangladesh. Int J Epidemiol 1998;27:814 23.
Seto T, Mittlemann M, Davis R, Taira D, Kawachi I. Seasonal variation in coronary artery disease
mortality in Hawaii: observational study. Br Med J 1998;316:1946 4
McKee M, Sanderson C, Chenet L, Vassin S, Shkolnikov V. Seasonal variation in mortality in Moscow.
J Public Health Med 1998;20:268 74.
Curwen M, Devis T. Winter mortality, temperature and influenza: has the relationship changed
in recent years? Popul Trends 1988;54:17 20.
Simonsen L, Clarke MJ, Williamson G, Stroup DF, Arden NH, Schonberger LB. The impact of
influenza epidemics on mortality: introducing a severity index. Am J Public Health 1997;87:1944 50.
MedlineWeb of Scienc
Rogot E, Padgett SJ. Associations of coronary and stroke mortality with temperature and snowfall
in selected areas of the United States, 1962–66. Am J Epidemiol 1976;103:565 75.
Anderson TW, Rochard C. Cold snaps, snowfall and sudden death from ischaemic heart disease.
CMA Journal 1979;121:1580 83.
Baker-Blocker A. Winter weather and cardiovascular mortality in Minneapolis-St. Paul. Am J Public
Health 1982;72.
Saez M, Sunyer J, Castellsague J, Murillo C, Anto JM. Relationship between weather temperature
and mortality: A time series analysis approach in Barcelona. Int J Epidemiol 1995;24:576 82.
Enquselassie F, Dobson AJ, Alexander HM, Steele PL. Seasons, Temperature and coronary disease.
Int J Epidemiol1993;22:632 36
Heunis JC, Olivier J, Bourne DE. Short-term relationships between winter temperatures and cardiac
disease mortality in Cape Town. SA Med J 1985;85:1016 19.
Pan W-H, Li L-A, Tsai M-J. Temperature extremes and mortality from coronary heart disease and
cerebral infarction in elderly Chinese. Lancet 1995;345:353 55.
CrossRefMedlineWeb of Scienc
Laake K, Sverre JM. Winter excess mortality: a comparison between Norway and England plus Wales.
Age Ageing 1996;25:343 48.
Zeger SL. A regression model for time series of counts. Biometrika 1988;75:621 29.
Curwen M, Dunnell K, Ashley J. Hidden influenza deaths:1989 1990. Popul Trends 1990;61:31 33.
Carstairs V, Morris R. Deprivation and Health in Scotland. Aberdeen: Aberdeen University Press, 1992.
McLoone P, Boddy FA. Deprivation and Mortality in Scotland:1981 and 1991. Br Med J 1994;309:1465 70.
Shah S, Peacock J. Deprivation and excess winter mortality. J Epidemiol Community Health 1999;53:499 502.
Keatinge WR, Coleshaw SRK, Cotter F, Mattock M, Murphy M, Chelliah R. Increases in platelet and red
cell counts, blood viscosity, and arterial pressure during mild surface cooling: factors in mortality from
coronary and cerebral thrombosis in winter. Br Med J 1984;289: 1405 08.
Fleming DM, Cross KW, Crombie DL, Lancashire RJ. Respiratory illness and mortality in England and Wales.
Eur J Epidemiol 1993;9: 571 75. MedlineWeb of Science
Monto AS, Sook KL. The Tecumseh Study of Respiratory Illness. III Incidence and periodicity of
Respiratory syncytial virus and mycoplasma pneumoniae infections. Am J Epidemiol 1971;94:290 301.
Brennan PJ, Greenberg G, Miall WE, Thompson SG. Seasonal variation in arterial blood pressure.
Br Med J 1982;285:919 23.
Dobson HM, Muir MM, Hume R. The effect of ascorbic acid on the seasonal variations in serum
cholesterol levels. Scot Med J 1984;29: 176 82.
MacRury SM, Muir M, Hume R. Seasonal and climatic variation in cholesterol and vitamin C: effect
of vitamin C supplementation. Scot Med J 1992;37:49 52.
Stout RW, Crawford V. Seasonal variations in fibrinogen concentrations among elderly people.
Lancet 1991;338:9 13. CrossRefMedlineWeb of Science
Woodhouse PR, Tee Khaw K, Plummer M, Foley A, Meade TW. Seasonal variations of plasma
fibrinogen and factor VII activity in the elderly: winter infections and death from cardiovascular
disease. Lancet 1994;343:435 39. CrossRefMedlineWeb of Science
Meade TW, Brozovic M, Chakrabarti RR et al. Haemostatic function and ischaemic heart disease:
Principal results of the Northwick Park Heart Study. Lancet 1986;Sept.6:533 37.
Boardman, B. Seasonal Mortality and Cold Homes. 1–21. 1986. University of Warwick, Watford Printers Limited. Unhealthy Housing. Conference held at University of Warwick, 14th–16th December, 1986.
Conference Proceedings.
Watt GCM. Health implications of putting value added tax on fuel. Br Med J 1994;309:1030 31.


Articles citing this article
Seasonal variation in child and old-age mortality in rural Ghana Trans R Soc Trop Med Hyg (2014) 108 (3): 147-153
Seasonal patterns of mortality in relation to social factors J. Epidemiol. Community Health (2012) 66 (4): 379-384
Short term impact of smoke-free legislation in England: retrospective analysis of hospital admissions for
myocardial infarction BMJ (2010) 340 (jun08_1): c2161
Temporal Patterns of Hospital Admissions for Transient Ischemic Attack: A Retrospective Population-based
Study in the Emilia-Romagna Region of Italy CLIN APPL THROMB HEMOST (2010) 16 (2): 153-160
Home warmth and health status of COPD patients Eur J Public Health (2008) 18 (4): 399-405
Heat-related and cold-related deaths in England and Wales: who is at risk? Occup. Environ. Med.
(2007) 64 (2): 93-100
The lagged effect of cold temperature and wind chill on cardiorespiratory mortality in Scotland Occup.
Environ. Med. (2005) 62 (10): 702-710
Evidence for public health policy on inequalities: 1: The reality according to policymakers J. Epidemiol.
Community Health (2004) 58 (10): 811-816
Seasonal Variation in Diagnoses and Visits to Family Physicians Ann Fam Med (2004) 2 (5): 411-417
Excess winter mortality in Europe: a cross country analysis identifying key risk factors J.
Epidemiol. Community Health (2003) 57 (10): 784-789
Socioeconomic differentials in the temperature-mortality relationship in Sao Paulo, Brazil Int J
Epidemiol (2003) 32 (3): 390-397
Health impact assessment of housing improvements: incorporating research evidence J. Epidemiol.
Community Health (2003) 57 (1): 11-16
Elevated risk of high blood pressure: climate and the inverse housing law Int J Epidemiol (2002) 31 (4): 831-838
Temperature, housing, deprivation and their relationship to excess winter mortality in Great Britain,
1986-1996 Int J Epidemiol (2001) 30 (5): 1100-1108
Commentary: Short days--shorter lives: studying winter mortality to get solutions Int J Epidemiol
(2001) 30 (5): 1116-1118
Seasonal variation in cause-specific mortality: Are there high-risk groups? 25-year follow-up of civil
servants from the first Whitehall study Int J Epidemiol (2001) 30 (5): 1109-1116
 
Re: ancient deaths from cold weather

from 4 online available (1879,1885,1886,1889)
OCRs of scans of the London Medical Record


-------------------------------------------------------
March 16, 1885. THE LONDON MEDICAL RECORD.
3790. Burder on the Etiology of Catarrh. -in the
Bristol Med.'Chir. Jour. No. 6, Dr. Burder points
out the similarity of the symptoms in a common
cold and in epidemic influenza, as supplying firm
face evidence that they are one and the same
disease. The author gives three reasons for object-
ing that any given cold is caught by exposure to a
draught on a particular occasion.
1. The cause assigned seems altogether inadequate
to the effect produced.
2. The sense of chilliness, which constitutes the
* catching cold ' in the patient's imagination,
is in reality the first manifestation of the disease.
3. Exposure to cold may excite sneezing,
but the sneezing may have nothing to do with catarrh.
The author finds by personal experience
that catarrhs are more frequent during the months
of February, March, and April, and thinks that if
* getting wet' be an influential cause of catarrh,
it is difficult to see why catarrhs should be most
frequent when rainfall is least. Finally, he expresses
his belief that catarrh is due to an organism, which,
unlike many of its species, thrives in cold weather
and languishes in heat.

-------------------------------------------------
Art. 3944. kebbell on Tincture of Benzoin in In-
fluensa and Catarrh. In the Brit. Med, Jour., Feb.
1885, p. 430, Mr. A. Kebbell speaks of the great value
derived from inhaling tincture of benzoin m cases of
influenza and catarrh. The tincture should be inhaled
directly from a bottle containing it. If this be
done at the commencement of the complaint, speedy
relief will be obtained. [In 1879 - Rutherford
extolled the value of benzoic acid given internally in
cases of catarrh. Vide Medical Digest, sect. 593 : 6

4098. Brydon. Tincture of Benzoin in Influenza.
{Brit, Med. Jour., March, p. 682.)
Art. 4098. Brydon on Tincture of Benzoin in In-
fiuenza. In the Brit. Med, Jour,, March 1885,
p. 682, Dr. W. Brydon endorses the remarks made
by Mr. Kebbell in the Journal of February 28 in
recommending the use of an inhalation of tincture
of benzoin in cases of common nasal catarrh. Dr.
Brydon tried the inhalation on himself at the begin-
ning of an attack of influenza, and obtained relief
in a very short time. The uncomfortable stuffy
feeling of the nostrils and other symptoms speedily
disappeared, and after repeating the inhalation
several times no trace remained of the catarrh by
the evening. Dr. Brydon tried the inhalation on
two of his patients, and met with as good results.
[ pubmed on benzoin tincture
Allergic contact dermatitis from tincture of benzoin with multiple concomitant reactions.
Severe allergic contact dermatitis resulting from occupational exposure to tincture of
benzoin aerosol spray in an anesthesiologist.
...
no hits for tincture benzoin influenza ]

-----------------------------------------------------------
In the years 1865, 1867, 1871, 1872, 1876, and
1881 there were epidemics in North Greenland. In
1865 diphtheritis appeared, causing 3-14 per cent, of
the whole annual mortality. The most characteristic
disease in Greenland is an aggravated form of
influenza. This disease appeared as an epidemic in
1867, 1871, 1872, 1876, and 1881. In 1867 it was
said to be the cause of 55 per cent, of the whole
mortality. Probably many inflammatory affections
of the chest were included under this head. In 1871
measles were seen for the first time in North Green-
land. Dr. Pfaff treated 67 patients, of whom seven
died. In ten years Dr. Pfaff had 2,600 patients. In
the diseases enumerated by him we do not find any
mention of affections of the liver and kidneys, so
we may suppose that these are not frequent.
Rheumatism is present principally in the chronic
form, but heart-disease does not seem to be com-
mon. Venereal diseases have been introduced by
the whale fishers.
...
----------------------------------------------------
...
The author then considers otology under these
three heads, i. He concludes that ear-diseases are
much commoner than usually supposed, for the fol-
lowing reasons. They are usually not conspicuous
externally, as eye-diseases frequently are ; further, the
hearing power must be reduced to a pretty consider-
able extent before it is noticed in the ordinary rela-
tions of life ; and, lastly, deaf persons have a great
tendency to hide their infirmity. Having pointed
out the frequent connection of ear-diseases with in-
fluenza and diphtheria, with whooping cough and
scarlatina, with measles ^and small-pox, with typhus
and pulmonary tuberculosis, ...
-------------------------------------------------------
THE LONDON MEDICAL RECORDER. [Jan. 21, 1889.
1267. Baker on the Causation of Cold Weather
Diseases, In The Annual Report of the Michigan
State Board of Health for 1887, Dr. Baker pub-
lishes some interesting facts, mostly in the form of
tables and diagrams, showing the close relationship
which diphtheria, small-pox, and scarlet fever bear
to atmospheric temperature. The conclusions
arrived at are :
i. That diphtheria, scarlet fever, and small-pox
increase after the atmosphere is cold and dry,
and decrease after the atmosphere is warm and moist.
2. That these three diseases generally
enter the body through the air-passages, and that
the reason why they increase after the cold months
is because of greater susceptibility of the air-
passages in those months.
3. That the nonvolatile salts of the blood exuded
in excess into and upon the mucous surfaces of the
air-passages are capable of leading to an inflammation
which is called influenza, tonsillitis, or bronchitis,
according to the portion of the respiratory tract involved.
4. That, other things being equal, the non-volatile salts
are left by evaporation on the mucous lining of the
air-passages in proportion to the dryness of the air inhaled.
5. That certain kinds of diet, or non-action of the skin
or kidneys may predispose to inflammation of the air-passages,
and consequently to any communicable disease, which enters
the body by way of the air-passages, to which the person may
be susceptible.
6. That, aside from this cause. (non-volatile salts),
no other known cause capable of causing inflammation
of the air-plssages is ' present and acting ' in
proportion to the coldness and dryness of the atmosphere.
7. That, so far as is yet proved by statistics of large
number of cases, the strongest controlling cause of
inflammatory diseases of the air-passages is exposure
to a cold dry atmosphere.
8. That, excepting inoculation and other similar
exposure to the specific cause of the disease, the
strongest controlling cause of the spread of those
communicable diseases which generally enter the
body through the air-passages is exposure in a cold
dry atmosphere.
-------------------------------------------------------
http://pubmedcentralcanada.ca/pmcc/articles/PMC1058790/pdf/brjprevsmed00059-0029.pdf
examining London, 1947-1960 , also pollution
-----------------------------------------------------------------

http://www.plosone.org/article/info:doi/10.1371/journal.pone.0034091
New York, 1975-2002, low morning dew-point (but not evening) associated
with increased P+I mortality some weeks later
they say, they used NCHS-data, but NCHS only gives the day of death until 1988
-----------------------------------------------------------------

 
Re: ancient deaths from cold weather

http://www.ons.gov.uk/ons/rel/hsq/h...f-seasonal-mortality-in-england-and-wales.pdf

> daily death occurrence data between 1993 and 2007 was extracted
> from the death registrations database held by the Office for National Statistics (ONS)

so they have daily counts ! But apparently secret.
about 1500 deaths per day,
I get 1300 for 1972-1988,
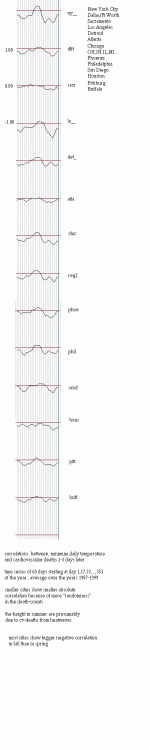
(set1=MA,NY,NJ,PA) or (set2=MI,IL,IN,OH,WI)

thanks to NCHS for providing the day of death for 1962-1967 and 1972-1988
for the other periods we only have the month.
Plus weekly preliminary counts from the 122 big cities.

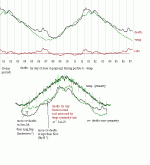
For these times and regions you can still see how cold (warm) periods of a few weeks
result in increased (reduced) deaths [except heatwaves]
But it's not so clear, not always, And surprisingly it's harder to see for deaths
from pneumonia than for deaths from circulatory causes !

--------------------------------------------------------
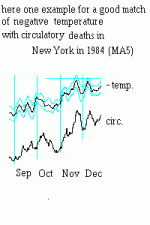
below one short example for a nice match, it's not always that good,
as you can see from the larger attached picture.

attachment.php


the match seems usually to be better in the fall than in the spring.
Summer data is screwed by heat-waves and winter data by flu-waves.
I can also see the match with pneumonia deaths with the greater
lag of ~17 days, but it's less evident, the non-matching instances
or more frequent.
Other factors may contribute. weather at day/night (I only have max,min,mean per day)
holidays,weekend,humidity,wind, dust,nutrition, traveling, work, sleep, insects,
other viruses,bacteria,mold,pollen,

and i.e. for respiratory deaths, the average lag time between the weather-event and the
death could make the effect less clear. That lagtime could again depend on factors like the above
(hospitalization-data would be better, including those who recover)
 

Attachments

  • wea7288f.gif
    wea7288f.gif
    359.5 KB · Views: 1
  • dayc5k2.gif
    dayc5k2.gif
    3.6 KB · Views: 1
  • wede7.gif
    wede7.gif
    16.3 KB · Views: 1
Re: ancient deaths from cold weather

searching pubmed :

http://www.ncbi.nlm.nih.gov/pubmed/23561027
Uppsala, 1749-1859
Precipitation during spring and autumn was significantly associated with annual mortality
(spring RR 0.982, CI 0.965-1.000; autumn RR 1.018, CI 1.004-1.032, respectively,
per centimetre increase of precipitation).

http://www.ncbi.nlm.nih.gov/pubmed/20437783
Wuhan,2010
Every 10-microg/m3 increase in PM10 daily concentration at lag 0-1 days was associated
with an increase in all-natural mortality of
0.69% for winter, 0.34% for spring, 0.45% for summer, and -0.21% for fall.

http://www.ncbi.nlm.nih.gov/pubmed/17435447
Daily cardiovascular mortality counts from 107 cities in the US National Morbidity and
Mortality Air Pollution Study

In summer 1987 the average increase in cardiovascular deaths due to a 10 degrees F
increase in temperature was 4.7%. By summer 2000, the risk with higher temperature
had disappeared (-0.4%). In contrast, an increase in temperature in fall, winter and spring
was associated with a decrease in deaths, and this decrease remained constant over time.

Daily numbers of deaths in The Netherlands, by cause, were obtained for the period 1979-1987
Cardiovascular mortality peaks before respiratory mortality,

correlation between mortality and daily temperature range [in Japan ? ]

The daily number of deaths from all causes (total deaths and only those occurring in people
aged over 70), as well as those deaths from specific causes (e.g. cardiovascular and
respiratory diseases, malignant tumours and all causes except external ones) occurring
within the city of Valencia

daily counts of health events has been fitted for each city.

lags of up to 3, 5, and 10 days were explored , pollution , Rio,SaoPaulo,Mex.,Santiago

Ozone in the warm season was positively and significantly associated
with daily mortality and mortality for cardiovascular diseases

Daily Time Series: A Study of New York City Data 1987-2000

The data were drawn from the National Morbidity,
Mortality, and Air Pollution Study (NMMAPS)[16], which are
publicly available data through the Health and Air Pollution
Surveillance System website (http://www.ihapss.jhsph.edu),
and, in our case, accessed using the NMMAPS package in the
R statistical environment [17].
> Air pollution and meteorological data for 108 U.S. cities 1987?2000.
but I can't find daily deathcount data
> The NMMAPSdata R package contains daily mortality,
-----------------------------------------
OK, I found and downloaded
http://www.ihapss.jhsph.edu/data/NMMAPS/R/windows/NMMAPSdata_0.4-2.zip
372MB zipped , 398 MB , 214 files , 41 directories after unzipping
biggest files are 108 files with ending "bz2", presumably one file for
each of 108 US-cities, apparently compressed, encoded files.
"The city data frames are stored as compressed R workspace files"
I don't know about R, how to uncompress or convert them ?
----
"bzip2 - algorithm"
http://en.wikipedia.org/wiki/Bzip2
-----
http://bzip.org/downloads.html
Here is the 1.0.6 source tarball ,
[0.8MB, compressed with gzip, 2.6 MB as uncompressed (UNIX-) .tar file
makes 54 files in one directory with extar.exe, long filenames are truncated,
but no two equal short names occurred, one makefile is encluded, but it has
219 lines --> very tedious to convert so it runs in my compiler ]

Nowadays bzip2 ships as standard on many Unix / Linux systems.
If you're using one of those, it is worth checking if it is already installed,
or is present on the installation media.
No executables for 1.0.6 are yet available.
[If you have an ANSI C compiler, you have a very good chance of building a working
executable from the sources with minimal difficulty

hmm, maybe Windows executables are available for earlier versions ?
but apparently not on the bzip webpage
--googling...
http://gnuwin32.sourceforge.net/packages/bzip2.htm
gzip file, unzipping gives a .bin subdirectory which has (among others)
files bzip2.exe and a bzip2.dll and bunzip2.exe created 2008/03/20
with 38400,69120,38400 bytes respectively.
but " this program cannot be run in DOS-mode"
http://www.knownfile.com/de-de/file...-datei-herunterladen-entfernen-deinstallieren
trying to download ... failed ...
running bunzip2 above in windows-xp-commandline works ,
bunzip2 -d *.bz2
decompresses, ~ 10-20sec per file
creates 108 files xxxx_r~1.out , 36MB each , 3.9GB in total but they are still somehow encoded :-(
this could be the "R"- format , how to decode/convert it into normal format ?
I don"t want to install "R", which I predict would take more hours
> mailing list https://stat.ethz.ch/mailman/listinfo/r-help

.
the whole process took me ~3 hours so far
---------------------------------------
peeking inside the R-encoded 36MB files shows strings
"accident,copd,cvd,death,inf,pneinf,pneu,resp"
that looks promising, lets me speculate that they really have,
although R-encoded, daily counts for 108 big US-cities 1987-2000 for deaths from
accidents,chronic pulmonary obstructive disease,cardiovascular disease,
influenza,pneumonia,respiratory causes ?!?
plus daily data for some pollution and metereological parameters and
-----------------------------------------
OK, I think I converted it now. Took me ~10-20 hours so far.
Also rearranged. I have 108 cities, 321 parameters, (24 of those from 8 death-counts and 3 agegroups?)
5114 days (1987-2000) ~ 177M numbers , 1598MB uncompressed, 234MB when compressed with gzip,
82MB with 7zip.
Looks good/promising. Certainly lots of collected data.
CDC,NCHS,wiki,FT,... should link to it , they should provide the 85MB file
to save others the trouble with converting/rearranging.
---------------------------------------------
http://www.ncbi.nlm.nih.gov/pubmed/15547165?dopt=Abstract
A 10-ppb increase in the previous week's ozone was associated with a 0.52% increase
in daily mortality and a 0.64% increase in cardiovascular and respiratory mortality
[is it because of the ozone or because ozone correlates with temperature ? ]

average particulate pollution effect across the 90 largest U.S. cities
0.27% increase in daily mortality per 10 micrograms per cubic meter of PM10

there is strong evidence of an association between acute exposure to particulate
air pollution (PM10) and daily mortality, one day later;
this association is strongest for respiratory and cardiovascular causes of death;
this association can not be attributed to other pollutants
including NO2, CO, SO2 or O3 not to weather.
--------------------------------------------------------
Particulate matter and especially small particles
with a diameter less than 2.5 micrometres (PM2.5)
are associated with increased mortality, especially
from cardiovascular and cardiopulmonary
diseases. A WHO evaluation 2004 found that
air pollution was responsible for approximately
100 000 deaths and 725 000 years of lost life
(DALYs) each year in a selection of European
cities within the WHO European region. The
more recent estimates of the impact of air
pollution made in the European Commission
'Clean air for Europe' (CAFE) programme
found that in the EU about 350 000 people
died prematurely in 2000 due to the outdoor
air pollution caused by fine particulate matter
(PM2.5) alone. This corresponds to an average loss
of life expectancy of about 9 months for every EU
citizen

In addition, current levels of ozone have severe
health implications, such as bringing forward the
deaths of more than 20 000 people per year.

---------------------------------------------------------
weather-data by year:
ftp://ftp.ncdc.noaa.gov/pub/data/ghcn/daily/by_year/
-----------------------------------------------------------
http://www.ncbi.nlm.nih.gov/pubmed/24628000
Kaohsiung, Taiwan , 2006-2008
no significant effects were found between PM2.5 and frequency of daily mortality
on warm days (≥25?C). On cool days, PM2.5 showed significant correlation with
increased risk of mortality rate for all causes and circulatory diseases
------------------------------------------
http://www.ncbi.nlm.nih.gov/pubmed/24322399
All air pollutants had significant effects on years of life lost
-----------------------------------------------
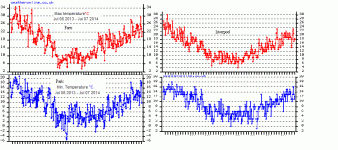
http://www.ncbi.nlm.nih.gov/pubmed/23870087
Cold temperatures were strongly associated with higher mortality with lagged effects
persisting up to 3 weeks in Hong Kong and 2 weeks in Taipei. Cold effects were much
stronger for deaths among older people and non-cancer deaths. Prolonged cold spells
modestly but significantly raised mortality after accounting for the effects of individual
cold days. Higher daily ozone levels were also strongly associated with higher short-term
mortality in Taipei and Hong Kong, while relative humidity and solar radiation were weakly
and inconsistently associated with mortality.
=--------------------------------------------------------------------------------
http://www.ncbi.nlm.nih.gov/pubmed/23734179
largest seasonal mortality amplitudes found in the southwestern United States and the
smallest in the North, along with South Florida. In addition, there were strong intra-regional
similarities that exist among the examined cities, implying that environmental factors are
more important than social factors in determining seasonal mortality response
--------------------------------------------------------------------------------

Mortality begins to increase steadily in early Septem-
ber, flattens out from mid-October through mid-November, and
then increases rapidly until the first week of January.
Some cities exhibit an interesting two-step rise in
mortality throughout the fall, and this is evident in the mortality
curves of Minneapolis and Detroit
--------------------------------------------------------------------------
RESULTS:
The September asthma hospitalization epidemic peak occurred in school-age children
each year on average 17.7 (95% CI, 16.8-18.5) days after Labor Day. Similar epidemics
of lesser magnitude were observed in preschool children peaking 1.7 (95% CI, 0.9-2.5; P<.001)
days later, and in adults 6.3 (95% CI, 4.7-7.9; P<.001) days later than in school-age children.
The epidemics peaked 4.2 (95% CI, 1.2-7.1; P<.001) days earlier in school-age children in
northernmost compared with southernmost latitudes.
CONCLUSION:
September epidemics of asthma hospitalizations in Canada have a precise relationship
to school return after the summer vacation. It may be speculated that school-age children
transmit the agents responsible for the epidemic to adults. Measures to improve asthma
control and reduce transmission of infections should be directed at children with asthma
before school return.
------------------------------------------------------------------------------
There is a characteristic increase in asthma exacerbations and admissions in September
in the pediatric age group. This phenomenon might be explained by the increased exposure
to respiratory viruses, to new allergen exposure in school or kindergarten,
------------------------------------------------------------------------------------
Human rhinovirus (HRV) accounts for a significant portion of common-cold illness,
with the peak incidence being in the early fall. Three hundred forty-six adults who
had self-diagnosed colds of 48 h or less were enrolled in a study during
September and October 1994
------------------------------------------------------------------------------------
Although human rhinoviruses were isolated throughout the year in Morioka,Japan,
frequency of HRV infection was significantly higher (p less than 0.001) during the
April-November (233/2853; 8.2%) than during the December-March (47/1481; 5.0%).
There were two peaks of incidence in May (9.5%) and September (9.1%).
-----------------------------------------------------------------------------------
file octo02.gif
 

Attachments

  • cities1.txt
    cities1.txt
    4.7 KB · Views: 2
  • COR2G2.GIF
    COR2G2.GIF
    16.4 KB · Views: 1
Re: ancient deaths from cold weather

as to whether there was influenza in Britain in the years and decades
before 1889, that could have generated the immunity of the elderly
in 1918

----------------------------------------


during the last three years (1874,
1875, 1876), and even up to the present time (September
1877), influenza can scarcely be said to have been wholly
absent from Helensburgh and neighbourhood, although in
this period there have been times of greater prevalence.

https://archive.org/details/glasgowmedicaljo09glas

pages 502-520

the symptoms, does that sound like influenza in
Scotland in 1874-1877, maybe of H1-type,
already producing immunity for 1918 until it
was killed in the 1889-1892 pandemic ?

or maybe just colds, that also explains the relapses
with >200 cold viruses around today

no sudden onset
little fever
no muscle aches etc.

of course, he was totally wrong with his poisened atmosphere,
in retrospective it doesn't make sense and you have to
wonder how people could believe it in 1877


general depression of the vital powers, lassitude, more or less tendency to
shiver, wandering pains, and general soreness; then follows fever of a variable type,
sometimes continued, remittent, or intermittent.
In severe cases there is an inexplainable loss of strength,
quite out of proportion to the duration or degree of the fever,
and considerable mental depression and despondency are
often observed.
great liability to relapse after partial recovery.
In the majority of cases catarrhal symptoms are added
The duration of an epidemic of influenza is usually about six weeks.
spring and fall (typical for colds)
My impression is that in the recent influenza
there was a very large number of such cases.
that influenza is somewhat . infectious.

After more or less feeling of unaccountable
lassitude and unwellness some feverish symptoms arose, ac-
companied by a sensation of burning heat of the surface of
the body, especially of the palms of the hands.
The sensation of burning heat was much in excess
of the real increase of temperature. Tliis symptom was observed in
most of the cases, and was decidedly characteristic of the
onset of influenza. Further, most of these patients were
unaAvare of "taking cold " or of being exposed to its
ordinary causes.The actual rise of temperature was not
great, and the pulse was only moderately accelerated.
The fevevishness continued with irregular remissions (sometimes
alternated by perspirations) for two or three days and then
subsided, leaving the patient considerably more affected in
strength than he had expected.Now, as to the catarrhal
symptoms, they were almost always present to some extent.
They varied considerably as to situation, but seemed attracted
to one part or another according to the patient's predispositions.
(a.) Frontal headache ; stuffing of the nose ; fits of sneezing
occurred, but were not very common.
(b,) Sore-throat,or what may be called more exactly
pharyngeal catarrh, was much more frequent.
The patient complained of some sore-throat (usually slight) ;of a raw,
dry, muffled feeling in the throat. On examination, the mucous
membrane on the back of the pharynx was seen to be red
and somewhat swollen, usually in irregular elevated patches.
It was sometimes smooth and glazy, at other times covered
with adherent mucus of a stringy, whitish character.
The arch of the soft palate sometimes partook of the redness,
but except in those subject to quinsy the tonsils were rarely
affected. A good many patients complained of great pain
in the throat When nothing more was visible to account for
pain than what has been described.This, as well as the
fact that the pain intermitted, showed that it was a neuralgia
of the throat. Curiously it was not rare to have similar pain
complained of across the back of the neck.
(c.) One of the most common, and certainly the most
distressing seat of catarrh was near the top of the Wind pipe,
giving rise to a severe cough of a tickling spasmodic
character. Patients so affected were liable to severe
paroxysms of coughing, which lasted with scarcely any intermission
for fifteen or twenty minutes or even longer until they were quite exhausted.
Two or three hours might then elapse without any coughing at all.
The paroxysms were usually most severe and persistent about four or five o'clock
in the morning.There was usually very little expectoration, but often the paroxysm
seemed to end with the dislodgement of a small piece of tenaceous mucus which may
have been adhering about the glottis.
(d.) Bronchial catarrh was not common except in those
previously the subjects of disease of the chest.In several
of the latter the influenza proved fatal.I shall refer again to
these cases under the heading of Complicated Influenza. The
general and the catarrhal symptoms made their appearance
nearly at the same time; sometimes the one, sometimes the
other class of symptoms had the precedence.In the class
of cases I am now describing, the catarrhal symptoms some-
what outlived the febrile, but it was quite remarkable how
suddenly both sets of symptoms abated, and how soon there-
after the patient felt well, excepting the debility
.
 
Re: ancient deaths from cold weather

searching British Medical Journal for influenza 1862-1888

1875: To add to our miseries, a severe epidemic of influenza has been passing over the town for some time past, not adding materially to the loss of life
1873: autumn and spring. It appears also during the prevalenice of contagious catarrhs, corresponding, I imagine, with our term influenza; and it is frequently under the form of the peripneumonia notha that these catarrhs prove fatal to elderly people
1873: principally amonigst children. Influenza has been general, but not severe
1872: ...immediately informed by Government of the prevalence of scarlatina at Plymouth; or to that of Bangor to know that measles or influenza had broken out at Dover
Feb.1870: Mr. Disraeli, who has been labouring under an attack of the prevailing influenza
1866: During the prevalence of influenza and of cholera in the city of Bristol
Feb.1864: increase of nearly forty on the deaths of the preceding week. Medical men in large practice affirm that the number of cases of influenza at pre- sent far exceeds that at any period which they can remember. For the last few months there have been a great many
1863:Of diseases, influenza and catarrh take the lead, being 20 per cent. of the whole.
1863: The cough attending influenza in -children is very much like whooping-couah
Feb.1866: 8 Influenza complicated...subjects, or during the prevalence of influenza. Some of the cases which I returned...in certain cases. Under the head of influenza, there are nine deaths, chiefly in...
1882: ...sixth volume we find a report upon " Influenza, or Epidemic Catarrh," which appeared...the fall of temperature and the rise of influenza. But the supposed influences are shown...generally accepted as true, viz., that the influenza was the resuIt of a sud(len extensive...
1881: orrespondence
The Rugby Outbreak of Sore-Throat in March, 1880 Clement Dukes
1881: "endemic influenza", afflicted many persons on the Gareloch...and subject to this peculiar endemic influenza. The local authorities of these towns...no cases of the so-called "endemic influenza" were discoverable by the committee...
1884: Although no deaths happened, about fiftycases were sufficiently...especially in adilts,' presented the marked characteristics of influenza, without any appearance of rash.
1882: in the district, ar d influenza is prevalent
1881: He states that an endemic of influenza is prevalent in the town and neighbourhood
1873: district of Grand Port and Savanne. Influenza caused many deaths
1887: there has been no bad result, not even influenza as an epi- demic, which one might have expected
1885: He had long suflered more or less from asthma and gout l and the influenza now prevalent finally exhausted his remaining strength.
1884: About a year preceding the cholera, there was a genieral attack of influenza, a
1883:SCOTLAND. THERE is at present rife at Paisley, amongst horses, a very bad type of influenza, popularly known as "pink eye." The affection renders the animals weak a few hours after they.are attacked
1882: A series of questions having been issued by the Council respecting the spread of the late epidemic of influenza, a
1881: presence of a very fatal and prevalent form of influenza in some of these watering- places is ascribed to the existence of sewage in the mud on the shores.
Oct.1880 and of influenza, 147 cases
1880: an epidemic -of influenza which occurred at the breaking up of the severe frost in March I879, and affected upwards of fifty persons
1879: The low temperature alone will not account for this excess, which may probably be due to influenza that has not been recognised by the in- formants. At Greenwich the mean temperature of the week was 2.2 degrees above...


May-Sep. 1883
And even in these boys the influenza was the primary disease, and in the majority of cases
the only one.The epidemie would thus he more correctly designated "influenza" or"epidemic
catarrh," to which the subsequent pneumonia would, perhaps, hold an analogous relationship
to that held by nephritis or acute rheumatism to scarlet fever, etc.
informed by Dr.Mackenzie,Uist,late of Broadford, Isle of Skye,[Scotland] that, during the end of 1882 and the
first two months of 1883, that is, previous to the outbreak here, an epidemic of influenza spread
all over that island.Thereafter,he attended nearly thirty cases of acute pneumonia, all following, though
---------------------
every yearly issue has > 1000 pages with <10 hits for influenza in these years
----------------------------------------------------------------------------------
1884: THE ILLNESS OF THE PRIME MINISTER
Mr. Gladstone is steadily, but somewhat slowly, recovering from the
attack of bronchial and laryngeal catarrh under which he has recently
laboured.The general depression of the system which these maladies
can produce, especially in old people, is well known; and when it is
remembered that Mr. Gladstone is seventy-five, it is not surprising to
learn that the depression in his case has been very considerable, and
has been accompanied by a good deal of neuralgia ; the symptoms,
indeed, seem t« have pointed to the probability that Mr. Gladstone has
been suffering from an attack of genuine influenza—an opinion which
finds material confirmation in the large number of other similar cases
of illness which have been recently noted.
--------------------------------------------------------------------------
at the end of 1882, we had here a large number of cases, (sore throat,influenza ?)
which caused a semi-panic in the town.On investigation, the milk
supply to the various cases was found to come from every dairy in the neighbour-
hood; the largest dairy naturally supplying the largest number of suffering
households. Every cow of the various milk-supplies was examined,
all found healthy. E. M. SniRXLiFF, Medical Officer of ;Health.
Kingston-on-Thames.
-----------------------------------------------------------------------------------
Hendersen, Helenburgh
the air of the locality is,
to a certain degree, contaminated by the emanations .arising from the ad-
joining shores
for a series of years a form of illness, dis-
tinguished by certain pecvdiarities, has been constantly prevalent in the
locality.
after a longer interval than in my cases, attacks of influenza.
------------------------------------------------------------------------
Jan.16,1875,Edinburgh
...The mortality of the city, which was 38.43 per 1000 of estimated population last week,
has risen to 44.25 in the week just ended, and is still attributable almost entirely to the
very unusual prevalence of chest diseases, induced by the severe weather from which we
have lately been suffering.
To add to our miseries, a severe epidemic of influenza has been passmg over the town for
some time past, not adding materially to the loss of life, but affecting health and comfort
very considerably. From fever generally the deaths are 35 out of a total of 175 deaths
from all causes—this includes 15 from scarlatina, and 5 from diphtheria.

--------------------------------------
Mar.20,1875
CLINICAL MEMORANDA. EPIDEMIC JAUNDICE.
In common with many parts of England, we have had influenza at Stamford to a very great
extent since last October. During the progress of the malady, it has been interesting to
notice how much catarrhal inflammation of the various mucous membranes has prevailed.
In the epidemic, one of the most curious facts was acute jaundice in children.
I had fifteen cases in my own practice, in children under 10 years of age,
during November and December last,, and I heard of others.
The digestive tract of mucous membrane was nearly as much affected by the
influenza as the respiratory tract, mucous diarrhoea being most common.
There can be no doubt that the jaundice was caused by catarrh of the bile-ducts.
The disease set in soon after the intense chill; there was often shivering at the
commencement of the influenza. The disease was analogous to the jaundice one
sees associated with ague in the adult, and which one regards as depending upon
active congestion of the liver.Unlike jaundice connected with agne, the jaundice of my cases
was more amenable to treatment. No case lasted more than three weeks.
The recovery was perfect. Epidemics of jaundice are rather unfrequent, and, when they do happen,
it is well to record them for future reference.
In Mr.Simon's Sixth Annual Report to the Privy Council, there is an interesting account by
Dr. Ord of an epidemic of 2,300 cases at Rotherham in 1863.
J.M. Heward, Medical Officer of Health, Stamford.
------------------------------------------------
Mercatus asserts that before the beginning of autumn, in the year 1557,influenza attacked
all parts of Spain at once, so that the greatest part of the population in that kingdom were seized with the disease almost on the same day.At St. Petersburg, in the epidemic of 17S2, Maertens says that on a cold
night the thermometer rose 30 dcg. Fahrenheit, and next morning 40,000 people were taken ill with the
influenza. We can readily imagine what serious consequences might possibly attend outbreaks of
sickness such as these, although they would not necessarily leave their mark upon the statistics
of mortalily.
------------------------------------------------------------------------------------------------------
The effects of the severe winter are still [Feb.14,1880] being felt in France, if one may judge from
the mortuary reports published weekly by the Prefect of Police.
In Paris, the population of which is now a little over 2,000,000, the mortality for the week ending
February 5th 1880 has been 1,619, Of 346 more than the preceding week, the average for the
corresponding period for the three previous years being 1,007; and yet it cannot be said that
there is any actual epidemic in this city. The bulk of the mortality seems to have been caused,
as is usual in this season, by pulmonary affections, that from phthisis alone amounting to 233,
pneumonia to 190, and acute bronchitis to 116. There is an affection which has prevailed to a
great extent in Paris, and to me hitherto undescribed and undescribable.
The French call it "la grippe", and the English influenza, but it is neither the one nor the other.
It seems to me to be something between an ordinary "cold", which the French call "rhume",
and influenza; for the symptoms do not present the gravity of the latter, and yet they are more
severe than those of common catarrh.
There is no fever present, but the malady is characterised by great prostration of strength,
accompanied with a severe and trouble-some cough, with a frothy expectoration more
or less viscid, but never purulent or even mucopurulent. Influenza frequently prevails as
an epidemic, and is essentially a contagious disease; that is, it is the result of a
specific.disease-poison propagated by contagia emanating from the patient,
whereas the affection under notice is a special, but not a specific, one; and though
it prevails in an epidemic form, it is neither contagious nor the result of a specific poison.
It is simply a seasonal affection, never fatal unless complications occur, and drugs seem
to have little or no influence over it.
It runs an indefinite course, and is cured spontaneously.
This affection never, of course, appeared in the mortuari returns, but I observe by last week's
report, that "grippe" has been included, the number of deaths being two.There has been a marked
increase in the number of deaths from typhoid fever and small-pox', that from the
former amounting to 101, and the latter to 72; the mortality from these two affections in the
previous week having been 30 and 56 respectively;
the average for the corresponding week of the three preceding years
having been 23 for typhoid fever and only 3 for small-pox.
With these momentary exceptions, Paris may, in a sanitary point of view, compare with any other
city in the world, and were it not for the defectiveness of its sewage arrangements,
might be looked upon as a model city for salularity as it is for many other things.
---------------------------------------------------------------------------------------------
Dr. Campbell reports that the health of the Cumberland and Westmorland Lunatic Asylum
has been good, with the exception of an epidemic of influenza which occurred at the
breaking up of the severe frost in March 1879, and affected upwards of fifty persons.
----------------------------------------------------------------------------------------------
 
Re: ancient deaths from cold weather

temperature patterns UK and NY

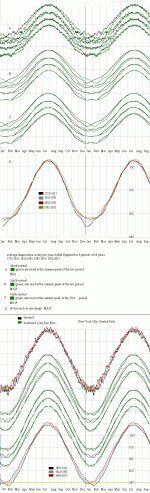
the max. of yearly temperature in in late July and the min in late January.
[yearly range: England:3C-17C (=37F-63F,NY:0C-24C (= 32F-75F) ]

But increase and decrease is not entirely symmetric on these axes.
In UK it decreases faster in November and increases faster in March than
it should.
In NY it decreases faster in December increases faster in midFeb-midMar
and midApr-endApr. But this changed in NY in the last 60 years.
Typical for NY (and thus probably the whole NE-USA) is a small
extra-peak in midJan
[well, England also has it since 1950]

The data is from the NOAA webpage, there could be errors -
I should check this with other locations.
USA daily temperature recording started at about 1880, midEngland
started in 1772, Milan,Bologna,Praha at ~1800

the temperature patterns should have some effect on the mortality
distribution over the year, i.e. deaths from pneumonia and heart-attack


attachment.php
 

Attachments

  • temp01.gif
    temp01.gif
    86 KB · Views: 1
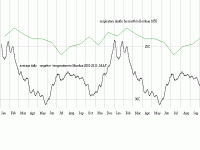
Re: ancient deaths from cold weather

this is interesting ... Mumbai lies below the Northern [Wendekreis]
so they have two hot seasons per year (spring,fall),
one big colder one (winter) and one smaller colder one ("summer")

but still respiratory deaths don't go up in summer but rather
go down even more


data from Morehead, Trans. Bombay Med. Soc. 1855


can we have monthly respiratory deaths from
Chennai(Madras),Bangalore,SriLanka,Bangkok,Manila,Nigeria

----------------------------------------------------------
1924 , 1855-1904 , London and four Scottish cities, monthly
correlation of pneumonia deaths with temperature in adults, but not children
http://europepmc.org/articles/PMC2167531/pdf/jhyg00270-0045.pdf

===========================================
Goldsmith and Perkins: The data are from the city of
Chicago in the USA and give the seasonal variations in
crude mortality from 1867 to 1925.
http://archive.samj.org.za/1978 VOL... AND DISEASE, C.H.Wyndham, S.A.Fellingham.pdf


The number of deaths in White males and females over
the age of 40 years for each month of the year for the
years 1968, 1969 and 1971 in Johannesburg and Durban
were abstracted from the magnetic tape mortality records
of the Department of Statistics

in 1978
Johannesburg (cold) had greater seasonality than Durban(warm)

---------------------------------------------------------
 

Attachments

  • mum7.gif
    mum7.gif
    12 KB · Views: 1
Re: ancient deaths from cold weather

deaths by cause, sex and age for England & Wales 1848-1900 SN5705 in computer-readable form

http://www.geog.cam.ac.uk/research/projects/longrundeathcauses/


no google-hits for
Long-run cause of death series for national populations
except at that cambridge pages, so am I the first outside Cambridge who finds this and wants to use it ?

[seems that google has not grasped this very post yet]

the data are apparently at :

> The UK's largest collection of digital research data in the social sciences and humanities

http://www.data-archive.ac.uk/sign-up/credentials-application

but they have a lengthy and complicated registration and access policy
with many terms and conditions.
and maybe an "organization" is required, I'm not sure.
Does FT qualify as organization ?

ok, I'm trying ... let's see whether I will get access ...


they also have Scotland-deaths, 1855-1949
the counts are grouped in 862671 lines , 95 years, non uniform over the years
991 different causes in total, 42 different agegroups
1918 has 5226 lines : 13 agegroups,2 sexes, 201 causes
 

Attachments

  • 1640W1.GIF
    1640W1.GIF
    14.9 KB · Views: 1
Re: ancient deaths from cold weather

1640-1646 from the "bills of mortality"
https://archive.org/details/collectionyearl00hebegoog
Mortality of the Metropolis. - London, Treuttel, W?rtzo & Richter 1832 (Google eBook)


if you ignore the plague-deaths, you can see a little seasonality,
how deathcounts decline a bit Jan-->June before the summer-infections
set in. I don't have weekly weather data for London, 1640-1646

the first death from heart disease was noted in 1797,
I couldn't find pneumonia before 1840,
~ 0.5% of all deaths were attributed to "apoplexy" or
"sudden death" in 18th century which was probably similar
to cerebrovascular disease = stroke.

promille of deaths from agegroups
0-1,2-4,5-9,10-19,20-29,30-39,40-49,50-59,60-69,70-79,80-89,90-99
were: 370,90,33,30,75,93,93,78,66,44,23,6


attachment.php


historical context: http://en.wikipedia.org/wiki/English_Civil_War
~50000 deaths = 1% of the population in ~10 years

data:
1640,all,Dec.26
143,172,184,178,181,220,213,217,257,222,233,263,232,236
247,231,208,219,239,212,219,219,193,224,238,236,207
213,209,225,250,237,266,296,320,336,343,331,331,332
314,314,294,260,246,210,240,228,224,220,219,271
1640,plague,Dec.27-Dec.19
4,8,2,2,1,0,1,3,1,1,3,3,4,4
3,1,4,2,3,5,6,13,10,19,34,15,25
26,26,30,41,52,68,81,98,89,98,105,98,94
69,63,55,42,24,17,33,23,13,9,6,10
1641,all,Dec.26-
374,322,220,194,222,218,214,235,219,259,232,242,233,234
226,272,229,267,225,241,254,234,245,289,300,268,256
305,304,311,376,458,467,507,558,610,703,659,652,660
630,654,604,518,464,408,337,316,296,279,245,246
1641,plague,Dec.27-Dec.19
3,3,4,5,3,2,6,5,3,2,2,3,3,8
5,4,7,7,12,13,11,16,27,20,19,15,33
28,12,56,74,100,80,131,139,183,185,197,239,204
239,234,184,144,106,79,61,44,41,15,17,15
1642,all,Dec.26-
208,267,253,202,208,234,214,250,187,231,239,232,214,219
204,213,190,205,239,241,230,245,217,211,208,202,178
164,163,165,170,187,185,224,224,236,227,274,279,351
362,331,281,315,275,275,232,303,256,250,250,247
1642,plague,Dec.26-
51,26,11,14,31,29,23,14,26,17,18,5,13,17
23,20,22,20,21,29,25,27,37,25,23,14,15
18,24,24,29,30,48,48,58,60,79,66,103,126
83,81,98,51,51,37,46,13,19,18,12,10
1643,all,Dec.26-
267,199,248,248,273,257,234,265,216,244,231,264,211,224
218,212,203,247,250,233,223,249,217,211,243,208,205
219,209,229,230,214,218,285,295,308,285,313,302,328
318,354,314,344,387,309,261,272,238,227,232,211
1643,plague,Dec.27-
8,10,11,11,8,11,8,1,2,4,8,3,2,9
9,6,7,5,9,13,15,3,3,3,2,2,3
4,9,7,11,8,27,24,26,28,31,52,61,51
73,59,67,73,59,56,27,14,14,14,15,25
1644,all,Dec.27-
176,194,192,199,216,213,176,216,189,197,203,171,194,158
170,189,156,175,183,191,211,224,198,155,163,207,225
222,182,198,204,274,215,255,219,237,266,259,231,244
290,231,225,266,228,246,200,164,186,182,168,183
1644,plague,Dec.26-
8,18,10,19,11,7,5,7,16,7,4,7,5,5
8,17,17,17,17,14,27,40,34,24,20,20,29
17,32,40,44,61,48,58,67,67,85,85,66,76
95,58,36,18,23,25,15,4,15,11,2,5e
1645,all,Dec.27-
168,174,202,181,152,171,158,172,166,162,161,166,200,176
182,161,187,172,186,164,160,186,154,152,164,149,146
151,170,214,216,235,242,346,380,406,389,325,359,339
309,328,331,243,261,266,258,223,253,222,234,205
1645,plague,Dec.26-
4,8,1,3,1,5,7,4,5,4,2,4,6,1
8,2,4,6,3,3,4,3,2,2,15,6,13
15,24,26,41,62,74,108,124,142,151,117,107,122
98,114,115,57,63,67,42,17,20,12,13,9
1646,all,Dec.27-
205,217,171,241,200,202,192,188,171,155,170,197,186,158
190,210,204,209,172,186,204,199,221,205,170,225,201
223,235,306,364,341,384,419,472,517,554,444,455,443
322,341,320,293,245,275,200,226,223,224,212,185
1646,plague,Dec.26-
6,2,0,2,0,1,0,5,1,1,5,5,3,5
2,4,8,6,5,6,9,5,5,9,13,22,10
25,28,50,58,82,106,132,195,207,238,149,157,175
114,115,106,67,52,55,27,37,34,32,26,29
 

Attachments

  • popeng.GIF
    popeng.GIF
    9.5 KB · Views: 0
  • ENGLEX1.GIF
    ENGLEX1.GIF
    9.5 KB · Views: 1
Re: ancient deaths from cold weather

Vitamin D deficiency linked to high blood pressure (June 26 2014)
----------------------------------------------------------------
Nov.2012, last 25 years
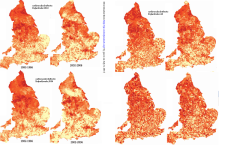
places with the highest death rates [from circ. in UK] were in areas around Manchester and
Liverpool death rates were generally lower in southern England.
death rates from cardiovascular disease have more than halved in England since the 1980s
----------------------------------------------------------------
Higher rates within countries correlate with increasing latitude and decreasing temperature.4
Environmental temperature, rainfall, and socioeconomic variations accounted for 41% of the
inter-town variance in deaths from coronary heart disease in a study in England and Wales
in the 1970s.5
The standardised mortality ratios for two towns differed on average by 7% for
each 1?C temperature difference, while the other two variables had less effect on mortality.
http://www.bmj.com/content/309/6961/1029 (1994)
-----------------------------------------------------------------
[~2000,Finland,Simo Na:yha:]
The association of coronary heart disease with cold varies between
countries, being paradoxically weaker in colder regions of Europe than
in warmer ones (20), and weaker in Canada (colder) than in England
and Wales (milder) (2). In Yakutsk, Siberia, temperatures as low as -
48?C had no effect on coronary mortality (17).
Changes in temperature last-
ing two days or more in Britain are sufficient to cause an increase in
mortality, while no such effect is seen after isolated cold days (8-10).
A
time-lag of 1 to 3 days (9, 14) has been reported to exist between the
temperature change and death, and at least some excess mortality per-
sisted during the subsequent 40 days (14). The long-term seasonal ef-
fect on deaths is believed to be smaller than the short-term effect, pos-
sibly due to a weakening of cardiovascular responses to cold during
repeated exposures (14). The effect of temperature on case-fatality rates
for myocardial infarction is not known, but case-fatality tends to be
worse on cold days (40) or in cold months (18).
The seasonal
amplitude in mortality from heart disease in Finland has diminished
since the 1920?s (32), and the proportion of deaths attributable to the
cold season (September to March vs. August), which was 9% in the
early 1960?s, had diminished to 6% over the subsequent 30 years (35).
-------------------------------------------------------------------------

==============================================
gsgs: (speculating) seems that the body adapts to the average
temperature and then temperature changes induce some
changes in the body too. These are well handled on changes
lasting shorter than 1-2 days (i.e. day-night) , but when it lasts
longer than 2 days, then a new adaption process is being started and
this can cause some problems which increase the risk of death from
cardiovascular causes (until ~1975) or pneumonia (1850-1890)
=================================================

parliv.gif : Liverpool looks "better" to me, so no explanation of the
"French Paradox" here (Ile de France was the French region with lowest
ischemic deaths in ~1980, see the mortality-thread)
 

Attachments

  • ukcv82b.PNG
    ukcv82b.PNG
    322.3 KB · Views: 2
  • parliv.GIF
    parliv.GIF
    22.3 KB · Views: 1
Re: ancient deaths from cold weather

Have just read this thread from the beginning and found it fascinating - thank you gsgs !:applause:
 
Back
Top