

sharon sanders
Editor-in-Chief & President
An update on avian influenza A(H7N9) virus cases in humans: Week 56
As we currently stand (this minute), there are 389 laboratory confirmed human cases of infection including perhaps 122 deaths (31% PFC).
H7N9 cases are mostly noted in older males (Average age 54-years; Wave 1 57-years; Wave 2 53-years) with the major risk being exposure to birds and "poultry markets" (commas because it is not just poultry being sold at these markets). No sustained human-to-human transmission has been noted and no specific vaccine exists although one is coming soon apparently. Oseltamivir or zanamivir are useful antivirals while adamantanes are of no use because H7N9 is resistant. to them. The second wave has peaked but we are still seeing a shoulder off the main peak from Wave 2; smaller numbers of cases each week (no longer occurring every day), often from regions other than those with closed poultry markets or with only recently closed or temporarily closed markets.
<table class="tr-caption-container" style="float: left; margin-right: 1em; text-align: left;" cellpadding="0" cellspacing="0"><tbody> <tr><td style="text-align: center;"> </td></tr> <tr><td class="tr-caption" style="text-align: center;">First chart.
Click on chart to enlarge.</td></tr> </tbody></table> First chart: where is H7N9? It's in Southeast China, most cases having been acquired in Zhejiang province (139/389 cases; 36%) during both Waves of human infection and Guangdong province is currently a very close second place (95/389 cases; 24%).
<table class="tr-caption-container" style="float: right; margin-left: 1em; text-align: right;" cellpadding="0" cellspacing="0"><tbody> <tr><td style="text-align: center;">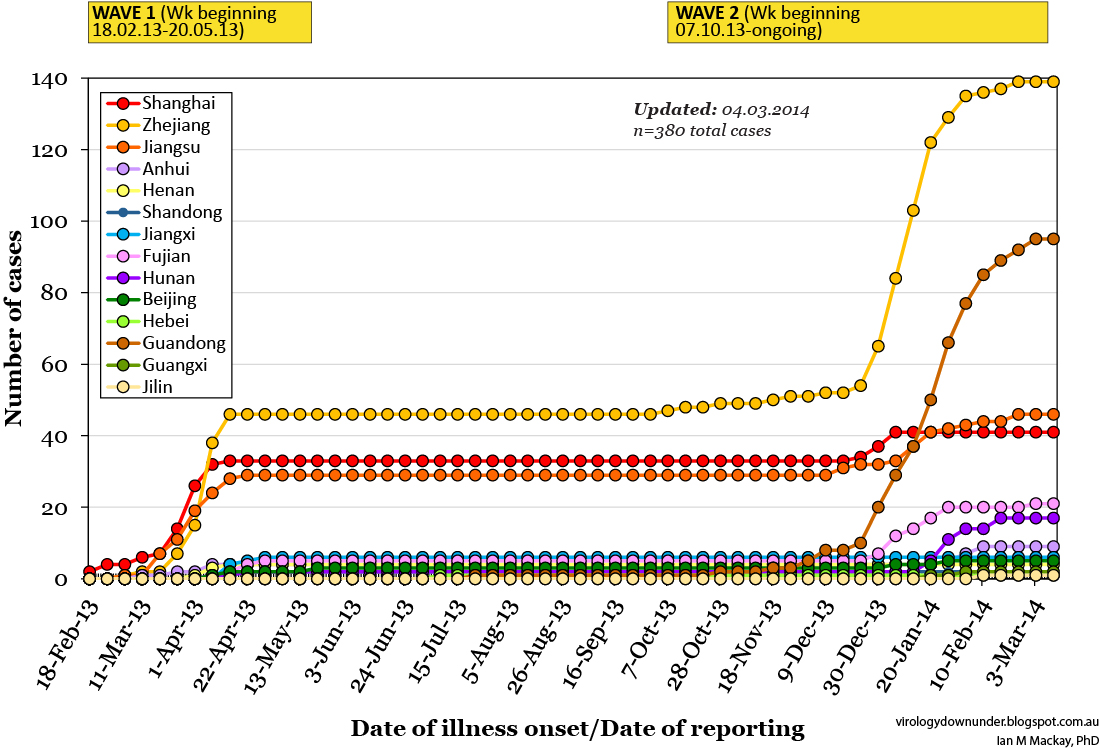 </td></tr> <tr><td class="tr-caption" style="text-align: center;">Second chart.
Click on chart to enlarge.</td></tr> </tbody></table> Second chart: where has H7N9 been focused over time? We can see from this chart that Zhejiang and Guangdong provinces have accrued H7N9 cases most rapidly. While Zhejiang featured in both waves, Guangdong is of Wave 2. It will be interesting to see what happens if there is a Wave 3; without finding and controlling the source of human acquisitions and if the birds with the virus continue to have the virus, I expect we will see future waves.
<table class="tr-caption-container" style="float: left; margin-right: 1em; text-align: left;" cellpadding="0" cellspacing="0"><tbody> <tr><td style="text-align: center;">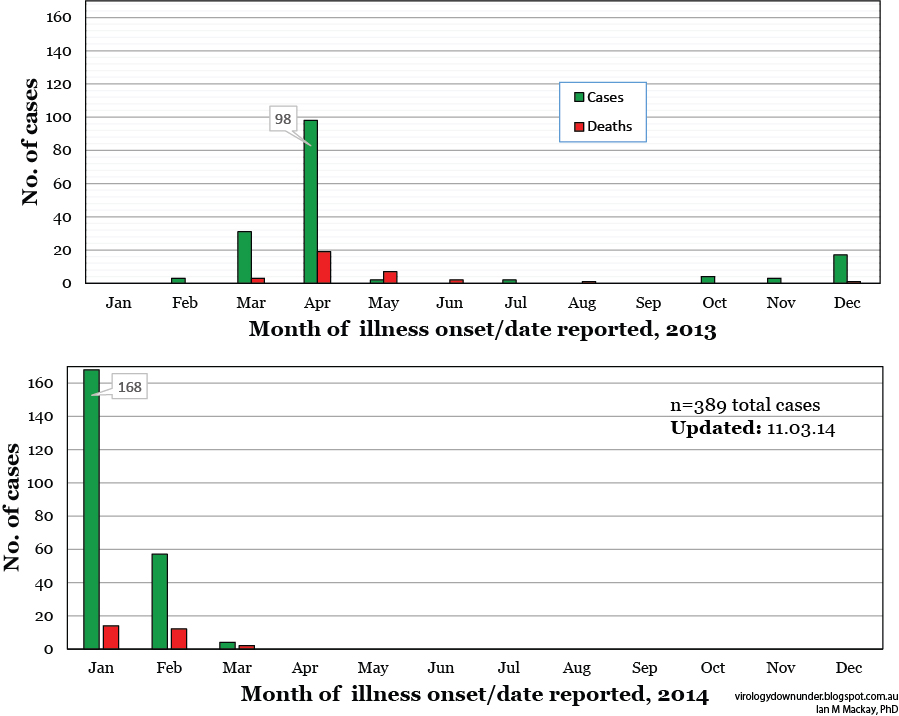 </td></tr> <tr><td class="tr-caption" style="text-align: center;">Third chart.
Click on chart to enlarge.</td></tr> </tbody></table> Third chart: the waves of an outbreak. Wave 1 was 2013 while Wave 2 started in Oct-2013 but really kicked off in Jan-2014. Cases dived in Feb-2014 but there are still sporadic cases being reported each week. The Week (#53) beginning 17-Feb-2014 saw 8 cases followed by 7, 4 and 0 for subsequent weeks. Keeping in mind that there are around 4-12-days (currently averaging 8-days overall) between onset of illness and when a case get confirmed by a laboratory (or reported publicly if no specific lab date is available), we may see a few more cases assigned to the last week of February yet.
<table class="tr-caption-container" style="clear: left; float: right; margin-bottom: 1em; margin-left: 1em; text-align: right;" cellpadding="0" cellspacing="0"><tbody> <tr><td style="text-align: center;">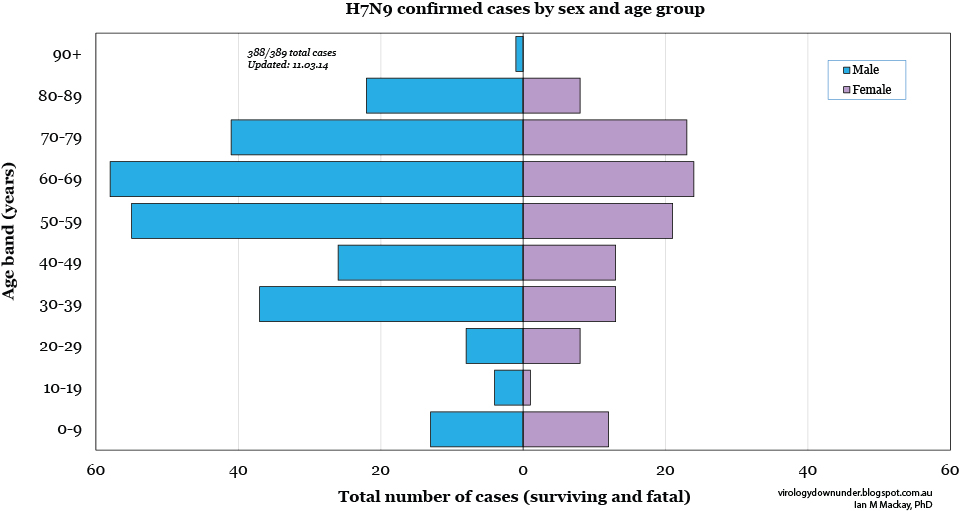 </td></tr> <tr><td class="tr-caption" style="text-align: center;">Fourth chart.
Click on chart to enlarge.</td></tr> </tbody></table> Fourth chart: Age and sex of H7N9 cases. The age pyramid shows a decidedly upside down pyramid indicating that H7N9 disease is one of the older age bands. It also shows that it is a disease of men morseo than women.
<table class="tr-caption-container" style="float: left; margin-right: 1em; text-align: left;" cellpadding="0" cellspacing="0"><tbody> <tr><td style="text-align: center;">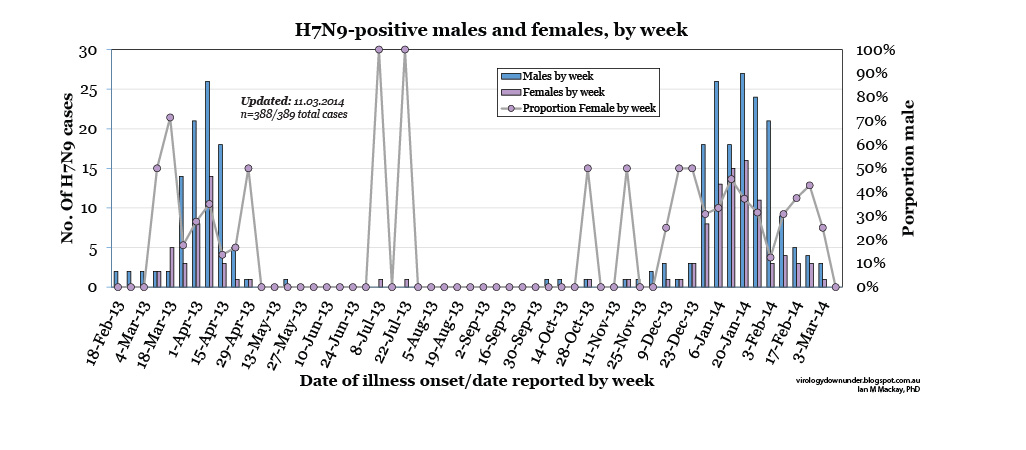 </td></tr> <tr><td class="tr-caption" style="text-align: center;">Fifth chart.
Click on chart to enlarge.</td></tr> </tbody></table> Fifth chart: age by week and proportion female. This is an interesting one. There was a dip in the proportion of female cases for the week the week beginning in 3-Feb (right hand y-axis) which bounced back up a week or two later.
<table class="tr-caption-container" style="float: right; margin-left: 1em; text-align: right;" cellpadding="0" cellspacing="0"><tbody> <tr><td style="text-align: center;">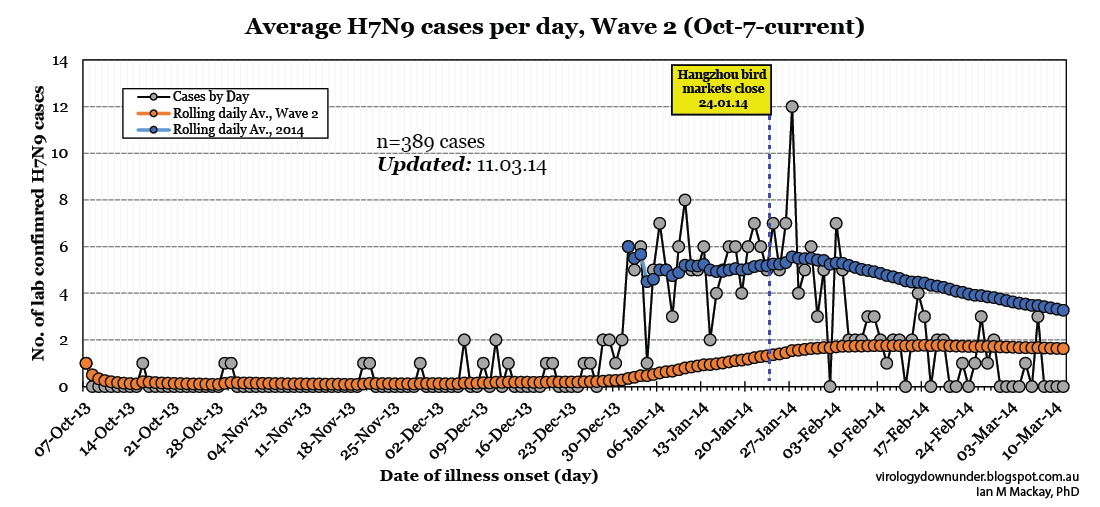 </td></tr> <tr><td class="tr-caption" style="text-align: center;">Sixth chart.
Click on chart to enlarge.</td></tr> </tbody></table> Sixth chart: H7N9 cases per day and the rolling average. The decline in Wave 2 cases continues with multiple recent days recently in which no new cases occurred.
Posted by Ian M Mackay
As we currently stand (this minute), there are 389 laboratory confirmed human cases of infection including perhaps 122 deaths (31% PFC).
H7N9 cases are mostly noted in older males (Average age 54-years; Wave 1 57-years; Wave 2 53-years) with the major risk being exposure to birds and "poultry markets" (commas because it is not just poultry being sold at these markets). No sustained human-to-human transmission has been noted and no specific vaccine exists although one is coming soon apparently. Oseltamivir or zanamivir are useful antivirals while adamantanes are of no use because H7N9 is resistant. to them. The second wave has peaked but we are still seeing a shoulder off the main peak from Wave 2; smaller numbers of cases each week (no longer occurring every day), often from regions other than those with closed poultry markets or with only recently closed or temporarily closed markets.
<table class="tr-caption-container" style="float: left; margin-right: 1em; text-align: left;" cellpadding="0" cellspacing="0"><tbody> <tr><td style="text-align: center;">
</td></tr> <tr><td class="tr-caption" style="text-align: center;">First chart.Click on chart to enlarge.</td></tr> </tbody></table> First chart: where is H7N9? It's in Southeast China, most cases having been acquired in Zhejiang province (139/389 cases; 36%) during both Waves of human infection and Guangdong province is currently a very close second place (95/389 cases; 24%).
<table class="tr-caption-container" style="float: right; margin-left: 1em; text-align: right;" cellpadding="0" cellspacing="0"><tbody> <tr><td style="text-align: center;">
</td></tr> <tr><td class="tr-caption" style="text-align: center;">Second chart.Click on chart to enlarge.</td></tr> </tbody></table> Second chart: where has H7N9 been focused over time? We can see from this chart that Zhejiang and Guangdong provinces have accrued H7N9 cases most rapidly. While Zhejiang featured in both waves, Guangdong is of Wave 2. It will be interesting to see what happens if there is a Wave 3; without finding and controlling the source of human acquisitions and if the birds with the virus continue to have the virus, I expect we will see future waves.
<table class="tr-caption-container" style="float: left; margin-right: 1em; text-align: left;" cellpadding="0" cellspacing="0"><tbody> <tr><td style="text-align: center;">
</td></tr> <tr><td class="tr-caption" style="text-align: center;">Third chart.Click on chart to enlarge.</td></tr> </tbody></table> Third chart: the waves of an outbreak. Wave 1 was 2013 while Wave 2 started in Oct-2013 but really kicked off in Jan-2014. Cases dived in Feb-2014 but there are still sporadic cases being reported each week. The Week (#53) beginning 17-Feb-2014 saw 8 cases followed by 7, 4 and 0 for subsequent weeks. Keeping in mind that there are around 4-12-days (currently averaging 8-days overall) between onset of illness and when a case get confirmed by a laboratory (or reported publicly if no specific lab date is available), we may see a few more cases assigned to the last week of February yet.
<table class="tr-caption-container" style="clear: left; float: right; margin-bottom: 1em; margin-left: 1em; text-align: right;" cellpadding="0" cellspacing="0"><tbody> <tr><td style="text-align: center;">
</td></tr> <tr><td class="tr-caption" style="text-align: center;">Fourth chart.Click on chart to enlarge.</td></tr> </tbody></table> Fourth chart: Age and sex of H7N9 cases. The age pyramid shows a decidedly upside down pyramid indicating that H7N9 disease is one of the older age bands. It also shows that it is a disease of men morseo than women.
<table class="tr-caption-container" style="float: left; margin-right: 1em; text-align: left;" cellpadding="0" cellspacing="0"><tbody> <tr><td style="text-align: center;">
</td></tr> <tr><td class="tr-caption" style="text-align: center;">Fifth chart.Click on chart to enlarge.</td></tr> </tbody></table> Fifth chart: age by week and proportion female. This is an interesting one. There was a dip in the proportion of female cases for the week the week beginning in 3-Feb (right hand y-axis) which bounced back up a week or two later.
<table class="tr-caption-container" style="float: right; margin-left: 1em; text-align: right;" cellpadding="0" cellspacing="0"><tbody> <tr><td style="text-align: center;">
</td></tr> <tr><td class="tr-caption" style="text-align: center;">Sixth chart.Click on chart to enlarge.</td></tr> </tbody></table> Sixth chart: H7N9 cases per day and the rolling average. The decline in Wave 2 cases continues with multiple recent days recently in which no new cases occurred.
Posted by Ian M Mackay