• FluTrackers.com Inc. does not provide medical advice. Information on this web site is collected from various internet resources, and the FluTrackers board of directors makes no warranty to the safety, efficacy, correctness or completeness of the information posted on this site by any author or poster. The information collated here is for instructional and/or discussion purposes only and is NOT intended to diagnose or treat any disease, illness, or other medical condition. Every individual reader or poster should seek advice from their personal physician/healthcare practitioner before considering or using any interventions that are discussed on this website. By continuing to access this website you agree to consult your personal physican before using any interventions posted on this website, and you agree to hold harmless FluTrackers.com Inc., the board of directors, the members, and all authors and posters for any effects from use of any medication, supplement, vitamin or other substance, device, intervention, etc. mentioned in posts on this website, or other internet venues referenced in posts on this website.
  • We are not asking for any donations. Do not donate to any entity who says they are raising funds for us.

Age and gender mortality profileassociated with the 1918-19 influenza pandemic in Kentucky, USA

tetano

Editor, Senior Moderator
J Infect Dis. 2012 Dec 10. [Epub ahead of print]
Age and gender mortality profileassociated with the 1918-19 influenza pandemic in Kentucky, USA.
Viboud C, Eisenstein J, Reid AH, Janczewski TA, Morens DM, Taubenberger JK.
Source

Fogarty International Center.
Abstract

Background. The reasons for the unusual age-specific mortality patterns of the 1918-19influenza pandemic remain unknown. Here we characterize pandemic-related mortality by single year of age in a unique statewide Kentucky datasetand explore breakpoints in the age curves.Methods. Individual death certificates from Kentucky were abstracted by medically-trained personnelfor 1911-1919. Pandemic excess mortality rates were calculated by subtracting observed rates during pandemic months from rates in previous years, separately for each single-year of age group and gender.Results. The age profile of excess mortality risk infall 1918 was characterizedby a maximum in infants, a minimum at ages9-10 yrs, a maximum at ages 24-26 yrs, and a second minimumat ages 56-59 yrs. The excess mortality risk in young adults had been greatly attenuated by winter 1919. The age breakpoints of mortality risk did not differ between males and females.Conclusions. The observed mortality breakpoints in male and female cohorts born in 1859-62, 1892-94, and 1908-9 did not coincide with known dates of historical pandemics. The atypical age mortality patterns of the 1918-19 pandemic cannot be explained by military crowding, war-related factors, or prior immunity alone, and likely result from a combination of unknown factors.

PMID:
23230061
[PubMed - as supplied by publisher]

http://www.ncbi.nlm.nih.gov/pubmed/23230061
 
Re: Age and gender mortality profileassociated with the 1918-19 influenza pandemic in Kentucky, USA

Viboud C, Eisenstein J, Reid AH, Janczewski TA, Morens DM, Taubenberger JK.
concluded in Dec.2012 :

> The atypical age mortality patterns of the 1918-19 pandemic cannot be explained
> by military crowding, war-related factors, or prior immunity alone, and likely result
> from a combination of unknown factors.

after analysing yearly deathrates from 1918 in Kentucky.
But all these statistics had been available and had been analysed
since almost 100 years now and noone earlier had found that ??
No Brevig Mission needed.
Some people are discovering new statistical material from some
new location in the archives and the conclusions from all the data and analyses
for 100 years are now invalid. Amazing.
How long will this new conclusion last ? Another 92 years ?

Why hasn't this been analysed earlier ? They did have all the death-certificates
and they did examine them, i.e. extract the ages and causes of the dying people from
all the death certificates. But then they were assigned to 10-year-groups so the tables
to be published won't get too big. And the exact ages were "forgotten" and the
death certificates thrown away or stored somewhere.
Noone apparently realised in the past 92 years that you need 1-year age-groups to
draw conclusions like the one above. ?!?
And what about all the other places in the world outside Kentucky ?
Many of these do have single-year death data available.
Was this being considered and included in that "conclusion" ?

Now we have these genealogy people who are re-examining the death-certificates
for commercial purposes. Selling it to people who are examining their ancestry,
analysing their DNA. They do have lots of data already, even the names of the
dead people were extracted from the death-certificates in a computer-readable
way and you can get image copies of earch certificate !

But they don't help to solve the 1918 age-pattern mystery. They keep their data
in their genealogy databases. Their data which was collected from death-certificates
owned by the statistics or health departments which were unable to extract
the scientific important data from them earlier. The data needed to make
conclusions like the one above.


And, of course, the data that were used to come to the conclusions
are being kept secret. The access to the whole article with the
reasoning why they came to that conclusion is restricted.
It may not be reprinted and discussed in public here.

--------------------------------------------------------------

Mamelund came to a different conclusion:
http://www.researchgate.net/publica...nfluenza_pandemic/file/d912f50ad171e807d2.pdf
(no date was given in that paper, the newest reference is from 2007)
published March 2011: http://www.ncbi.nlm.nih.gov/pubmed/21420659
did the paper above discuss that ?

--------------------------------------------------------------------

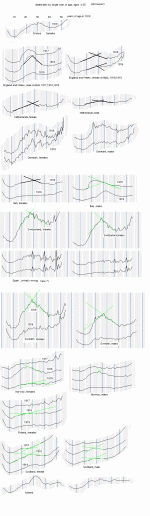
I get peaks in age-distributions from deaths from all causes in 1918:
France: 30 years
England: 28 years
Italy: 31 years
Netherlands: 28 years
Denmark: 28 years

so you were most vulnerable to death in 1918 in most of those countries when born 1890
 
Re: Age and gender mortality profileassociated with the 1918-19 influenza pandemic in Kentucky, USA

HMD has deathrates for single-year-age groups from 1918 for some
countries (why not USA,Germany,France civilian ??)


Human Mortality Database. University of California, Berkeley (USA), and Max Planck Institute
for Demographic Research (Germany). Available at www.mortality.org
or www.humanmortality.de (data downloaded on 2013.03.26f).


I would speculate that in some countries, like Sweden and maybe Kentucky the old (presumably H1Nx)
virus from pre-1890 was still around some years later, maybe even reassorted with the 1890 virus,
and was still infecting the babies. Before it was almost entirely replaced by the new
1890 Russian pandemic virus , presumably H2Nx.
While in other countries, like Italy, the old virus was eradicated early and infants at age <2years
are less likely to get infected.
Maybe they were sent to Kindergarten at age 3 in Italy in 1891 or they were less likely
to be contacted by other people at young age or there just was not much old H1Nx
flu around in Italy in 1887-1890


----------------------------------------------------

without that supposed pre-1891-immunity ... has it been estimated how many deaths
they would have had in 1918 ? Must have been a multiple ... just continue those charts
linearly without the decline at age >28
 

Attachments

  • 01e.gif
    01e.gif
    53.6 KB · Views: 1
Re: Age and gender mortality profileassociated with the 1918-19 influenza pandemic in Kentucky, USA

in the (earlier ?) dateless online version Mamelund concludes:
http://www.researchgate.net/publica...nfluenza_pandemic/file/d912f50ad171e807d2.pdf

Geography May Explain the Adult Mortality from the 1918-20 Influenza Pandemic
,,,,
Results shows that remote, indigenous populations in Alaska,
Labrador, Greenland, Australia and the Pacific, display V or square-root-shaped
age profiles in mortality (i.e. weak or no decline in mortality after age 30), and
therefore they may have been immunologically naïve to the 1918-20 virus. This
finding strongly supports the idea that no or little previous exposure to a H1-like
influenza virus, due to remoteness, may explain mortality pattern of individuals
30-60 years. This may also contribute to explain why some aboriginal villages
experienced extreme mortality levels.
-------------------------------------------------------------------------
while in the Feb. 2011 pubmed abstract we read:
Results show that Arctic and Pacific peoples also experienced a decline in relative
mortality after age 30. However, the remotely living elderly did not have lower than
expected mortality, suggesting that they had less prior exposure to influenza than
their urban counterpart. Crude total mortality and mortality for all adults >30 years
was nevertheless extremely high in the remote populations.
...Low exposure to H1-like viruses in adults could not alone explain the high
total mortality in remote populations (up to 90%). A high concurrent disease load, crowding,
low genetic variability, a lack of basic care, and infrequent exposure to other forms of
influenza virus 1890-1917 may have played a role as well. This form of immunological
cross-protection from previous exposure to A-type influenza viruses other than H1N1
can only be explained as a consequence of cellular immunity against internal proteins
that show less inter-strain variation than the surface proteins.
-----------------------------------------

when I just type in "Mamalund" and "geography" into google, the first hit that
I get is a downloadable pdf. Howeven when I tried to copy the URL of that pdf to here,
then when you click on it you
are redirected to researchgate and asked to join.

according to Science daily, April 2011
http://www.sciencedaily.com/releases/2011/04/110427092049.htm
Mamelund said:

It is not inconceivable that there was a different geographical spread of the virus
in the 1800s and early 1900s, at a time when intercontinental communication
networks were less developed
...No one knows exactly which influenza viruses circulated before 1918. But a leading theory
is that there were H1-like viruses circulating in the period before the last major pandemic,
the Russian pandemic of 1889-90. Some viruses circulating prior to 1889 may therefore
have been related to the virus that caused the Spanish flu in 1918, A (H1N1).
This would mean that some people who were older than 28-30 years in 1918 may have had
some protection against severe infection and death from Spanish flu because of previous
exposure to similar viruses,
...Genetic explanations may also have played a role,
...Secondly, we conclude that without adequate immunological protection for large parts of
the world's population, Spanish flu would probably have claimed many more lives than
the most widely quoted estimate of 50-100 million dead.
...The studies show that models of morbidity and mortality for future pandemics should include
the significance of pre-existing immunity

-----------------------------------------------------------------------------------
 
it's available now: http://jid.oxfordjournals.org/conten...5/721.full.pdf
---------------------------------------------------
[found in http://journals.plos.org/plospathoge...l.ppat.1004615
I discussed that theory earlier in this thread:
]
--------------------------------------------
they have another smaller extremum at age ~70, but I haven't seen that
elsewhere, in other countries/other data, so I assume it's not a real effect
and probably ranom, due to the still small sample size.
------------------------------------------
the use differences in death rates between seasons to plot the excess mortality
while I would prefer to plot quotients of deaths or deathrates for several seasons,
how many % the flu increased their risk of dying. So e.g. infants who were at high
risk anyway didn't see so much increase in % and the quotient curves
(imo more realistically) are not "W"-shaped but more bell-curve-like.
The flu didn't kill by itself but increased the risk in (immunologically) risky cohorts
by a factor. At least for respiratory deaths
---------------------------------------

it would be interesting to include the month of birth, so to see
whether cohorts born shortly before a seasonal wave did better
in 1918 than those born shortly after a seasonal wave.
You can add the years -say- 1870-1890 and plot the
1918-respiratory deaths over the 12 months of birth.

I think the genealogy people do have the data.

----------------------------------
Also, microfilmed US-death certificates (since ~1960 ?) did contain the date of birth
http://freepages.genealogy.rootsweb....arrel_1968.jpg
Although they didn't include it into their digitalized online databases.

But the death certificates may still be available ?! (for USA I estimate 5 cubic meters of paper per year)
500000 certificates for Oct-Dec 1918, each may take 10s. to type in the birth date --> 1500 hours work
or 15hours for a randomized 1% sample ; or microfilmed,--> OCR
[page 1 in the "supplementary material" says:
"The exact dates of birth and death were recorded for all decedents." ]

So we could check this for the pandemic of 1968, whether birth before or after 1889-92 waves
did make a difference for the P+I death risk in Dec.1968 - Jan.1969 in USA.

USA 1918 death certificates also had a field for the exact day of birth
http://jewishgenealogyjourney.blogsp...cate-1918.html

--------------------------------------------

While many hypotheses have been put forward to explain the patterns
of increased risk in young adults and the (relatively) decreased risk
among older individuals in this pandemic, none have been conclusive.

(1) &#147;antigenic recycling&#148; [31],
(2) immunopathogenic host response [8]
(3) increased risk of bacterial superinfection due to aberrant immune
responses mediated by CD8+T cells [37,38]
(4) puberty [41].
(5) uncharacterized synergistic relationship between the 1918&#150;1919 virus
and coinfecting bacteria [6, 7, 42].

------------------------------------------------------------------------------
 
Last edited:
Back
Top Bottom