
• FluTrackers.com Inc. does not provide medical advice. Information on this web site is collected from various internet resources, and the FluTrackers board of directors makes no warranty to the safety, efficacy, correctness or completeness of the information posted on this site by any author or poster. The information collated here is for instructional and/or discussion purposes only and is NOT intended to diagnose or treat any disease, illness, or other medical condition. Every individual reader or poster should seek advice from their personal physician/healthcare practitioner before considering or using any interventions that are discussed on this website. By continuing to access this website you agree to consult your personal physican before using any interventions posted on this website, and you agree to hold harmless FluTrackers.com Inc., the board of directors, the members, and all authors and posters for any effects from use of any medication, supplement, vitamin or other substance, device, intervention, etc. mentioned in posts on this website, or other internet venues referenced in posts on this website.
  • We are not asking for any donations. Do not donate to any entity who says they are raising funds for us.

2019-20 USA Influenza & Pneumonia Mortality Surveillance Data from the National Center for Health Statistics Mortality Surveillance System

Ronan Kelly

Retired 2020
Link to 2018-19 thread: https://flutrackers.com/forum/forum...alth-statistics-mortality-surveillance-system


National Center for Health Statistics (NCHS) mortality surveillance data – NCHS collects death certificate data from state vital statistics offices for all deaths occurring in the United States. Pneumonia and influenza (P&I) deaths are identified based on ICD-10 multiple cause of death codes. NCHS surveillance data are aggregated by the week of death occurrence. To allow for collection of enough data to produce a stable P&I percentage, NCHS surveillance data are released one week after the week of death. The NCHS surveillance data are used to calculate the percent of all deaths occurring in a given week that had pneumonia and/or influenza listed as a cause of death. The P&I percentage for earlier weeks are continually revised and may increase or decrease as new and updated death certificate data are received from the states by NCHS. The P&I percentage is compared to a seasonal baseline of P&I deaths that is calculated using a periodic regression model incorporating a robust regression procedure applied to data from the previous five years. An increase of 1.645 standard deviations above the seasonal baseline of P&I deaths is considered the “epidemic threshold,” i.e., the point at which the observed proportion of deaths attributed to pneumonia or influenza was significantly higher than would be expected at that time of the year in the absence of substantial influenza-related mortality.

Additional pneumonia and influenza mortality data for current and past seasons and by geographic level (national, HHS region, and state) are available on FluView Interactive. Data displayed on the regional and state-level are aggregated by the state of residence of the decedent.
https://www.cdc.gov/flu/weekly/overview.htm#Mortality


Influenza deaths
Week 40: 9
Week 41: 8
Total: 17

Pneumonia deaths
Week 40: 2,071
Week 41: 1,618
Total: 3,689

https://gis.cdc.gov/grasp/fluview/mortality.html

Comparison of influenza death certificates Weeks 40 - 41 with corresponding period from previous years (note figures for 2019-20 are preliminary and are likely to increase)
2019-20: 17
2018-19: 22
2017-18: 34
2016-17: 29
2015-16: 21
2014-15: 14
2013-14: 15
2012-13: 11

Comparison of Pneumonia fatalities Weeks 40-41 with 2018-19 season (note figures for 2019-20 are preliminary and are likely to increase)
2019-20: 3,689
2018-19: 5,835
 
Influenza deaths
Week 40: 11
Week 41: 8
Week 42: 12
Total: 31

Pneumonia deaths
Week 40: 2,260
Week 41: 2,047
Week 42: 1,597
Total: 5,904

https://gis.cdc.gov/grasp/fluview/mortality.html

Comparison of influenza death certificates Weeks 40 - 42 with corresponding period from previous years (note figures for 2019-20 are preliminary and are likely to increase)
2019-20: 31
2018-19: 40
2017-18: 62
2016-17: 36
2015-16: 37
2014-15: 27
2013-14: 26
2012-13: 18

Comparison of Pneumonia fatalities Weeks 40-41 with 2018-19 season (note figures for 2019-20 are preliminary and are likely to increase)
2019-20: 5,904
2018-19: 8,820
 
Influenza deaths
Week 40: 16
Week 41: 12
Week 42: 17
Week 43: 23
Week 44: 17
Total: 85

Pneumonia deaths
Week 40: 2,494
Week 41: 2,492
Week 42: 2,486
Week 43: 2,159
Week 44: 1,534
Total: 11,165

https://gis.cdc.gov/grasp/fluview/mortality.html

Comparison of influenza death certificates Weeks 40 - 44 with corresponding period from previous years (note figures for 2019-20 are preliminary and will increase)
2019-20: 85
2018-19: 89
2017-18: 121
2016-17: 69
2015-16: 74
2014-15: 55
2013-14: 49
2012-13: 27

Comparison of Pneumonia fatalities Weeks 40-44 with 2018-19 season (note figures for 2019-20 are preliminary and will increase)
2019-20: 11,165
2018-19: 14,886
 
Influenza deaths
Week 40: 16
Week 41: 13
Week 42: 17
Week 43: 27
Week 44: 18
Week 45: 14
Total: 105

Pneumonia deaths
Week 40: 2,527
Week 41: 2,551
Week 42: 2,654
Week 43: 2,501
Week 44: 2,053
Week 45: 1,624
Total: 13,910

https://gis.cdc.gov/grasp/fluview/mortality.html

Comparison of influenza death certificates Weeks 40 - 45 with corresponding period from previous years (note figures for 2019-20 are preliminary and will increase)
2019-20: 105
2018-19: 119
2017-18: 166
2016-17: 88
2015-16: 88
2014-15: 66
2013-14: 66
2012-13: 36

Comparison of Pneumonia fatalities Weeks 40-45 with 2018-19 season (note figures for 2019-20 are preliminary and will increase)
2019-20: 13,910
2018-19: 17,906
 
Influenza deaths
Week 40: 16
Week 41: 13
Week 42: 17
Week 43: 29
Week 44: 26
Week 45: 17
Week 46: 16
Total: 134

Pneumonia deaths
Week 40: 2,572
Week 41: 2,602
Week 42: 2,745
Week 43: 2,687
Week 44: 2,409
Week 45: 2,160
Week 46: 1,566
Total: 16,741

https://gis.cdc.gov/grasp/fluview/mortality.html

Comparison of influenza death certificates Weeks 40 - 46 with corresponding period from previous years (note figures for 2019-20 are preliminary and will increase)
2019-20: 134
2018-19: 145
2017-18: 216
2016-17: 95
2015-16: 101
2014-15: 84
2013-14: 81
2012-13: 56

Comparison of Pneumonia fatalities Weeks 40-46 with 2018-19 season (note figures for 2019-20 are preliminary and will increase)
2019-20: 16,741
2018-19: 21,022
 
Influenza deaths
Week 40: 16
Week 41: 13
Week 42: 17
Week 43: 30
Week 44: 29
Week 45: 24
Week 46: 22
Week 47: 18
Total: 169

Pneumonia deaths
Week 40: 2,601
Week 41: 2,644
Week 42: 2,796
Week 43: 2,767
Week 44: 2,557
Week 45: 2,504
Week 46: 2,074
Week 47: 1,396
Total: 19,339

https://gis.cdc.gov/grasp/fluview/mortality.html

Comparison of influenza death certificates Weeks 40 - 47 with corresponding period from previous years (note figures for 2019-20 are preliminary and will increase)
2019-20: 169
2018-19: 176
2017-18: 264
2016-17: 117
2015-16: 115
2014-15: 115
2013-14: 109
2012-13: 75

Comparison of Pneumonia fatalities Weeks 40-47 with 2018-19 season (note figures for 2019-20 are preliminary and will increase)
2019-20: 19,339
2018-19: 24,200

2019-2020 U.S. Flu Season: Preliminary Burden Estimates


Espa?ol

Click image for larger version  Name:	flu estimates.png Views:	0 Size:	71.8 KB ID:	820933


*These estimates are preliminary and based on data from CDC’s weekly influenza surveillance reports summarizing key influenza activity indicators.

On This Page


This web page provides weekly preliminary estimates of the cumulative in-season numbers of flu illnesses, medical visits, hospitalizations, and deaths in the United States. CDC has estimated the burden of flu since 2010 using a mathematical model that is based on observed rates of laboratory-confirmed influenza-associated hospitalizations collected through a surveillance network that covers approximately 8.5% of the U.S. population (~27 million people). Limitations


The estimates of the cumulative burden of seasonal influenza are subject to several limitations.

First, the cumulative rate of laboratory-confirmed influenza-associated hospitalizations reported during the season may be an under-estimate of the rate at the end of the season because of identification and reporting delays.

Second, rates of laboratory-confirmed influenza-associated hospitalizations were adjusted for the frequency of influenza testing and the sensitivity of influenza diagnostic assays. However, data on testing practices during the 2019-2020 season are not available in real-time. CDC used data on testing practices from the past influenza seasons as a proxy. Burden estimates will be updated at a later date when data on contemporary testing practices become available.

Third, estimates of influenza-associated illness and medical visits are based on data from prior seasons, which may not be accurate if the seriousness of illness or patterns of care-seeking have changed. Frequently Asked Questions

What does the cumulative burden of influenza for the 2019-2020 season mean?


The cumulative burden of influenza is an estimate of the number of people who have been sick, seen a healthcare provider, been hospitalized, or died as a result of influenza since October 01, 2018. CDC does not know the exact number of people who have been sick and affected by influenza because influenza is not a reportable disease in most areas of the United States. However, these numbers are estimated using a mathematical model, based on observed rates of laboratory-confirmed influenza-associated hospitalizations. How does CDC estimate the cumulative burden of seasonal influenza?


Preliminary estimates of the cumulative burden of seasonal influenza during the 2019-2020 season in the United States are based on crude rates of laboratory-confirmed influenza-associated hospitalizations, reported through the Influenza Hospitalization Surveillance Network (FluSurv-NET), which were adjusted for the frequency of influenza testing during recent prior seasons and the sensitivity of influenza diagnostic assays. Rates of hospitalization were then multiplied by previously estimated ratio of hospitalizations to symptomatic illnesses, and frequency of seeking medical care to calculate symptomatic illnesses, medical visits, and deaths associated with seasonal influenza, respectively. Why does the estimate of cumulative burden change each week?


The estimates of cumulative burden of seasonal influenza are considered preliminary and may change each week as new laboratory-confirmed influenza-associated hospitalizations are reported to CDC. New reports include both new admissions that have occurred during the reporting week and also patients admitted in previous weeks that have been newly reported to CDC. How does the number of flu hospitalizations estimated so far this season compare with previous end-of-season hospitalization estimates?


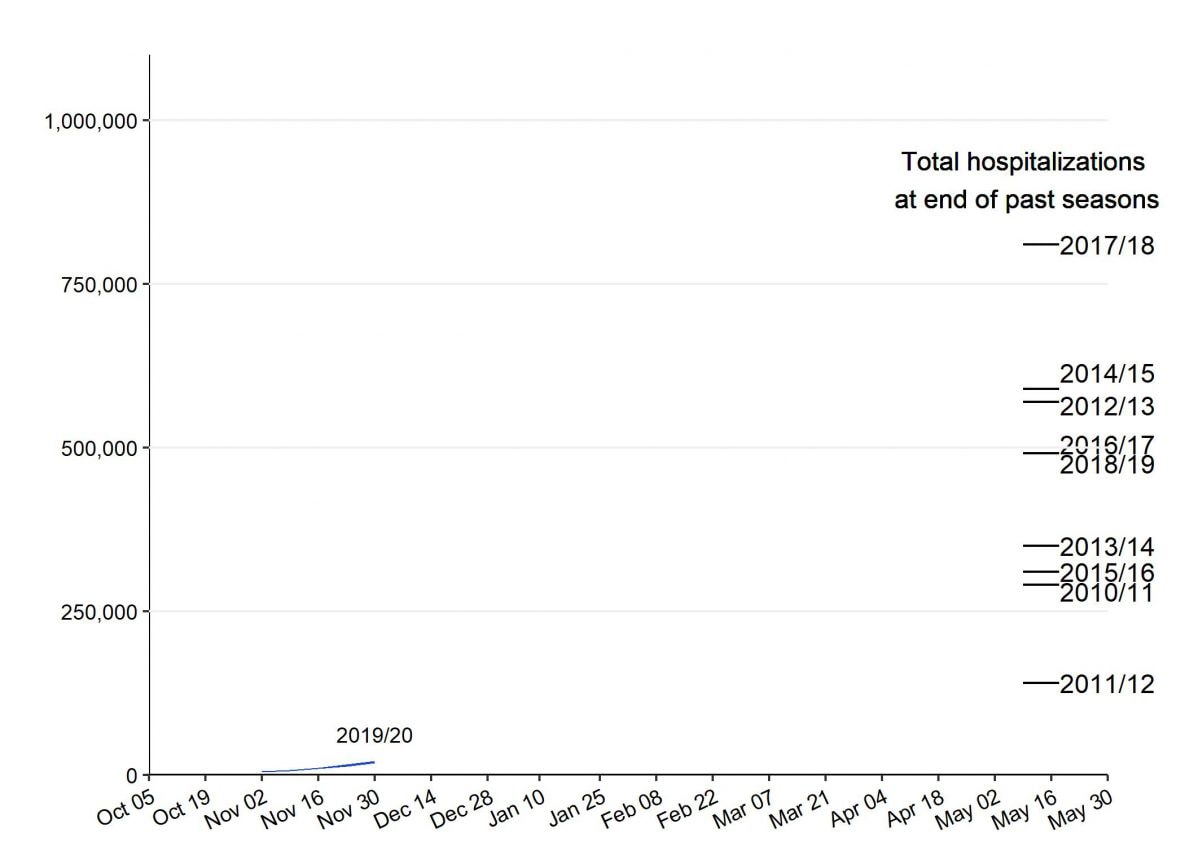
The number of hospitalizations estimated so far this season is lower than end-of-season total hospitalization estimates for any season since CDC began making these estimates. This table also summarizes all estimated influenza disease burden, by season, in U.S. from 2010-11 through 2017-18.
Top of Page Preliminary Cumulative Estimates of Hospitalizations in the U.S. 2019-2020 Flu Season

1204-prelim-hospburden-1185px.jpg


*These estimates are preliminary and based on data from CDC’s weekly influenza surveillance reports summarizing key influenza activity indicators.

Estimated number of influenza-associated hospitalizations

The y-axis extends from 0 to 1 million.

The x-axis is a timeline starting October 5, 2019 and extending to May 30, 2020.

There is a single blue-shaded curve labeled with “2019/20”.

There are several other lines on the right side of the graph under Total hospitalizations at end of past seasons. The lines are labeled, from top to bottom, as 2018/19, 2017/18, 2014/15, 2016/17, 2012/13, 2013/14, 2015/16, 2010/11, and 2011/12 and represent the estimated burden for these seasons. This allows for the comparison of the current season to past seasons.

Page last reviewed: December 6, 2019
Content source: Centers for Disease Control and Prevention, National Center for Immunization and Respiratory Diseases (NCIRD)
https://www.cdc.gov/flu/about/burden...-estimates.htm
 
Influenza deaths
Week 40: 16
Week 41: 13
Week 42: 17
Week 43: 30
Week 44: 30
Week 45: 25
Week 46: 32
Week 47: 26
Week 48: 24
Total: 213

Pneumonia deaths
Week 40: 2,610
Week 41: 2,666
Week 42: 2,823
Week 43: 2,815
Week 44: 2,624
Week 45: 2,677
Week 46: 2,495
Week 47: 2,005
Week 48: 1,455
Total: 22,170

https://gis.cdc.gov/grasp/fluview/mortality.html

Comparison of influenza death certificates Weeks 40 - 48 with corresponding period from previous years (note figures for 2019-20 are preliminary and will increase)
2019-20: 213
2018-19: 214
2018-19: 181
2017-18: 347
2016-17: 151
2015-16: 137
2014-15: 161
2013-14: 142
2012-13: 106

Comparison of Pneumonia fatalities Weeks 40-48 with 2018-19 season (note figures for 2019-20 are preliminary and will increase)
2019-20: 22,170
2018-19: 27,487

2019-2020 U.S. Flu Season: Preliminary Burden Estimates
Espa?ol

flu estimates.png


*These estimates are preliminary and based on data from CDC’s weekly influenza surveillance reports summarizing key influenza activity indicators.

On This Page
... [h=4]Preliminary Cumulative Estimates of Hospitalizations in the U.S. 2019-2020 Flu Season[/h]
1213-prelim-hospburden-1185px.jpg


*These estimates are preliminary and based on data from CDC’s weekly influenza surveillance reports summarizing key influenza activity indicators.
...

Page last reviewed: December 13, 2019
Content source: Centers for Disease Control and Prevention, National Center for Immunization and Respiratory Diseases (NCIRD)
https://www.cdc.gov/flu/about/burden/preliminary-in-season-estimates.htm
 
Influenza deaths
Week 40: 16
Week 41: 13
Week 42: 17
Week 43: 30
Week 44: 30
Week 45: 25
Week 46: 33
Week 47: 34
Week 48: 42
Week 49: 44
Total: 284

Pneumonia deaths
Week 40: 2,627
Week 41: 2,678
Week 42: 2,854
Week 43: 2,854
Week 44: 2,693
Week 45: 2,800
Week 46: 2,692
Week 47: 2,391
Week 48: 2,061
Week 49: 1,801
Total: 25,451

https://gis.cdc.gov/grasp/fluview/mortality.html

Comparison of influenza death certificates Weeks 40 - 49 with corresponding period from previous years (note figures for 2019-20 are preliminary and will increase)
2019-20: 284
2018-19: 270
2017-18: 465
2016-17: 184
2015-16: 157
2014-15: 244
2013-14: 184
2012-13: 170

Comparison of Pneumonia fatalities Weeks 40-49 with 2018-19 season (note figures for 2019-20 are preliminary and will increase)
2019-20: 25,451
2018-19: 30,885

2019-2020 U.S. Flu Season: Preliminary Burden Estimates

flu estimates.png

https://www.cdc.gov/flu/about/burden/preliminary-in-season-estimates.htm
 
Note: The NCHS website was experiencing difficulty this week. Many of the weekly totals were reading higher than they should and were revised down again the following week.
Note figures for 2019-20 are preliminary and will increase
Influenza deaths
Week 40: 16
Week 41: 43
Week 42: 47
Week 43: 45
Week 44: 30
Week 45: 25
Week 46: 34
Week 47: 39
Week 48: 75
Week 49: 91
Week 50: 44
Total: 489

Click image for larger version  Name:	Influenza Mortality.png Views:	14 Size:	79.8 KB ID:	821713


Pneumonia deaths
Week 40: 3,372
Week 41: 3,387
Week 42: 3,663
Week 43: 3,660
Week 44: 3,557
Week 45: 3,703
Week 46: 3,746
Week 47: 3,224
Week 48: 2,520
Week 49: 2,625
Week 50: 1,827
Total: 35,284

https://gis.cdc.gov/grasp/fluview/mortality.html

Comparison of influenza death certificates Weeks 40 - 50 with corresponding period from previous years (note figures for 2019-20 are preliminary and will increase)
2019-20: 489
2018-19: 321
2017-18: 630
2016-17: 230
2015-16: 183
2014-15: 413
2013-14: 252
2012-13: 266

Comparison of Pneumonia fatalities Weeks 40 - 50 with 2018-19 season (note figures for 2019-20 are preliminary and will increase)
2019-20: 35,284
2018-19: 34,436

2019-2020 U.S. Flu Season: Preliminary Burden Estimates

Click image for larger version  Name:	flu estimates.png Views:	14 Size:	71.9 KB ID:	821714

https://www.cdc.gov/flu/about/burden...-estimates.htm
 
Last edited:
Note figures for 2019-20 are preliminary and will increase
Influenza deaths
Week 40: 16
Week 41: 14
Week 42: 17
Week 43: 30
Week 44: 30
Week 45: 25
Week 46: 36
Week 47: 41
Week 48: 49
Week 49: 72
Week 50: 58
Week 51: 45
Total: 433*
Several weekly totals have been reduced back closer to the Dec 20 totals.

Pneumonia deaths
Week 40: 2,643
Week 41: 2,685
Week 42: 2,876
Week 43: 2,890
Week 44: 2,759
Week 45: 2,866
Week 46: 2,807
Week 47: 2,598
Week 48: 2,504
Week 49: 2,600
Week 50: 2,262
Week 51: 1,446
Total: 30,936*
Several weekly totals have been reduced back closer to the Dec 20 totals.

https://gis.cdc.gov/grasp/fluview/mortality.html

Comparison of influenza death certificates Weeks 40 - 51 with corresponding period from previous years (note figures for 2019-20 are preliminary and will increase)
2019-20: 433
2018-19: 409
2017-18: 989
2016-17: 322
2015-16: 198
2014-15: 725
2013-14: 359
2012-13: 410

Comparison of Pneumonia fatalities Weeks 40 - 51 with 2018-19 season (note figures for 2019-20 are preliminary and will increase)
2019-20: 30,936
2018-19: 37,926

2019-2020 U.S. Flu Season: Preliminary Burden Estimates

flu estimates.png

https://www.cdc.gov/flu/about/burden/preliminary-in-season-estimates.htm
 
Note figures for 2019-20 are preliminary and will increase
Influenza deaths
Week 40: 16
Week 41: 14
Week 42: 17
Week 43: 30
Week 44: 30
Week 45: 26
Week 46: 37
Week 47: 44
Week 48: 53
Week 49: 82
Week 50: 73
Week 51: 70
Week 52: 71
Total: 563

Influenza Mortality.png


Pneumonia deaths
Week 40: 2,660
Week 41: 2,690
Week 42: 2,895
Week 43: 2,898
Week 44: 2,788
Week 45: 2,911
Week 46: 2,853
Week 47: 2,680
Week 48: 2,625
Week 49: 2,819
Week 50: 2,739
Week 51: 2,148
Week 52: 1,671
Total: 34,377


https://gis.cdc.gov/grasp/fluview/mortality.html

Comparison of influenza death certificates Weeks 40 - 52 with corresponding period from previous years (note figures for 2019-20 are preliminary and will increase)
2019-20: 563
2018-19: 549
2017-18: 1,659
2016-17: 479
2015-16: 229
2014-15: 1,237
2013-14: 566
2012-13: 642

Comparison of Pneumonia fatalities Weeks 40 - 52 with 2018-19 season (note figures for 2019-20 are preliminary and will increase)
2019-20: 34,377
2018-19: 41,561

2019-2020 U.S. Flu Season: Preliminary Burden Estimates

flu estimates.png

...
https://www.cdc.gov/flu/about/burden/preliminary-in-season-estimates.htm
 
Note figures for 2019-20 are preliminary and will increase
Influenza deaths
Week 40: 16
Week 41: 14
Week 42: 17
Week 43: 30
Week 44: 30
Week 45: 27
Week 46: 37
Week 47: 45
Week 48: 55
Week 49: 86
Week 50: 82
Week 51: 94
Week 52: 113
Week 1: 219
Total: 865

Influenza Mortality.png


Pneumonia deaths
Week 40: 2,669
Week 41: 2,697
Week 42: 2,914
Week 43: 2,905
Week 44: 2,807
Week 45: 2,946
Week 46: 2,930
Week 47: 2,758
Week 48: 2,697
Week 49: 2,950
Week 50: 2,986
Week 51: 2,670
Week 52: 2,349
Week 1: 2,208
Total: 38,486


https://gis.cdc.gov/grasp/fluview/mortality.html

Comparison of influenza death certificates Weeks 40 - 1 with corresponding period from previous years (note figures for 2019-20 are preliminary and will increase)
2019-20: 865
2018-19: 759
2017-18: 2,820
2016-17: 768
2015-16: 261
2014-15: 2,247
2013-14: 917
2012-13: 1,049

Comparison of Pneumonia fatalities Weeks 40 - 1 with 2018-19 season (note figures for 2019-20 are preliminary and will increase)
2019-20: 38,486
2018-19: 45,467

2019-2020 U.S. Flu Season: Preliminary Burden Estimates

flu estimates.png

...
https://www.cdc.gov/flu/about/burden/preliminary-in-season-estimates.htm
 
Note figures for 2019-20 are preliminary and will increase
Influenza deaths
Week 40: 16
Week 41: 14
Week 42: 17
Week 43: 30
Week 44: 30
Week 45: 27
Week 46: 39
Week 47: 45
Week 48: 58
Week 49: 87
Week 50: 88
Week 51: 104
Week 52: 141
Week 1: 263
Week 2: 199
Total: 1,158
Influenza Mortality.png


Pneumonia deaths
Week 40: 2,672
Week 41: 2,702
Week 42: 2,919
Week 43: 2,911
Week 44: 2,819
Week 45: 2,984
Week 46: 2,958
Week 47: 2,787
Week 48: 2,726
Week 49: 2,989
Week 50: 3,079
Week 51: 2,859
Week 52: 2,761
Week 1: 2,698
Week 2: 1,862
Total: 41,726


https://gis.cdc.gov/grasp/fluview/mortality.html

Comparison of influenza death certificates Weeks 40 - 2 with corresponding period from previous years (note figures for 2019-20 are preliminary and will increase)
2019-20: 1,158
2018-19: 1,017
2017-18: 4,354
2016-17: 1,136
2015-16: 291
2014-15: 3,335
2013-14: 1,378
2012-13: 1,698

Comparison of Pneumonia fatalities Weeks 40 - 2 with 2018-19 season (note figures for 2019-20 are preliminary and will increase)
2019-20: 41,726
2018-19: 49,510

2019-2020 U.S. Flu Season: Preliminary Burden Estimates
flu estimates.png

...
https://www.cdc.gov/flu/about/burden/preliminary-in-season-estimates.htm
 
Note figures for 2019-20 are preliminary and will increase
Influenza deaths
Week 40: 16
Week 41: 15
Week 42: 18
Week 43: 30
Week 44: 31
Week 45: 28
Week 46: 39
Week 47: 47
Week 48: 60
Week 49: 88
Week 50: 93
Week 51: 111
Week 52: 159
Week 1: 325
Week 2: 279
Week 3: 191
Total: 1,530

Influenza Mortality.png


Pneumonia deaths
Week 40: 2,684
Week 41: 2,741
Week 42: 2,954
Week 43: 2,956
Week 44: 2,850
Week 45: 2,980
Week 46: 3,000
Week 47: 2,838
Week 48: 2,803
Week 49: 3,082
Week 50: 3,177
Week 51: 3,007
Week 52: 3,079
Week 1: 3,292
Week 2: 2,676
Week 3: 1,916
Total: 46,035


https://gis.cdc.gov/grasp/fluview/mortality.html

Comparison of influenza death certificates Weeks 40 - 2 with corresponding period from previous years (note figures for 2019-20 are preliminary and will increase)
2019-20: 1,530
2018-19: 1,264
2017-18: 5,979
2016-17: 1,511
2015-16: 327
2014-15: 4,317
2013-14: 1,852
2012-13: 2,331

Comparison of Pneumonia fatalities Weeks 40 - 2 with 2018-19 season (note figures for 2019-20 are preliminary and will increase)
2019-20: 46,035
2018-19: 53,594

2019-2020 U.S. Flu Season: Preliminary Burden Estimates

flu estimates.png

...
https://www.cdc.gov/flu/about/burden/preliminary-in-season-estimates.htm
 
Note figures for 2019-20 are preliminary and will increase
Influenza deaths
Week 40: 16
Week 41: 15
Week 42: 18
Week 43: 30
Week 44: 31
Week 45: 28
Week 46: 39
Week 47: 48
Week 48: 61
Week 49: 89
Week 50: 95
Week 51: 112
Week 52: 165
Week 1: 348
Week 2: 347
Week 3: 287
Week 4: 228
Total: 1,957

Influenza Mortality.png


Pneumonia deaths
Week 40: 2,692
Week 41: 2,757
Week 42: 2,964
Week 43: 2,967
Week 44: 2,864
Week 45: 2,989
Week 46: 3,016
Week 47: 2,868
Week 48: 2,826
Week 49: 3,118
Week 50: 3,207
Week 51: 3,038
Week 52: 3,126
Week 1: 3,523
Week 2: 3,273
Week 3: 2,803
Week 4: 1,950
Total: 49,981


https://gis.cdc.gov/grasp/fluview/mortality.html

Comparison of influenza death certificates Weeks 40 - 4 with corresponding period from previous years (note figures for 2019-20 are preliminary and will increase)
2019-20: 1,957
2018-19: 1,538
2017-18: 7,426
2016-17: 1,878
2015-16: 377
2014-15: 5,028
2013-14: 2,294
2012-13: 2,833

Comparison of Pneumonia fatalities Weeks 40 - 4 with 2018-19 season (note figures for 2019-20 are preliminary and will increase)
2019-20: 49,981
2018-19: 57,478

2019-2020 U.S. Flu Season: Preliminary Burden Estimates

flu estimates.png

...
https://www.cdc.gov/flu/about/burden/preliminary-in-season-estimates.htm
 
Note figures for 2019-20 are preliminary and will increase
Influenza deaths
Week 40: 16
Week 41: 15
Week 42: 18
Week 43: 30
Week 44: 31
Week 45: 28
Week 46: 39
Week 47: 49
Week 48: 61
Week 49: 91
Week 50: 97
Week 51: 116
Week 52: 165
Week 1: 365
Week 2: 391
Week 3: 361
Week 4: 369
Week 5: 237
Total: 2,479

Click image for larger version  Name:	Influenza Mortality.png Views:	0 Size:	81.5 KB ID:	829459


Pneumonia deaths
Week 40: 2,693
Week 41: 2,763
Week 42: 2,969
Week 43: 2,972
Week 44: 2,875
Week 45: 2,997
Week 46: 3,028
Week 47: 2,885
Week 48: 2,843
Week 49: 3,152
Week 50: 3,245
Week 51: 3,090
Week 52: 3,183
Week 1: 3,661
Week 2: 3,631
Week 3: 3,405
Week 4: 2,930
Week 5: 2,080
Total: 54,402


https://gis.cdc.gov/grasp/fluview/mortality.html

Comparison of influenza death certificates Weeks 40 - 5 with corresponding period from previous years (note figures for 2019-20 are preliminary and will increase)
2019-20: 2,479
2018-19: 1,862
2017-18: 8,782
2016-17: 2,229
2015-16: 438
2014-15: 5,611
2013-14: 2,679
2012-13: 3,225

Comparison of Pneumonia fatalities Weeks 40 - 5 with 2018-19 season (note figures for 2019-20 are preliminary and will increase)
2019-20: 54,402
2018-19: 61,361

2019-2020 U.S. Flu Season: Preliminary Burden Estimates

Click image for larger version  Name:	flu estimates.png Views:	0 Size:	72.4 KB ID:	829460

...
https://www.cdc.gov/flu/about/burden...-estimates.htm
 
Note figures for 2019-20 are preliminary and will increase
Influenza deaths
Week 40: 16
Week 41: 16
Week 42: 18
Week 43: 30
Week 44: 31
Week 45: 28
Week 46: 39
Week 47: 49
Week 48: 64
Week 49: 92
Week 50: 100
Week 51: 119
Week 52: 168
Week 1: 374
Week 2: 397
Week 3: 387
Week 4: 410
Week 5: 342
Week 6: 266
Total: 2,946

Influenza Mortality.png


Pneumonia deaths
Week 40: 2,694
Week 41: 2,762
Week 42: 2,970
Week 43: 2,976
Week 44: 2,879
Week 45: 3,007
Week 46: 3,039
Week 47: 2,914
Week 48: 2,900
Week 49: 3,216
Week 50: 3,329
Week 51: 3,170
Week 52: 3,225
Week 1: 3,712
Week 2: 3,717
Week 3: 3,554
Week 4: 3,311
Week 5: 2,951
Week 6: 2,229
Total: 58,555


https://gis.cdc.gov/grasp/fluview/mortality.html

Comparison of influenza death certificates Weeks 40 - 6 with corresponding period from previous years (note figures for 2019-20 are preliminary and will increase)
2019-20: 2,946
2018-19: 2,226
2017-18: 10,022
2016-17: 2,648
2015-16: 531
2014-15: 6,095
2013-14: 2,994
2012-13: 3,492

Comparison of Pneumonia fatalities Weeks 40 - 6 with 2018-19 season (note figures for 2019-20 are preliminary and will increase)
2019-20: 58,555
2018-19: 65,250

2019-2020 U.S. Flu Season: Preliminary Burden Estimates

flu estimates.png

...
https://www.cdc.gov/flu/about/burden...-estimates.htm
 
Note figures for 2019-20 are preliminary and will increase
Influenza deaths
Week 40: 16
Week 41: 16
Week 42: 18
Week 43: 30
Week 44: 31
Week 45: 29
Week 46: 39
Week 47: 49
Week 48: 65
Week 49: 93
Week 50: 105
Week 51: 122
Week 52: 174
Week 1: 387
Week 2: 404
Week 3: 399
Week 4: 425
Week 5: 386
Week 6: 381
Week 7: 313
Total: 3,482

Influenza Mortality.png


Pneumonia deaths
Week 40: 2,695
Week 41: 2,761
Week 42: 2,973
Week 43: 2,978
Week 44: 2,893
Week 45: 3,032
Week 46: 3,073
Week 47: 2,961
Week 48: 2,928
Week 49: 3,241
Week 50: 3,361
Week 51: 3,234
Week 52: 3,311
Week 1: 3,790
Week 2: 3,776
Week 3: 3,629
Week 4: 3,425
Week 5: 3,226
Week 6: 3,005
Week 7: 2,401
Total: 62,693


https://gis.cdc.gov/grasp/fluview/mortality.html

Comparison of influenza death certificates Weeks 40 - 7 with corresponding period from previous years (note figures for 2019-20 are preliminary and will increase)
2019-20: 3,482
2018-19: 2,704
2017-18: 11,201
2016-17: 3,192
2015-16: 680
2014-15: 6,500
2013-14: 3,265
2012-13: 3,701

Comparison of Pneumonia fatalities Weeks 40 - 7 with 2018-19 season (note figures for 2019-20 are preliminary and will increase)
2019-20: 62,693
2018-19: 69,133

2019-2020 U.S. Flu Season: Preliminary Burden Estimates

flu estimates.png

...
https://www.cdc.gov/flu/about/burden...-estimates.htm
 
Note figures for 2019-20 are preliminary and will increase
Influenza deaths
Week 40: 16
Week 41: 16
Week 42: 18
Week 43: 30
Week 44: 31
Week 45: 29
Week 46: 39
Week 47: 49
Week 48: 65
Week 49: 94
Week 50: 106
Week 51: 122
Week 52: 180
Week 1: 390
Week 2: 410
Week 3: 405
Week 4: 432
Week 5: 406
Week 6: 415
Week 7: 403
Week 8: 338
Total: 3,994

Influenza Mortality.png


Pneumonia deaths
Week 40: 2,696
Week 41: 2,761
Week 42: 2,974
Week 43: 2,981
Week 44: 2,895
Week 45: 3,036
Week 46: 3,075
Week 47: 2,968
Week 48: 2,938
Week 49: 3,249
Week 50: 3,385
Week 51: 3,262
Week 52: 3,353
Week 1: 3,845
Week 2: 3,822
Week 3: 3,682
Week 4: 3,489
Week 5: 3,335
Week 6: 3,235
Week 7: 2,955
Week 8: 2,318
Total: 66,254

https://gis.cdc.gov/grasp/fluview/mortality.html

Comparison of influenza death certificates Weeks 40 - 8 with corresponding period from previous years (note figures for 2019-20 are preliminary and will increase)
2019-20: 3,994
2018-19: 3,176
2017-18: 12,087
2016-17: 3,798
2015-16: 867
2014-15: 6,785
2013-14: 3,474
2012-13: 3,868

Comparison of Pneumonia fatalities Weeks 40 - 8 with 2018-19 season (note figures for 2019-20 are preliminary and will increase)
2019-20: 66,254
2018-19: 73,097

2019-2020 U.S. Flu Season: Preliminary Burden Estimates

flu estimates.png

https://www.cdc.gov/flu/about/burden/preliminary-in-season-estimates.htm
 
Note figures for 2019-20 are preliminary and will increase. Data for week 9 is 79.1% complete
Influenza deaths
Week 40: 16
Week 41: 16
Week 42: 18
Week 43: 30
Week 44: 31
Week 45: 30
Week 46: 39
Week 47: 49
Week 48: 65
Week 49: 95
Week 50: 107
Week 51: 122
Week 52: 188
Week 1: 395
Week 2: 421
Week 3: 415
Week 4: 446
Week 5: 414
Week 6: 441
Week 7: 440
Week 8: 415
Week 9: 384
Total: 4,577

Influenza Mortality.png


Pneumonia deaths. Data for week 9 is 79.1% complete
Week 40: 2,696
Week 41: 2,761
Week 42: 2,977
Week 43: 2,982
Week 44: 2,899
Week 45: 3,052
Week 46: 3,086
Week 47: 2,978
Week 48: 2,960
Week 49: 3,257
Week 50: 3,397
Week 51: 3,281
Week 52: 3,377
Week 1: 3,896
Week 2: 3,880
Week 3: 3,741
Week 4: 3,568
Week 5: 3,414
Week 6: 3,376
Week 7: 3,251
Week 8: 2,911
Week 9: 2,280
Total: 70,020

https://gis.cdc.gov/grasp/fluview/mortality.html

Comparison of influenza death certificates Weeks 40 - 9 with corresponding period from previous years (note figures for 2019-20 are preliminary and will increase.)
2019-20: 4,577
2018-19: 3,691
2017-18: 12,823
2016-17: 4,333
2015-16: 1,124
2014-15: 6,975
2013-14: 3,635
2012-13: 4,016

Comparison of Pneumonia fatalities Weeks 40 - 9 with 2018-19 season (note figures for 2019-20 are preliminary and will increase)
2019-20: 70,020
2018-19: 76,841

2019-2020 U.S. Flu Season: Preliminary Burden Estimates
flu estimates.png


https://www.cdc.gov/flu/about/burden/preliminary-in-season-estimates.htm
 
Back
Top