Follow along with the video below to see how to install our site as a web app on your home screen.
Note: This feature may not be available in some browsers.
FluTrackers.com Inc. does not provide medical advice. Information on this web site is collected from various internet resources, and the FluTrackers board of directors makes no warranty to the safety, efficacy, correctness or completeness of the information posted on this site by any author or poster.
The information collated here is for instructional and/or discussion purposes only and is NOT intended to diagnose or treat any disease, illness, or other medical condition. Every individual reader or poster should seek advice from their personal physician/healthcare practitioner before considering or using any interventions that are discussed on this website.
By continuing to access this website you agree to consult your personal physican before using any interventions posted on this website, and you agree to hold harmless FluTrackers.com Inc., the board of directors, the members, and all authors and posters for any effects from use of any medication, supplement, vitamin or other substance, device, intervention, etc. mentioned in posts on this website, or other internet venues referenced in posts on this website.
We are not asking for any donations. Do not donate to any entity who says they are raising funds for us.
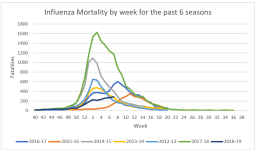
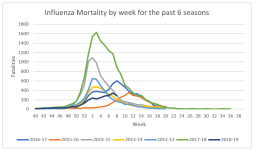
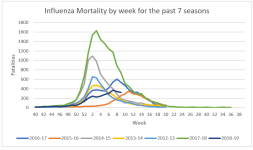
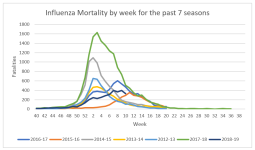
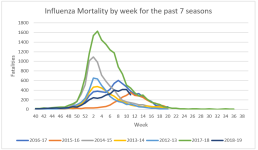
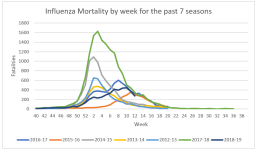
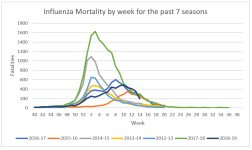
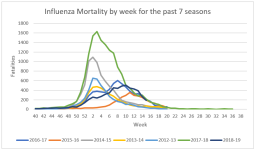
Comparison of influenza death certificates Weeks 40 - 7 with corresponding period from previous years (note figures for 2018-19 are preliminary and are likely to increase)
2018-19: 2,198
2017-18: 11,201
2016-17: 3,192
2015-16: 680
2014-15: 6,500
2013-14: 3,265
2012-13: 3,701
*These estimates are preliminary and based on data from CDC’s weekly influenza surveillance reports summarizing key influenza activity indicators. On This Page
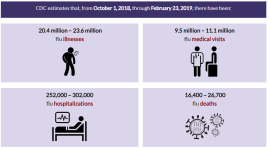
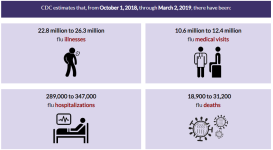
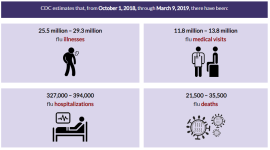
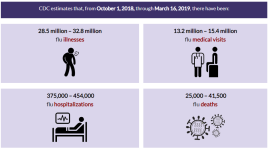
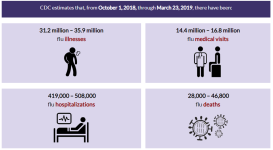
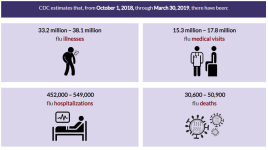
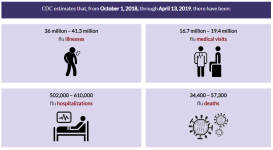
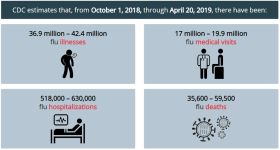
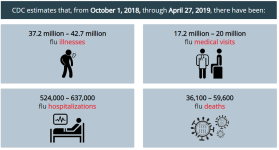
This web page provides weekly preliminary estimates of the cumulative in-season numbers of flu illnesses, medical visits, hospitalizations, and deaths in the United States. CDC has estimated the burden of flu since 2010 using a mathematical model that is based on observed rates of laboratory-confirmed influenza-associated hospitalizations collected through a surveillance network that covers approximately 8.5% of the U.S. population (~27 million people).
The 2018-2019 flu season is the first season CDC has reported in-season burden estimates of flu in the U.S. These in-season estimates will be updated over the course of the flu season.
Limitations
The estimates of the cumulative burden of seasonal influenza are subject to several limitations.
First, the cumulative rate of laboratory-confirmed influenza-associated hospitalizations reported during the season may be an under-estimate of the rate at the end of the season because of identification and reporting delays.
Second, rates of laboratory-confirmed influenza-associated hospitalizations were adjusted for the frequency of influenza testing and the sensitivity of influenza diagnostic assays. However, data on testing practices during the 2018-2019 season are not available in real-time. CDC used data on testing practices from the 2014-2015 influenza season as a proxy. Burden estimates will be updated at a later date when data on contemporary testing practices become available.
Third, estimates of influenza-associated illness and medical visits are based on data from prior seasons, which may not be accurate if the seriousness of illness or patterns of care-seeking have changed. Frequently Asked Questions
What does the cumulative burden of influenza for the 2018-2019 season mean?
The cumulative burden of influenza is an estimate of the number of people who have been sick, seen a healthcare provider, been hospitalized, or died as a result of influenza since October 01, 2018. CDC does not know the exact number of people who have been sick and affected by influenza because influenza is not a reportable disease in most areas of the United States. However, these numbers are estimated using a mathematical model, based on observed rates of laboratory-confirmed influenza-associated hospitalizations. How does CDC estimate the cumulative burden of seasonal influenza?
Preliminary estimates of the cumulative burden of seasonal influenza during the 2018-2019 season in the United States are based on crude rates of laboratory-confirmed influenza-associated hospitalizations, reported through the Influenza Hospitalization Surveillance Network (FluSurv-NET), which were adjusted for the frequency of influenza testing during recent prior seasons and the sensitivity of influenza diagnostic assays. Rates of hospitalization were then multiplied by previously estimated ratio of hospitalizations to symptomatic illnesses, and frequency of seeking medical care to calculate symptomatic illnesses, medical visits, and deaths associated with seasonal influenza, respectively. Why does the estimate of cumulative burden change each week?
The estimates of cumulative burden of seasonal influenza are considered preliminary and may change each week as new laboratory-confirmed influenza-associated hospitalizations are reported to CDC. New reports include both new admissions that have occurred during the reporting week and also patients admitted in previous weeks that have been newly reported to CDC. How does the number of flu hospitalizations estimated so far this season compare with previous end-of-season hospitalization estimates?
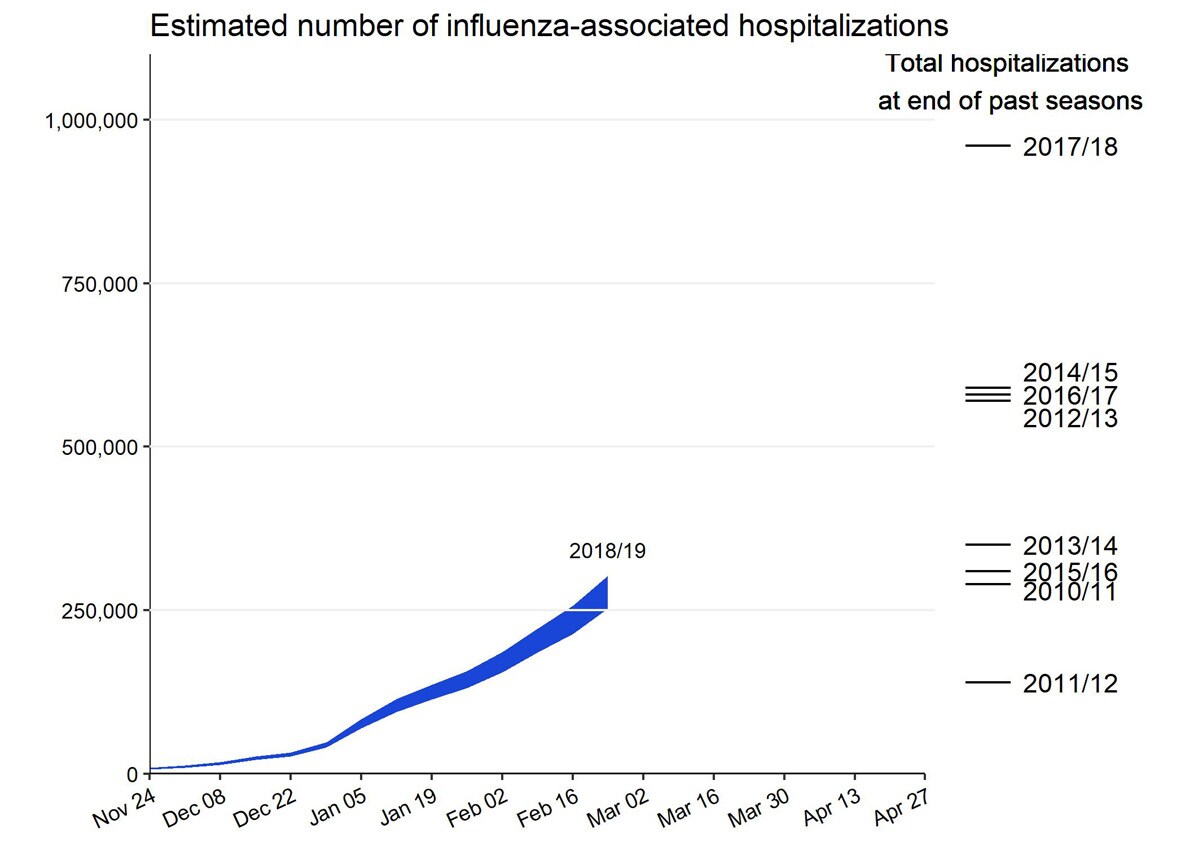
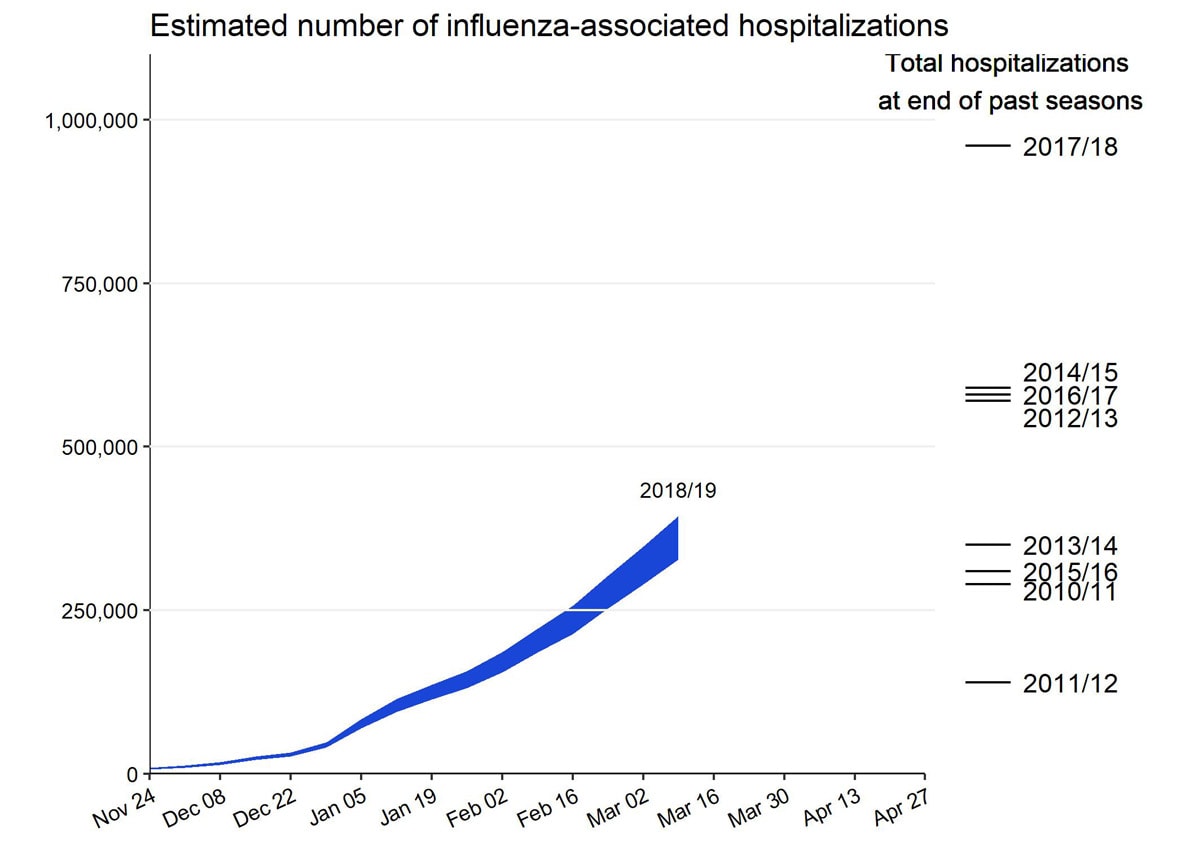
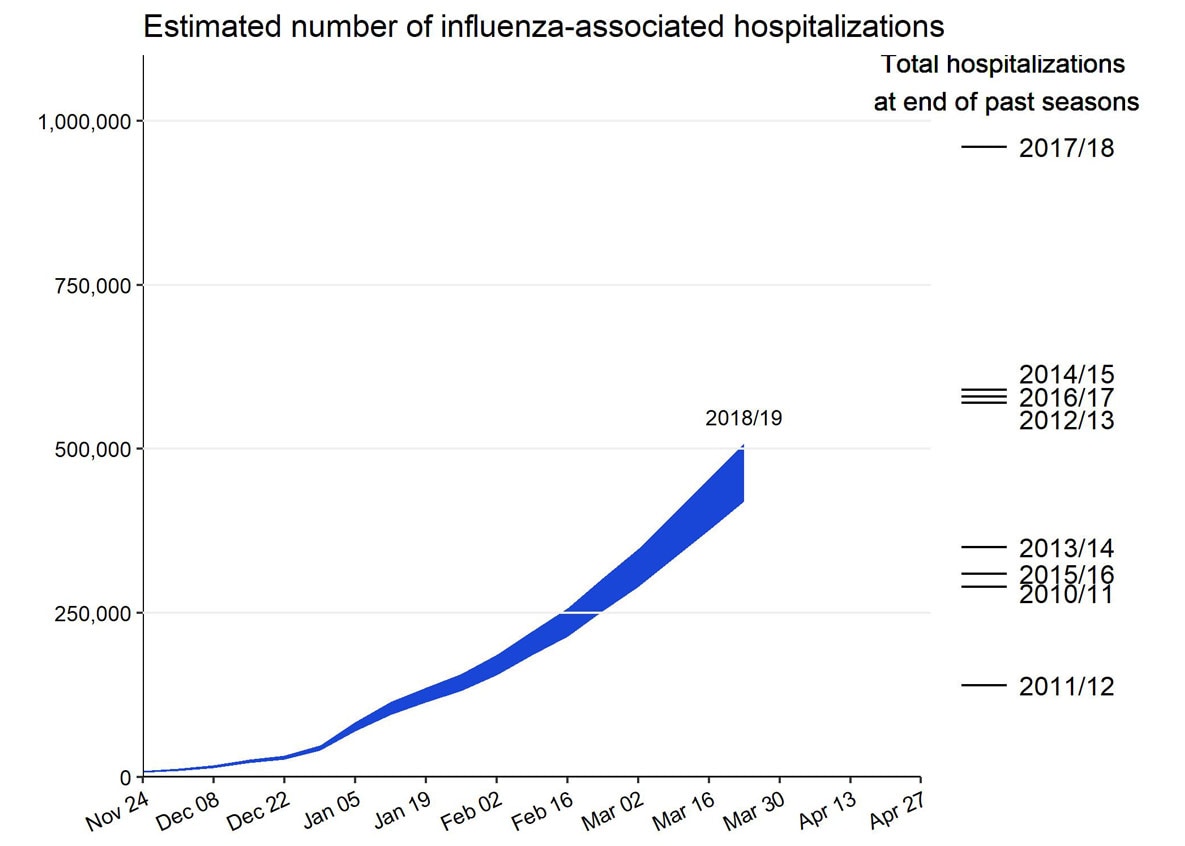
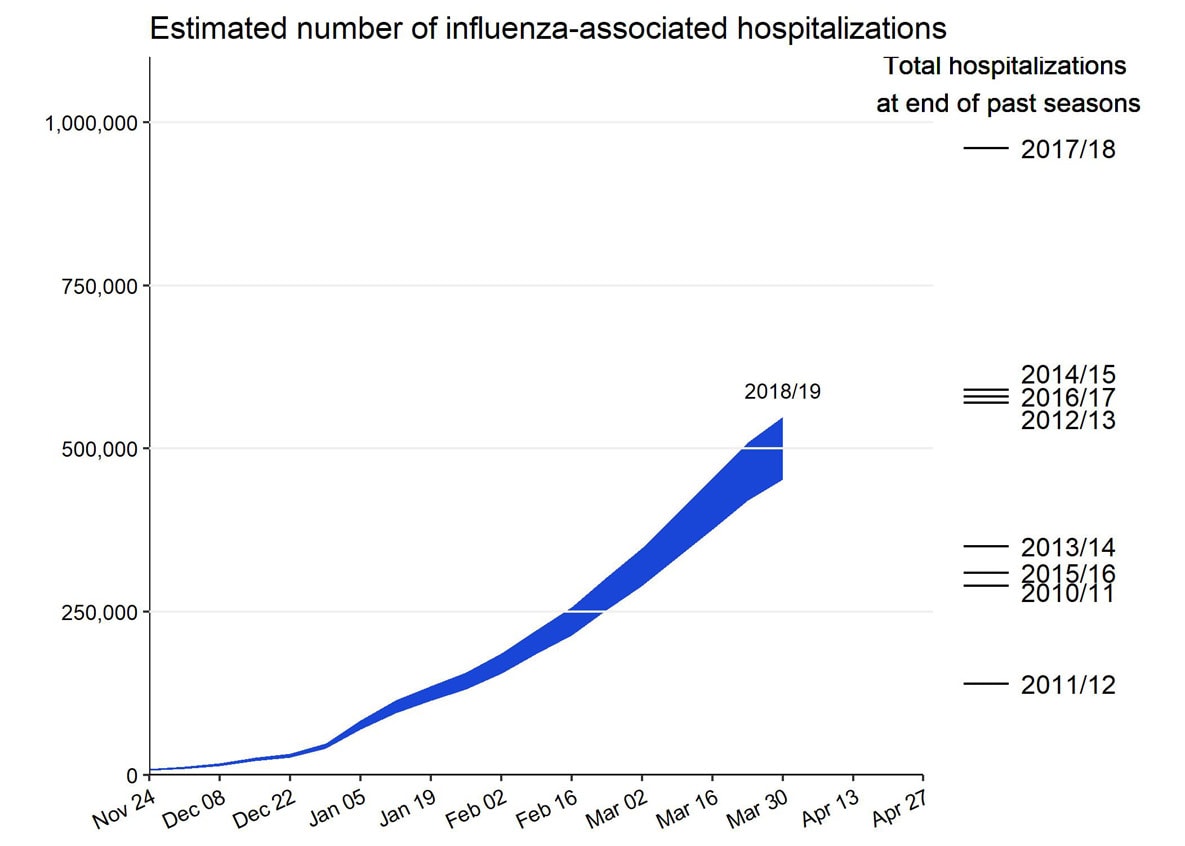
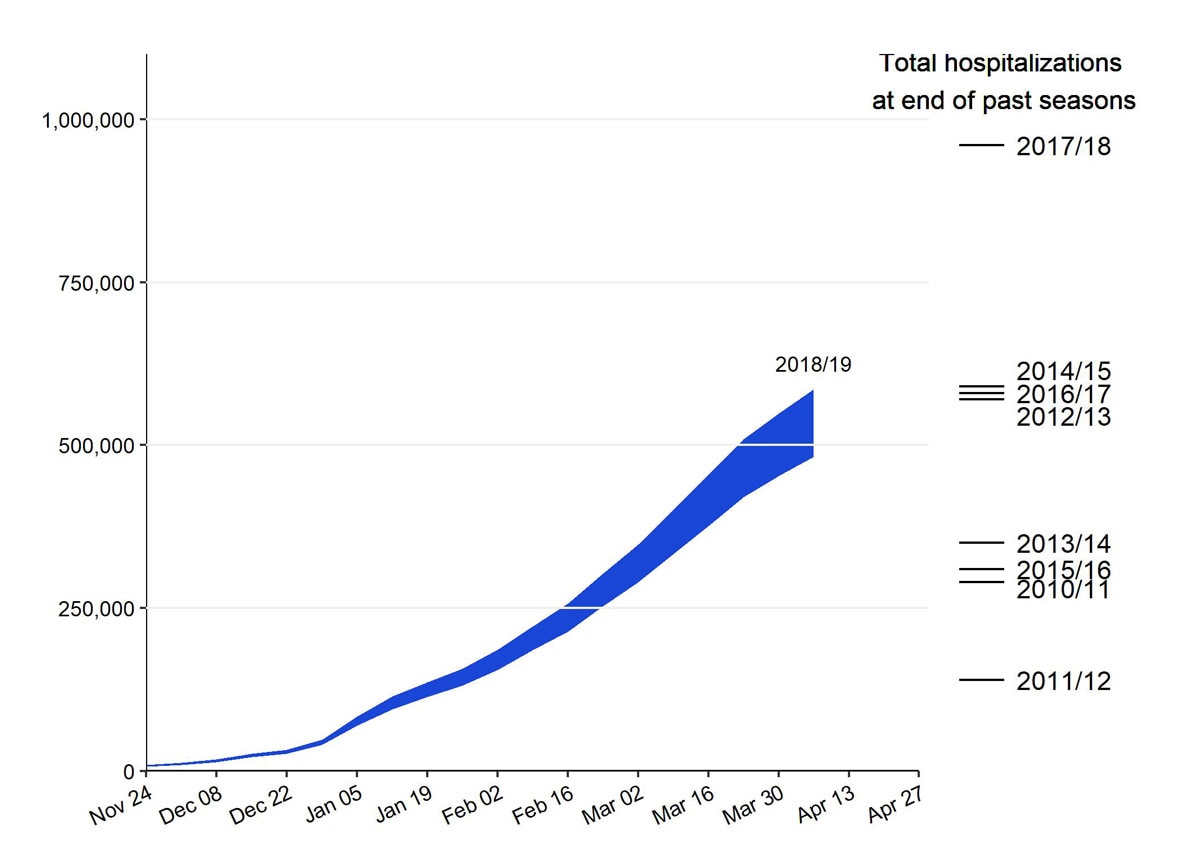
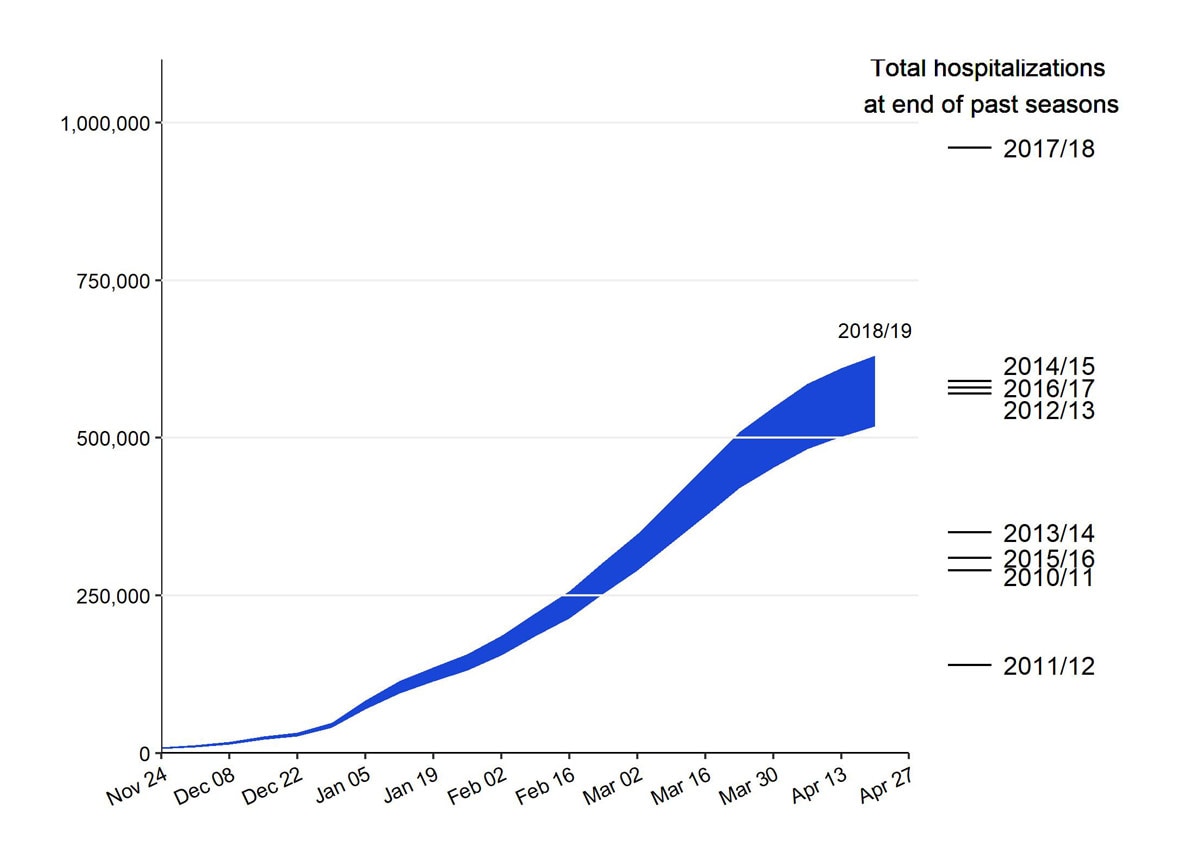
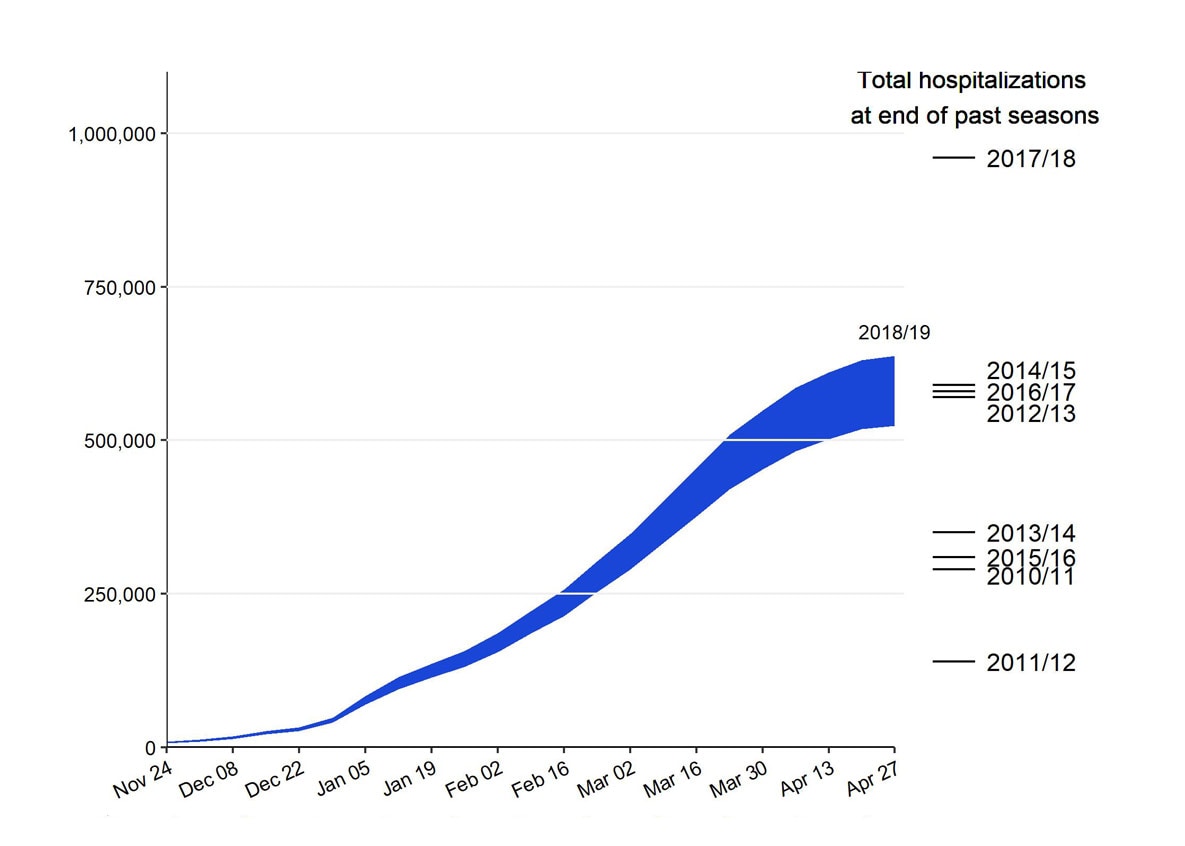
The number of hospitalizations estimated so far this season is lower than end-of-season total hospitalization estimates for any season since CDC began making these estimates. This table also summarizes all estimated influenza disease burden, by season, in U.S. from 2010-11 through 2017-18.
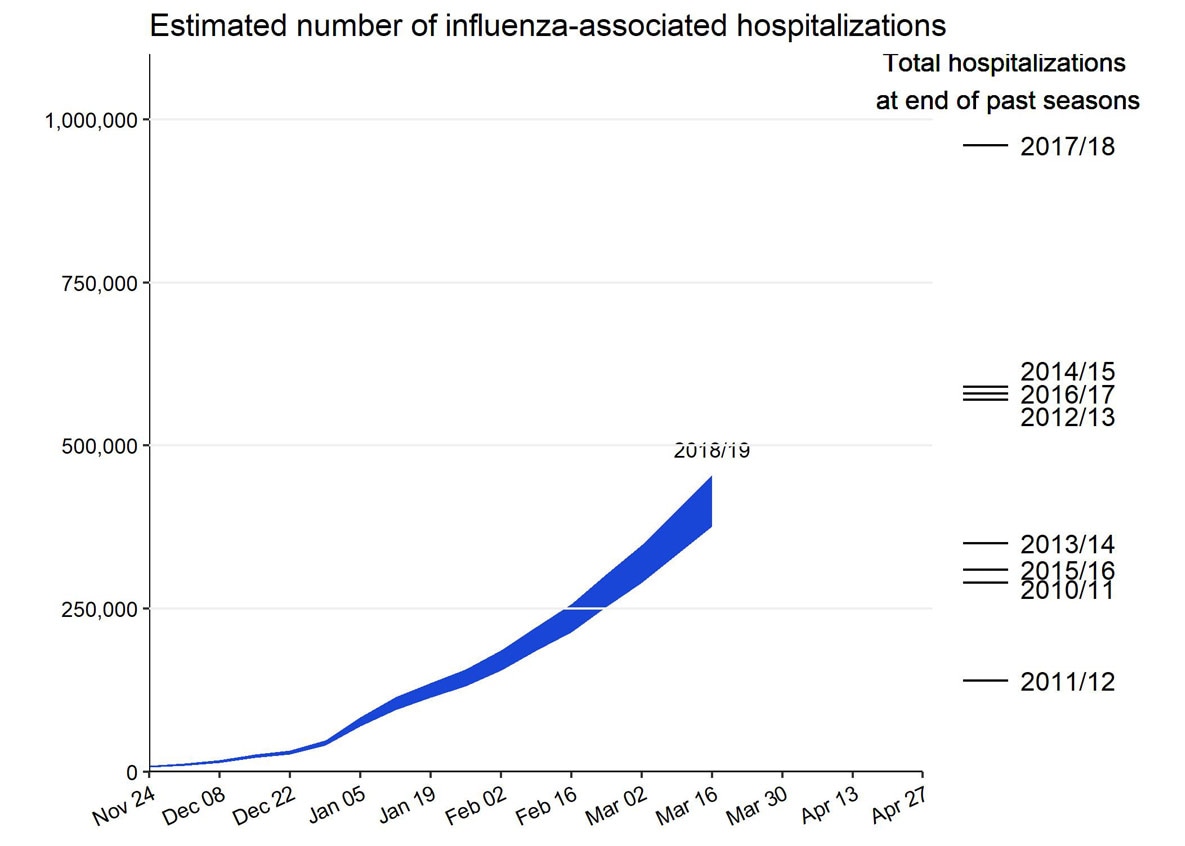
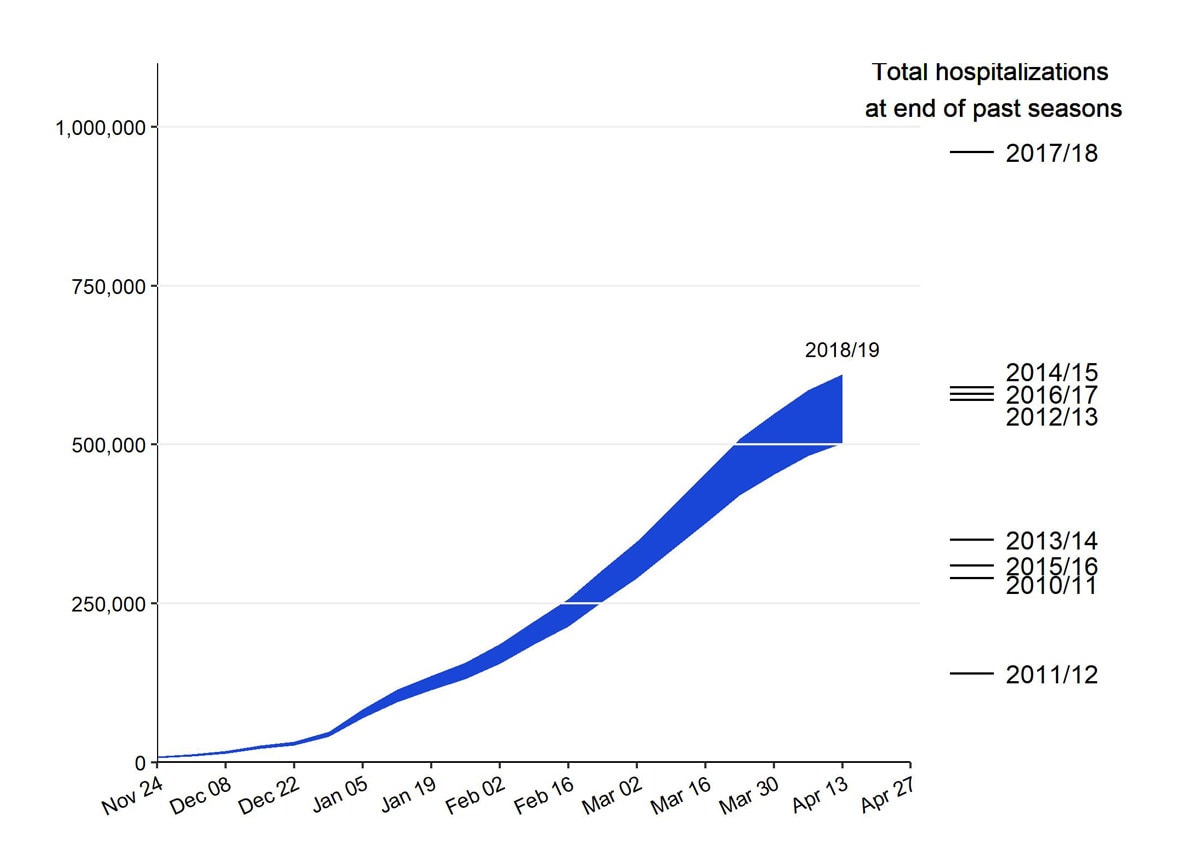
Preliminary Cumulative Estimates of Hospitalizations in the U.S. 2018-2019 Flu Season
*These estimates are preliminary and based on data from CDC’s weekly influenza surveillance reports summarizing key influenza activity indicators.
508 text for this chart:
Estimated number of influenza-associated hospitalizations
The y-axis extends from 0 to 1 million.
The x-axis is a timeline starting November 24 and extending to April 27.
There is a single blue-shaded curve labeled with “2018/19”.
There are several other lines on the right side of the graph under Total hospitalizations at end of past seasons. The lines are labeled, from top to bottom, as 2017/18, 2014/15, 2016/17, 2012/13, 2013/14, 2015/16, 2010/11, and 2011/12.
Comparison of influenza death certificates Weeks 40 - 8 with corresponding period from previous years (note figures for 2018-19 are preliminary and are likely to increase)
2018-19: 2,620
2017-18: 12,087
2016-17: 3,798
2015-16: 867
2014-15: 6,785
2013-14: 3,474
2012-13: 3,868
2018-2019 U.S. Flu Season: Preliminary Burden Estimates
*These estimates are preliminary and based on data from CDC?s weekly influenza surveillance reports summarizing key influenza activity indicators.
[h=4]On This Page[/h]
This web page provides weekly preliminary estimates of the cumulative in-season numbers of flu illnesses, medical visits, hospitalizations, and deaths in the United States. CDC has estimated the burden of flu since 2010 using a mathematical model that is based on observed rates of laboratory-confirmed influenza-associated hospitalizations collected through a surveillance network that covers approximately 8.5% of the U.S. population (~27 million people).
The 2018-2019 flu season is the first season CDC has reported in-season burden estimates of flu in the U.S. These in-season estimates will be updated over the course of the flu season.
[h=3]Limitations[/h] The estimates of the cumulative burden of seasonal influenza are subject to several limitations.
First, the cumulative rate of laboratory-confirmed influenza-associated hospitalizations reported during the season may be an under-estimate of the rate at the end of the season because of identification and reporting delays.
Second, rates of laboratory-confirmed influenza-associated hospitalizations were adjusted for the frequency of influenza testing and the sensitivity of influenza diagnostic assays. However, data on testing practices during the 2018-2019 season are not available in real-time. CDC used data on testing practices from the 2014-2015 influenza season as a proxy. Burden estimates will be updated at a later date when data on contemporary testing practices become available.
Third, estimates of influenza-associated illness and medical visits are based on data from prior seasons, which may not be accurate if the seriousness of illness or patterns of care-seeking have changed.
[h=3]Frequently Asked Questions[/h] [h=4]What does the cumulative burden of influenza for the 2018-2019 season mean?[/h] The cumulative burden of influenza is an estimate of the number of people who have been sick, seen a healthcare provider, been hospitalized, or died as a result of influenza since October 01, 2018. CDC does not know the exact number of people who have been sick and affected by influenza because influenza is not a reportable disease in most areas of the United States. However, these numbers are estimated using a mathematical model, based on observed rates of laboratory-confirmed influenza-associated hospitalizations.
[h=4]How does CDC estimate the cumulative burden of seasonal influenza?[/h] Preliminary estimates of the cumulative burden of seasonal influenza during the 2018-2019 season in the United States are based on crude rates of laboratory-confirmed influenza-associated hospitalizations, reported through the Influenza Hospitalization Surveillance Network (FluSurv-NET), which were adjusted for the frequency of influenza testing during recent prior seasons and the sensitivity of influenza diagnostic assays. Rates of hospitalization were then multiplied by previously estimated ratio of hospitalizations to symptomatic illnesses, and frequency of seeking medical care to calculate symptomatic illnesses, medical visits, and deaths associated with seasonal influenza, respectively.
[h=4]Why does the estimate of cumulative burden change each week?[/h] The estimates of cumulative burden of seasonal influenza are considered preliminary and may change each week as new laboratory-confirmed influenza-associated hospitalizations are reported to CDC. New reports include both new admissions that have occurred during the reporting week and also patients admitted in previous weeks that have been newly reported to CDC.
[h=4]How does the number of flu hospitalizations estimated so far this season compare with previous end-of-season hospitalization estimates?[/h] The number of hospitalizations estimated so far this season is lower than end-of-season total hospitalization estimates for any season since CDC began making these estimates. This table also summarizes all estimated influenza disease burden, by season, in U.S. from 2010-11 through 2017-18.
[h=4]Preliminary Cumulative Estimates of Hospitalizations in the U.S. 2018-2019 Flu Season[/h]
*These estimates are preliminary and based on data from CDC?s weekly influenza surveillance reports summarizing key influenza activity indicators.
508 text for this chart:
Estimated number of influenza-associated hospitalizations
The y-axis extends from 0 to 1 million.
The x-axis is a timeline starting November 24 and extending to April 27.
There is a single blue-shaded curve labeled with ?2018/19?.
There are several other lines on the right side of the graph under Total hospitalizations at end of past seasons. The lines are labeled, from top to bottom, as 2017/18, 2014/15, 2016/17, 2012/13, 2013/14, 2015/16, 2010/11, and 2011/12.
... https://www.cdc.gov/flu/about/burden/preliminary-in-season-estimates.htm
Comparison of influenza death certificates Weeks 40 - 9 with corresponding period from previous years (note figures for 2018-19 are preliminary and are likely to increase)
2018-19: 3,061
2017-18: 12,823
2016-17: 4,333
2015-16: 1,124
2014-15: 6,975
2013-14: 3,635
2012-13: 4,016
2018-2019 U.S. Flu Season: Preliminary Burden Estimates
*These estimates are preliminary and based on data from CDC?s weekly influenza surveillance reports summarizing key influenza activity indicators.
[h=4]On This Page[/h]
This web page provides weekly preliminary estimates of the cumulative in-season numbers of flu illnesses, medical visits, hospitalizations, and deaths in the United States. CDC has estimated the burden of flu since 2010 using a mathematical model that is based on observed rates of laboratory-confirmed influenza-associated hospitalizations collected through a surveillance network that covers approximately 8.5% of the U.S. population (~27 million people).
The 2018-2019 flu season is the first season CDC has reported in-season burden estimates of flu in the U.S. These in-season estimates will be updated over the course of the flu season.
[h=3]Limitations[/h] The estimates of the cumulative burden of seasonal influenza are subject to several limitations.
First, the cumulative rate of laboratory-confirmed influenza-associated hospitalizations reported during the season may be an under-estimate of the rate at the end of the season because of identification and reporting delays.
Second, rates of laboratory-confirmed influenza-associated hospitalizations were adjusted for the frequency of influenza testing and the sensitivity of influenza diagnostic assays. However, data on testing practices during the 2018-2019 season are not available in real-time. CDC used data on testing practices from the 2014-2015 influenza season as a proxy. Burden estimates will be updated at a later date when data on contemporary testing practices become available.
Third, estimates of influenza-associated illness and medical visits are based on data from prior seasons, which may not be accurate if the seriousness of illness or patterns of care-seeking have changed.
[h=3]Frequently Asked Questions[/h] [h=4]What does the cumulative burden of influenza for the 2018-2019 season mean?[/h] The cumulative burden of influenza is an estimate of the number of people who have been sick, seen a healthcare provider, been hospitalized, or died as a result of influenza since October 01, 2018. CDC does not know the exact number of people who have been sick and affected by influenza because influenza is not a reportable disease in most areas of the United States. However, these numbers are estimated using a mathematical model, based on observed rates of laboratory-confirmed influenza-associated hospitalizations.
[h=4]How does CDC estimate the cumulative burden of seasonal influenza?[/h] Preliminary estimates of the cumulative burden of seasonal influenza during the 2018-2019 season in the United States are based on crude rates of laboratory-confirmed influenza-associated hospitalizations, reported through the Influenza Hospitalization Surveillance Network (FluSurv-NET), which were adjusted for the frequency of influenza testing during recent prior seasons and the sensitivity of influenza diagnostic assays. Rates of hospitalization were then multiplied by previously estimated ratio of hospitalizations to symptomatic illnesses, and frequency of seeking medical care to calculate symptomatic illnesses, medical visits, and deaths associated with seasonal influenza, respectively.
[h=4]Why does the estimate of cumulative burden change each week?[/h] The estimates of cumulative burden of seasonal influenza are considered preliminary and may change each week as new laboratory-confirmed influenza-associated hospitalizations are reported to CDC. New reports include both new admissions that have occurred during the reporting week and also patients admitted in previous weeks that have been newly reported to CDC.
[h=4]How does the number of flu hospitalizations estimated so far this season compare with previous end-of-season hospitalization estimates?[/h] The number of hospitalizations estimated so far this season is lower than end-of-season total hospitalization estimates for any season since CDC began making these estimates. This table also summarizes all estimated influenza disease burden, by season, in U.S. from 2010-11 through 2017-18.
[h=4]Preliminary Cumulative Estimates of Hospitalizations in the U.S. 2018-2019 Flu Season[/h]
*These estimates are preliminary and based on data from CDC?s weekly influenza surveillance reports summarizing key influenza activity indicators.
508 text for this chart:
Estimated number of influenza-associated hospitalizations
The y-axis extends from 0 to 1 million.
The x-axis is a timeline starting November 24 and extending to April 27.
There is a single blue-shaded curve labeled with ?2018/19?.
There are several other lines on the right side of the graph under Total hospitalizations at end of past seasons. The lines are labeled, from top to bottom, as 2017/18, 2014/15, 2016/17, 2012/13, 2013/14, 2015/16, 2010/11, and 2011/12.
Comparison of influenza death certificates Weeks 40 - 10 with corresponding period from previous years (note figures for 2018-19 are preliminary and are likely to increase)
2018-19: 3,540
2017-18: 13,327
2016-17: 4,802
2015-16: 1,418
2014-15: 7,134
2013-14: 3,760
2012-13: 4,119
[h=1]2018-2019 U.S. Flu Season: Preliminary Burden Estimates[/h] *These estimates are preliminary and based on data from CDC?s weekly influenza surveillance reports summarizing key influenza activity indicators.
[h=4]On This Page[/h]
This web page provides weekly preliminary estimates of the cumulative in-season numbers of flu illnesses, medical visits, hospitalizations, and deaths in the United States. CDC has estimated the burden of flu since 2010 using a mathematical model that is based on observed rates of laboratory-confirmed influenza-associated hospitalizations collected through a surveillance network that covers approximately 8.5% of the U.S. population (~27 million people).
The 2018-2019 flu season is the first season CDC has reported in-season burden estimates of flu in the U.S. These in-season estimates will be updated over the course of the flu season.
[h=3]Limitations[/h] The estimates of the cumulative burden of seasonal influenza are subject to several limitations.
First, the cumulative rate of laboratory-confirmed influenza-associated hospitalizations reported during the season may be an under-estimate of the rate at the end of the season because of identification and reporting delays.
Second, rates of laboratory-confirmed influenza-associated hospitalizations were adjusted for the frequency of influenza testing and the sensitivity of influenza diagnostic assays. However, data on testing practices during the 2018-2019 season are not available in real-time. CDC used data on testing practices from the 2014-2015 influenza season as a proxy. Burden estimates will be updated at a later date when data on contemporary testing practices become available.
Third, estimates of influenza-associated illness and medical visits are based on data from prior seasons, which may not be accurate if the seriousness of illness or patterns of care-seeking have changed.
[h=3]Frequently Asked Questions[/h] [h=4]What does the cumulative burden of influenza for the 2018-2019 season mean?[/h] The cumulative burden of influenza is an estimate of the number of people who have been sick, seen a healthcare provider, been hospitalized, or died as a result of influenza since October 01, 2018. CDC does not know the exact number of people who have been sick and affected by influenza because influenza is not a reportable disease in most areas of the United States. However, these numbers are estimated using a mathematical model, based on observed rates of laboratory-confirmed influenza-associated hospitalizations.
[h=4]How does CDC estimate the cumulative burden of seasonal influenza?[/h] Preliminary estimates of the cumulative burden of seasonal influenza during the 2018-2019 season in the United States are based on crude rates of laboratory-confirmed influenza-associated hospitalizations, reported through the Influenza Hospitalization Surveillance Network (FluSurv-NET), which were adjusted for the frequency of influenza testing during recent prior seasons and the sensitivity of influenza diagnostic assays. Rates of hospitalization were then multiplied by previously estimated ratio of hospitalizations to symptomatic illnesses, and frequency of seeking medical care to calculate symptomatic illnesses, medical visits, and deaths associated with seasonal influenza, respectively.
[h=4]Why does the estimate of cumulative burden change each week?[/h] The estimates of cumulative burden of seasonal influenza are considered preliminary and may change each week as new laboratory-confirmed influenza-associated hospitalizations are reported to CDC. New reports include both new admissions that have occurred during the reporting week and also patients admitted in previous weeks that have been newly reported to CDC.
[h=4]How does the number of flu hospitalizations estimated so far this season compare with previous end-of-season hospitalization estimates?[/h] The number of hospitalizations estimated so far this season is lower than end-of-season total hospitalization estimates for any season since CDC began making these estimates. This table also summarizes all estimated influenza disease burden, by season, in U.S. from 2010-11 through 2017-18.
[h=4]Preliminary Cumulative Estimates of Hospitalizations in the U.S. 2018-2019 Flu Season[/h]
*These estimates are preliminary and based on data from CDC?s weekly influenza surveillance reports summarizing key influenza activity indicators.
508 text for this chart:
Estimated number of influenza-associated hospitalizations
The y-axis extends from 0 to 1 million.
The x-axis is a timeline starting November 24 and extending to April 27.
There is a single blue-shaded curve labeled with ?2018/19?.
There are several other lines on the right side of the graph under Total hospitalizations at end of past seasons. The lines are labeled, from top to bottom, as 2017/18, 2014/15, 2016/17, 2012/13, 2013/14, 2015/16, 2010/11, and 2011/12.
Comparison of influenza death certificates Weeks 40 - 11 with corresponding period from previous years (note figures for 2018-19 are preliminary and are likely to increase)
2018-19: 3,997
2017-18: 13,769
2016-17: 5,178
2015-16: 1,769
2014-15: 7,273
2013-14: 3,853
2012-13: 4,228
2018-2019 U.S. Flu Season: Preliminary Burden Estimates
*These estimates are preliminary and based on data from CDC?s weekly influenza surveillance reports summarizing key influenza activity indicators.
[h=4]On This Page[/h]
This web page provides weekly preliminary estimates of the cumulative in-season numbers of flu illnesses, medical visits, hospitalizations, and deaths in the United States. CDC has estimated the burden of flu since 2010 using a mathematical model that is based on observed rates of laboratory-confirmed influenza-associated hospitalizations collected through a surveillance network that covers approximately 8.5% of the U.S. population (~27 million people).
The 2018-2019 flu season is the first season CDC has reported in-season burden estimates of flu in the U.S. These in-season estimates will be updated over the course of the flu season.
[h=3]Limitations[/h] The estimates of the cumulative burden of seasonal influenza are subject to several limitations.
First, the cumulative rate of laboratory-confirmed influenza-associated hospitalizations reported during the season may be an under-estimate of the rate at the end of the season because of identification and reporting delays.
Second, rates of laboratory-confirmed influenza-associated hospitalizations were adjusted for the frequency of influenza testing and the sensitivity of influenza diagnostic assays. However, data on testing practices during the 2018-2019 season are not available in real-time. CDC used data on testing practices from the 2014-2015 influenza season as a proxy. Burden estimates will be updated at a later date when data on contemporary testing practices become available.
Third, estimates of influenza-associated illness and medical visits are based on data from prior seasons, which may not be accurate if the seriousness of illness or patterns of care-seeking have changed.
[h=3]Frequently Asked Questions[/h] [h=4]What does the cumulative burden of influenza for the 2018-2019 season mean?[/h] The cumulative burden of influenza is an estimate of the number of people who have been sick, seen a healthcare provider, been hospitalized, or died as a result of influenza since October 01, 2018. CDC does not know the exact number of people who have been sick and affected by influenza because influenza is not a reportable disease in most areas of the United States. However, these numbers are estimated using a mathematical model, based on observed rates of laboratory-confirmed influenza-associated hospitalizations.
[h=4]How does CDC estimate the cumulative burden of seasonal influenza?[/h] Preliminary estimates of the cumulative burden of seasonal influenza during the 2018-2019 season in the United States are based on crude rates of laboratory-confirmed influenza-associated hospitalizations, reported through the Influenza Hospitalization Surveillance Network (FluSurv-NET), which were adjusted for the frequency of influenza testing during recent prior seasons and the sensitivity of influenza diagnostic assays. Rates of hospitalization were then multiplied by previously estimated ratio of hospitalizations to symptomatic illnesses, and frequency of seeking medical care to calculate symptomatic illnesses, medical visits, and deaths associated with seasonal influenza, respectively.
[h=4]Why does the estimate of cumulative burden change each week?[/h] The estimates of cumulative burden of seasonal influenza are considered preliminary and may change each week as new laboratory-confirmed influenza-associated hospitalizations are reported to CDC. New reports include both new admissions that have occurred during the reporting week and also patients admitted in previous weeks that have been newly reported to CDC.
[h=4]How does the number of flu hospitalizations estimated so far this season compare with previous end-of-season hospitalization estimates?[/h] The number of hospitalizations estimated so far this season is lower than end-of-season total hospitalization estimates for any season since CDC began making these estimates. This table also summarizes all estimated influenza disease burden, by season, in U.S. from 2010-11 through 2017-18.
[h=4]Preliminary Cumulative Estimates of Hospitalizations in the U.S. 2018-2019 Flu Season[/h]
*These estimates are preliminary and based on data from CDC?s weekly influenza surveillance reports summarizing key influenza activity indicators.
508 text for this chart:
Estimated number of influenza-associated hospitalizations
The y-axis extends from 0 to 1 million.
The x-axis is a timeline starting November 24 and extending to April 27.
There is a single blue-shaded curve labeled with ?2018/19?.
There are several other lines on the right side of the graph under Total hospitalizations at end of past seasons. The lines are labeled, from top to bottom, as 2017/18, 2014/15, 2016/17, 2012/13, 2013/14, 2015/16, 2010/11, and 2011/12. https://www.cdc.gov/flu/about/burden/preliminary-in-season-estimates.htm
Comparison of influenza death certificates Weeks 40 - 12 with corresponding period from previous years (note figures for 2018-19 are preliminary and are likely to increase)
2018-19: 4,446
2017-18: 14,115
2016-17: 5,497
2015-16: 2,064
2014-15: 7,394
2013-14: 3,927
2012-13: 4,311
2018-2019 U.S. Flu Season: Preliminary Burden Estimates
*These estimates are preliminary and based on data from CDC?s weekly influenza surveillance reports summarizing key influenza activity indicators.
[h=4]On This Page[/h]
This web page provides weekly preliminary estimates of the cumulative in-season numbers of flu illnesses, medical visits, hospitalizations, and deaths in the United States. CDC has estimated the burden of flu since 2010 using a mathematical model that is based on observed rates of laboratory-confirmed influenza-associated hospitalizations collected through a surveillance network that covers approximately 8.5% of the U.S. population (~27 million people).
The 2018-2019 flu season is the first season CDC has reported in-season burden estimates of flu in the U.S. These in-season estimates will be updated over the course of the flu season.
[h=3]Limitations[/h] The estimates of the cumulative burden of seasonal influenza are subject to several limitations.
First, the cumulative rate of laboratory-confirmed influenza-associated hospitalizations reported during the season may be an under-estimate of the rate at the end of the season because of identification and reporting delays.
Second, rates of laboratory-confirmed influenza-associated hospitalizations were adjusted for the frequency of influenza testing and the sensitivity of influenza diagnostic assays. However, data on testing practices during the 2018-2019 season are not available in real-time. CDC used data on testing practices from the 2014-2015 influenza season as a proxy. Burden estimates will be updated at a later date when data on contemporary testing practices become available.
Third, estimates of influenza-associated illness and medical visits are based on data from prior seasons, which may not be accurate if the seriousness of illness or patterns of care-seeking have changed.
[h=3]Frequently Asked Questions[/h] [h=4]What does the cumulative burden of influenza for the 2018-2019 season mean?[/h] The cumulative burden of influenza is an estimate of the number of people who have been sick, seen a healthcare provider, been hospitalized, or died as a result of influenza since October 01, 2018. CDC does not know the exact number of people who have been sick and affected by influenza because influenza is not a reportable disease in most areas of the United States. However, these numbers are estimated using a mathematical model, based on observed rates of laboratory-confirmed influenza-associated hospitalizations.
[h=4]How does CDC estimate the cumulative burden of seasonal influenza?[/h] Preliminary estimates of the cumulative burden of seasonal influenza during the 2018-2019 season in the United States are based on crude rates of laboratory-confirmed influenza-associated hospitalizations, reported through the Influenza Hospitalization Surveillance Network (FluSurv-NET), which were adjusted for the frequency of influenza testing during recent prior seasons and the sensitivity of influenza diagnostic assays. Rates of hospitalization were then multiplied by previously estimated ratio of hospitalizations to symptomatic illnesses, and frequency of seeking medical care to calculate symptomatic illnesses, medical visits, and deaths associated with seasonal influenza, respectively.
[h=4]Why does the estimate of cumulative burden change each week?[/h] The estimates of cumulative burden of seasonal influenza are considered preliminary and may change each week as new laboratory-confirmed influenza-associated hospitalizations are reported to CDC. New reports include both new admissions that have occurred during the reporting week and also patients admitted in previous weeks that have been newly reported to CDC.
[h=4]How does the number of flu hospitalizations estimated so far this season compare with previous end-of-season hospitalization estimates?[/h] The number of hospitalizations estimated so far this season is lower than end-of-season total hospitalization estimates for any season since CDC began making these estimates. This table also summarizes all estimated influenza disease burden, by season, in U.S. from 2010-11 through 2017-18.
[h=4]Preliminary Cumulative Estimates of Hospitalizations in the U.S. 2018-2019 Flu Season[/h]
*These estimates are preliminary and based on data from CDC?s weekly influenza surveillance reports summarizing key influenza activity indicators.
508 text for this chart:
Estimated number of influenza-associated hospitalizations
The y-axis extends from 0 to 1 million.
The x-axis is a timeline starting November 24 and extending to April 27.
There is a single blue-shaded curve labeled with ?2018/19?.
There are several other lines on the right side of the graph under Total hospitalizations at end of past seasons. The lines are labeled, from top to bottom, as 2017/18, 2014/15, 2016/17, 2012/13, 2013/14, 2015/16, 2010/11, and 2011/12. https://www.cdc.gov/flu/about/burden/preliminary-in-season-estimates.htm
Comparison of influenza death certificates Weeks 40 - 13 with corresponding period from previous years (note figures for 2018-19 are preliminary and are likely to increase)
2018-19: 4,910
2017-18: 14,437
2016-17: 5,825
2015-16: 2,346
2014-15: 7,491
2013-14: 3,992
2012-13: 4,367
2018-2019 U.S. Flu Season: Preliminary Burden Estimates *These estimates are preliminary and based on data from CDC?s weekly influenza surveillance reports summarizing key influenza activity indicators.
[h=4]On This Page[/h]
This web page provides weekly preliminary estimates of the cumulative in-season numbers of flu illnesses, medical visits, hospitalizations, and deaths in the United States. CDC has estimated the burden of flu since 2010 using a mathematical model that is based on observed rates of laboratory-confirmed influenza-associated hospitalizations collected through a surveillance network that covers approximately 8.5% of the U.S. population (~27 million people).
The 2018-2019 flu season is the first season CDC has reported in-season burden estimates of flu in the U.S. These in-season estimates will be updated over the course of the flu season.
[h=3]Limitations[/h] The estimates of the cumulative burden of seasonal influenza are subject to several limitations.
First, the cumulative rate of laboratory-confirmed influenza-associated hospitalizations reported during the season may be an under-estimate of the rate at the end of the season because of identification and reporting delays.
Second, rates of laboratory-confirmed influenza-associated hospitalizations were adjusted for the frequency of influenza testing and the sensitivity of influenza diagnostic assays. However, data on testing practices during the 2018-2019 season are not available in real-time. CDC used data on testing practices from the 2014-2015 influenza season as a proxy. Burden estimates will be updated at a later date when data on contemporary testing practices become available.
Third, estimates of influenza-associated illness and medical visits are based on data from prior seasons, which may not be accurate if the seriousness of illness or patterns of care-seeking have changed.
[h=3]Frequently Asked Questions[/h] [h=4]What does the cumulative burden of influenza for the 2018-2019 season mean?[/h] The cumulative burden of influenza is an estimate of the number of people who have been sick, seen a healthcare provider, been hospitalized, or died as a result of influenza since October 01, 2018. CDC does not know the exact number of people who have been sick and affected by influenza because influenza is not a reportable disease in most areas of the United States. However, these numbers are estimated using a mathematical model, based on observed rates of laboratory-confirmed influenza-associated hospitalizations.
[h=4]How does CDC estimate the cumulative burden of seasonal influenza?[/h] Preliminary estimates of the cumulative burden of seasonal influenza during the 2018-2019 season in the United States are based on crude rates of laboratory-confirmed influenza-associated hospitalizations, reported through the Influenza Hospitalization Surveillance Network (FluSurv-NET), which were adjusted for the frequency of influenza testing during recent prior seasons and the sensitivity of influenza diagnostic assays. Rates of hospitalization were then multiplied by previously estimated ratio of hospitalizations to symptomatic illnesses, and frequency of seeking medical care to calculate symptomatic illnesses, medical visits, and deaths associated with seasonal influenza, respectively.
[h=4]Why does the estimate of cumulative burden change each week?[/h] The estimates of cumulative burden of seasonal influenza are considered preliminary and may change each week as new laboratory-confirmed influenza-associated hospitalizations are reported to CDC. New reports include both new admissions that have occurred during the reporting week and also patients admitted in previous weeks that have been newly reported to CDC.
[h=4]How does the number of flu hospitalizations estimated so far this season compare with previous end-of-season hospitalization estimates?[/h] The number of hospitalizations estimated so far this season is lower than end-of-season total hospitalization estimates for any season since CDC began making these estimates. This table also summarizes all estimated influenza disease burden, by season, in U.S. from 2010-11 through 2017-18.
[h=4]Preliminary Cumulative Estimates of Hospitalizations in the U.S. 2018-2019 Flu Season[/h]
*These estimates are preliminary and based on data from CDC?s weekly influenza surveillance reports summarizing key influenza activity indicators.
508 text for this chart:
Estimated number of influenza-associated hospitalizations
The y-axis extends from 0 to 1 million.
The x-axis is a timeline starting November 24 and extending to April 27.
There is a single blue-shaded curve labeled with ?2018/19?.
There are several other lines on the right side of the graph under Total hospitalizations at end of past seasons. The lines are labeled, from top to bottom, as 2017/18, 2014/15, 2016/17, 2012/13, 2013/14, 2015/16, 2010/11, and 2011/12.
Comparison of influenza death certificates Weeks 40 - 14 with corresponding period from previous years (note figures for 2018-19 are preliminary and are likely to increase)
2018-19: 5,360
2017-18: 14,733
2016-17: 6,092
2015-16: 2,596
2014-15: 7,591
2013-14: 4,047
2012-13: 4,417
2018-2019 U.S. Flu Season: Preliminary Burden Estimates
*These estimates are preliminary and based on data from CDC?s weekly influenza surveillance reports summarizing key influenza activity indicators.
[h=4]On This Page[/h]
This web page provides weekly preliminary estimates of the cumulative in-season numbers of flu illnesses, medical visits, hospitalizations, and deaths in the United States. CDC has estimated the burden of flu since 2010 using a mathematical model that is based on observed rates of laboratory-confirmed influenza-associated hospitalizations collected through a surveillance network that covers approximately 8.5% of the U.S. population (~27 million people).
The 2018-2019 flu season is the first season CDC has reported in-season burden estimates of flu in the U.S. These in-season estimates will be updated over the course of the flu season.
[h=3]Limitations[/h] The estimates of the cumulative burden of seasonal influenza are subject to several limitations.
First, the cumulative rate of laboratory-confirmed influenza-associated hospitalizations reported during the season may be an under-estimate of the rate at the end of the season because of identification and reporting delays.
Second, rates of laboratory-confirmed influenza-associated hospitalizations were adjusted for the frequency of influenza testing and the sensitivity of influenza diagnostic assays. However, data on testing practices during the 2018-2019 season are not available in real-time. CDC used data on testing practices from the 2014-2015 influenza season as a proxy. Burden estimates will be updated at a later date when data on contemporary testing practices become available.
Third, estimates of influenza-associated illness and medical visits are based on data from prior seasons, which may not be accurate if the seriousness of illness or patterns of care-seeking have changed.
[h=3]Frequently Asked Questions[/h] [h=4]What does the cumulative burden of influenza for the 2018-2019 season mean?[/h] The cumulative burden of influenza is an estimate of the number of people who have been sick, seen a healthcare provider, been hospitalized, or died as a result of influenza since October 01, 2018. CDC does not know the exact number of people who have been sick and affected by influenza because influenza is not a reportable disease in most areas of the United States. However, these numbers are estimated using a mathematical model, based on observed rates of laboratory-confirmed influenza-associated hospitalizations.
[h=4]How does CDC estimate the cumulative burden of seasonal influenza?[/h] Preliminary estimates of the cumulative burden of seasonal influenza during the 2018-2019 season in the United States are based on crude rates of laboratory-confirmed influenza-associated hospitalizations, reported through the Influenza Hospitalization Surveillance Network (FluSurv-NET), which were adjusted for the frequency of influenza testing during recent prior seasons and the sensitivity of influenza diagnostic assays. Rates of hospitalization were then multiplied by previously estimated ratio of hospitalizations to symptomatic illnesses, and frequency of seeking medical care to calculate symptomatic illnesses, medical visits, and deaths associated with seasonal influenza, respectively.
[h=4]Why does the estimate of cumulative burden change each week?[/h] The estimates of cumulative burden of seasonal influenza are considered preliminary and may change each week as new laboratory-confirmed influenza-associated hospitalizations are reported to CDC. New reports include both new admissions that have occurred during the reporting week and also patients admitted in previous weeks that have been newly reported to CDC.
[h=4]How does the number of flu hospitalizations estimated so far this season compare with previous end-of-season hospitalization estimates?[/h] The number of hospitalizations estimated so far this season is lower than end-of-season total hospitalization estimates for any season since CDC began making these estimates. This table also summarizes all estimated influenza disease burden, by season, in U.S. from 2010-11 through 2017-18.
[h=4]Preliminary Cumulative Estimates of Hospitalizations in the U.S. 2018-2019 Flu Season[/h]
*These estimates are preliminary and based on data from CDC?s weekly influenza surveillance reports summarizing key influenza activity indicators.
508 text for this chart:
Estimated number of influenza-associated hospitalizations
The y-axis extends from 0 to 1 million.
The x-axis is a timeline starting November 24 and extending to April 27.
There is a single blue-shaded curve labeled with ?2018/19?.
There are several other lines on the right side of the graph under Total hospitalizations at end of past seasons. The lines are labeled, from top to bottom, as 2017/18, 2014/15, 2016/17, 2012/13, 2013/14, 2015/16, 2010/11, and 2011/12. https://www.cdc.gov/flu/about/burden/preliminary-in-season-estimates.htm
Comparison of influenza death certificates Weeks 40 - 15 with corresponding period from previous years (note figures for 2018-19 are preliminary and are likely to increase)
2018-19: 5,764
2017-18: 14,946
2016-17: 6,300
2015-16: 2,792
2014-15: 7,666
2013-14: 4,121
2012-13: 4,452
[h=1]2018-2019 U.S. Flu Season: Preliminary Burden Estimates[/h] [FONT="]Espa?ol
[FONT="] *These estimates are preliminary and based on data from CDC?s weekly influenza surveillance reports summarizing key influenza activity indicators.
On This Page
This web page provides weekly preliminary estimates of the cumulative in-season numbers of flu illnesses, medical visits, hospitalizations, and deaths in the United States. CDC has estimated the burden of flu since 2010 using a mathematical model that is based on observed rates of laboratory-confirmed influenza-associated hospitalizations collected through a surveillance network that covers approximately 8.5% of the U.S. population (~27 million people).
The 2018-2019 flu season is the first season CDC has reported in-season burden estimates of flu in the U.S. These in-season estimates will be updated over the course of the flu season.
[/FONT] [FONT="] [h=3]Limitations[/h] The estimates of the cumulative burden of seasonal influenza are subject to several limitations.
First, the cumulative rate of laboratory-confirmed influenza-associated hospitalizations reported during the season may be an under-estimate of the rate at the end of the season because of identification and reporting delays.
Second, rates of laboratory-confirmed influenza-associated hospitalizations were adjusted for the frequency of influenza testing and the sensitivity of influenza diagnostic assays. However, data on testing practices during the 2018-2019 season are not available in real-time. CDC used data on testing practices from the 2014-2015 influenza season as a proxy. Burden estimates will be updated at a later date when data on contemporary testing practices become available.
Third, estimates of influenza-associated illness and medical visits are based on data from prior seasons, which may not be accurate if the seriousness of illness or patterns of care-seeking have changed.
[h=3]Frequently Asked Questions[/h] [h=4]What does the cumulative burden of influenza for the 2018-2019 season mean?[/h] The cumulative burden of influenza is an estimate of the number of people who have been sick, seen a healthcare provider, been hospitalized, or died as a result of influenza since October 01, 2018. CDC does not know the exact number of people who have been sick and affected by influenza because influenza is not a reportable disease in most areas of the United States. However, these numbers are estimated using a mathematical model, based on observed rates of laboratory-confirmed influenza-associated hospitalizations.
[h=4]How does CDC estimate the cumulative burden of seasonal influenza?[/h] Preliminary estimates of the cumulative burden of seasonal influenza during the 2018-2019 season in the United States are based on crude rates of laboratory-confirmed influenza-associated hospitalizations, reported through the Influenza Hospitalization Surveillance Network (FluSurv-NET), which were adjusted for the frequency of influenza testing during recent prior seasons and the sensitivity of influenza diagnostic assays. Rates of hospitalization were then multiplied by previously estimated ratio of hospitalizations to symptomatic illnesses, and frequency of seeking medical care to calculate symptomatic illnesses, medical visits, and deaths associated with seasonal influenza, respectively.
[h=4]Why does the estimate of cumulative burden change each week?[/h] The estimates of cumulative burden of seasonal influenza are considered preliminary and may change each week as new laboratory-confirmed influenza-associated hospitalizations are reported to CDC. New reports include both new admissions that have occurred during the reporting week and also patients admitted in previous weeks that have been newly reported to CDC.
[h=4]How does the number of flu hospitalizations estimated so far this season compare with previous end-of-season hospitalization estimates?[/h] The number of hospitalizations estimated so far this season is lower than end-of-season total hospitalization estimates for any season since CDC began making these estimates. This table also summarizes all estimated influenza disease burden, by season, in U.S. from 2010-11 through 2017-18.
[/FONT] [FONT="] [h=4]Preliminary Cumulative Estimates of Hospitalizations in the U.S. 2018-2019 Flu Season[/h]
*These estimates are preliminary and based on data from CDC?s weekly influenza surveillance reports summarizing key influenza activity indicators.
508 text for this chart:
Estimated number of influenza-associated hospitalizations
The y-axis extends from 0 to 1 million.
The x-axis is a timeline starting November 24 and extending to April 27.
There is a single blue-shaded curve labeled with ?2018/19?.
There are several other lines on the right side of the graph under Total hospitalizations at end of past seasons. The lines are labeled, from top to bottom, as 2017/18, 2014/15, 2016/17, 2012/13, 2013/14, 2015/16, 2010/11, and 2011/12. https://www.cdc.gov/flu/about/burden/preliminary-in-season-estimates.htm
Comparison of influenza death certificates Weeks 40 - 15 with corresponding period from previous years (note figures for 2018-19 are preliminary and are likely to increase)
2018-19: 5,999
2017-18: 15,096
2016-17: 6,463
2015-16: 2,940
2014-15: 7,729
2013-14: 4,176
2012-13: 4,474
[h=1]2018-2019 U.S. Flu Season: Preliminary Burden Estimates[/h] [FONT="]Espa?ol
[FONT="] *These estimates are preliminary and based on data from CDC?s weekly influenza surveillance reports summarizing key influenza activity indicators.
On This Page
This web page provides weekly preliminary estimates of the cumulative in-season numbers of flu illnesses, medical visits, hospitalizations, and deaths in the United States. CDC has estimated the burden of flu since 2010 using a mathematical model that is based on observed rates of laboratory-confirmed influenza-associated hospitalizations collected through a surveillance network that covers approximately 8.5% of the U.S. population (~27 million people).
The 2018-2019 flu season is the first season CDC has reported in-season burden estimates of flu in the U.S. These in-season estimates will be updated over the course of the flu season.
[/FONT] [FONT="] [h=3]Limitations[/h] The estimates of the cumulative burden of seasonal influenza are subject to several limitations.
First, the cumulative rate of laboratory-confirmed influenza-associated hospitalizations reported during the season may be an under-estimate of the rate at the end of the season because of identification and reporting delays.
Second, rates of laboratory-confirmed influenza-associated hospitalizations were adjusted for the frequency of influenza testing and the sensitivity of influenza diagnostic assays. However, data on testing practices during the 2018-2019 season are not available in real-time. CDC used data on testing practices from the 2014-2015 influenza season as a proxy. Burden estimates will be updated at a later date when data on contemporary testing practices become available.
Third, estimates of influenza-associated illness and medical visits are based on data from prior seasons, which may not be accurate if the seriousness of illness or patterns of care-seeking have changed.
[h=3]Frequently Asked Questions[/h] [h=4]What does the cumulative burden of influenza for the 2018-2019 season mean?[/h] The cumulative burden of influenza is an estimate of the number of people who have been sick, seen a healthcare provider, been hospitalized, or died as a result of influenza since October 01, 2018. CDC does not know the exact number of people who have been sick and affected by influenza because influenza is not a reportable disease in most areas of the United States. However, these numbers are estimated using a mathematical model, based on observed rates of laboratory-confirmed influenza-associated hospitalizations.
[h=4]How does CDC estimate the cumulative burden of seasonal influenza?[/h] Preliminary estimates of the cumulative burden of seasonal influenza during the 2018-2019 season in the United States are based on crude rates of laboratory-confirmed influenza-associated hospitalizations, reported through the Influenza Hospitalization Surveillance Network (FluSurv-NET), which were adjusted for the frequency of influenza testing during recent prior seasons and the sensitivity of influenza diagnostic assays. Rates of hospitalization were then multiplied by previously estimated ratio of hospitalizations to symptomatic illnesses, and frequency of seeking medical care to calculate symptomatic illnesses, medical visits, and deaths associated with seasonal influenza, respectively.
[h=4]Why does the estimate of cumulative burden change each week?[/h] The estimates of cumulative burden of seasonal influenza are considered preliminary and may change each week as new laboratory-confirmed influenza-associated hospitalizations are reported to CDC. New reports include both new admissions that have occurred during the reporting week and also patients admitted in previous weeks that have been newly reported to CDC.
[h=4]How does the number of flu hospitalizations estimated so far this season compare with previous end-of-season hospitalization estimates?[/h] The number of hospitalizations estimated so far this season is lower than end-of-season total hospitalization estimates for any season since CDC began making these estimates. This table also summarizes all estimated influenza disease burden, by season, in U.S. from 2010-11 through 2017-18.
[/FONT] [FONT="] [h=4]Preliminary Cumulative Estimates of Hospitalizations in the U.S. 2018-2019 Flu Season[/h]
*These estimates are preliminary and based on data from CDC?s weekly influenza surveillance reports summarizing key influenza activity indicators.
508 text for this chart:
Estimated number of influenza-associated hospitalizations
The y-axis extends from 0 to 1 million.
The x-axis is a timeline starting November 24 and extending to April 27.
There is a single blue-shaded curve labeled with ?2018/19?.
There are several other lines on the right side of the graph under Total hospitalizations at end of past seasons. The lines are labeled, from top to bottom, as 2017/18, 2014/15, 2016/17, 2012/13, 2013/14, 2015/16, 2010/11, and 2011/12. https://www.cdc.gov/flu/about/burden/preliminary-in-season-estimates.htm