Install the app
How to install the app on iOS
Follow along with the video below to see how to install our site as a web app on your home screen.
Note: This feature may not be available in some browsers.
-
FluTrackers.com Inc. does not provide medical advice. Information on this web site is collected from various internet resources, and the FluTrackers board of directors makes no warranty to the safety, efficacy, correctness or completeness of the information posted on this site by any author or poster. The information collated here is for instructional and/or discussion purposes only and is NOT intended to diagnose or treat any disease, illness, or other medical condition. Every individual reader or poster should seek advice from their personal physician/healthcare practitioner before considering or using any interventions that are discussed on this website. By continuing to access this website you agree to consult your personal physican before using any interventions posted on this website, and you agree to hold harmless FluTrackers.com Inc., the board of directors, the members, and all authors and posters for any effects from use of any medication, supplement, vitamin or other substance, device, intervention, etc. mentioned in posts on this website, or other internet venues referenced in posts on this website.
-
We are not asking for any donations. Do not donate to any entity who says they are raising funds for us.
You are using an out of date browser. It may not display this or other websites correctly.
You should upgrade or use an alternative browser.
You should upgrade or use an alternative browser.
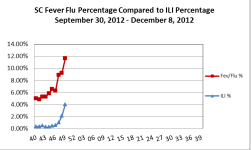
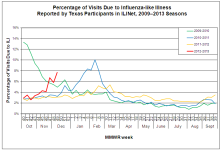
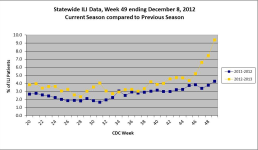
2012-13 Selected Flu Indicator Charts - Through Week 52
- Thread starter JimO
- Start date
Laidback Al
Well-known member
Re: Selected Flu Indicator Charts
Re: Selected Flu Indicator Charts
Thanks for posting these charts, JimO.
Links to all of the USA states influenza surveillance reports and data for Week 49 can be found at this CDC link: http://www.cdc.gov/flu/weekly/
<object style="position:absolute;z-index:1000" type="application/x-dgnria" id="plugin0" height="0" width="0">
</object>
Re: Selected Flu Indicator Charts
Thanks for posting these charts, JimO.
Links to all of the USA states influenza surveillance reports and data for Week 49 can be found at this CDC link: http://www.cdc.gov/flu/weekly/
<object style="position:absolute;z-index:1000" type="application/x-dgnria" id="plugin0" height="0" width="0">
</object>

JimO
Well-known member
Re: Selected Flu Indicator Charts
Re: Selected Flu Indicator Charts
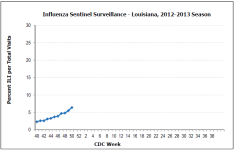
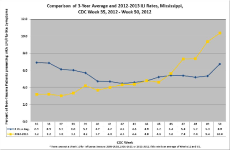
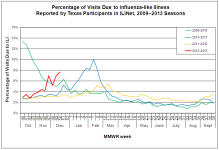
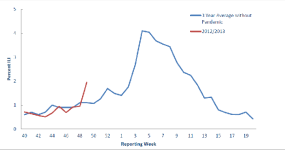
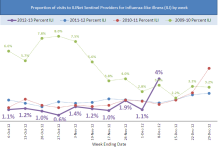
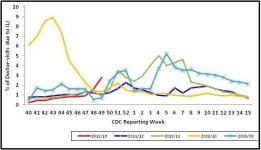
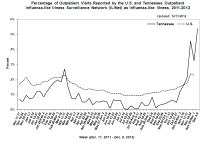
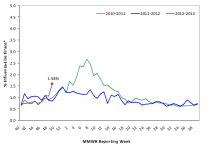
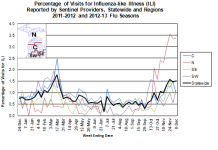
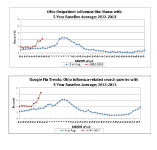
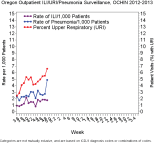
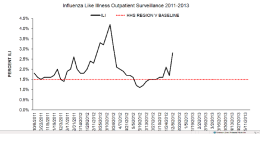
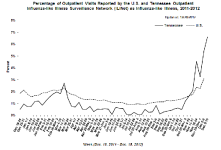
Here are a few more. It's difficult to post links because some are screen captures that I have to resize in Paint. All are from State Health Dept. websites.
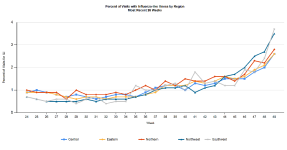
I must say that since I started following FluTrackers in the spring of 2009, I haven't seen so many ILI charts show sharp increases in the same 2 week period. I fear that we will start to see a sharp increase in hospitalizations nationally by the end of December.
Indiana
Maryland
Pennsylvania
Tennessee
Re: Selected Flu Indicator Charts
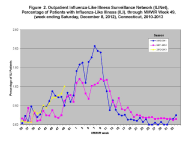
Here are a few more. It's difficult to post links because some are screen captures that I have to resize in Paint. All are from State Health Dept. websites.
I must say that since I started following FluTrackers in the spring of 2009, I haven't seen so many ILI charts show sharp increases in the same 2 week period. I fear that we will start to see a sharp increase in hospitalizations nationally by the end of December.
Indiana
Maryland
Pennsylvania
Tennessee
Re: Selected Flu Indicator Charts
Re: Selected Flu Indicator Charts
View attachment Flu Trends December 17 2012.pdf
The information is specific to Georgia and Tennessee. Interesting comparison considering both are experiencing high ILI based on Google flu trends, but hospitalization rate is, thus far, different considerably.
Re: Selected Flu Indicator Charts
View attachment Flu Trends December 17 2012.pdf
The information is specific to Georgia and Tennessee. Interesting comparison considering both are experiencing high ILI based on Google flu trends, but hospitalization rate is, thus far, different considerably.
JimO
Well-known member
Re: Selected Flu Indicator Charts
Re: Selected Flu Indicator Charts
Thanks for the link - it's fascinating that Google Trends does follow the other indicators very closely. Trends on Google probably show up a few weeks earlier than hospitalizations. I find that Google Trends are a very early indicator. Hospitalizations and fatalies are trailing indicators. Sadly, we will likely see spikes in fatalities in January and February.
Re: Selected Flu Indicator Charts
Thanks for the link - it's fascinating that Google Trends does follow the other indicators very closely. Trends on Google probably show up a few weeks earlier than hospitalizations. I find that Google Trends are a very early indicator. Hospitalizations and fatalies are trailing indicators. Sadly, we will likely see spikes in fatalities in January and February.
View attachment 15482
The information is specific to Georgia and Tennessee. Interesting comparison considering both are experiencing high ILI based on Google flu trends, but hospitalization rate is, thus far, different considerably.
JimO
Well-known member
Re: Selected Flu Indicator Charts
Re: Selected Flu Indicator Charts
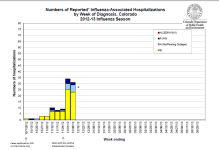
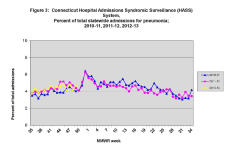
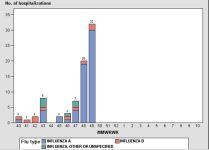
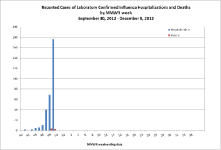
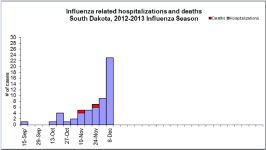
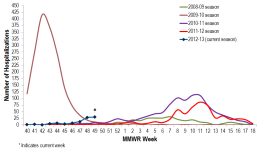
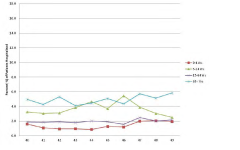
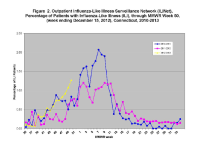
I pulled the following charts showing hospitalizations in several states:
Colorado
Connecticut
Iowa
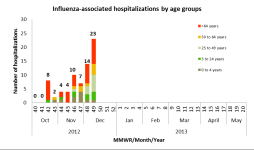
Maryland
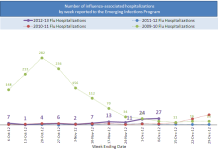
New York
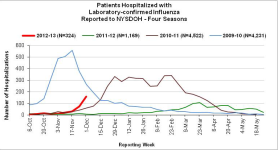
Oklahoma
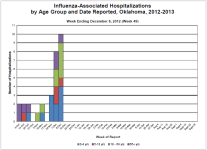
Pennsylvania
South Carolina
South Dakota
Re: Selected Flu Indicator Charts
I pulled the following charts showing hospitalizations in several states:
Colorado
Connecticut
Iowa
Maryland
New York
Oklahoma
Pennsylvania
South Carolina
South Dakota
Attachments
Re: Selected Flu Indicator Charts
Re: Selected Flu Indicator Charts
Not seeing any of this in California, as of yet! We are seeing much RSV, but not Influenza.
ILI can be from many things other than Influenza? Google Flu Trends has not even updated since the 11th of December! I do not know if they are a good barometer either .
I will put our link on which I should have done so that you can see the comparison!
I believe that the MIdwest is seeing more ILI's due to the drought conditions and weather patterns.
http://www.cdph.ca.gov/HealthInfo/discond/Documents/Final_FluReport_Ending_120812.pdf
Re: Selected Flu Indicator Charts
Not seeing any of this in California, as of yet! We are seeing much RSV, but not Influenza.
ILI can be from many things other than Influenza? Google Flu Trends has not even updated since the 11th of December! I do not know if they are a good barometer either .
I will put our link on which I should have done so that you can see the comparison!
I believe that the MIdwest is seeing more ILI's due to the drought conditions and weather patterns.
http://www.cdph.ca.gov/HealthInfo/discond/Documents/Final_FluReport_Ending_120812.pdf
Last edited:
Re: Selected Flu Indicator Charts
Re: Selected Flu Indicator Charts
Whilst there isnt any hard data I can quote giving the percentage of flu sufferers who go on to develop secondary problems, in general, it is well recognised (i.e there are a lot of studies) that a large proportion of hospitalisations from flu are as a result of secondary sequelae i.e pneumonia and exacerbation of CV problems from reduced lung function. On the basis of these assumptions, it should be expected that there would be a 7 - 14 day lag time between flu trends data and hospitalisation data, if we assume that onset of flu like symptoms occurs first i.e symptomatic with flu for approximately 3 - 5 days with secondary infections developing thereafter. |It would take a few days of bacterial infection (in many cases) before patients became sufficiently ill to warrant hospitalistion - although there would always be exceptions.
Just a rough approximation.
Re: Selected Flu Indicator Charts
Whilst there isnt any hard data I can quote giving the percentage of flu sufferers who go on to develop secondary problems, in general, it is well recognised (i.e there are a lot of studies) that a large proportion of hospitalisations from flu are as a result of secondary sequelae i.e pneumonia and exacerbation of CV problems from reduced lung function. On the basis of these assumptions, it should be expected that there would be a 7 - 14 day lag time between flu trends data and hospitalisation data, if we assume that onset of flu like symptoms occurs first i.e symptomatic with flu for approximately 3 - 5 days with secondary infections developing thereafter. |It would take a few days of bacterial infection (in many cases) before patients became sufficiently ill to warrant hospitalistion - although there would always be exceptions.
Just a rough approximation.
Re: Selected Flu Indicator Charts
Re: Selected Flu Indicator Charts
Google Flu Trends data is now in for the period up to and including the 16th December, and is worth a look to compare and contrast to the graphs above. Sorry JimO - I dont know how to embed these...
http://www.google.org/flutrends/us/#US
For those unfamiliar with this data, Flu Trends is simply a measure of online searches for flu and flu related terms e.g. flu symptoms, flu treatments etc. It does not provide any indication of severity ( hospitalisation data and GP consultations give a better indication of this). It is more likely to reflect the numbers of individuals who are symptomatic and needing to take medications for symptomatic relief of cold, flu or other respiratory viruses e.g. paracetomol.
Simply click on a state to see the trends for an individual state - the link above takes you to an overview of the US.
Also of note that flu trends data will include all ILIs - and it wont necessarily all be flu, but would include coughs, colds and other respiratory viruses. That said, the SE states of the US would appear to be suffering a higher incidence of influenza like illnesses right now than during the peak of the 2009 pandemic. Areas under the curve look greater than the entire 2009 - 2010 season in these south eastern states.
Re: Selected Flu Indicator Charts
Google Flu Trends data is now in for the period up to and including the 16th December, and is worth a look to compare and contrast to the graphs above. Sorry JimO - I dont know how to embed these...
http://www.google.org/flutrends/us/#US
For those unfamiliar with this data, Flu Trends is simply a measure of online searches for flu and flu related terms e.g. flu symptoms, flu treatments etc. It does not provide any indication of severity ( hospitalisation data and GP consultations give a better indication of this). It is more likely to reflect the numbers of individuals who are symptomatic and needing to take medications for symptomatic relief of cold, flu or other respiratory viruses e.g. paracetomol.
Simply click on a state to see the trends for an individual state - the link above takes you to an overview of the US.
Also of note that flu trends data will include all ILIs - and it wont necessarily all be flu, but would include coughs, colds and other respiratory viruses. That said, the SE states of the US would appear to be suffering a higher incidence of influenza like illnesses right now than during the peak of the 2009 pandemic. Areas under the curve look greater than the entire 2009 - 2010 season in these south eastern states.
JimO
Well-known member
Re: Selected Flu Indicator Charts
Re: Selected Flu Indicator Charts
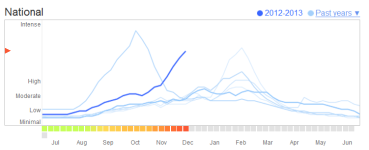
Thanks Vibrant. Here is the Google Trends National chart. I'll be posting state ILI charts for Week 50 soon. Based on the trajectory of the data for this year compared with others, it's going to be a really rough flu season.
Re: Selected Flu Indicator Charts
Thanks Vibrant. Here is the Google Trends National chart. I'll be posting state ILI charts for Week 50 soon. Based on the trajectory of the data for this year compared with others, it's going to be a really rough flu season.
JimO
Well-known member
Re: Selected Flu Indicator Charts
Re: Selected Flu Indicator Charts
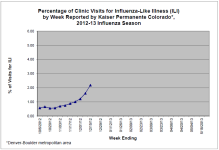
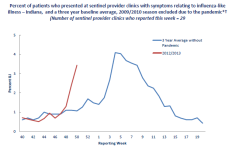
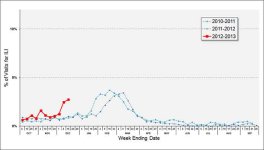
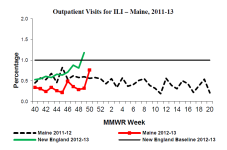
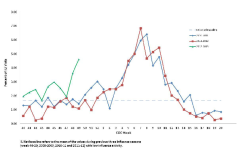
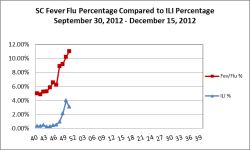
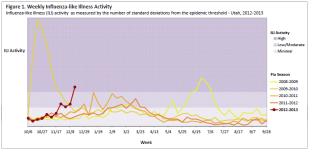
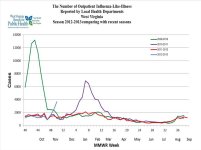
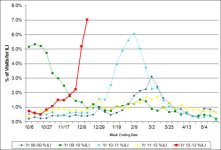
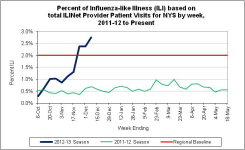
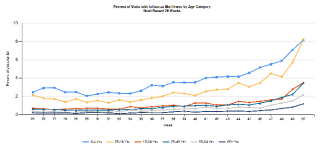
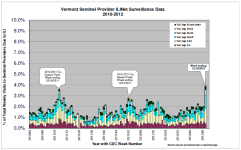
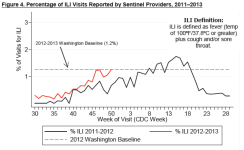
Week 50 ILI Charts
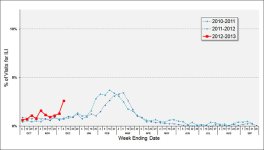
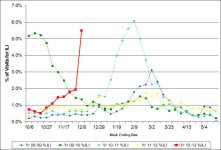
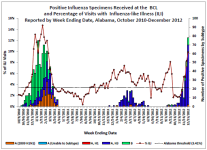
It seems to be the same story all over, with the South and Midwest a week or two ahead of the rest of the country. The season seems to be shaping up to be the worst overall flu season in a decade. It is still to be seen if the H3N2 that is dominant in most places will be as deadly as the 2009pdmH1N1 in 2009-10. More to follow.
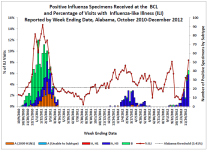
Alabama
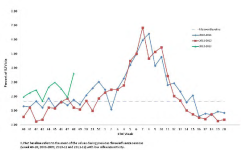
Colorado
Indiana
Kansas
Maine
Re: Selected Flu Indicator Charts
Week 50 ILI Charts
It seems to be the same story all over, with the South and Midwest a week or two ahead of the rest of the country. The season seems to be shaping up to be the worst overall flu season in a decade. It is still to be seen if the H3N2 that is dominant in most places will be as deadly as the 2009pdmH1N1 in 2009-10. More to follow.
Alabama
Colorado
Indiana
Kansas
Maine
Missouriwatcher
Editor, Senior Moderator
Re: Selected Flu Indicator Charts
Re: Selected Flu Indicator Charts
The system isn't consistent, even though it's spelled out. Here are two examples: Vermont should at least be listed as LOCAL, and possibly REGIONAL. Missouri should be listed as WIDESPREAD. Consequently, National data is flawed in reporting.
Vermont ILI doubled from last week, ED ILI well over maximum compared to other seasons and positive labs, yet only report SPORADIC.
http://healthvermont.gov/prevent/flu/flusurveillance.aspx#activity
CDC definition:
Sporadic: Small numbers of laboratory-confirmed influenza cases or a single laboratory-confirmed influenza outbreak has been reported, but there is no increase in cases of ILI.
Local: Outbreaks of influenza or increases in ILI cases and recent laboratory-confirmed influenza in a single region of the state.
Missouri ILI is nearly three times its baseline (ILI in some areas has been in double digits), positive labs throughout the state and closures, yet only REGIONAL.
http://health.mo.gov/living/healthcondiseases/communicable/influenza/reports.php
CDC definition: Widespread: Outbreaks of influenza or increases in ILI cases and recent laboratory-confirmed influenza in at least half the regions of the state with recent laboratory evidence of influenza in the state.
http://www.cdc.gov/flu/weekly/overview.htm#Summary
Re: Selected Flu Indicator Charts
The system isn't consistent, even though it's spelled out. Here are two examples: Vermont should at least be listed as LOCAL, and possibly REGIONAL. Missouri should be listed as WIDESPREAD. Consequently, National data is flawed in reporting.
Vermont ILI doubled from last week, ED ILI well over maximum compared to other seasons and positive labs, yet only report SPORADIC.
http://healthvermont.gov/prevent/flu/flusurveillance.aspx#activity
CDC definition:
Sporadic: Small numbers of laboratory-confirmed influenza cases or a single laboratory-confirmed influenza outbreak has been reported, but there is no increase in cases of ILI.
Local: Outbreaks of influenza or increases in ILI cases and recent laboratory-confirmed influenza in a single region of the state.
Missouri ILI is nearly three times its baseline (ILI in some areas has been in double digits), positive labs throughout the state and closures, yet only REGIONAL.
http://health.mo.gov/living/healthcondiseases/communicable/influenza/reports.php
CDC definition: Widespread: Outbreaks of influenza or increases in ILI cases and recent laboratory-confirmed influenza in at least half the regions of the state with recent laboratory evidence of influenza in the state.
http://www.cdc.gov/flu/weekly/overview.htm#Summary
Re: Selected Flu Indicator Charts
Re: Selected Flu Indicator Charts
Is it possible that they apply this definition according to geographical incidence e.g. if there was a very high incidence in one city only (to produce the observed data) and almost no flu elsewhere, it could then be described as sporadic. However, to produce such data as a result of a localised infection would require a massive attack rate.
Re: Selected Flu Indicator Charts
Is it possible that they apply this definition according to geographical incidence e.g. if there was a very high incidence in one city only (to produce the observed data) and almost no flu elsewhere, it could then be described as sporadic. However, to produce such data as a result of a localised infection would require a massive attack rate.
JimO
Well-known member
Re: Selected Flu Indicator Charts
Re: Selected Flu Indicator Charts
With the widespread nature and severity of flu going into the Christmas and New Year weekends and the severe winter storms, it might be a tough couple of weeks and the data will likely sparse until mid-January.
Here are a few more Week 50 ILI charts:
Massachusetts
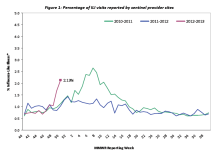
Minnesota (School ILI rates)
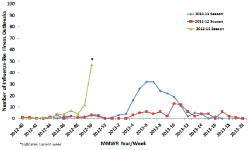
Ohio
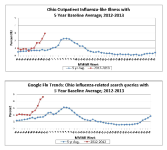
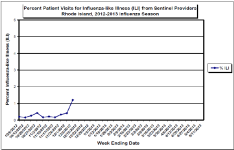
Rhode Island
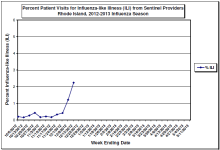
Re: Selected Flu Indicator Charts
With the widespread nature and severity of flu going into the Christmas and New Year weekends and the severe winter storms, it might be a tough couple of weeks and the data will likely sparse until mid-January.
Here are a few more Week 50 ILI charts:
Massachusetts
Minnesota (School ILI rates)
Ohio
Rhode Island