Announcement

Collapse
No announcement yet.

US FluView - Weekly Surveillance Flu report 2023/2024 season - for trend analysis

Collapse
X
 
  • Filter
  • Time
  • Show
Clear All
new posts

  • #16
    Weekly U.S. Influenza Surveillance Report


    Print
    Updated February 9, 2024

    Key Updates for Week 5, ending February 3, 2024

    Seasonal influenza activity remains elevated nationally with increases in some parts of the country. Viruses


    Clinical Lab 15.8%

    (Trend )


    positive for influenza
    this week


    Public Health Lab
    The most frequently reported influenza viruses this week were influenza A(H1N1)pdm09.

    Virus Characterization
    Genetic and antigenic characterization and antiviral susceptibility are summarized in this report. Illness


    Outpatient Respiratory Illness 4.4%

    (Trend )


    of visits to a health care provider this week were for respiratory illness
    (above baseline).


    Outpatient Respiratory Illness: Activity Map
    This week 11 jurisdictions experienced moderate activity and 25 jurisdictions experienced high or very high activity.

    FluSurv-NET 51.5 per 100,000


    cumulative hospitalization rate.

    NHSN Hospitalizations 11,073 (Trend )


    patients admitted to hospitals with influenza this week.

    NCHS Mortality 0.8%

    (Trend )


    of deaths attributed to influenza this week.

    Pediatric Deaths 8


    influenza-associated deaths were reported
    this week for a total of 74 deaths this season.


    All data are preliminary and may change as more reports are received.

    Directional arrows indicate changes between the current week and the previous week. Additional information on the arrows can be found at the bottom of this page.

    A description of the CDC influenza surveillance system, including methodology and detailed descriptions of each data component is available on the surveillance methods page.

    Additional information on the current and previous influenza seasons for each surveillance component are available on FluView Interactive.

    Key Points
    • Seasonal influenza activity remains elevated nationally with increases in some parts of the country, particularly regions 5 and 7.
    • Nationally, percent positivity for influenza overall remained stable. However, percent positivity for influenza A decreased slightly and percent positivity for influenza B increased slightly, driven primarily by activity in regions 5 and 7.
    • Outpatient respiratory illness has been above baseline1 nationally since November and is above baseline in all 10 HHS regions.
    • The number of weekly flu hospital admissions decreased slightly compared to last week.
    • During Week 5, of the 819 viruses reported by public health laboratories, 623 (76.1%) were influenza A and 196 (23.9%) were influenza B. Of the 400 influenza A viruses subtyped during Week 5, 270 (67.5%) were influenza A(H1N1) and 130 (32.5%) were A(H3N2).
    • Eight influenza-associated pediatric deaths were reported during Week 5, bringing the 2023-2024 season total to 74 pediatric deaths.
    • CDC estimates that there have been at least 22 million illnesses, 250,000 hospitalizations, and 15,000 deaths from flu so far this season.
    • CDC recommends that everyone 6 months and older get an annual flu vaccine as long as influenza viruses are spreading.2 Vaccination can still provide benefit this season.
    • There also are prescription flu antiviral drugs that can treat flu illness; those should be started as early as possible and are especially important for higher risk patients.3
    • Flu viruses are among several viruses contributing to respiratory disease activity. CDC is providing updated, integrated information about COVID-19, flu, and RSV activity on a weekly basis.
    U.S. Virologic Surveillance


    Nationally, the percentage of respiratory specimens testing positive for influenza in clinical laboratories remained stable (change of <0.5 percentage points) compared to the previous week, but trends varied by region. Regions 3, 5, and 7 reported an increase in percent positivity, Region 1 remained stable and regions 2, 4, 6, 8, 9, and 10 reported a decrease. The regions with the highest percent positivity were regions 6 (29.5%), 7 (20.7%), 8 (18.4%), and 5 (18.1%). Since Week 40, influenza A(H1N1)pdm09 has been the predominant virus circulating in all regions. However, the distribution of circulating viruses varies by region, particularly in regions 5 and 7 where influenza B activity has been increasing. For regional and state level data and age group distribution, please visit FluView Interactive. Viruses known to be associated with recent receipt of live attenuated influenza vaccine (LAIV) or found upon further testing to be a vaccine virus are not included, as they are not circulating influenza viruses. Clinical Laboratories


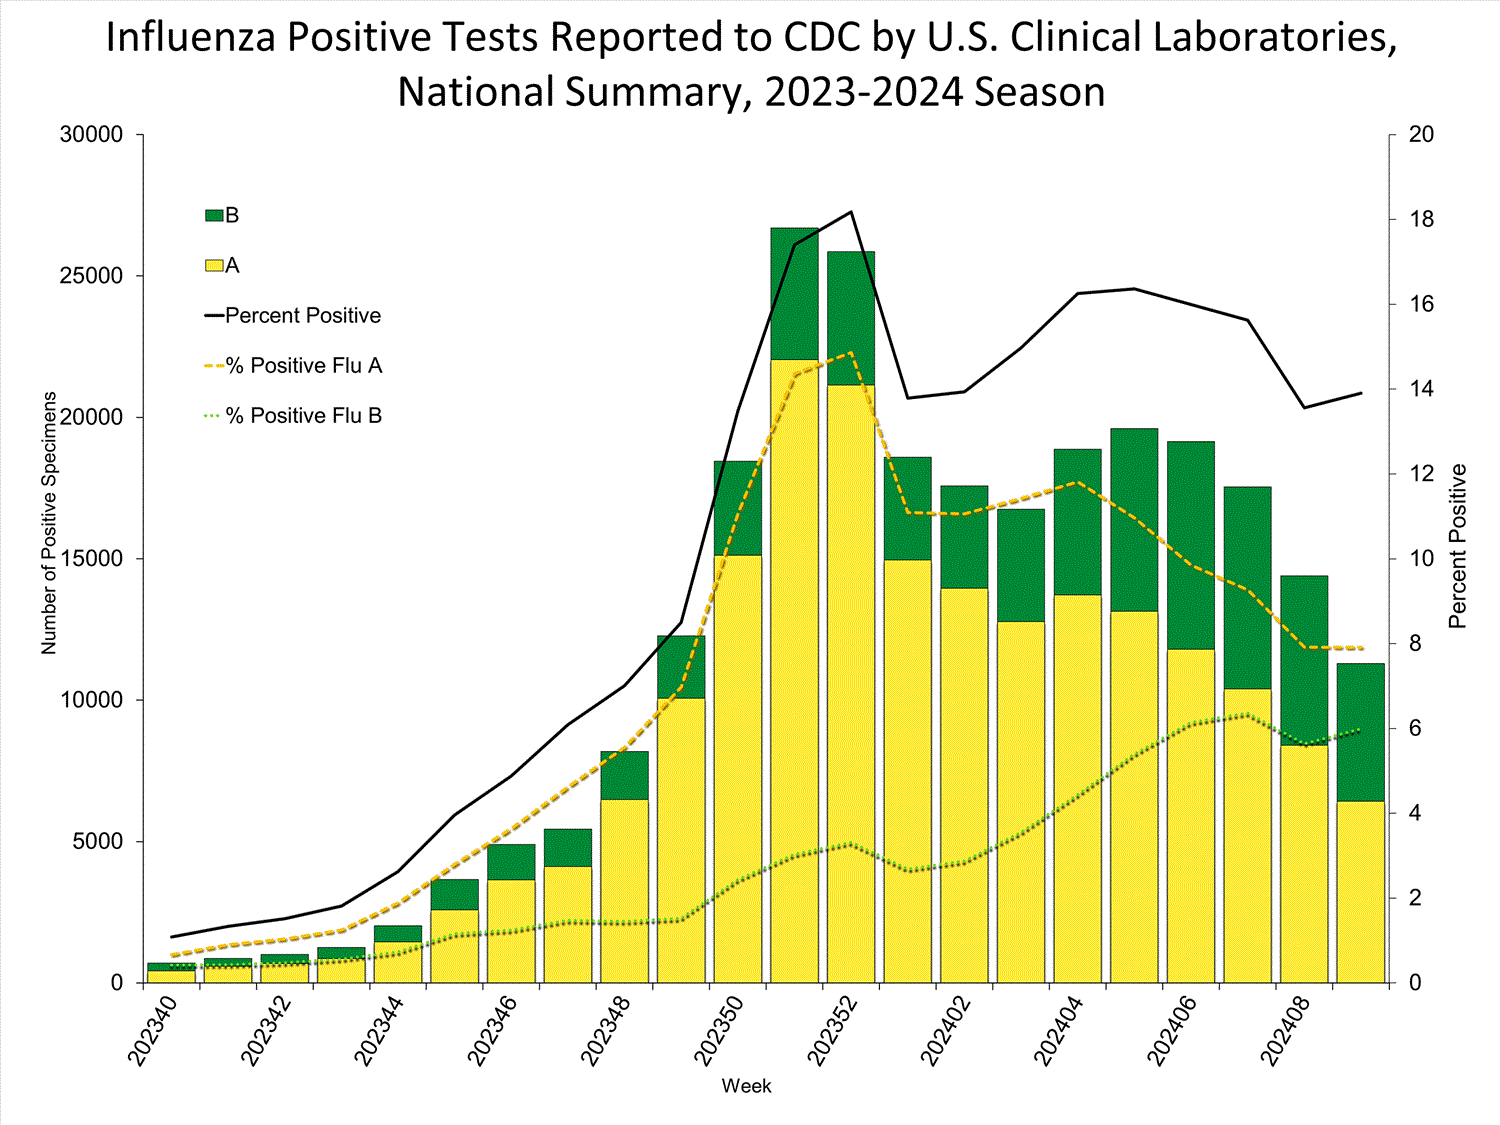
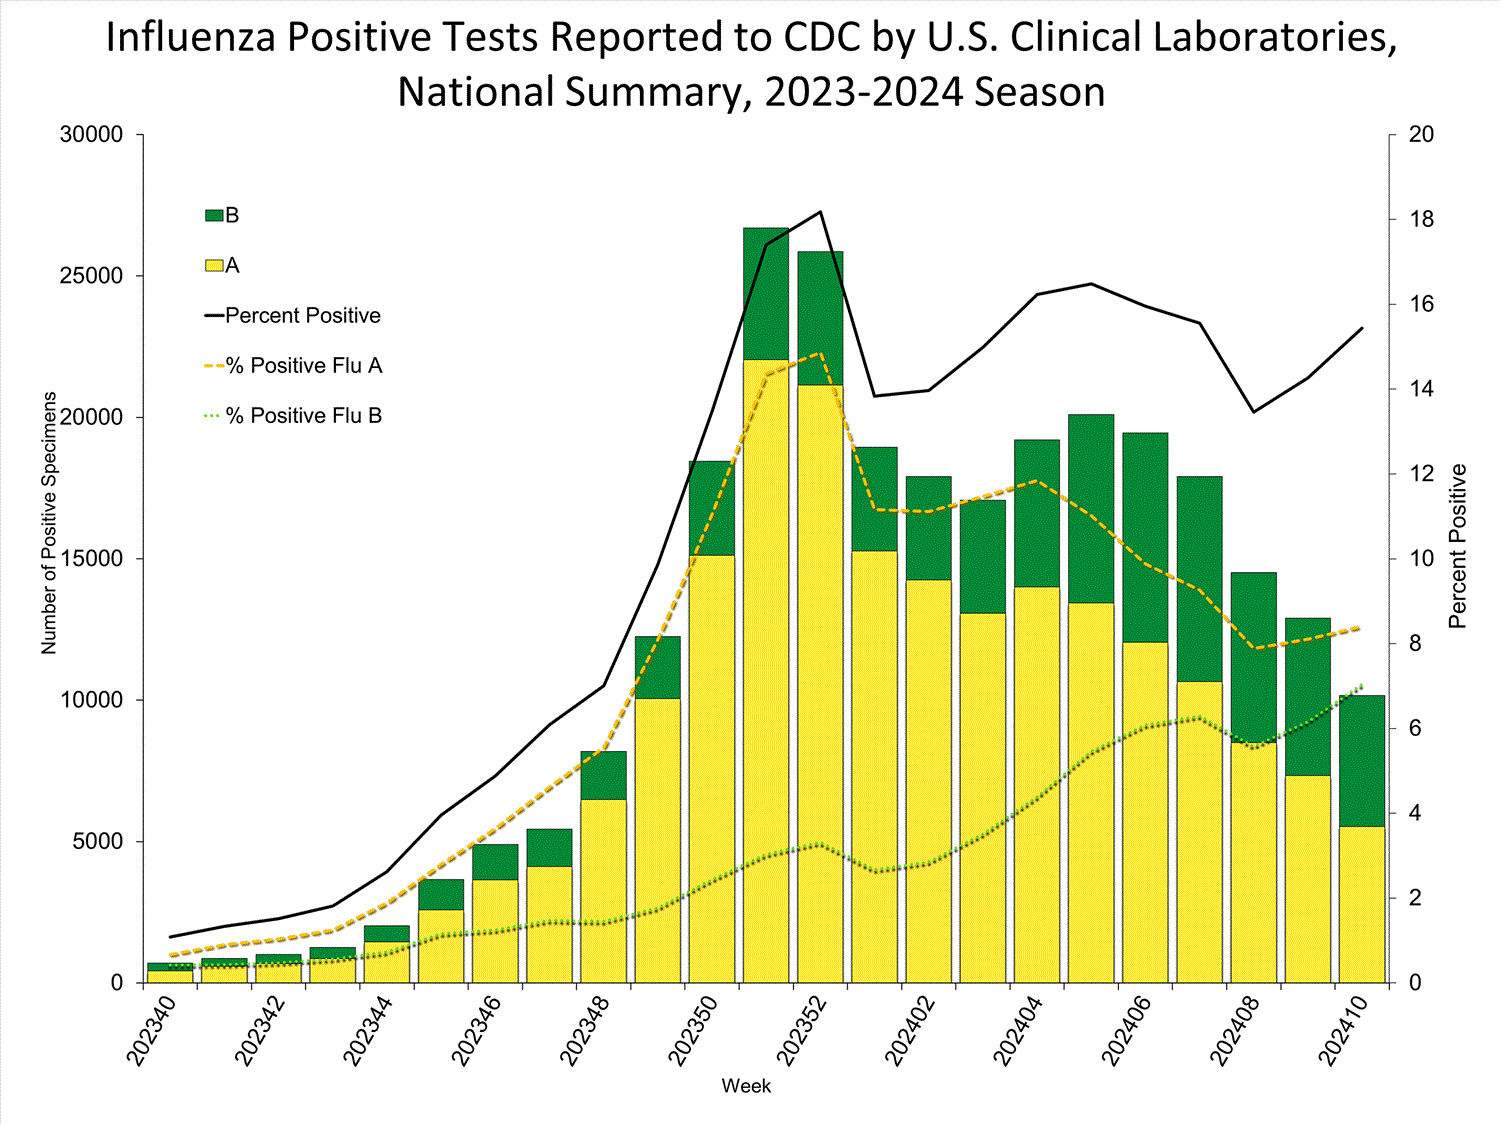
    The results of tests performed by clinical laboratories nationwide are summarized below. Data from clinical laboratories (the percentage of specimens tested that are positive for influenza virus) are used to monitor whether influenza activity is increasing or decreasing.
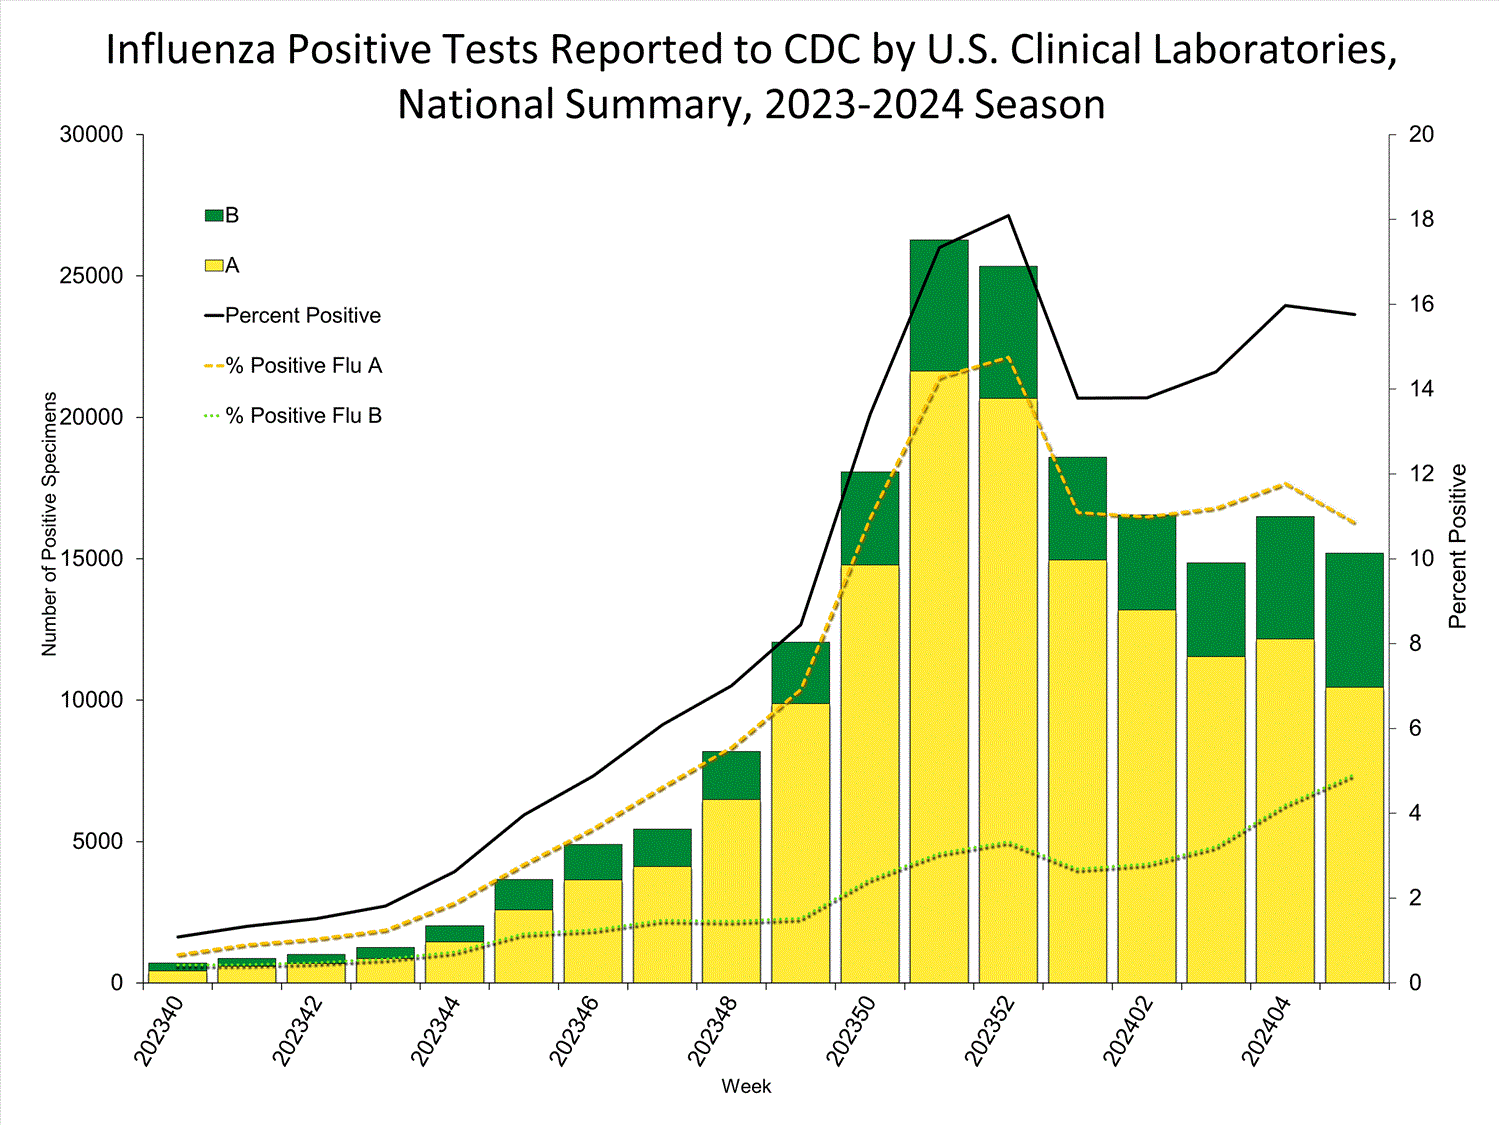
    No. of specimens tested 96,379 1,868,917
    No. of positive specimens (%) 15,192 (15.8%) 191,459 (10.2%)
    Positive specimens by type
    Influenza A 10,453 (68.8%) 150,153 (78.4%)
    Influenza B 4,739 (31.2%) 41,296 (21.6%)
    INFLUENZA Virus Isolated
    View Chart Data | View Full Screen Public Health Laboratories


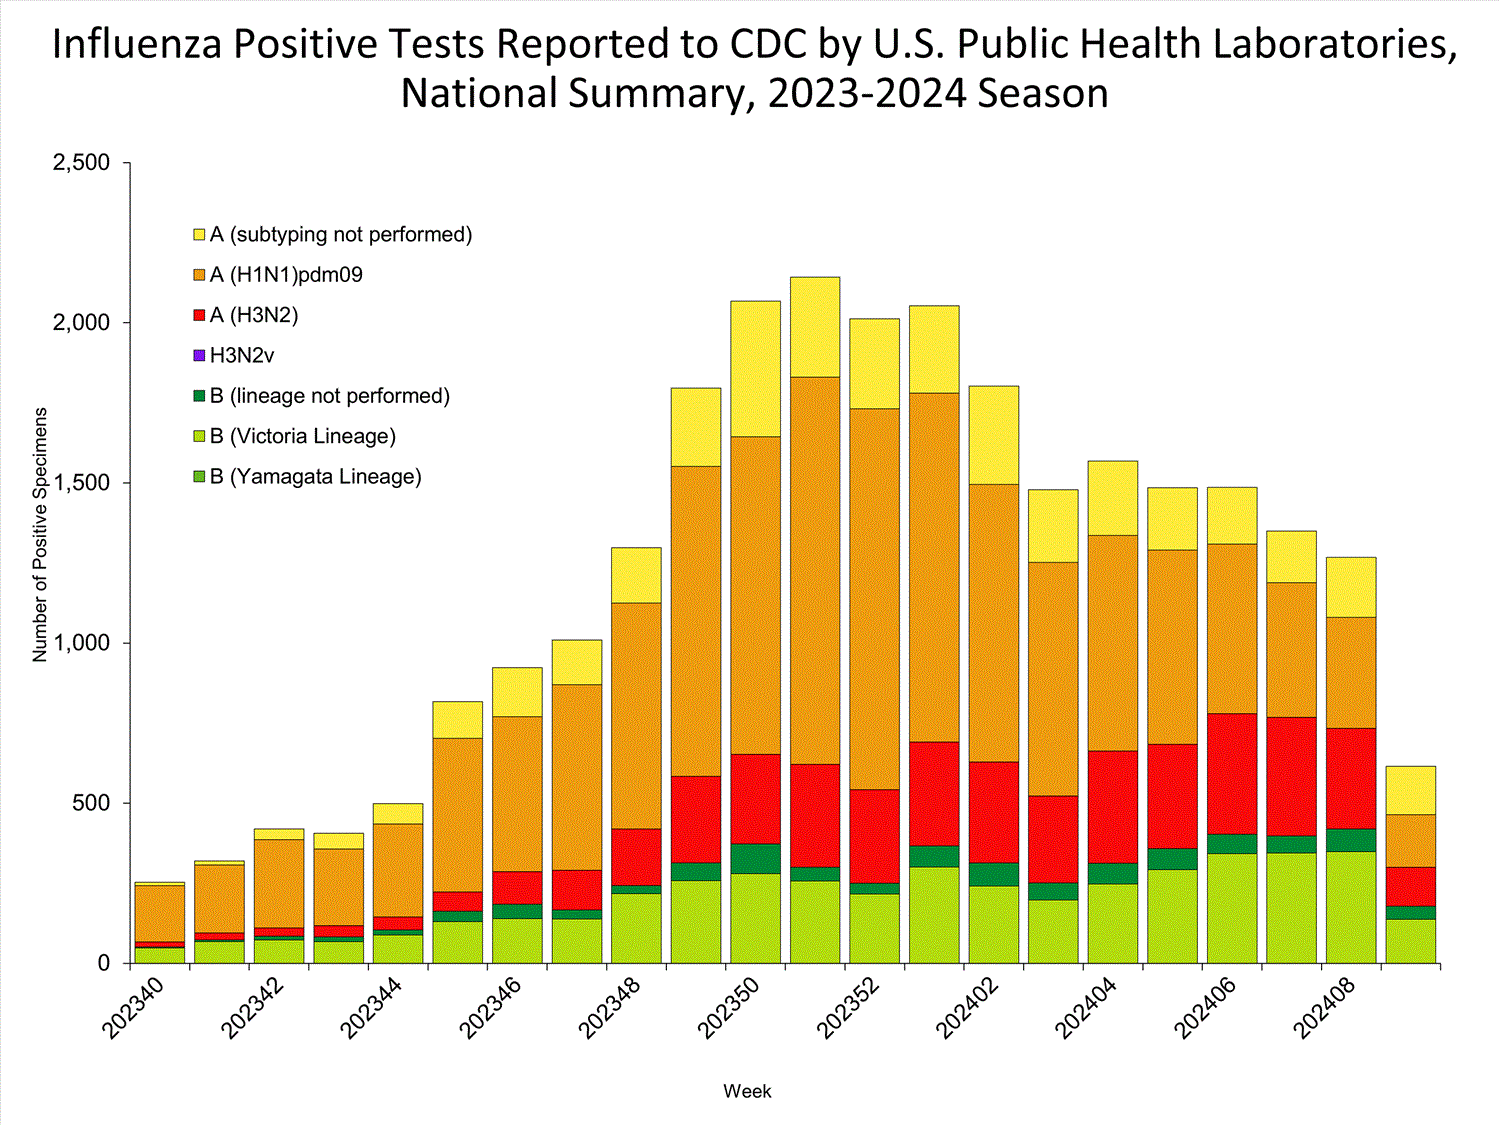
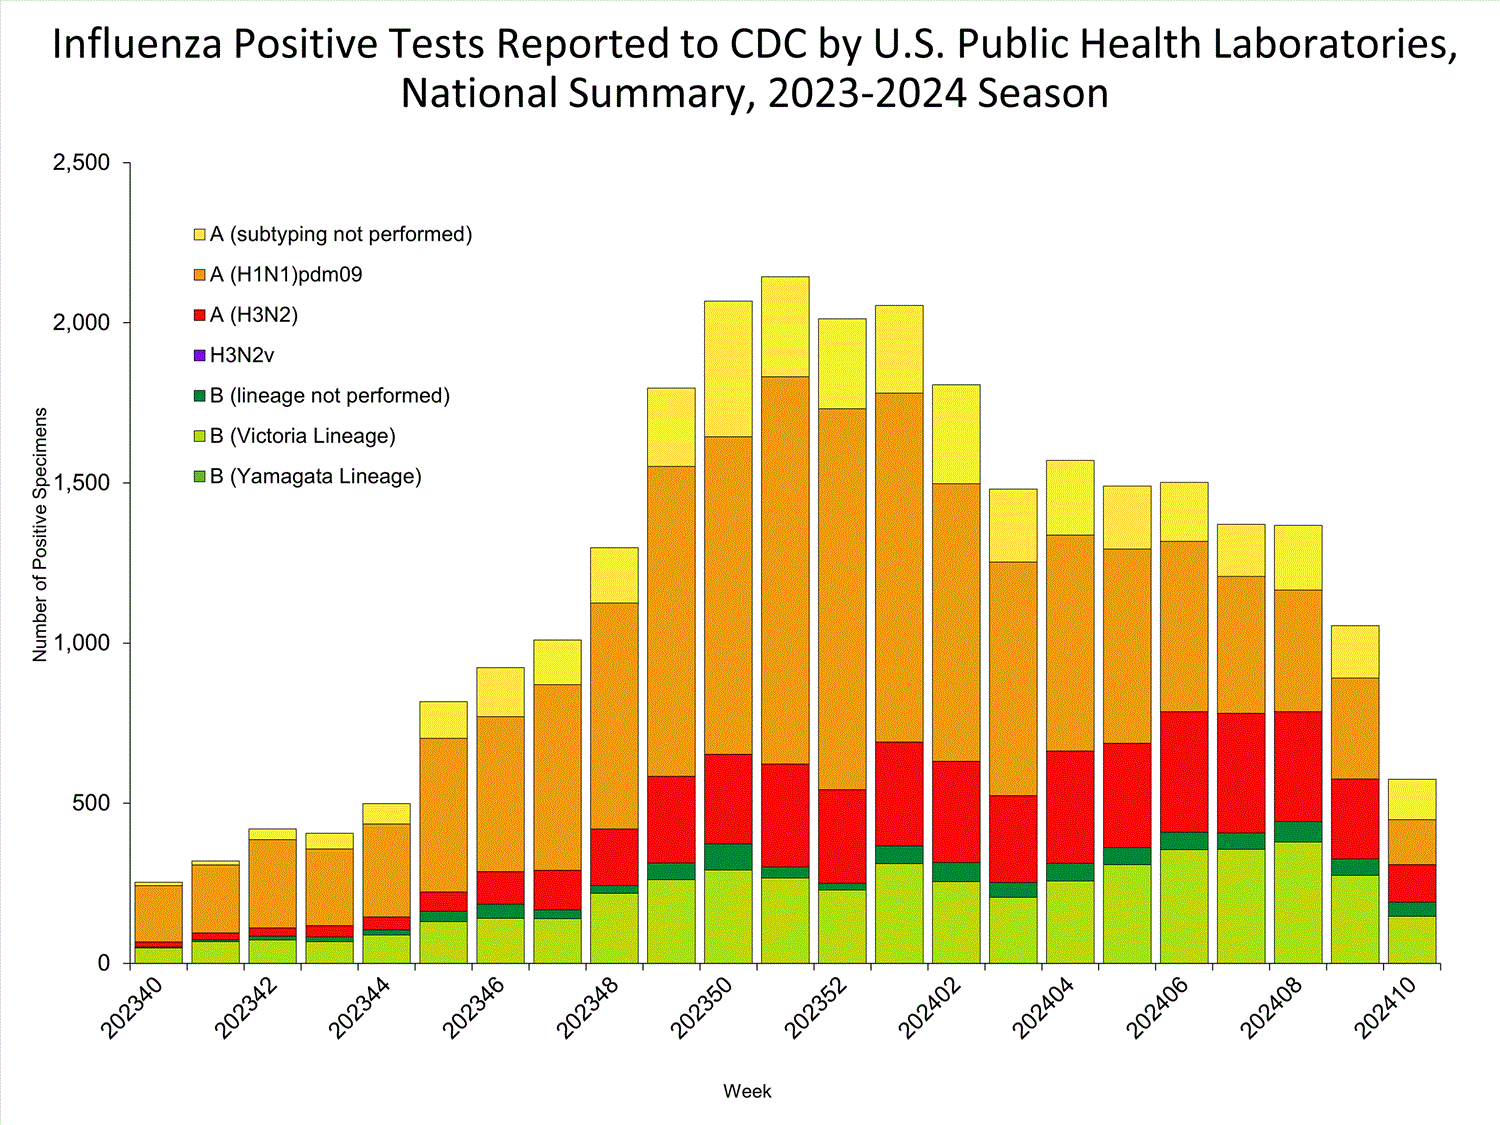
    The results of tests performed by public health laboratories nationwide are summarized below. Data from public health laboratories are used to monitor the proportion of circulating influenza viruses that belong to each influenza subtype/lineage.
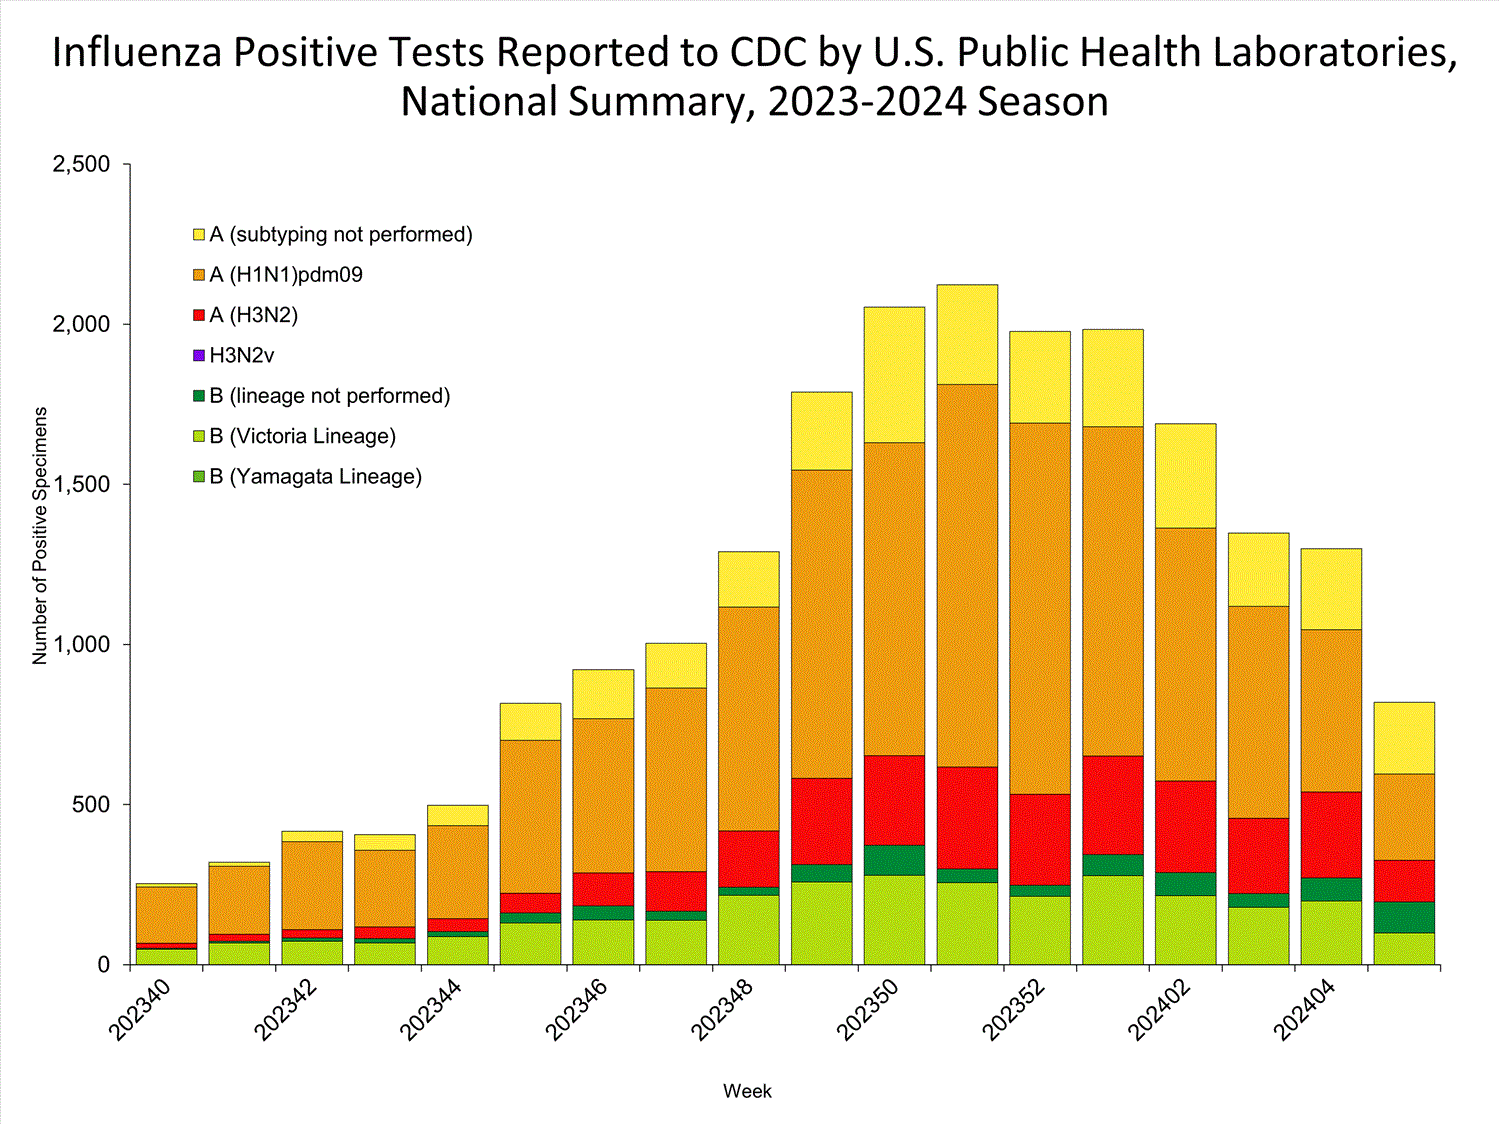
    No. of specimens tested 2,790 68,366
    No. of positive specimens 819 21,004
    Positive specimens by type/subtype
    Influenza A 623 (76.1%) 17,303 (82.4%)
    Subtyping Performed 400 (64.2%) 13,955 (80.7%)
    (H1N1)pdm09 270 (67.5%) 10,972 (78.6%)
    H3N2 130 (32.5%) 2,983 (21.4%)
    H3N2v 0 (0.0%) 0 (0.0%)
    Subtyping not performed 223 (35.8%) 3,348 (19.3%)
    Influenza B 196 (23.9%) 3,701 (17.6%)
    Lineage testing performed 99 (50.5%) 2,949 (79.7%)
    Yamagata lineage 0 (0.0%) 0 (0.0%)
    Victoria lineage 99 (100%) 2,949 (100%)
    Lineage not performed 97 (49.5%) 752 (20.3%)
    INFLUENZA Virus Isolated
    View Chart Data | View Full Screen

    Additional virologic surveillance information for current and past seasons:
    Surveillance Methods | FluView Interactive: National, Regional, and State Data or Age Data Influenza Virus Characterization


    CDC performs genetic and antigenic characterization of U.S. viruses submitted from state and local public health laboratories according to the Right Size Roadmap submission guidance. These data are used to compare how similar the currently circulating influenza viruses are to the reference viruses representing viruses contained in the current influenza vaccines. The data are also used to monitor evolutionary changes that continually occur in influenza viruses circulating in humans. CDC also tests susceptibility of circulating influenza viruses to antiviral medications including the neuraminidase inhibitors (oseltamivir, zanamivir, and peramivir) and the PA endonuclease inhibitor baloxavir.

    CDC has genetically characterized 1,725 influenza viruses collected since October 1, 2023.
    A/H1 815
    6B.1A.5a 815 (100%) 2a 225 (27.6%)
    2a.1 590 (72.4%)
    A/H3 458
    3C.2a1b.2a 458 (100%) 2a.1b 1 (0.2%)
    2a.3a 1 (0.2%)
    2a.3a.1 455 (99.3%)
    2b 1 (0.2%)
    B/Victoria 452
    V1A 452 (100%) 3a.2 452 (100%)
    B/Yamagata 0
    Y3 0 Y3 0 (0%)
    CDC antigenically characterizes influenza viruses by hemagglutination inhibition (HI) (H1N1pdm09, H3N2, B/Victoria, and B/Yamagata viruses) or neutralization-based HINT (H3N2 viruses) using antisera that ferrets make after being infected with reference viruses representing the 2023-2024 Northern Hemisphere recommended cell or recombinant-based vaccine viruses. Antigenic differences between viruses are determined by comparing how well the antibodies made against the vaccine reference viruses recognize the circulating viruses that have been grown in cell culture. Ferret antisera are useful because antibodies raised against a particular virus can often recognize small changes in the surface proteins of other viruses. In HI assays, viruses with similar antigenic properties have antibody titer differences of less than or equal to 4-fold when compared to the reference (vaccine) virus. In HINT, viruses with similar antigenic properties have antibody neutralization titer differences of less than or equal to 8-fold. Viruses selected for antigenic characterization are a subset representing the genetic changes in the surface proteins seen in genetically characterized viruses.

    Influenza A Viruses
    • A (H1N1)pdm09: 107 A(H1N1)pdm09 viruses were antigenically characterized by HI, and all were well-recognized (reacting at titers that were within 4-fold of the homologous virus titer) by ferret antisera to cell-grown A/Wisconsin/67/2022-like reference viruses representing the A(H1N1)pdm09 component for the cell- and recombinant-based influenza vaccines.
    • A (H3N2): 110 A(H3N2) viruses were antigenically characterized by HI or HINT, and all were well-recognized (reacting at titers that were within 4-fold of the homologous virus titer in HI or reacting at titers that were less than or equal to 8-fold of the homologous virus in HINT) by ferret antisera to cell-grown A/Darwin/6/2021-like reference viruses representing the A(H3N2) component for the cell- and recombinant-based influenza vaccines.

    Influenza B Viruses
    • B/Victoria: Sixty-one influenza B/Victoria-lineage virus were antigenically characterized by HI, and all were well-recognized (reacting at titers that were within 4-fold of the homologous virus titer) by ferret antisera to cell-grown B/Austria/1359417/2021-like reference viruses representing the B/Victoria component for the cell- and recombinant-based influenza vaccines.
    • B/Yamagata: No influenza B/Yamagata-lineage viruses were available for antigenic characterization.

    Assessment of Virus Susceptibility to Antiviral Medications

    CDC assesses susceptibility of influenza viruses to the antiviral medications including the neuraminidase inhibitors (oseltamivir, zanamivir, and peramivir) and the PA endonuclease inhibitor baloxavir using next generation sequence analysis supplemented by laboratory assays. Information about antiviral susceptibility test methods can be found at U.S. Influenza Surveillance: Purpose and Methods | CDC.

    Viruses collected in the U.S. since October 01, 2023, were tested for antiviral susceptibility as follows:
    Neuraminidase Inhibitors Oseltamivir Viruses Tested 1723 816 460 447
    Reduced Inhibition 1 (0.1%) 1 (0.1%) 0 (0.0%) 0 (0.0%)
    Highly Reduced Inhibition 1 (0.1%) 1 (0.1%) 0 (0.0%) 0 (0.0%)
    Peramivir Viruses Tested 1723 816 460 447
    Reduced Inhibition 0 (0.0%) 0 (0.0%) 0 (0.0%) 0 (0.0%)
    Highly Reduced Inhibition 1 (0.1%) 1 (0.1%) 0 (0.0%) 0 (0.0%)
    Zanamivir Viruses Tested 1723 816 460 447
    Reduced Inhibition 0 (0.0%) 0 (0.0%) 0 (0.0%) 0 (0.0%)
    Highly Reduced Inhibition 0 (0.0%) 0 (0.0%) 0 (0.0%) 0 (0.0%)
    PA Cap-Dependent Endonuclease Inhibitor Baloxavir Viruses Tested 1682 793 450 439
    Decreased Susceptibility 1 (0.1%) 0 (0.0%) 1 (0.2%) 0 (0.0%)
    One A(H1N1)pdm09 virus had NA-H275Y amino acid substitution and showed highly reduced inhibition by oseltamivir and peramivir. One (H1N1)pdm09 virus had NA-S247N and NA-I223V amino acid substitutions and showed reduced inhibition by oseltamivir. One A(H3N2) virus had PA-I38T amino acid substitution and showed reduced susceptibility to baloxavir.

    High levels of resistance to the adamantanes (amantadine and rimantadine) persist among influenza A(H1N1)pdm09 and influenza A(H3N2) viruses (the adamantanes are not effective against influenza B viruses). Therefore, use of these antivirals for treatment and prevention of influenza A virus infection is not recommended and data from adamantane resistance testing are not presented. Outpatient Respiratory Illness Surveillance


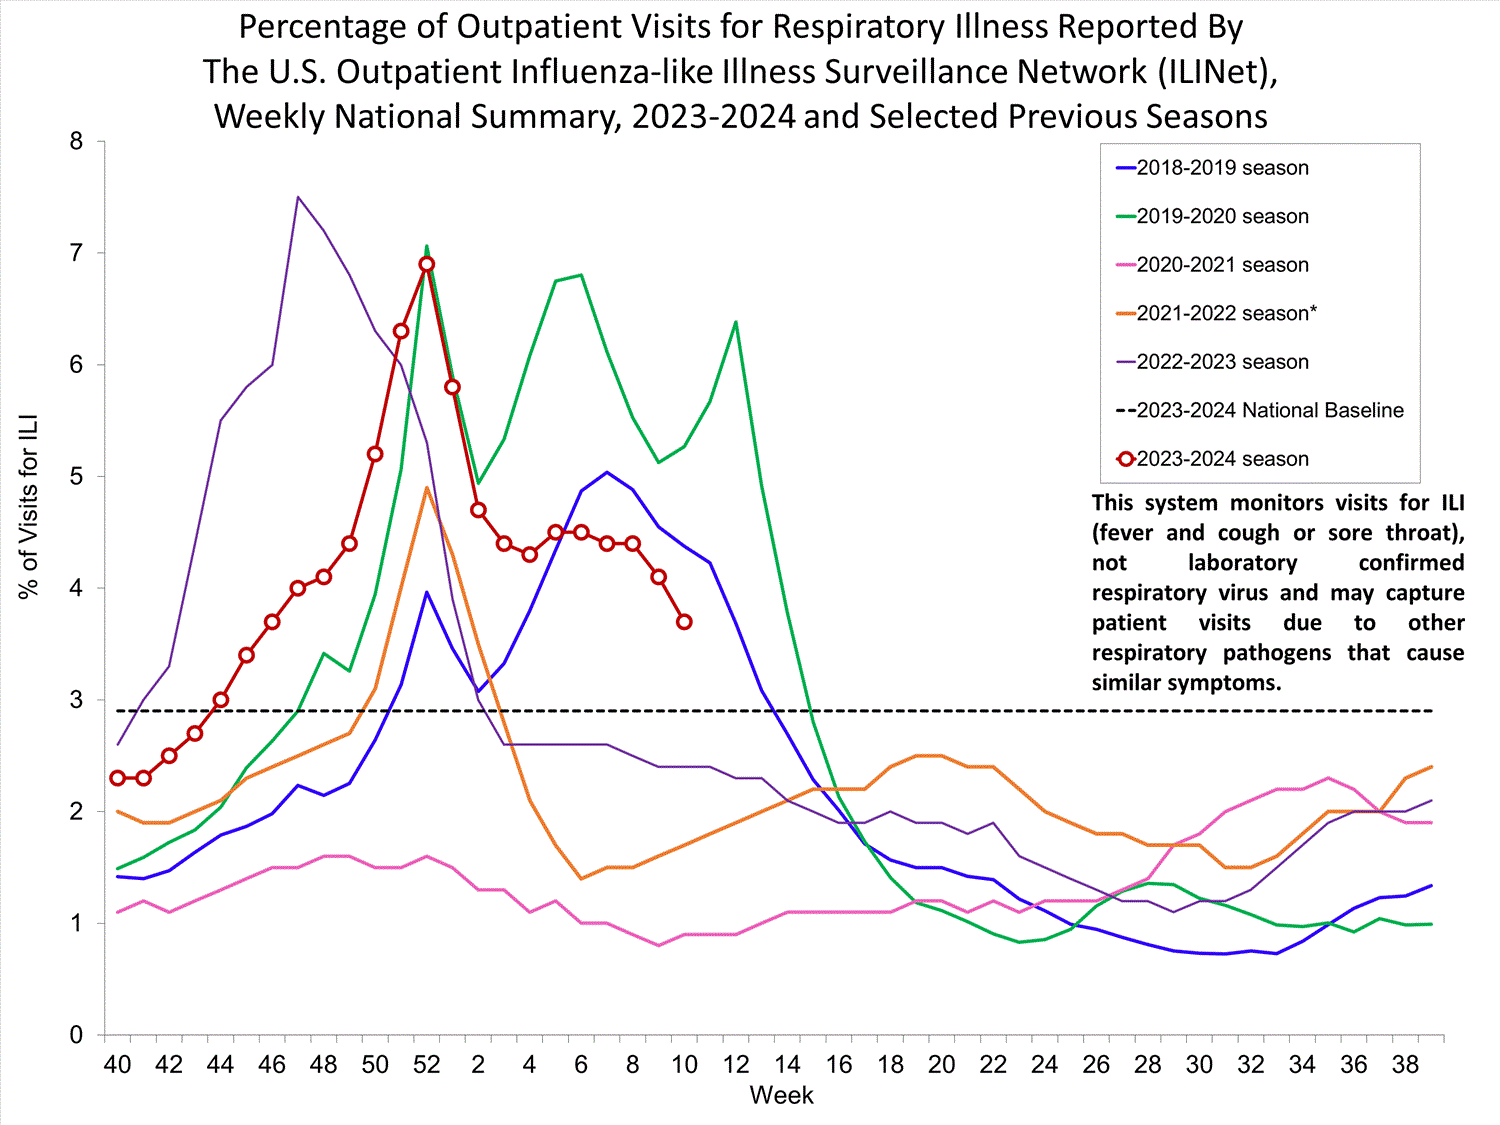
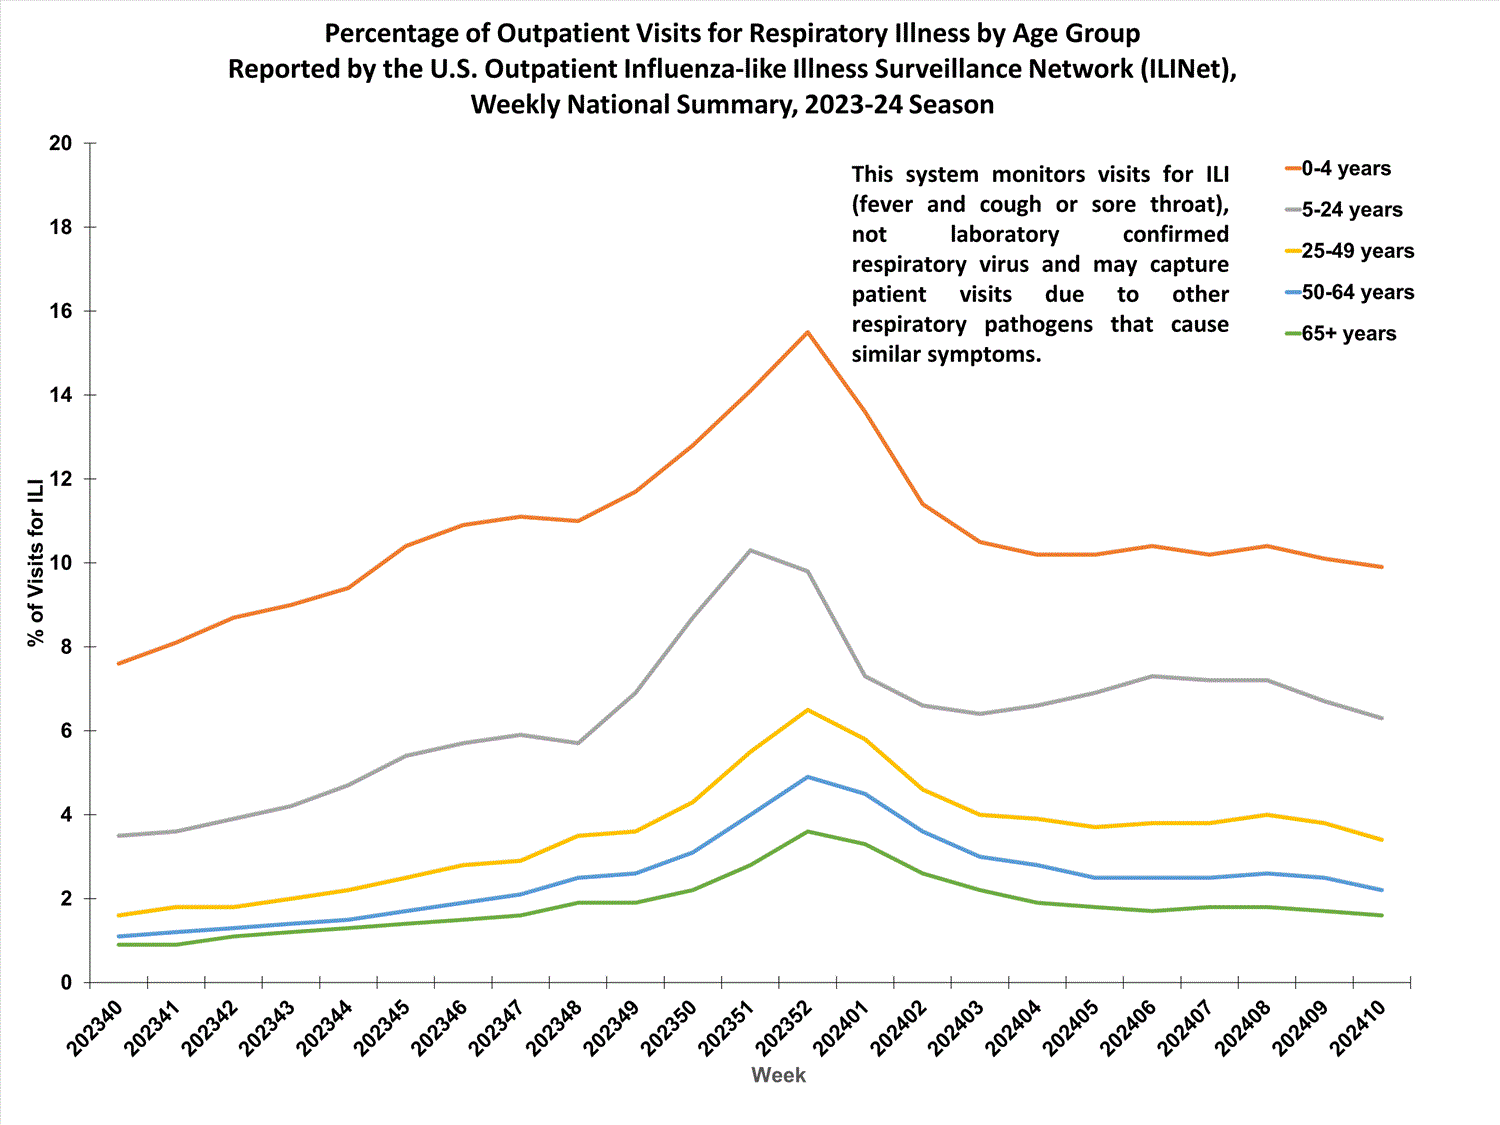
    The U.S. Outpatient Influenza-like Illness Surveillance Network (ILINet) monitors outpatient visits for respiratory illness referred to as influenza-like illness [ILI (fever plus cough or sore throat)], not laboratory-confirmed influenza and will therefore capture respiratory illness visits due to infection with pathogens that can present with similar symptoms, including influenza viruses, SARS-CoV-2, and RSV. It is important to evaluate syndromic surveillance data, including that from ILINet, in the context of other sources of surveillance data to obtain a more complete and accurate picture of influenza, SARS-CoV-2, and other respiratory virus activity. CDC is providing integrated information about COVID-19, influenza, and RSV activity on a website that is updated weekly. Information about other respiratory virus activity can be found on CDC’s National Respiratory and Enteric Virus Surveillance System (NREVSS) website. Outpatient Respiratory Illness Visits


    Nationwide, during Week 5, 4.4% of patient visits reported through ILINet were due to respiratory illness that included fever plus a cough or sore throat, also referred to as ILI. This has remained stable (change of ≤ 0.1 percentage points) compared to Week 4 and has remained above the national baseline of 2.9% since Week 44. The percentage of visits for ILI increased in regions 2, 5, 6, 7, and 10, decreased in regions 4 and 9, and remained stable in regions 1, 3, and 8 in Week 5 compared to Week 4. All regions remain above their region-specific baselines this week. Multiple respiratory viruses are co-circulating, and the relative contribution of influenza virus infection to ILI varies by location.

    Outpatient Respiratory Illness Visits by Age Group


    About 70% of ILINet participants provide both the number of patient visits for respiratory illness and the total number of patient visits for the week broken out by age group. Data from this subset of providers are used to calculate the percentages of patient visits for respiratory illness by age group.

    The percentage of visits for respiratory illness reported in ILINet increased in the 5-24 years age group (change of > 0.1 percentage points), decreased in the 25-49 years and 50-64 years age groups, and remained stable in the 0-4 and 65+ years age groups during Week 5 compared to Week 4.

    Outpatient Respiratory Illness Activity Map


    Data collected in ILINet are used to produce a measure of ILI activity* by state/jurisdiction and Core Based Statistical Areas (CBSA).
    Week 5
    (Week ending
    Feb. 3, 2024)
    Week 4
    (Week ending
    Jan. 27, 2024)
    Week 5
    (Week ending
    Feb. 3, 2024)
    Week 4
    (Week ending
    Jan. 27, 2024)
    Very High 6 5 14 17
    High 19 14 97 93
    Moderate 11 13 123 112
    Low 10 9 181 182
    Minimal 8 14 279 306
    Insufficient Data 1 0 235 219


    *Data collected in ILINet may disproportionally represent certain populations within a jurisdiction or CBSA, and therefore, may not accurately depict the full picture of influenza activity for the entire jurisdiction or CBSA. Differences in the data presented here by CDC and independently by some health departments likely represent differing levels of data completeness with data presented by the health department likely being the more complete.

    Additional information about medically attended visits for ILI for current and past seasons:
    Surveillance Methods | FluView Interactive: National, Regional, and State Data or ILI Activity Map Hospitalization Surveillance

    FluSurv-NET


    The Influenza Hospitalization Surveillance Network (FluSurv-NET) conducts population-based surveillance for laboratory-confirmed influenza-related hospitalizations in select counties in 14 states and represents approximately 9% of the U.S. population. FluSurv-NET hospitalization data are preliminary. As data are received each week, prior case counts and rates are updated accordingly.

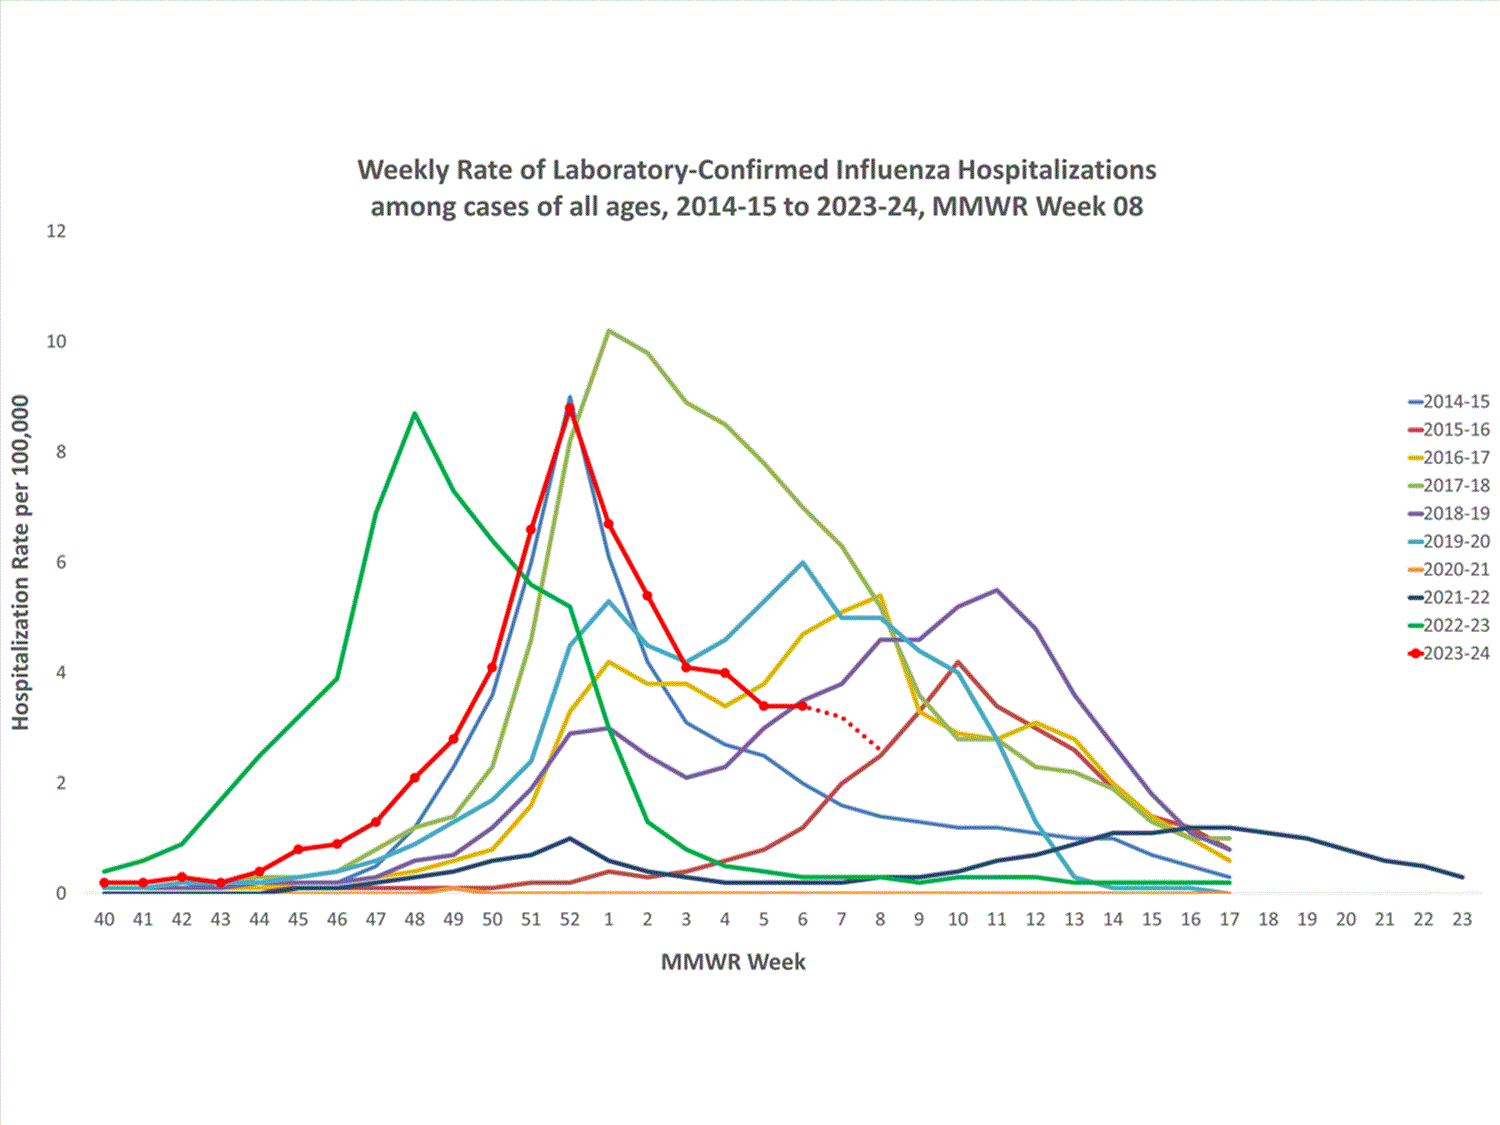
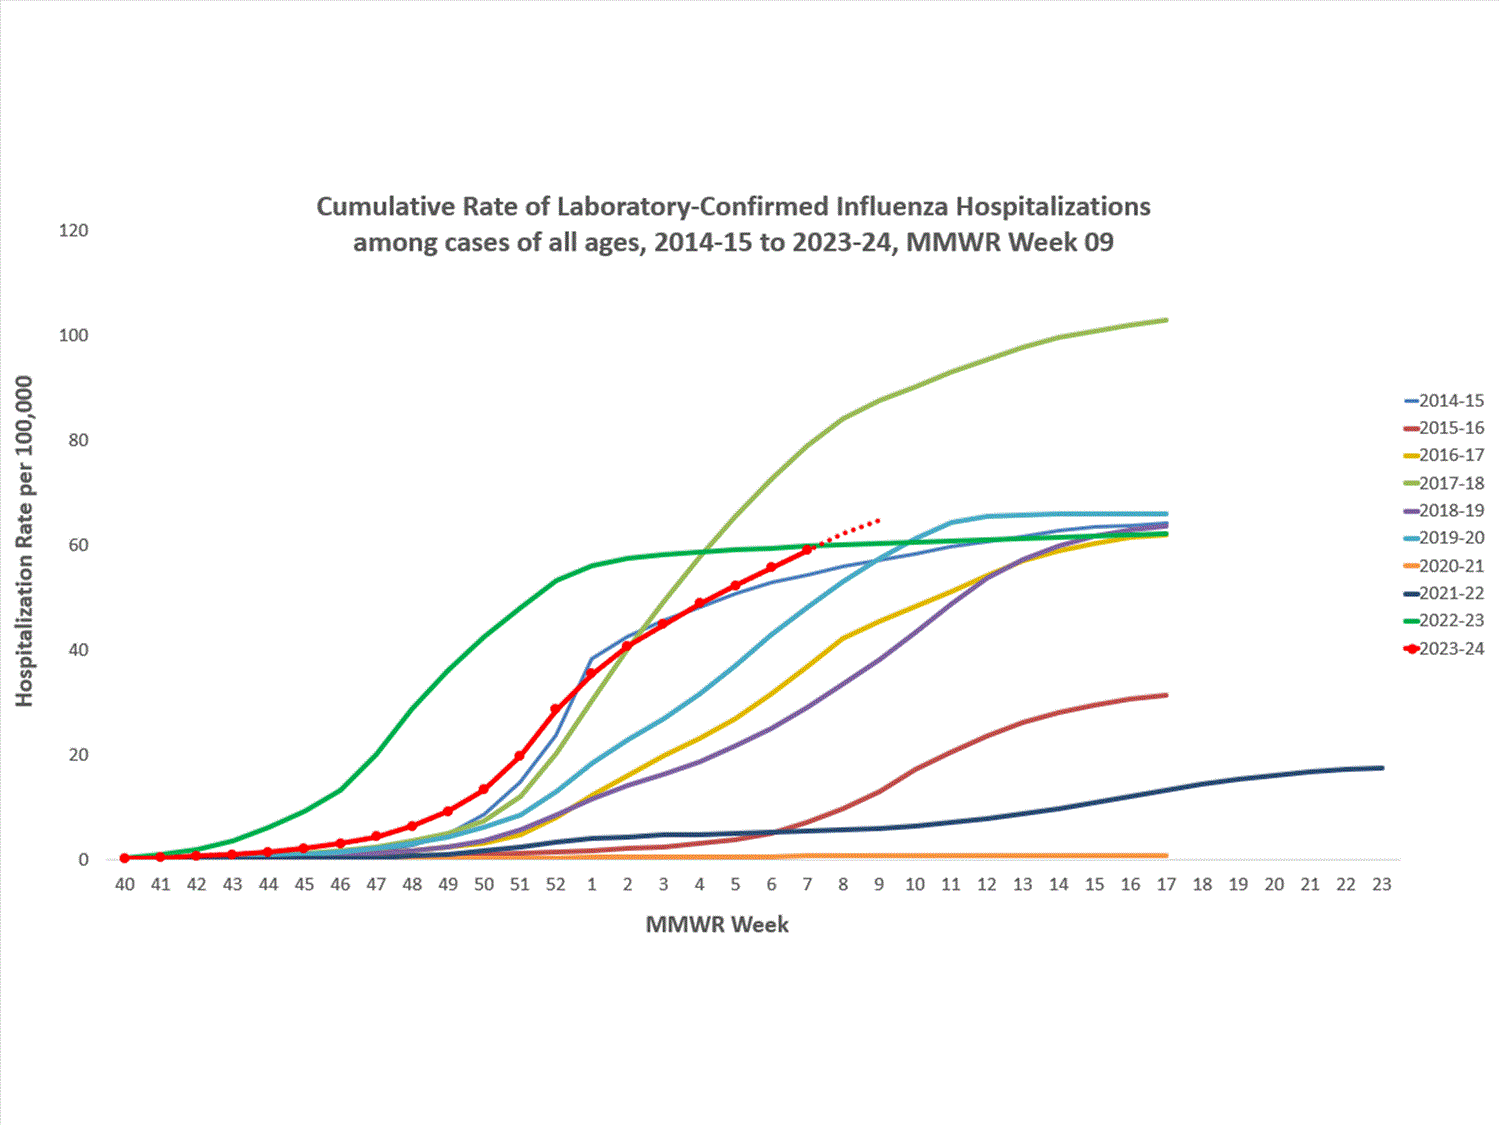
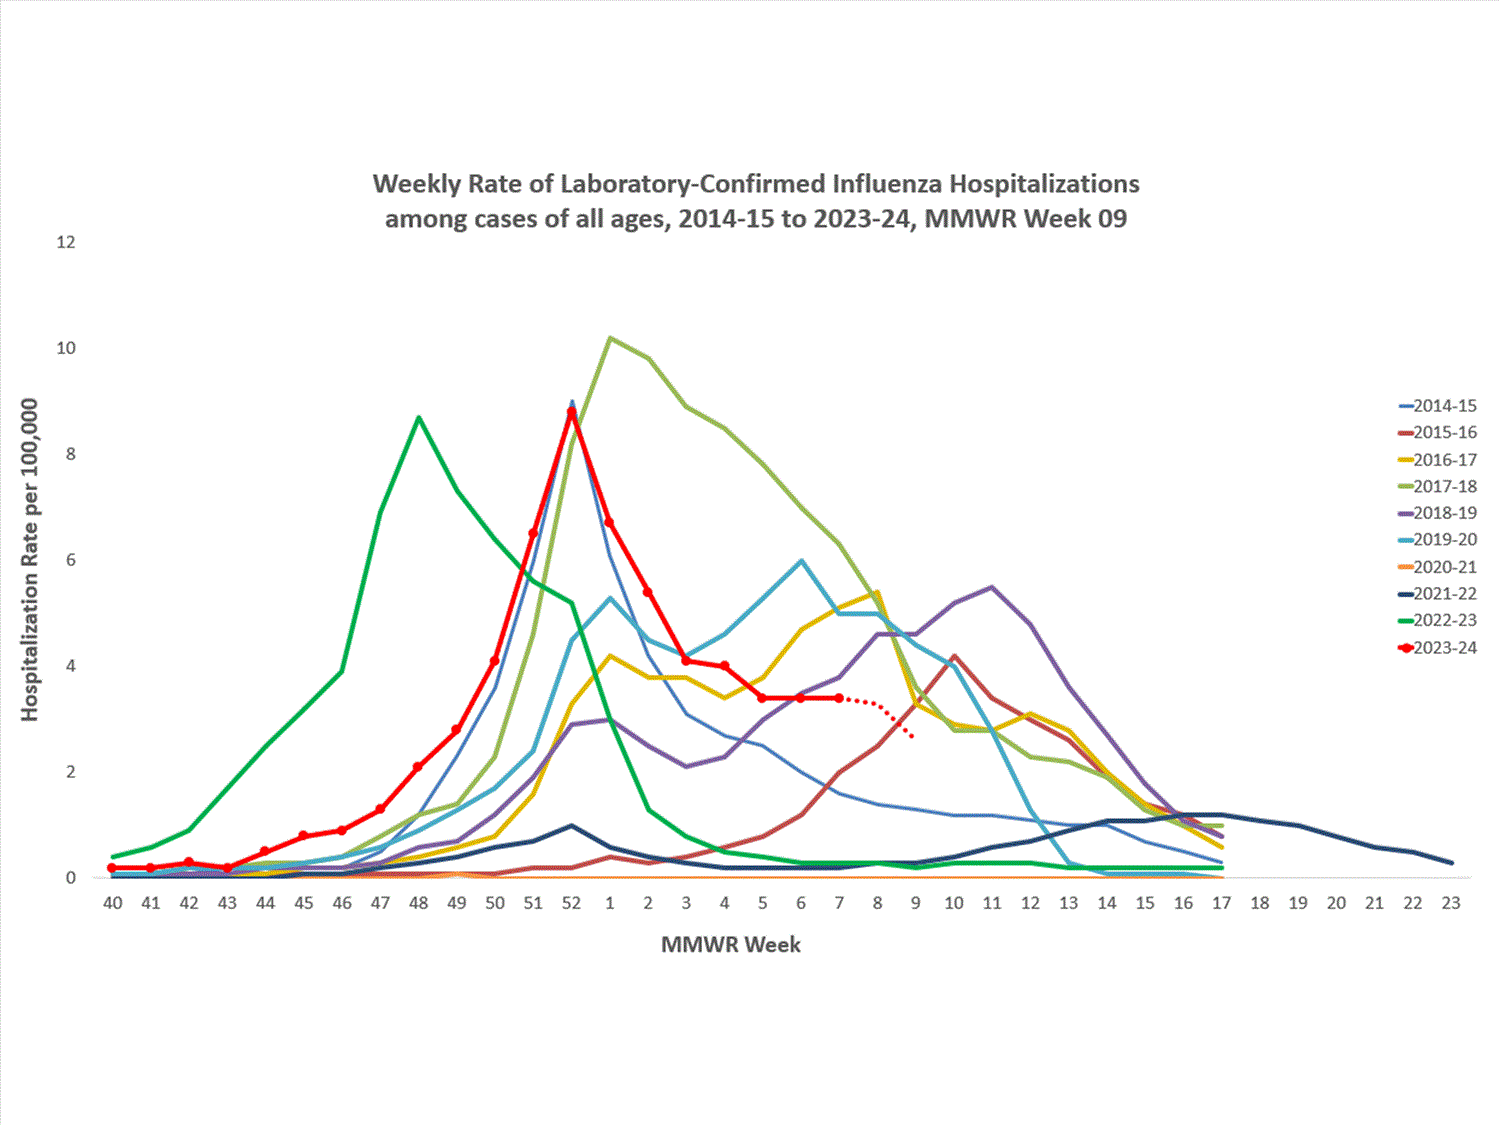
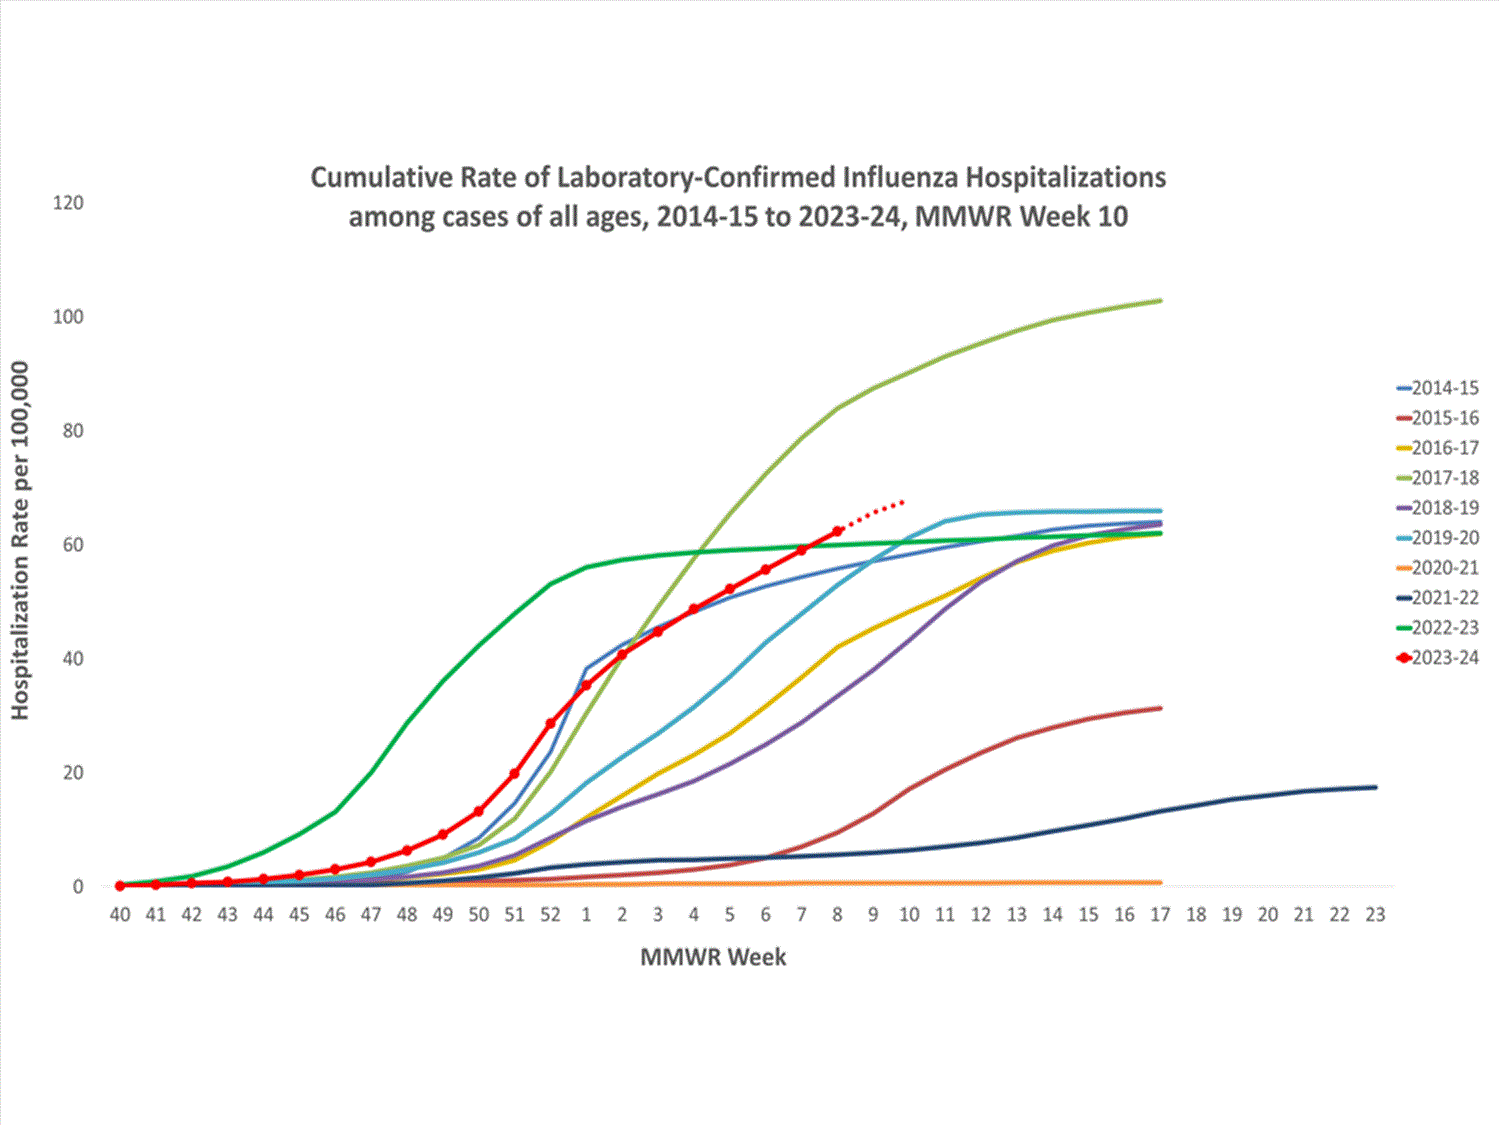
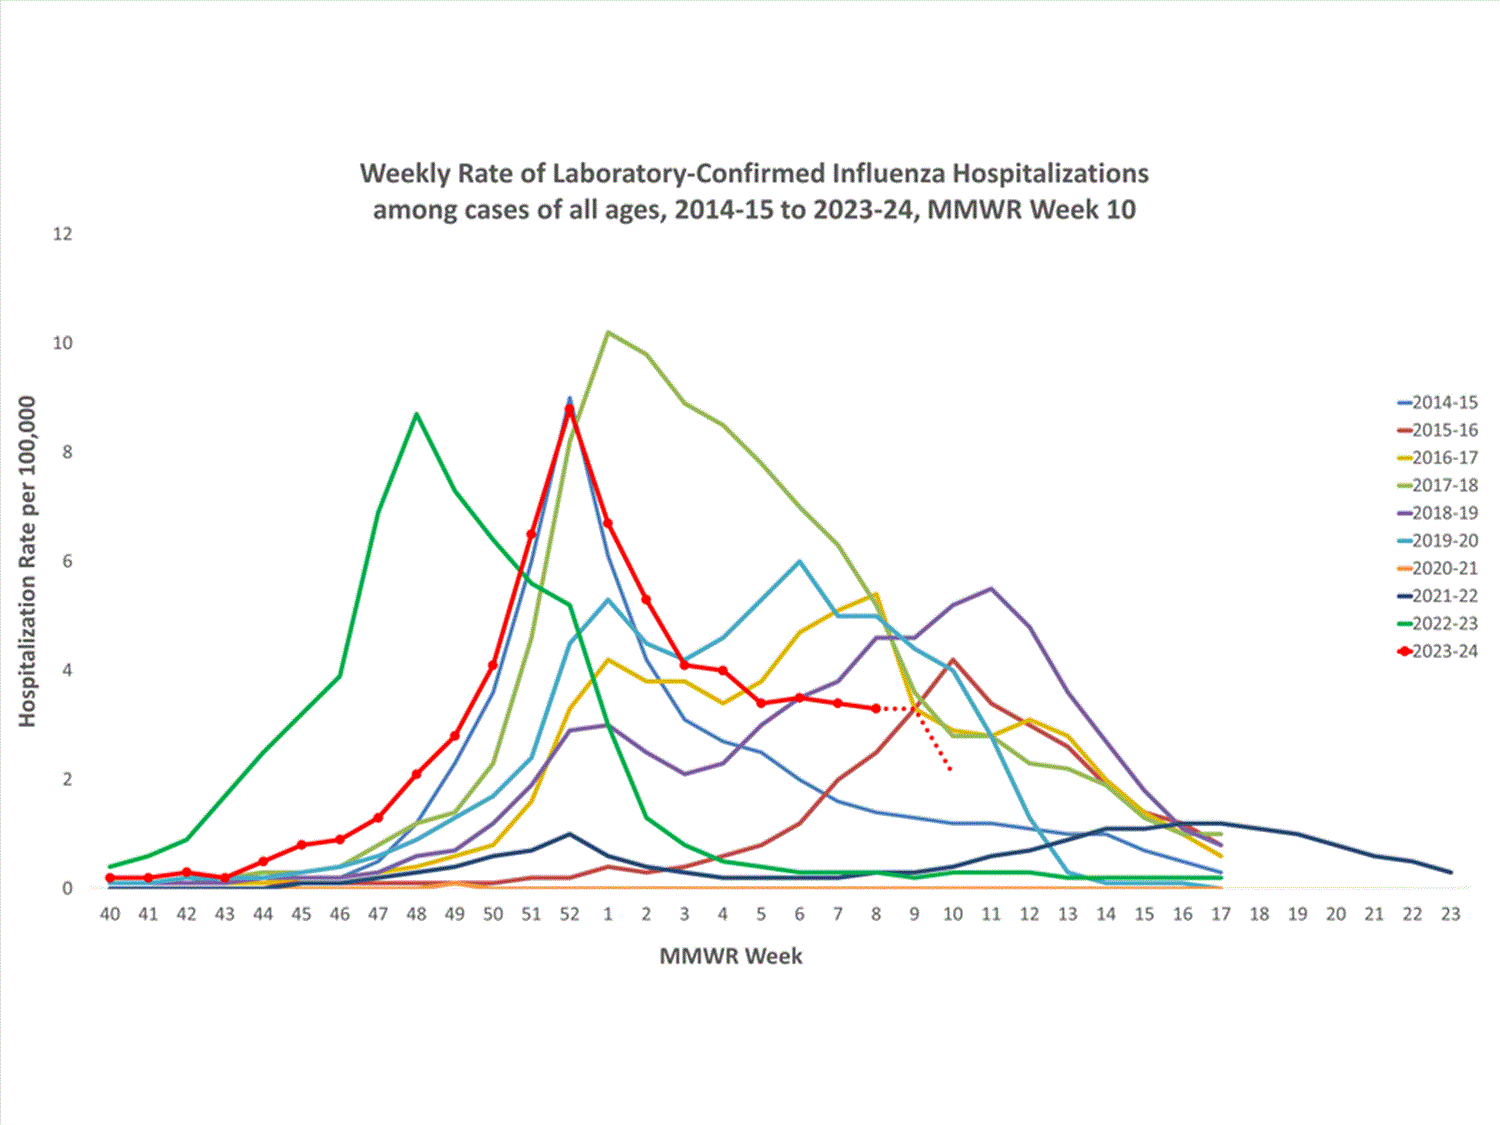
    A total of 15,743 laboratory-confirmed influenza-associated hospitalizations were reported by FluSurv-NET sites between October 1, 2023, and February 03, 2024. The weekly hospitalization rate observed in Week 5 was 2.7 per 100,000 population. The weekly hospitalization rate observed during Week 52 is the third highest peak weekly rate observed during all seasons going back to 2010-2011 following the 2014-2015 and 2017-2018 seasons. The overall cumulative hospitalization rate was 51.5 per 100,000 population. This cumulative hospitalization rate is the third highest cumulative hospitalization rate when compared against previous end-of-season rates for Week 5, following the 2017-2018 season (59.9) and 2022-2023 season (59.2). Cumulative in-season hospitalization rates observed in Week 5 from 2010-2011 through 2021-2022 ranged from 0.6 to 44.1.

    When examining rates by age, the highest cumulative hospitalization rate per 100,000 population was among adults aged 65 years and older (138.7), followed by adults aged 50-64 years (63.5) and children aged 0-4 years (54.0). When examining age-adjusted rates by race and ethnicity, the highest rate of hospitalization per 100,000 population was among non-Hispanic Black persons (95.7), followed by Hispanic persons (48.9), non-Hispanic American Indian or Alaska Native persons (68.5), non-Hispanic White persons (34.6), and non-Hispanic Asian/Pacific Islander persons (29.1).

    Among 15,743 hospitalizations, 13,854 (88.0%) were associated with influenza A virus, 1,747 (11.1%) with influenza B virus, 29 (0.2%) with influenza A virus and influenza B virus co-infection, and 113 (0.7%) with influenza virus for which the type was not determined. Among those with influenza A subtype information, 2,279 (75.8%) were A(H1N1) pdm09 and 727 (24.2%) were A(H3N2). Based on preliminary data, of the 785 laboratory-confirmed influenza-associated hospitalizations with more complete data admitted through November 2023, 4.0% (95% CI: 2.3%-5.7%) also tested positive for SARS-CoV-2.

    Among 613 hospitalized adults with information on underlying medical conditions, 94.4% had at least one reported underlying medical condition, the most commonly reported were hypertension, cardiovascular disease, metabolic disorder, and obesity. Among 910 hospitalized women of childbearing age (15-49 years) with information on pregnancy status, 18.2% were pregnant. Among 409 hospitalized children with information on underlying medical conditions, 70.4% had at least one reported underlying medical condition; the most commonly reported was asthma, followed by obesity and neurologic disease.
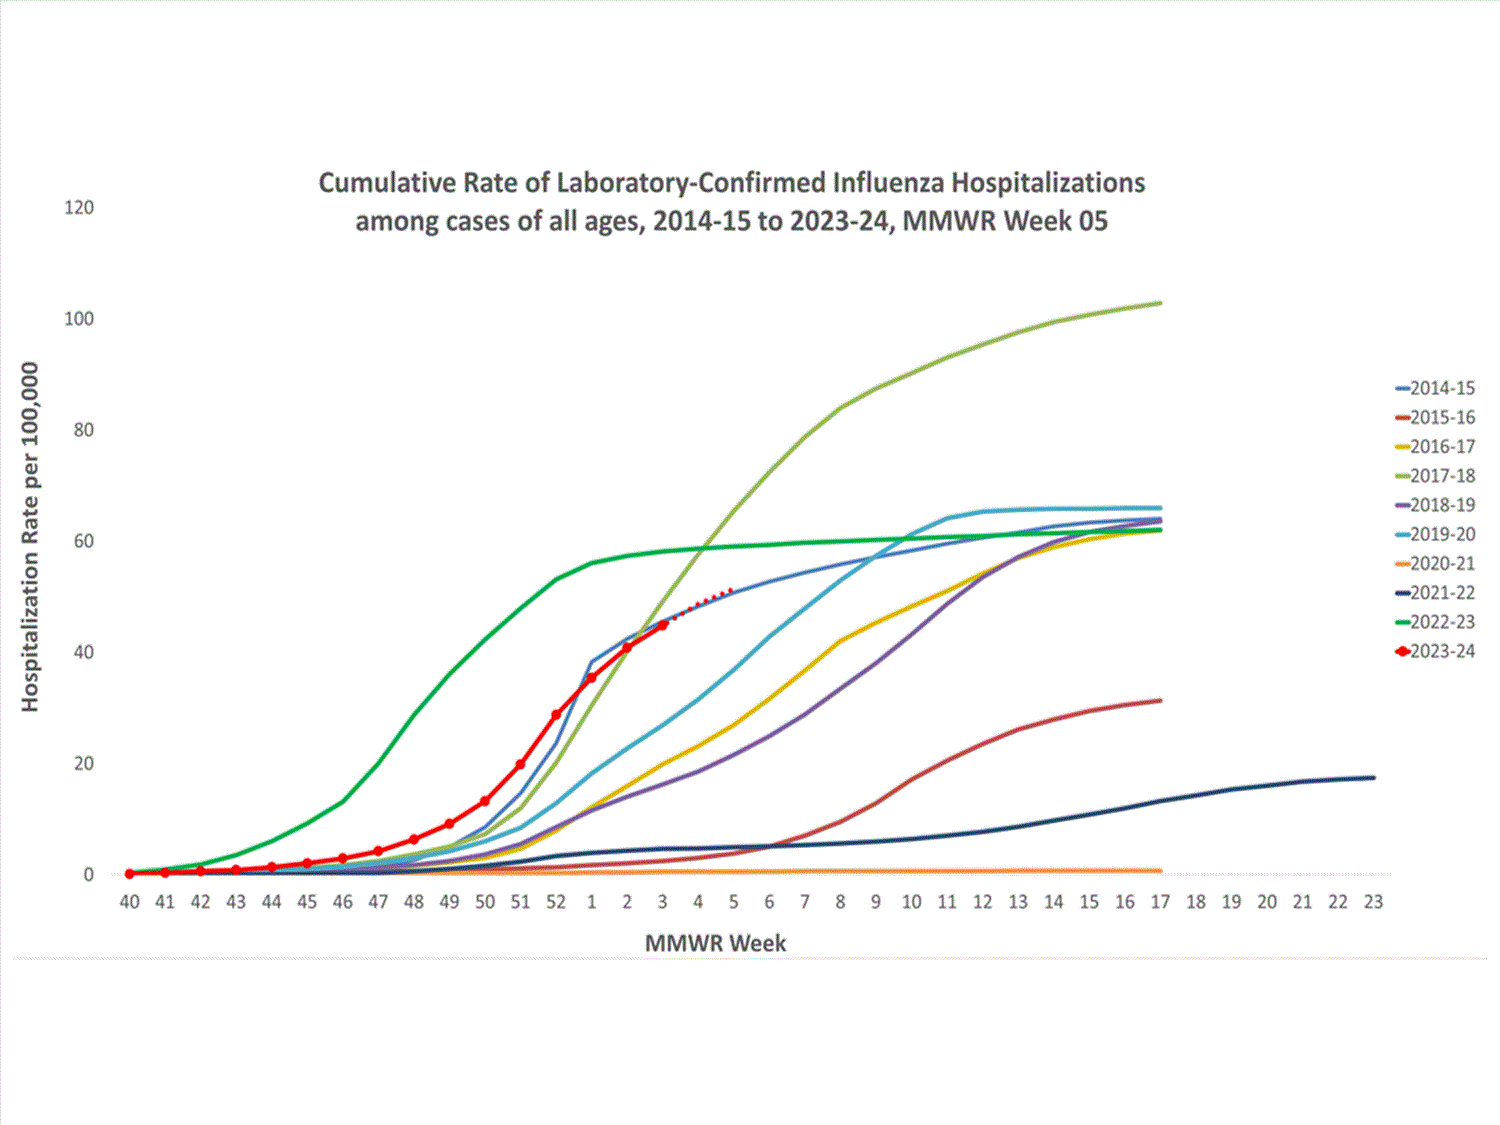
    FluSurvNet Cumulative Rates

    View Full Screen

    In this figure, cumulative rates for all seasons prior to the 2023-2024 season reflect end-of-season rates. For the 2023-2024 season, rates for recent hospitals admissions are subject to reporting delays. As hospitalization data are reviewed each week, prior case counts and rates are updated accordingly.
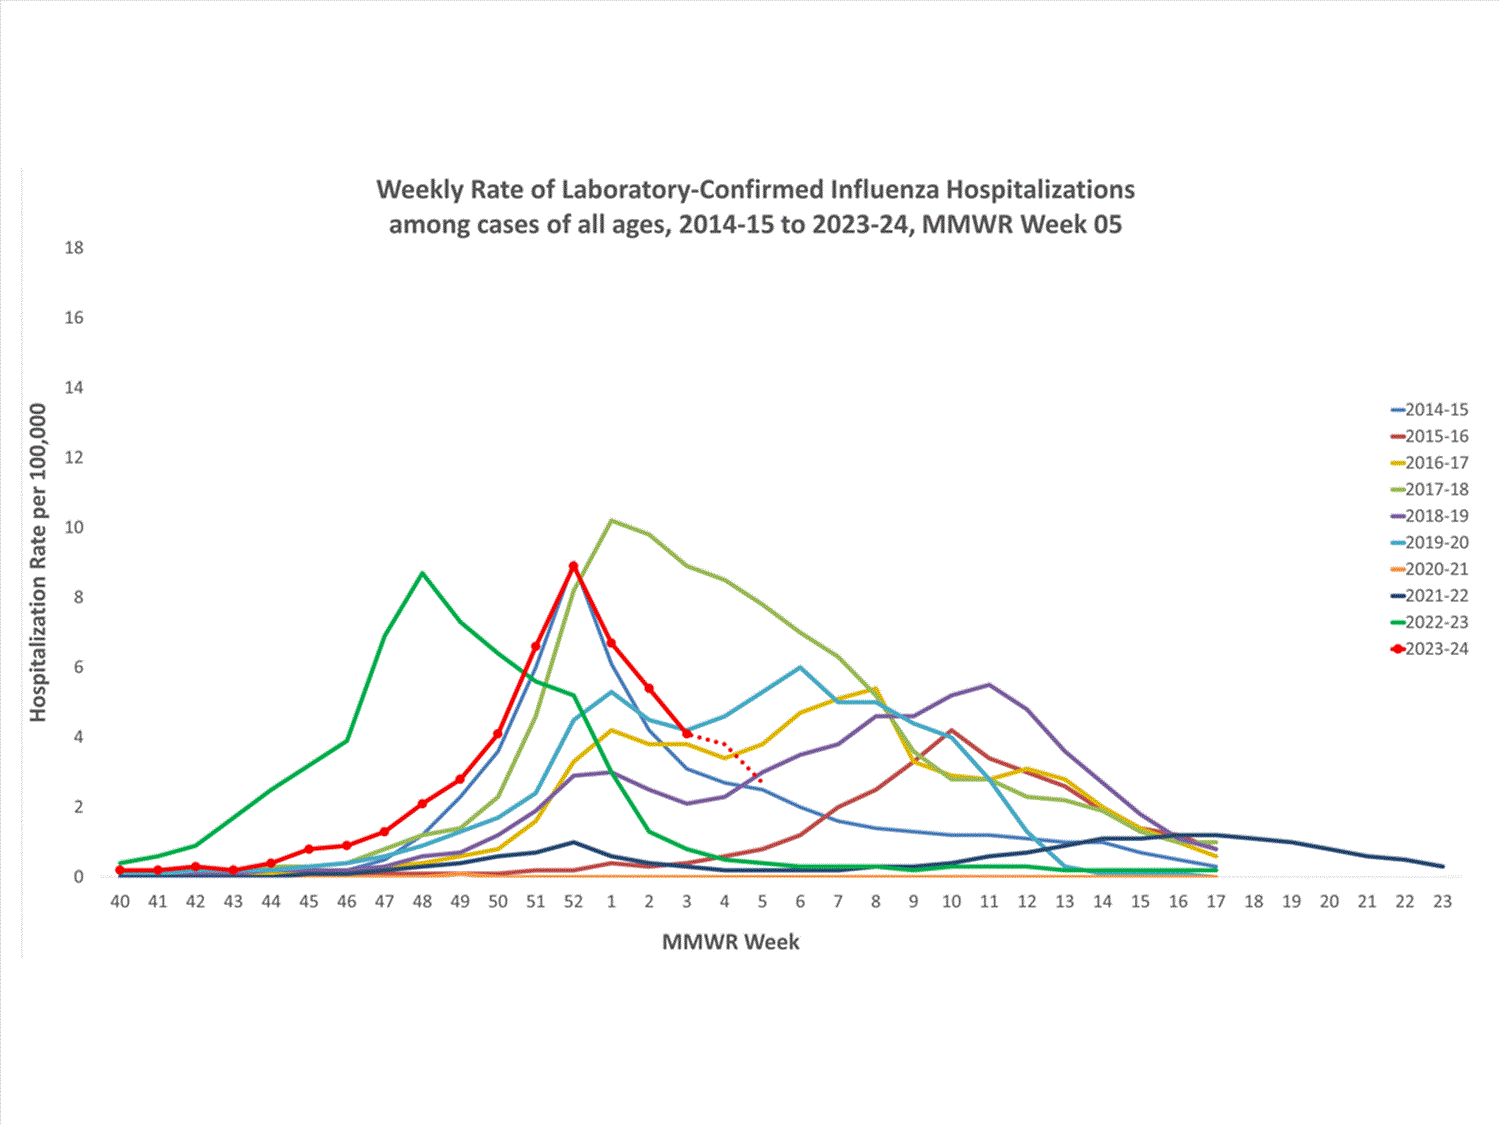
    FluSurvNet Weekly Rate

    View Full Screen

    In this figure, weekly rates for all seasons prior to the 2023-24 season reflect end-of-season rates. For the 2023-24 season, rates for recent hospital admissions are subject to reporting delays and are shown as a dashed line for the current season. As hospitalization data are received each week, prior case counts and rates are updated accordingly.

    Additional FluSurv-NET hospitalization surveillance information for current and past seasons and additional age groups:
    Surveillance Methods |FluView Interactive: Rates by Age, Sex, and Race/Ethnicity or Data on Patient Characteristics | RESP-NET Interactive National Healthcare Safety Network (NHSN) Hospitalization Surveillance


    Hospitals report to NHSN the weekly number of patients admitted with laboratory-confirmed influenza. During Week 5, 11,073 patients with laboratory-confirmed influenza were admitted to a hospital. The number of patients admitted to a hospital with laboratory-confirmed influenza for Week 5 decreased compared to Week 4 (change of >5%) nationally. The number of hospitalizations increased in regions 1, 5, and 7, remained stable in Region 6, and decreased in regions 2, 3, 4, 8, 9, and 10 this week compared to Week 4.
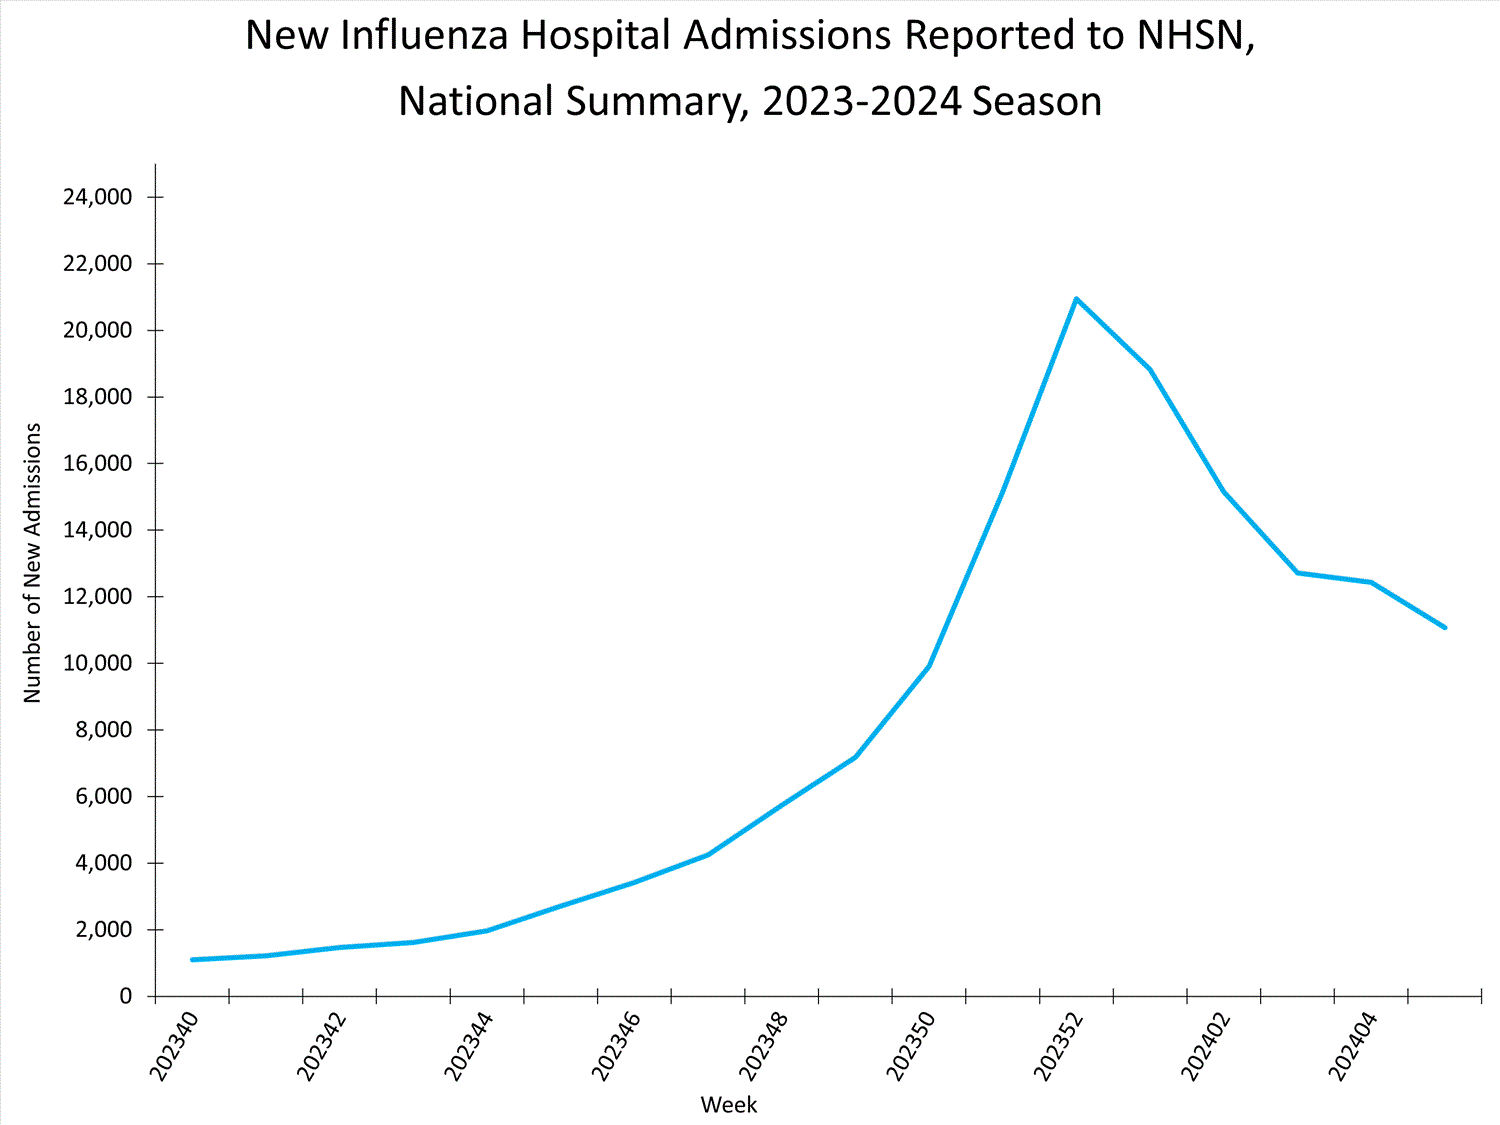
    national levels of influenza hospitalizations
    View Chart Data | View Full Screen

    Additional NHSN Hospitalization Surveillance information:
    Surveillance Methods | Additional Data | FluView Interactive Mortality Surveillance

    National Center for Health Statistics (NCHS) Mortality Surveillance


    Based on NCHS mortality surveillance data available on February 8, 2024, 0.8% of the deaths that occurred during the week ending February 3, 2024 (Week 5), were due to influenza. This percentage decreased (≥ 0.1 percentage point change) compared to Week 4. The data presented are preliminary and may change as more data are received and processed.


    Additional pneumonia, influenza and COVID-19 mortality surveillance information for current and past seasons:
    Surveillance Methods | FluView Interactive Influenza-Associated Pediatric Mortality


    Eight influenza-associated pediatric deaths occurring during the 2023-2024 season were reported to CDC during Week 5. The deaths occurred between Week 51 of 2023 (the week ending December 23, 2023) and Week 5 of 2024 (the week ending February 3, 2024). Seven deaths were associated with influenza A viruses. Four of the influenza A viruses had subtyping performed; three were A(H1N1) viruses and one was an A(H3) virus. One death was associated with influenza B virus with no lineage determined.

    A total of 74 influenza-associated pediatric deaths occurring during the 2023-2024 season have been reported to CDC.


    Additional pediatric mortality surveillance information for current and past seasons:
    Surveillance Methods | FluView Interactive Trend Indicators


    Increasing:
    Decreasing:
    Stable: Indicators Status by System


    Clinical Labs: Up or down arrows indicate a change of greater than or equal to 0.5 percentage points in the percent of specimens positive for influenza compared to the previous week.
    Outpatient Respiratory Illness (ILINet): Up or down arrows indicate a change of greater than 0.1 percentage points in the percent of visits due to respiratory illness (ILI) compared to the previous week.
    NHSN Hospitalizations: Up or down arrows indicate change of greater than or equal to 5% of the number of patients admitted with laboratory-confirmed influenza compared to the previous week.
    NCHS Mortality: Up or down arrows indicate change of greater than 0.1 percentage points of the percent of deaths due to influenza compared to the previous week. Reference Footnotes


    1U.S. Influenza Surveillance: Purpose and Methods (2023 Oct). Centers for Disease Control and Prevention. https://www.cdc.gov/flu/weekly/overview.htm#ILINet.

    2Grohskopf LA, Blanton LH, Ferdinands JM, Chung JR, Broder KR, Talbot HK. Prevention and Control of Seasonal Influenza with Vaccines: Recommendations of the Advisory Committee on Immunization Practices — United States, 2023–24 Influenza Season. MMWR Recomm Rep 2023;72(No. RR-2):1–25. DOI: http://dx.doi.org/10.15585/mmwr.rr7202a1

    3Influenza Antiviral Medications: Summary for Clinicians (2023 Sept). Centers for Disease Control and Prevention. https://www.cdc.gov/flu/professional...clinicians.htm.

    Additional National and International Influenza Surveillance Information


    FluView Interactive: FluView includes enhanced web-based interactive applications that can provide dynamic visuals of the influenza data collected and analyzed by CDC. These FluView Interactive applications allow people to create customized, visual interpretations of influenza data, as well as make comparisons across flu seasons, regions, age groups and a variety of other demographics.

    National Institute for Occupational Safety and Health: Monthly surveillance data on the prevalence of health-related workplace absenteeism among full-time workers in the United States are available from NIOSH.

    U.S. State and local influenza surveillance: Select a jurisdiction below to access the latest local influenza information.
    https://www.cdc.gov/flu/weekly/index.htm

    Comment


    • #17
      Weekly U.S. Influenza Surveillance Report


      Print
      Updated February 16, 2024

      Key Updates for Week 6, ending February 10, 2024

      Seasonal influenza activity remains elevated nationally with increases in some parts of the country. Viruses


      Clinical Lab 15.7%

      (Trend )


      positive for influenza
      this week


      Public Health Lab
      The most frequently reported influenza viruses this week were influenza A(H1N1)pdm09.

      Virus Characterization
      Genetic and antigenic characterization and antiviral susceptibility are summarized in this report. Illness


      Outpatient Respiratory Illness 4.5%

      (Trend )


      of visits to a health care provider this week were for respiratory illness
      (above baseline).


      Outpatient Respiratory Illness: Activity Map
      This week 10 jurisdictions experienced moderate activity and 27 jurisdictions experienced high or very high activity.

      FluSurv-NET 54.9 per 100,000


      cumulative hospitalization rate.

      NHSN Hospitalizations 10,787 (Trend )


      patients admitted to hospitals with influenza this week.

      NCHS Mortality 0.7%

      (Trend )


      of deaths attributed to influenza this week.

      Pediatric Deaths 8


      influenza-associated deaths were reported
      this week for a total of 82 deaths this season.


      All data are preliminary and may change as more reports are received.

      Directional arrows indicate changes between the current week and the previous week. Additional information on the arrows can be found at the bottom of this page.

      A description of the CDC influenza surveillance system, including methodology and detailed descriptions of each data component is available on the surveillance methods page.

      Additional information on the current and previous influenza seasons for each surveillance component are available on FluView Interactive.

      Key Points
      • Seasonal influenza activity remains elevated nationally with increases in some parts of the country, particularly regions 3, 5, and 7.
      • Nationally, percent positivity for influenza remained stable overall. However, percent positivity for influenza A decreased slightly and percent positivity for influenza B increased slightly, driven primarily by activity in regions 3, 5, and 7.
      • Outpatient respiratory illness has been above baseline1 nationally since November and is above baseline in all 10 HHS regions.
      • The number of weekly flu hospital admissions remained stable compared to last week.
      • During Week 6, of the 766 viruses reported by public health laboratories, 589 (76.9%) were influenza A and 177 (23.1%) were influenza B. Of the 371 influenza A viruses subtyped during Week 6, 219 (59.0%) were influenza A(H1N1) and 152 (41.0%) were A(H3N2).
      • Eight influenza-associated pediatric deaths were reported during Week 6, bringing the 2023-2024 season total to 82 pediatric deaths.
      • CDC estimates that there have been at least 24 million illnesses, 260,000 hospitalizations, and 16,000 deaths from flu so far this season.
      • CDC recommends that everyone 6 months and older get an annual flu vaccine as long as influenza viruses are spreading.2 Vaccination can still provide benefit this season.
      • There also are prescription flu antiviral drugs that can treat flu illness; those should be started as early as possible and are especially important for higher risk patients.3
      • Flu viruses are among several viruses contributing to respiratory disease activity. CDC is providing updated, integrated information about COVID-19, flu, and RSV activity on a weekly basis.
      U.S. Virologic Surveillance


      Nationally, the percentage of respiratory specimens testing positive for influenza in clinical laboratories remained stable (change of <0.5 percentage points) compared to the previous week, but trends varied by region. Regions 1, 2, 3, 5, and 7 reported an increase in percent positivity, regions 4 and 8 remained stable, and regions 6, 9, and 10 reported a decrease. The regions with the highest percent positivity were regions 7 (24.4%), 6 (21.6%), 8 (19.9%), and 5 (18.2%). Since Week 40, influenza A(H1N1)pdm09 has been the predominant virus circulating in all regions. However, the distribution of circulating viruses varies by region, particularly in regions 3, 5 and 7 where influenza B activity has been increasing. For regional and state level data and age group distribution, please visit FluView Interactive. Viruses known to be associated with recent receipt of live attenuated influenza vaccine (LAIV) or found upon further testing to be a vaccine virus are not included, as they are not circulating influenza viruses. Clinical Laboratories


      The results of tests performed by clinical laboratories nationwide are summarized below. Data from clinical laboratories (the percentage of specimens tested that are positive for influenza virus) are used to monitor whether influenza activity is increasing or decreasing.
      No. of specimens tested 98,553 1,993,007
      No. of positive specimens (%) 15,474 (15.7%) 214,718 (10.8%)
      Positive specimens by type
      Influenza A 9,563 (61.8%) 164,859 (76.8%)
      Influenza B 5,911 (38.2%) 49,849 (23.2%)
      6

      INFLUENZA Virus Isolated
      View Chart Data | View Full Screen Public Health Laboratories


      The results of tests performed by public health laboratories nationwide are summarized below. Data from public health laboratories are used to monitor the proportion of circulating influenza viruses that belong to each influenza subtype/lineage.
      No. of specimens tested 2,549 72,061
      No. of positive specimens 766 22,529
      Positive specimens by type/subtype
      Influenza A 589 (76.9%) 18,483 (82.0%)
      Subtyping Performed 371 (63.0%) 15,029 (81.3%)
      (H1N1)pdm09 219 (59.0%) 11,678 (77.7%)
      H3N2 152 (41.0%) 3,351 (22.3%)
      H3N2v 0 (0.0%) 0 (0.0%)
      Subtyping not performed 218 (37.0%) 3,454 (18.7%)
      Influenza B 177 (23.1%) 4,046 (18.0%)
      Lineage testing performed 114 (64.4%) 3,260 (80.6%)
      Yamagata lineage 0 (0.0%) 0 (0.0%)
      Victoria lineage 114 (100%) 3,260 (100%)
      Lineage not performed 63 (35.6%) 786 (19.4%)
      INFLUENZA Virus Isolated
      View Chart Data | View Full Screen

      Additional virologic surveillance information for current and past seasons:
      Surveillance Methods | FluView Interactive: National, Regional, and State Data or Age Data Influenza Virus Characterization


      CDC performs genetic and antigenic characterization of U.S. viruses submitted from state and local public health laboratories according to the Right Size Roadmap submission guidance. These data are used to compare how similar the currently circulating influenza viruses are to the reference viruses representing viruses contained in the current influenza vaccines. The data are also used to monitor evolutionary changes that continually occur in influenza viruses circulating in humans. CDC also tests susceptibility of circulating influenza viruses to antiviral medications including the neuraminidase inhibitors (oseltamivir, zanamivir, and peramivir) and the PA endonuclease inhibitor baloxavir.

      CDC has genetically characterized 1,890 influenza viruses collected since October 1, 2023.
      A/H1 874
      6B.1A.5a 874 (100%) 2a 233 (26.7%)
      2a.1 641 (73.3%)
      A/H3 518
      3C.2a1b.2a 518 (100%) 2a.1b 1 (0.2%)
      2a.3a 1 (0.2%)
      2a.3a.1 515 (99.4%)
      2b 1 (0.2%)
      B/Victoria 498
      V1A 498 (100%) 3a.2 498 (100%)
      B/Yamagata 0
      Y3 0 Y3 0 (0%)
      CDC antigenically characterizes influenza viruses by hemagglutination inhibition (HI) (H1N1pdm09, H3N2, B/Victoria, and B/Yamagata viruses) or neutralization-based HINT (H3N2 viruses) using antisera that ferrets make after being infected with reference viruses representing the 2023-2024 Northern Hemisphere recommended cell or recombinant-based vaccine viruses. Antigenic differences between viruses are determined by comparing how well the antibodies made against the vaccine reference viruses recognize the circulating viruses that have been grown in cell culture. Ferret antisera are useful because antibodies raised against a particular virus can often recognize small changes in the surface proteins of other viruses. In HI assays, viruses with similar antigenic properties have antibody titer differences of less than or equal to 4-fold when compared to the reference (vaccine) virus. In HINT, viruses with similar antigenic properties have antibody neutralization titer differences of less than or equal to 8-fold. Viruses selected for antigenic characterization are a subset representing the genetic changes in the surface proteins seen in genetically characterized viruses.

      Influenza A Viruses
      • A (H1N1)pdm09: 128 A(H1N1)pdm09 viruses were antigenically characterized by HI, and all were well-recognized (reacting at titers that were within 4-fold of the homologous virus titer) by ferret antisera to cell-grown A/Wisconsin/67/2022-like reference viruses representing the A(H1N1)pdm09 component for the cell- and recombinant-based influenza vaccines.
      • A (H3N2): 127 A(H3N2) viruses were antigenically characterized by HI or HINT, and all were well-recognized (reacting at titers that were within 4-fold of the homologous virus titer in HI or reacting at titers that were less than or equal to 8-fold of the homologous virus in HINT) by ferret antisera to cell-grown A/Darwin/6/2021-like reference viruses representing the A(H3N2) component for the cell- and recombinant-based influenza vaccines.

      Influenza B Viruses
      • B/Victoria: Sixty-one influenza B/Victoria-lineage virus were antigenically characterized by HI, and all were well-recognized (reacting at titers that were within 4-fold of the homologous virus titer) by ferret antisera to cell-grown B/Austria/1359417/2021-like reference viruses representing the B/Victoria component for the cell- and recombinant-based influenza vaccines.
      • B/Yamagata: No influenza B/Yamagata-lineage viruses were available for antigenic characterization.

      Assessment of Virus Susceptibility to Antiviral Medications

      CDC assesses susceptibility of influenza viruses to the antiviral medications including the neuraminidase inhibitors (oseltamivir, zanamivir, and peramivir) and the PA endonuclease inhibitor baloxavir using next generation sequence analysis supplemented by laboratory assays. Information about antiviral susceptibility test methods can be found at U.S. Influenza Surveillance: Purpose and Methods | CDC.

      Viruses collected in the U.S. since October 01, 2023, were tested for antiviral susceptibility as follows:
      Neuraminidase Inhibitors Oseltamivir Viruses Tested 1887 872 518 497
      Reduced Inhibition 1 (0.1%) 1 (0.1%) 0 (0.0%) 0 (0.0%)
      Highly Reduced Inhibition 1 (0.1%) 1 (0.1%) 0 (0.0%) 0 (0.0%)
      Peramivir Viruses Tested 1887 872 518 497
      Reduced Inhibition 0 (0.0%) 0 (0.0%) 0 (0.0%) 0 (0.0%)
      Highly Reduced Inhibition 1 (0.1%) 1 (0.1%) 0 (0.0%) 0 (0.0%)
      Zanamivir Viruses Tested 1887 872 518 497
      Reduced Inhibition 0 (0.0%) 0 (0.0%) 0 (0.0%) 0 (0.0%)
      Highly Reduced Inhibition 0 (0.0%) 0 (0.0%) 0 (0.0%) 0 (0.0%)
      PA Cap-Dependent Endonuclease Inhibitor Baloxavir Viruses Tested 1840 847 508 485
      Decreased Susceptibility 1 (0.1%) 0 (0.0%) 1 (0.2%) 0 (0.0%)
      One A(H1N1)pdm09 virus had NA-H275Y amino acid substitution and showed highly reduced inhibition by oseltamivir and peramivir. One (H1N1)pdm09 virus had NA-I223V and NA-S247N amino acid substitutions and showed reduced inhibition by oseltamivir.

      One A(H3N2) virus had PA-I38T amino acid substitution and showed reduced susceptibility to baloxavir.

      High levels of resistance to the adamantanes (amantadine and rimantadine) persist among influenza A(H1N1)pdm09 and influenza A(H3N2) viruses (the adamantanes are not effective against influenza B viruses). Therefore, use of these antivirals for treatment and prevention of influenza A virus infection is not recommended and data from adamantane resistance testing are not presented. Outpatient Respiratory Illness Surveillance


      The U.S. Outpatient Influenza-like Illness Surveillance Network (ILINet) monitors outpatient visits for respiratory illness referred to as influenza-like illness [ILI (fever plus cough or sore throat)], not laboratory-confirmed influenza and will therefore capture respiratory illness visits due to infection with pathogens that can present with similar symptoms, including influenza viruses, SARS-CoV-2, and RSV. It is important to evaluate syndromic surveillance data, including that from ILINet, in the context of other sources of surveillance data to obtain a more complete and accurate picture of influenza, SARS-CoV-2, and other respiratory virus activity. CDC is providing integrated information about COVID-19, influenza, and RSV activity on a website that is updated weekly. Information about other respiratory virus activity can be found on CDC’s National Respiratory and Enteric Virus Surveillance System (NREVSS) website. Outpatient Respiratory Illness Visits


      Nationwide, during Week 6, 4.5% of patient visits reported through ILINet were due to respiratory illness that included fever plus a cough or sore throat, also referred to as ILI. This has remained stable (change of ≤ 0.1 percentage points) compared to Week 5 and has remained above the national baseline of 2.9% since Week 44. The percentage of visits for ILI increased in regions 3, 5, and 7, decreased in regions 6, 9, and 10, and remained stable in regions 1, 2, 4, and 8 in Week 6 compared to Week 5. All regions remain above their region-specific baselines this week. Multiple respiratory viruses are co-circulating, and the relative contribution of influenza virus infection to ILI varies by location.

      Outpatient Respiratory Illness Visits by Age Group


      About 70% of ILINet participants provide both the number of patient visits for respiratory illness and the total number of patient visits for the week broken out by age group. Data from this subset of providers are used to calculate the percentages of patient visits for respiratory illness by age group.

      The percentage of visits for respiratory illness reported in ILINet increased in the 0-4 years and 5-24 years age groups (change of > 0.1 percentage points) and remained stable in the 25-49 years, 50-64 years, and 65+ years age groups during Week 6 compared to Week 5.

      Outpatient Respiratory Illness Activity Map


      Data collected in ILINet are used to produce a measure of ILI activity* by state/jurisdiction and Core Based Statistical Areas (CBSA).
      Week 6
      (Week ending
      Feb. 10, 2024)
      Week 5
      (Week ending
      Feb. 3, 2024)
      Week 6
      (Week ending
      Feb. 10, 2024)
      Week 5
      (Week ending
      Feb. 3, 2024)
      Very High 9 6 14 14
      High 18 19 114 103
      Moderate 10 10 122 119
      Low 10 12 200 184
      Minimal 8 7 252 288
      Insufficient Data 0 1 227 221


      *Data collected in ILINet may disproportionally represent certain populations within a jurisdiction or CBSA, and therefore, may not accurately depict the full picture of influenza activity for the entire jurisdiction or CBSA. Differences in the data presented here by CDC and independently by some health departments likely represent differing levels of data completeness with data presented by the health department likely being the more complete.

      Additional information about medically attended visits for ILI for current and past seasons:
      Surveillance Methods | FluView Interactive: National, Regional, and State Data or ILI Activity Map Hospitalization Surveillance

      FluSurv-NET


      The Influenza Hospitalization Surveillance Network (FluSurv-NET) conducts population-based surveillance for laboratory-confirmed influenza-related hospitalizations in select counties in 14 states and represents approximately 9% of the U.S. population. FluSurv-NET hospitalization data are preliminary. As data are received each week, prior case counts and rates are updated accordingly.

      A total of 16,791 laboratory-confirmed influenza-associated hospitalizations were reported by FluSurv-NET sites between October 1, 2023, and February 10, 2024. The weekly hospitalization rate observed in Week 6 was 2.6 per 100,000 population. The weekly hospitalization rate observed during Week 52 is the third highest peak weekly rate observed during all seasons going back to 2010-2011, following the 2014-2015 and 2017-2018 seasons. The overall cumulative hospitalization rate was 54.9 per 100,000 population. This is the third highest cumulative in-season hospitalization rate observed in Week 6, following the 2017-2018 season (67.9) and 2022-2023 season (59.5). Cumulative in-season hospitalization rates observed in Week 6 from 2010-2011 through 2021-2022 ranged from 0.6 to 48.7.

      When examining rates by age, the highest cumulative hospitalization rate per 100,000 population was among adults aged 65 years and older (147.8), followed by adults aged 50-64 years (67.2) and children aged 0-4 years (58.3). When examining age-adjusted rates by race and ethnicity, the highest rate of hospitalization per 100,000 population was among non-Hispanic Black persons (105.9), followed by non-Hispanic American Indian or Alaska Native persons (76.9), Hispanic persons (52.7), non-Hispanic White persons (40.1), and non-Hispanic Asian/Pacific Islander persons (30.3).

      Among 16,791 hospitalizations, 14,749 (87.8%) were associated with influenza A virus, 1,914 (11.4%) with influenza B virus, 30 (0.2%) with influenza A virus and influenza B virus co-infection, and 98 (0.6%) with influenza virus for which the type was not determined. Among those with influenza A subtype information, 2,472 (75.5%) were A(H1N1) pdm09 and 804 (24.5%) were A(H3N2). Based on preliminary data, of the 1,018 laboratory-confirmed influenza-associated hospitalizations with more complete data admitted through December 2023, 4.0% (95% CI: 1.2%-6.8%) also tested positive for SARS-CoV-2.

      Among 729 hospitalized adults with information on underlying medical conditions, 91.6% had at least one reported underlying medical condition; the most commonly reported were hypertension, cardiovascular disease, obesity, and metabolic disorder. Among 170 hospitalized children with information on underlying medical conditions, 68.1% had at least one reported underlying medical condition; the most commonly reported was asthma, followed by obesity and neurologic disease.

      FluSurvNet Cumulative Rates

      View Full Screen

      In this figure, cumulative rates for all seasons prior to the 2023-2024 season reflect end-of-season rates. For the 2023-2024 season, rates for recent hospitals admissions are subject to reporting delays. As hospitalization data are reviewed each week, prior case counts and rates are updated accordingly.

      FluSurvNet Weekly Rate

      View Full Screen

      In this figure, weekly rates for all seasons prior to the 2023-24 season reflect end-of-season rates. For the 2023-24 season, rates for recent hospital admissions are subject to reporting delays and are shown as a dashed line for the current season. As hospitalization data are received each week, prior case counts and rates are updated accordingly.

      Additional FluSurv-NET hospitalization surveillance information for current and past seasons and additional age groups:
      Surveillance Methods |FluView Interactive: Rates by Age, Sex, and Race/Ethnicity or Data on Patient Characteristics | RESP-NET Interactive National Healthcare Safety Network (NHSN) Hospitalization Surveillance


      Hospitals report to NHSN the weekly number of patients admitted with laboratory-confirmed influenza. During Week 6, 10,787 patients with laboratory-confirmed influenza were admitted to a hospital. The number of patients admitted to a hospital with laboratory-confirmed influenza for Week 6 remained stable compared to Week 5 (change of <5%) nationally. The number of hospitalizations increased in regions 5 and 7, remained stable in regions 1, 2, 3, and 4, and decreased in regions 6, 8, 9, and 10 this week compared to Week 5.


      Additional NHSN Hospitalization Surveillance information:
      Surveillance Methods | Additional Data | FluView Interactive Mortality Surveillance

      National Center for Health Statistics (NCHS) Mortality Surveillance


      Based on NCHS mortality surveillance data available on February 15, 2024, 0.7% of the deaths that occurred during the week ending February 10, 2024 (Week 6), were due to influenza. This percentage decreased (≥ 0.1 percentage point change) compared to Week 5. The data presented are preliminary and may change as more data are received and processed.


      Additional pneumonia, influenza and COVID-19 mortality surveillance information for current and past seasons:
      Surveillance Methods | FluView Interactive Influenza-Associated Pediatric Mortality


      Eight influenza-associated pediatric deaths occurring during the 2023-2024 season were reported to CDC during Week 6. Three deaths occurred during Week 4 (the week ending January 27, 2024) and five deaths occurred in Week 5 (the week ending February 3, 2024). Three deaths were associated with influenza A viruses. Two of the influenza A viruses had subtyping performed; they were A(H1N1) and A(H3) viruses. Five deaths were associated with influenza B viruses with no lineage determined.

      A total of 82 influenza-associated pediatric deaths occurring during the 2023-2024 season have been reported to CDC.


      Additional pediatric mortality surveillance information for current and past seasons:
      Surveillance Methods | FluView Interactive Trend Indicators


      Increasing:
      Decreasing:
      Stable: Indicators Status by System


      Clinical Labs: Up or down arrows indicate a change of greater than or equal to 0.5 percentage points in the percent of specimens positive for influenza compared to the previous week.
      Outpatient Respiratory Illness (ILINet): Up or down arrows indicate a change of greater than 0.1 percentage points in the percent of visits due to respiratory illness (ILI) compared to the previous week.
      NHSN Hospitalizations: Up or down arrows indicate change of greater than or equal to 5% of the number of patients admitted with laboratory-confirmed influenza compared to the previous week.
      NCHS Mortality: Up or down arrows indicate change of greater than 0.1 percentage points of the percent of deaths due to influenza compared to the previous week. Reference Footnotes


      1U.S. Influenza Surveillance: Purpose and Methods (2023 Oct). Centers for Disease Control and Prevention. https://www.cdc.gov/flu/weekly/overview.htm#ILINet.

      2Grohskopf LA, Blanton LH, Ferdinands JM, Chung JR, Broder KR, Talbot HK. Prevention and Control of Seasonal Influenza with Vaccines: Recommendations of the Advisory Committee on Immunization Practices — United States, 2023–24 Influenza Season. MMWR Recomm Rep 2023;72(No. RR-2):1–25. DOI: http://dx.doi.org/10.15585/mmwr.rr7202a1

      3Influenza Antiviral Medications: Summary for Clinicians (2023 Sept). Centers for Disease Control and Prevention. https://www.cdc.gov/flu/professional...clinicians.htm.

      Additional National and International Influenza Surveillance Information


      FluView Interactive: FluView includes enhanced web-based interactive applications that can provide dynamic visuals of the influenza data collected and analyzed by CDC. These FluView Interactive applications allow people to create customized, visual interpretations of influenza data, as well as make comparisons across flu seasons, regions, age groups and a variety of other demographics.

      National Institute for Occupational Safety and Health: Monthly surveillance data on the prevalence of health-related workplace absenteeism among full-time workers in the United States are available from NIOSH.

      U.S. State and local influenza surveillance: Select a jurisdiction below to access the latest local influenza information.
      https://www.cdc.gov/flu/weekly/index.htm

      Comment


      • #18
        Weekly U.S. Influenza Surveillance Report


        Print
        Updated February 23, 2024

        Key Updates for Week 7, ending February 17, 2024

        Seasonal influenza activity remains elevated nationally with increases in some parts of the country. Viruses


        Clinical Lab 14.8%

        (Trend )


        positive for influenza
        this week


        Public Health Lab
        The most frequently reported influenza viruses this week were influenza A(H1N1)pdm09.

        Virus Characterization
        Genetic and antigenic characterization and antiviral susceptibility are summarized in this report. Illness


        Outpatient Respiratory Illness 4.5%

        (Trend )


        of visits to a health care provider this week were for respiratory illness
        (above baseline).


        Outpatient Respiratory Illness: Activity Map
        This week 11 jurisdictions experienced moderate activity and 27 jurisdictions experienced high or very high activity.

        FluSurv-NET 58.2 per 100,000


        cumulative hospitalization rate.

        NHSN Hospitalizations 10,480 (Trend )


        patients admitted to hospitals with influenza this week.

        NCHS Mortality 0.8%

        (Trend )


        of deaths attributed to influenza this week.

        Pediatric Deaths 9


        influenza-associated deaths were reported
        this week for a total of 91 deaths this season.


        All data are preliminary and may change as more reports are received.

        Directional arrows indicate changes between the current week and the previous week. Additional information on the arrows can be found at the bottom of this page.

        A description of the CDC influenza surveillance system, including methodology and detailed descriptions of each data component is available on the surveillance methods page.

        Additional information on the current and previous influenza seasons for each surveillance component are available on FluView Interactive.

        Key Points
        • Seasonal influenza activity remains elevated nationally with increases in some parts of the country, particularly regions 1, 2, 3, 5, and 7.
        • Nationally, percent positivity for influenza decreased slightly overall with percent positivity for influenza A decreasing and percent positivity for influenza B remaining stable. However, trends in percent positivity varied by region with increases reported in regions 2, 3, and 7.
        • Outpatient respiratory illness has been above baseline1 nationally since November and is above baseline in all 10 HHS regions.
        • The number of weekly flu hospital admissions remained stable compared to last week but have been showing a decreasing trend since Week 1.
        • During Week 6, of the 668 viruses reported by public health laboratories, 479 (71.7%) were influenza A and 189 (28.3%) were influenza B. Of the 298 influenza A viruses subtyped during Week 6, 153 (51.3%) were influenza A(H1N1) and 145 (48.7%) were A(H3N2).
        • Nine influenza-associated pediatric deaths were reported during Week 7, bringing the 2023-2024 season total to 91 pediatric deaths.
        • CDC estimates that there have been at least 25 million illnesses, 280,000 hospitalizations, and 17,000 deaths from flu so far this season.
        • CDC recommends that everyone 6 months and older get an annual flu vaccine as long as influenza viruses are spreading.2 Vaccination can still provide benefit this season.
        • There also are prescription flu antiviral drugs that can treat flu illness; those should be started as early as possible and are especially important for higher risk patients.3
        • Flu viruses are among several viruses contributing to respiratory disease activity. CDC is providing updated, integrated information about COVID-19, flu, and RSV activity on a weekly basis.
        U.S. Virologic Surveillance


        Nationally, the percentage of respiratory specimens testing positive for influenza in clinical laboratories decreased (change of <0.5 percentage points) compared to the previous week, but trends varied by region. Regions 2, 3, and 7 reported an increase, regions 4, 5, and 8 reported a decrease and regions 1, 9, and 10 remained stable during Week 7 compared to Week 6. The regions with the highest percent positivity were regions 7 (27.6%), 6 (19.6%), 5 (18.6%), and 3 (18.0%). Since Week 40, influenza A(H1N1)pdm09 has been the predominant virus circulating in all regions. However, the distribution of circulating viruses varies by region, particularly in regions 3, 5, and 7, where influenza B activity has been increasing. For regional and state level data and age group distribution, please visit FluView Interactive. Viruses known to be associated with recent receipt of live attenuated influenza vaccine (LAIV) or found upon further testing to be a vaccine virus are not included, as they are not circulating influenza viruses. Clinical Laboratories


        The results of tests performed by clinical laboratories nationwide are summarized below. Data from clinical laboratories (the percentage of specimens tested that are positive for influenza virus) are used to monitor whether influenza activity is increasing or decreasing.
        No. of specimens tested 89,939 2,118,431
        No. of positive specimens (%) 13,304 (14.8%) 231,053 (10.9%)
        Positive specimens by type
        Influenza A 8,072 (60.7%) 174,793 (75.7%)
        Influenza B 5,232 (39.3%) 56,250 (24.3%)
        6

        INFLUENZA Virus Isolated
        View Chart Data | View Full Screen Public Health Laboratories


        The results of tests performed by public health laboratories nationwide are summarized below. Data from public health laboratories are used to monitor the proportion of circulating influenza viruses that belong to each influenza subtype/lineage.
        No. of specimens tested 2,639 76,039
        No. of positive specimens 668 24,008
        Positive specimens by type/subtype
        Influenza A 479 (71.7%) 19,549 (81.4%)
        Subtyping Performed 298 (62.2%) 15,907 (81.4%)
        (H1N1)pdm09 153 (51.3%) 12,186 (76.6%)
        H3N2 145 (48.7%) 3,721 (23.4%)
        H3N2v 0 (0.0%) 0 (0.0%)
        Subtyping not performed 181 (37.8%) 3,642 (18.6%)
        Influenza B 189 (28.3%) 4,459 (18.6%)
        Lineage testing performed 118 (62.4%) 3,589 (80.5%)
        Yamagata lineage 0 (0.0%) 0 (0.0%)
        Victoria lineage 118 (100%) 3,589 (100%)
        Lineage not performed 71 (37.6%) 870 (19.5%)
        INFLUENZA Virus Isolated
        View Chart Data | View Full Screen

        Additional virologic surveillance information for current and past seasons:
        Surveillance Methods | FluView Interactive: National, Regional, and State Data or Age Data Influenza Virus Characterization


        CDC performs genetic and antigenic characterization of U.S. viruses submitted from state and local public health laboratories according to the Right Size Roadmap submission guidance. These data are used to compare how similar the currently circulating influenza viruses are to the reference viruses representing viruses contained in the current influenza vaccines. The data are also used to monitor evolutionary changes that continually occur in influenza viruses circulating in humans. CDC also tests susceptibility of circulating influenza viruses to antiviral medications including the neuraminidase inhibitors (oseltamivir, zanamivir, and peramivir) and the PA endonuclease inhibitor baloxavir.

        CDC has genetically characterized 2,114 influenza viruses collected since October 1, 2023.
        A/H1 962
        6B.1A.5a 962 (100%) 2a 253 (26.3%)
        2a.1 709 (73.7%)
        A/H3 598
        3C.2a1b.2a 598 (100%) 2a.1b 1 (0.2%)
        2a.3a 1 (0.2%)
        2a.3a.1 595 (99.4%)
        2b 1 (0.2%)
        B/Victoria 554
        V1A 554 (100%) 3a.2 554 (100%)
        B/Yamagata 0
        Y3 0 Y3 0 (0%)
        CDC antigenically characterizes influenza viruses by hemagglutination inhibition (HI) (H1N1pdm09, H3N2, B/Victoria, and B/Yamagata viruses) or neutralization-based HINT (H3N2 viruses) using antisera that ferrets make after being infected with reference viruses representing the 2023-2024 Northern Hemisphere recommended cell or recombinant-based vaccine viruses. Antigenic differences between viruses are determined by comparing how well the antibodies made against the vaccine reference viruses recognize the circulating viruses that have been grown in cell culture. Ferret antisera are useful because antibodies raised against a particular virus can often recognize small changes in the surface proteins of other viruses. In HI assays, viruses with similar antigenic properties have antibody titer differences of less than or equal to 4-fold when compared to the reference (vaccine) virus. In HINT, viruses with similar antigenic properties have antibody neutralization titer differences of less than or equal to 8-fold. Viruses selected for antigenic characterization are a subset representing the genetic changes in the surface proteins seen in genetically characterized viruses.

        Influenza A Viruses
        • A (H1N1)pdm09: 128 A(H1N1)pdm09 viruses were antigenically characterized by HI, and all were well-recognized (reacting at titers that were within 4-fold of the homologous virus titer) by ferret antisera to cell-grown A/Wisconsin/67/2022-like reference viruses representing the A(H1N1)pdm09 component for the cell- and recombinant-based influenza vaccines.
        • A (H3N2): 127 A(H3N2) viruses were antigenically characterized by HI or HINT, and all were well-recognized (reacting at titers that were within 4-fold of the homologous virus titer in HI or reacting at titers that were less than or equal to 8-fold of the homologous virus in HINT) by ferret antisera to cell-grown A/Darwin/6/2021-like reference viruses representing the A(H3N2) component for the cell- and recombinant-based influenza vaccines.

        Influenza B Viruses
        • B/Victoria: Seventy-six influenza B/Victoria-lineage virus were antigenically characterized by HI, and all were well-recognized (reacting at titers that were within 4-fold of the homologous virus titer) by ferret antisera to cell-grown B/Austria/1359417/2021-like reference viruses representing the B/Victoria component for the cell- and recombinant-based influenza vaccines.
        • B/Yamagata: No influenza B/Yamagata-lineage viruses were available for antigenic characterization.

        Assessment of Virus Susceptibility to Antiviral Medications

        CDC assesses susceptibility of influenza viruses to the antiviral medications including the neuraminidase inhibitors (oseltamivir, zanamivir, and peramivir) and the PA endonuclease inhibitor baloxavir using next generation sequence analysis supplemented by laboratory assays. Information about antiviral susceptibility test methods can be found at U.S. Influenza Surveillance: Purpose and Methods | CDC.

        Viruses collected in the U.S. since October 01, 2023, were tested for antiviral susceptibility as follows:
        Neuraminidase Inhibitors Oseltamivir Viruses Tested 2,081 944 582 555
        Reduced Inhibition 1 (0.1%) 1 (0.1%) 0 (0.0%) 0 (0.0%)
        Highly Reduced Inhibition 1 (0.1%) 1 (0.1%) 0 (0.0%) 0 (0.0%)
        Peramivir Viruses Tested 2,081 944 582 555
        Reduced Inhibition 0 (0.0%) 0 (0.0%) 0 (0.0%) 0 (0.0%)
        Highly Reduced Inhibition 1 (0.1%) 1 (0.1%) 0 (0.0%) 0 (0.0%)
        Zanamivir Viruses Tested 2,081 944 582 555
        Reduced Inhibition 0 (0.0%) 0 (0.0%) 0 (0.0%) 0 (0.0%)
        Highly Reduced Inhibition 0 (0.0%) 0 (0.0%) 0 (0.0%) 0 (0.0%)
        PA Cap-Dependent Endonuclease Inhibitor Baloxavir Viruses Tested 2,029 919 570 540
        Decreased Susceptibility 1 (0.1%) 0 (0.0%) 1 (0.2%) 0 (0.0%)
        One A(H1N1)pdm09 virus had NA-H275Y amino acid substitution and showed highly reduced inhibition by oseltamivir and peramivir. One (H1N1)pdm09 virus had NA-I223V and NA-S247N amino acid substitutions and showed reduced inhibition by oseltamivir.

        One A(H3N2) virus had PA-I38T amino acid substitution and showed reduced susceptibility to baloxavir.

        High levels of resistance to the adamantanes (amantadine and rimantadine) persist among influenza A(H1N1)pdm09 and influenza A(H3N2) viruses (the adamantanes are not effective against influenza B viruses). Therefore, use of these antivirals for treatment and prevention of influenza A virus infection is not recommended and data from adamantane resistance testing are not presented. Outpatient Respiratory Illness Surveillance


        The U.S. Outpatient Influenza-like Illness Surveillance Network (ILINet) monitors outpatient visits for respiratory illness referred to as influenza-like illness [ILI (fever plus cough or sore throat)], not laboratory-confirmed influenza and will therefore capture respiratory illness visits due to infection with pathogens that can present with similar symptoms, including influenza viruses, SARS-CoV-2, and RSV. It is important to evaluate syndromic surveillance data, including that from ILINet, in the context of other sources of surveillance data to obtain a more complete and accurate picture of influenza, SARS-CoV-2, and other respiratory virus activity. CDC is providing integrated information about COVID-19, influenza, and RSV activity on a website that is updated weekly. Information about other respiratory virus activity can be found on CDC’s National Respiratory and Enteric Virus Surveillance System (NREVSS) website. Outpatient Respiratory Illness Visits


        Nationwide, during Week 7, 4.5% of patient visits reported through ILINet were due to respiratory illness that included fever plus a cough or sore throat, also referred to as ILI. This has remained stable (change of ≤ 0.1 percentage points) compared to Week 6. The percentage of visits for ILI remained stable in regions 1, 2, 3, and 10, increased in regions 5, 7, and 9, and decreased in regions 4, 6, and 8 in Week 7 compared to Week 6. All regions remain above their region-specific baselines this week. Multiple respiratory viruses are co-circulating, and the relative contribution of influenza virus infection to ILI varies by location.

        Outpatient Respiratory Illness Visits by Age Group


        About 70% of ILINet participants provide both the number of patient visits for respiratory illness and the total number of patient visits for the week broken out by age group. Data from this subset of providers are used to calculate the percentages of patient visits for respiratory illness by age group.

        The percentage of visits for respiratory illness reported in ILINet increased (change of > 0.1 percentage points) in the 25-49 years, 50-64 years, and 65+ years age groups, decreased in the 0-4 years age group, and remained stable in the 5-24 years age group during Week 7 compared to Week 6.

        Outpatient Respiratory Illness Activity Map


        Data collected in ILINet are used to produce a measure of ILI activity* by state/jurisdiction and Core Based Statistical Areas (CBSA).
        Week 7
        (Week ending
        Feb. 17, 2024)
        Week 6
        (Week ending
        Feb. 10, 2024)
        Week 7
        (Week ending
        Feb. 17, 2024)
        Week 6
        (Week ending
        Feb. 10, 2024)
        Very High 7 9 15 14
        High 20 18 99 112
        Moderate 11 9 121 128
        Low 8 11 227 199
        Minimal 8 8 239 253
        Insufficient Data 1 0 228 223


        *Data collected in ILINet may disproportionally represent certain populations within a jurisdiction or CBSA, and therefore, may not accurately depict the full picture of influenza activity for the entire jurisdiction or CBSA. Differences in the data presented here by CDC and independently by some health departments likely represent differing levels of data completeness with data presented by the health department likely being the more complete.

        Additional information about medically attended visits for ILI for current and past seasons:
        Surveillance Methods | FluView Interactive: National, Regional, and State Data or ILI Activity Map Hospitalization Surveillance

        FluSurv-NET


        The Influenza Hospitalization Surveillance Network (FluSurv-NET) conducts population-based surveillance for laboratory-confirmed influenza-related hospitalizations in select counties in 14 states and represents approximately 9% of the U.S. population. FluSurv-NET hospitalization data are preliminary. As data are received each week, prior case counts and rates are updated accordingly.

        A total of 17,799 laboratory-confirmed influenza-associated hospitalizations were reported by FluSurv-NET sites between October 1, 2023, and February 17, 2024. The weekly hospitalization rate observed in Week 7 was 2.5 per 100,000 population. The weekly hospitalization rate observed during Week 52 is the third highest peak weekly rate observed during all seasons going back to 2010-2011 following the 2014-2015 and 2017-2018 seasons. The overall cumulative hospitalization rate was 58.2 per 100,000 population. This cumulative hospitalization rate is the third highest cumulative hospitalization rate when compared against previous end-of-season rates for Week 7. It is also the third highest cumulative in-season hospitalization rate observed in Week 7, following the 2017-2018 season (74.5) and 2022-2023 season (59.7). Cumulative in-season hospitalization rates observed in Week 7 from 2010-2011 through 2021-2022 ranged from 0.6 to 47.4.

        When examining rates by age, the highest cumulative hospitalization rate per 100,000 population was among adults aged 65 years and older (156.5), followed by adults aged 50-64 years (70.9) and children aged 0-4 years (61.5). When examining age-adjusted rates by race and ethnicity, the highest rate of hospitalization per 100,000 population was among non-Hispanic Black persons (112.7), followed by non-Hispanic American Indian or Alaska Native persons (80.9), Hispanic persons (55.3), non-Hispanic White persons (43.2), and non-Hispanic Asian/Pacific Islander persons (31.7).

        Among 17,799 hospitalizations, 15,564 (87.4%) were associated with influenza A virus, 2,114 (11.9%) with influenza B virus, 33 (0.2%) with influenza A virus and influenza B virus co-infection, and 88 (0.5%) with influenza virus for which the type was not determined. Among those with influenza A subtype information, 2,662 (74.4%) were A(H1N1) pdm09 and 916 (25.6%) were A(H3N2). Based on preliminary data, of the 934 laboratory-confirmed influenza-associated hospitalizations with more complete data admitted through December 2023, 5.0% (95% CI: 2.1%-7.8%) also tested positive for SARS-CoV-2.

        Among 703 hospitalized adults with information on underlying medical conditions, 92.6% had at least one reported underlying medical condition, the most commonly reported were hypertension, cardiovascular disease, obesity, and metabolic disorder. Among 162 hospitalized children with information on underlying medical conditions, 68% had at least one reported underlying medical condition; the most commonly reported was asthma, followed by obesity and neurologic disease.

        FluSurvNet Cumulative Rates

        View Full Screen

        In this figure, cumulative rates for all seasons prior to the 2023-2024 season reflect end-of-season rates. For the 2023-2024 season, rates for recent hospitals admissions are subject to reporting delays. As hospitalization data are reviewed each week, prior case counts and rates are updated accordingly.

        FluSurvNet Weekly Rate

        View Full Screen

        In this figure, weekly rates for all seasons prior to the 2023-24 season reflect end-of-season rates. For the 2023-24 season, rates for recent hospital admissions are subject to reporting delays and are shown as a dashed line for the current season. As hospitalization data are received each week, prior case counts and rates are updated accordingly.

        Additional FluSurv-NET hospitalization surveillance information for current and past seasons and additional age groups:
        Surveillance Methods |FluView Interactive: Rates by Age, Sex, and Race/Ethnicity or Data on Patient Characteristics | RESP-NET Interactive National Healthcare Safety Network (NHSN) Hospitalization Surveillance


        Hospitals report to NHSN the weekly number of patients admitted with laboratory-confirmed influenza. During Week 7, 10,480 patients with laboratory-confirmed influenza were admitted to a hospital. The number of patients admitted to a hospital with laboratory-confirmed influenza for Week 7 remained stable (change of <5%) compared to Week 6 nationally. The number of hospitalizations increased in regions 1, 2, and 3, remained stable in region 5, and decreased in regions 4, 6, 7, 8, 9, and 10 this week compared to Week 6.


        Additional NHSN Hospitalization Surveillance information:
        Surveillance Methods | Additional Data | FluView Interactive Mortality Surveillance

        National Center for Health Statistics (NCHS) Mortality Surveillance


        Based on NCHS mortality surveillance data available on February 22, 2024, 0.8% of the deaths that occurred during the week ending February 17, 2024 (Week 7), were due to influenza. This percentage increased (≥ 0.1 percentage point change) compared to Week 6. The data presented are preliminary and may change as more data are received and processed.


        Additional pneumonia, influenza and COVID-19 mortality surveillance information for current and past seasons:
        Surveillance Methods | FluView Interactive Influenza-Associated Pediatric Mortality


        Nine influenza-associated pediatric deaths occurring during the 2023-2024 season were reported to CDC during Week 7. The deaths occurred during Week 46 of 2023 (the week ending November 18, 2023) and between Weeks 4 and 6 of 2024 (the weeks ending January 27, 2024, and February 10, 2024). Five deaths were associated with influenza A(H1N1) viruses and four deaths were associated with influenza B viruses. One of the influenza B viruses had lineage determined and it was a B/Victoria virus.

        A total of 91 influenza-associated pediatric deaths occurring during the 2023-2024 season have been reported to CDC.


        Additional pediatric mortality surveillance information for current and past seasons:
        Surveillance Methods | FluView Interactive Trend Indicators


        Increasing:
        Decreasing:
        Stable: Indicators Status by System


        Clinical Labs: Up or down arrows indicate a change of greater than or equal to 0.5 percentage points in the percent of specimens positive for influenza compared to the previous week.
        Outpatient Respiratory Illness (ILINet): Up or down arrows indicate a change of greater than 0.1 percentage points in the percent of visits due to respiratory illness (ILI) compared to the previous week.
        NHSN Hospitalizations: Up or down arrows indicate change of greater than or equal to 5% of the number of patients admitted with laboratory-confirmed influenza compared to the previous week.
        NCHS Mortality: Up or down arrows indicate change of greater than 0.1 percentage points of the percent of deaths due to influenza compared to the previous week. Reference Footnotes


        1U.S. Influenza Surveillance: Purpose and Methods (2023 Oct). Centers for Disease Control and Prevention. https://www.cdc.gov/flu/weekly/overview.htm#ILINet.

        2Grohskopf LA, Blanton LH, Ferdinands JM, Chung JR, Broder KR, Talbot HK. Prevention and Control of Seasonal Influenza with Vaccines: Recommendations of the Advisory Committee on Immunization Practices — United States, 2023–24 Influenza Season. MMWR Recomm Rep 2023;72(No. RR-2):1–25. DOI: http://dx.doi.org/10.15585/mmwr.rr7202a1

        3Influenza Antiviral Medications: Summary for Clinicians (2023 Sept). Centers for Disease Control and Prevention. https://www.cdc.gov/flu/professional...clinicians.htm.

        Additional National and International Influenza Surveillance Information


        FluView Interactive: FluView includes enhanced web-based interactive applications that can provide dynamic visuals of the influenza data collected and analyzed by CDC. These FluView Interactive applications allow people to create customized, visual interpretations of influenza data, as well as make comparisons across flu seasons, regions, age groups and a variety of other demographics.

        National Institute for Occupational Safety and Health: Monthly surveillance data on the prevalence of health-related workplace absenteeism among full-time workers in the United States are available from NIOSH.

        U.S. State and local influenza surveillance: Select a jurisdiction below to access the latest local influenza information.
        https://www.cdc.gov/flu/weekly/index.htm

        Comment


        • #19
          Weekly U.S. Influenza Surveillance Report


          Print
          Updated March 1, 2024

          Key Updates for Week 8, ending February 24, 2024

          Seasonal influenza activity remains elevated nationally with increases in some parts of the country. Viruses


          Clinical Lab 14.2%

          (Trend )


          positive for influenza
          this week


          Public Health Lab
          The most frequently reported influenza viruses this week were influenza B/Victoria.

          Virus Characterization
          Genetic and antigenic characterization and antiviral susceptibility are summarized in this report. Illness


          Outpatient Respiratory Illness 4.4%

          (Trend )


          of visits to a health care provider this week were for respiratory illness
          (above baseline).


          Outpatient Respiratory Illness: Activity Map
          This week 12 jurisdictions experienced moderate activity and 27 jurisdictions experienced high or very high activity.

          FluSurv-NET 61.5 per 100,000


          cumulative hospitalization rate.

          NHSN Hospitalizations 10,148 (Trend )


          patients admitted to hospitals with influenza this week.

          NCHS Mortality 0.7%

          (Trend )


          of deaths attributed to influenza this week.

          Pediatric Deaths 2


          influenza-associated deaths were reported
          this week for a total of 93 deaths this season.


          All data are preliminary and may change as more reports are received.

          Directional arrows indicate changes between the current week and the previous week. Additional information on the arrows can be found at the bottom of this page.

          A description of the CDC influenza surveillance system, including methodology and detailed descriptions of each data component is available on the surveillance methods page.

          Additional information on the current and previous influenza seasons for each surveillance component are available on FluView Interactive.

          Key Points
          • Seasonal influenza activity remains elevated nationally with increases in some parts of the country.
          • Nationally, percent positivity for influenza decreased slightly overall with percent positivity for influenza A decreasing and percent positivity for influenza B remaining stable. Trends in percent positivity for influenza A and B varied by region.
          • Outpatient respiratory illness has been above baseline1 nationally since November and is above baseline in all 10 HHS regions.
          • The number of weekly flu hospital admissions remained stable compared to last week.
          • During Week 8, of the 773 viruses reported by public health laboratories, 508 (65.7%) were influenza A and 265 (34.3%) were influenza B. Of the 338 influenza A viruses subtyped during Week 8, 186 (55.0%) were influenza A(H1N1) and 152 (45.0%) were A(H3N2).
          • Two influenza-associated pediatric deaths were reported during Week 8, bringing the 2023-2024 season total to 93 pediatric deaths.
          • CDC estimates that there have been at least 26 million illnesses, 290,000 hospitalizations, and 18,000 deaths from flu so far this season.
          • CDC recommends that everyone 6 months and older get an annual flu vaccine as long as influenza viruses are spreading.2 Vaccination can still provide benefit this season.
          • There also are prescription flu antiviral drugs that can treat flu illness; those should be started as early as possible and are especially important for higher risk patients.3
          • Flu viruses are among several viruses contributing to respiratory disease activity. CDC is providing updated, integrated information about COVID-19, flu, and RSV activity on a weekly basis.
          U.S. Virologic Surveillance


          Nationally, the percentage of respiratory specimens testing positive for influenza in clinical laboratories decreased (change of ≤0.5 percentage points) compared to the previous week, but trends varied by region. Region 7 reported an increase, regions 1, 3, 5, 6, 8 and 9 reported a decrease, and regions 2, 4, and 10 remained stable during Week 8 compared to Week 7. The regions with the highest percent positivity were regions 7 (28.4%), 5 (19.4%), and 6 (18.3). Since Week 40, influenza A(H1N1)pdm09 has been the predominant virus circulating in all regions. However, the distribution of circulating viruses varies by region. For regional and state level data and age group distribution, please visit FluView Interactive. Viruses known to be associated with recent receipt of live attenuated influenza vaccine (LAIV) or found upon further testing to be a vaccine virus are not included, as they are not circulating influenza viruses. Clinical Laboratories


          The results of tests performed by clinical laboratories nationwide are summarized below. Data from clinical laboratories (the percentage of specimens tested that are positive for influenza virus) are used to monitor whether influenza activity is increasing or decreasing.
          No. of specimens tested 87,299 2,214,809
          No. of positive specimens (%) 12,376 (14.2%) 249,106 (11.2%)
          Positive specimens by type
          Influenza A 7,298 (59.0%) 185,263 (74.4%)
          Influenza B 5,078 (41.0%) 63,833 (25.6%)
          6

          INFLUENZA Virus Isolated
          View Chart Data | View Full Screen Public Health Laboratories


          The results of tests performed by public health laboratories nationwide are summarized below. Data from public health laboratories are used to monitor the proportion of circulating influenza viruses that belong to each influenza subtype/lineage.
          No. of specimens tested 2,532 80,259
          No. of positive specimens 773 25,806
          Positive specimens by type/subtype
          Influenza A 508 (65.7%) 20,783 (80.5%)
          Subtyping Performed 338 (66.5%) 16,978 (81.7%)
          (H1N1)pdm09 186 (55.0%) 12,790 (75.3%)
          H3N2 152 (45.0%) 4,188 (24.7%)
          H3N2v 0 (0.0%) 0 (0.0%)
          Subtyping not performed 170 (33.5%) 3,805 (18.3%)
          Influenza B 265 (34.3%) 5,023 (19.5%)
          Lineage testing performed 187 (70.6%) 4,108 (81.8%)
          Yamagata lineage 0 (0.0%) 0 (0.0%)
          Victoria lineage 187 (100%) 4,108 (100%)
          Lineage not performed 78 (29.4%) 915 (18.2%)
          INFLUENZA Virus Isolated
          View Chart Data | View Full Screen

          Additional virologic surveillance information for current and past seasons:
          Surveillance Methods | FluView Interactive: National, Regional, and State Data or Age Data Influenza Virus Characterization


          CDC performs genetic and antigenic characterization of U.S. viruses submitted from state and local public health laboratories according to the Right Size Roadmap submission guidance. These data are used to compare how similar the currently circulating influenza viruses are to the reference viruses representing viruses contained in the current influenza vaccines. The data are also used to monitor evolutionary changes that continually occur in influenza viruses circulating in humans. CDC also tests susceptibility of circulating influenza viruses to antiviral medications including the neuraminidase inhibitors (oseltamivir, zanamivir, and peramivir) and the PA endonuclease inhibitor baloxavir.

          CDC has genetically characterized 2,226 influenza viruses collected since October 1, 2023.
          A/H1 997
          6B.1A.5a 997 (100%) 2a 254 (25.5%)
          2a.1 743 (74.5%)
          A/H3 639
          3C.2a1b.2a 639 (100%) 2a.1b 1 (0.2%)
          2a.3a 1 (0.2%)
          2a.3a.1 636 (99.5%)
          2b 1 (0.2%)
          B/Victoria 590
          V1A 590 (100%) 3a.2 590 (100%)
          B/Yamagata 0
          Y3 0 Y3 0 (0%)
          CDC antigenically characterizes influenza viruses by hemagglutination inhibition (HI) (H1N1pdm09, H3N2, B/Victoria, and B/Yamagata viruses) or neutralization-based HINT (H3N2 viruses) using antisera that ferrets make after being infected with reference viruses representing the 2023-2024 Northern Hemisphere recommended cell or recombinant-based vaccine viruses. Antigenic differences between viruses are determined by comparing how well the antibodies made against the vaccine reference viruses recognize the circulating viruses that have been grown in cell culture. Ferret antisera are useful because antibodies raised against a particular virus can often recognize small changes in the surface proteins of other viruses. In HI assays, viruses with similar antigenic properties have antibody titer differences of less than or equal to 4-fold when compared to the reference (vaccine) virus. In HINT, viruses with similar antigenic properties have antibody neutralization titer differences of less than or equal to 8-fold. Viruses selected for antigenic characterization are a subset representing the genetic changes in the surface proteins seen in genetically characterized viruses.

          Influenza A Viruses
          • A (H1N1)pdm09: 172 A(H1N1)pdm09 viruses were antigenically characterized by HI, and all were well-recognized (reacting at titers that were within 4-fold of the homologous virus titer) by ferret antisera to cell-grown A/Wisconsin/67/2022-like reference viruses representing the A(H1N1)pdm09 component for the cell- and recombinant-based influenza vaccines.
          • A (H3N2): 161 A(H3N2) viruses were antigenically characterized by HI or HINT, and 159 (99%) were well-recognized (reacting at titers that were within 4-fold of the homologous virus titer in HI or reacting at titers that were less than or equal to 8-fold of the homologous virus in HINT) by ferret antisera to cell-grown A/Darwin/6/2021-like reference viruses representing the A(H3N2) component for the cell- and recombinant-based influenza vaccines.

          Influenza B Viruses
          • B/Victoria: One hundred influenza B/Victoria-lineage virus were antigenically characterized by HI, and all were well-recognized (reacting at titers that were within 4-fold of the homologous virus titer) by ferret antisera to cell-grown B/Austria/1359417/2021-like reference viruses representing the B/Victoria component for the cell- and recombinant-based influenza vaccines.
          • B/Yamagata: No influenza B/Yamagata-lineage viruses were available for antigenic characterization.

          Assessment of Virus Susceptibility to Antiviral Medications

          CDC assesses susceptibility of influenza viruses to the antiviral medications including the neuraminidase inhibitors (oseltamivir, zanamivir, and peramivir) and the PA endonuclease inhibitor baloxavir using next generation sequence analysis supplemented by laboratory assays. Information about antiviral susceptibility test methods can be found at U.S. Influenza Surveillance: Purpose and Methods | CDC.

          Viruses collected in the U.S. since October 01, 2023, were tested for antiviral susceptibility as follows:
          Neuraminidase Inhibitors Oseltamivir Viruses Tested 2,229 998 640 591
          Reduced Inhibition 1 (0.4%) 1 (0.1%) 0 (0.0%) 0 (0.0%)
          Highly Reduced Inhibition 1 (0.4%) 1 (0.1%) 0 (0.0%) 0 (0.0%)
          Peramivir Viruses Tested 2,229 998 640 591
          Reduced Inhibition 0 (0.0%) 0 (0.0%) 0 (0.0%) 0 (0.0%)
          Highly Reduced Inhibition 1 (0.4%) 1 (0.1%) 0 (0.0%) 0 (0.0%)
          Zanamivir Viruses Tested 2,229 998 640 591
          Reduced Inhibition 0 (0.0%) 0 (0.0%) 0 (0.0%) 0 (0.0%)
          Highly Reduced Inhibition 0 (0.0%) 0 (0.0%) 0 (0.0%) 0 (0.0%)
          PA Cap-Dependent Endonuclease Inhibitor Baloxavir Viruses Tested 2,162 970 623 569
          Decreased Susceptibility 1 (0.5%) 0 (0.0%) 1 (0.2%) 0 (0.0%)
          One A(H1N1)pdm09 virus had NA-H275Y amino acid substitution and showed highly reduced inhibition by oseltamivir and peramivir. One (H1N1)pdm09 virus had NA-I223V and NA-S247N amino acid substitutions and showed reduced inhibition by oseltamivir.

          One A(H3N2) virus had PA-I38T amino acid substitution and showed reduced susceptibility to baloxavir.

          High levels of resistance to the adamantanes (amantadine and rimantadine) persist among influenza A(H1N1)pdm09 and influenza A(H3N2) viruses (the adamantanes are not effective against influenza B viruses). Therefore, use of these antivirals for treatment and prevention of influenza A virus infection is not recommended and data from adamantane resistance testing are not presented. Outpatient Respiratory Illness Surveillance


          The U.S. Outpatient Influenza-like Illness Surveillance Network (ILINet) monitors outpatient visits for respiratory illness referred to as influenza-like illness [ILI (fever plus cough or sore throat)], not laboratory-confirmed influenza and will therefore capture respiratory illness visits due to infection with pathogens that can present with similar symptoms, including influenza viruses, SARS-CoV-2, and RSV. It is important to evaluate syndromic surveillance data, including that from ILINet, in the context of other sources of surveillance data to obtain a more complete and accurate picture of influenza, SARS-CoV-2, and other respiratory virus activity. CDC is providing integrated information about COVID-19, influenza, and RSV activity on a website that is updated weekly. Information about other respiratory virus activity can be found on CDC’s National Respiratory and Enteric Virus Surveillance System (NREVSS) website. Outpatient Respiratory Illness Visits


          Nationwide, during Week 8, 4.4% of patient visits reported through ILINet were due to respiratory illness that included fever plus a cough or sore throat, also referred to as ILI. This has remained stable (change of ≤ 0.1 percentage points) compared to Week 7. The percentage of visits for ILI remained stable in regions 1, 2, 3, and 4, increased in regions 5, 7, and 9, and decreased in regions 6, 8, and 10 in Week 8 compared to Week 7. All regions remain above their region-specific baselines this week. Multiple respiratory viruses are co-circulating, and the relative contribution of influenza virus infection to ILI varies by location.

          Outpatient Respiratory Illness Visits by Age Group


          About 70% of ILINet participants provide both the number of patient visits for respiratory illness and the total number of patient visits for the week broken out by age group. Data from this subset of providers are used to calculate the percentages of patient visits for respiratory illness by age group.

          The percentage of visits for respiratory illness reported in ILINet remained stable for all age groups during Week 8 compared to Week 7.

          Outpatient Respiratory Illness Activity Map


          Data collected in ILINet are used to produce a measure of ILI activity* by state/jurisdiction and Core Based Statistical Areas (CBSA).
          Week 8
          (Week ending
          Feb. 24, 2024)
          Week 7
          (Week ending
          Feb. 17, 2024)
          Week 8
          (Week ending
          Feb. 24, 2024)
          Week 7
          (Week ending
          Feb. 17, 2024)
          Very High 5 7 16 14
          High 22 20 109 108
          Moderate 12 11 116 123
          Low 7 10 210 227
          Minimal 8 7 250 235
          Insufficient Data 1 0 228 222


          *Data collected in ILINet may disproportionally represent certain populations within a jurisdiction or CBSA, and therefore, may not accurately depict the full picture of influenza activity for the entire jurisdiction or CBSA. Differences in the data presented here by CDC and independently by some health departments likely represent differing levels of data completeness with data presented by the health department likely being the more complete.

          Additional information about medically attended visits for ILI for current and past seasons:
          Surveillance Methods | FluView Interactive: National, Regional, and State Data or ILI Activity Map Hospitalization Surveillance

          FluSurv-NET


          The Influenza Hospitalization Surveillance Network (FluSurv-NET) conducts population-based surveillance for laboratory-confirmed influenza-related hospitalizations in select counties in 14 states and represents approximately 9% of the U.S. population. FluSurv-NET hospitalization data are preliminary. As data are received each week, prior case counts and rates are updated accordingly.

          A total of 18,790 laboratory-confirmed influenza-associated hospitalizations were reported by FluSurv-NET sites between October 1, 2023, and February 24, 2024. The weekly hospitalization rate observed in Week 8 was 2.6 per 100,000 population. The weekly hospitalization rate observed during Week 52 is the third highest peak weekly rate observed during all seasons going back to 2010-2011 following the 2014-2015 and 2017-2018 seasons. The overall cumulative hospitalization rate was 61.5 per 100,000 population. This cumulative hospitalization rate is the second highest cumulative hospitalization rate when compared against previous end-of-season rates for Week 8, and it is the second highest cumulative in-season hospitalization rate observed in Week 8, following the 2017-2018 season (81.7). Cumulative in-season hospitalization rates observed in Week 8 from 2010-2011 through 2021-2022 ranged from 0.7 to 59.9.

          When examining rates by age, the highest cumulative hospitalization rate per 100,000 population was among adults aged 65 years and older (166.1), followed by adults aged 50-64 years (74.8) and children aged 0-4 years (63.6). When examining age-adjusted rates by race and ethnicity, the highest rate of hospitalization per 100,000 population was among non-Hispanic Black persons (119.1), followed by non-Hispanic American Indian or Alaska Native persons (86.5), Hispanic persons (58.8), non-Hispanic White persons (46.2), and non-Hispanic Asian/Pacific Islander persons (33.5).

          Among 18,790 hospitalizations, 16,351 (87.0%) were associated with influenza A virus, 2,307 (12.3%) with influenza B virus, 35 (0.2%) with influenza A virus and influenza B virus co-infection, and 97 (0.5%) with influenza virus for which the type was not determined. Among those with influenza A subtype information, 2,763 (74.3%) were A(H1N1) pdm09 and 954 (25.7%) were A(H3N2).

          Among 2,052 hospitalized adults with information on underlying medical conditions, 95.6% had at least one reported underlying medical condition; the most commonly reported were hypertension, cardiovascular disease, obesity, and metabolic disease. Among 1,079 hospitalized women of childbearing age (15-49 years) with information on pregnancy status, 23.8% were pregnant. Among 571 hospitalized children with information on underlying medical conditions, 69.3% had at least one reported underlying medical condition; the most commonly reported was asthma, followed by obesity and neurologic disease.

          FluSurvNet Cumulative Rates

          View Full Screen

          In this figure, cumulative rates for all seasons prior to the 2023-2024 season reflect end-of-season rates. For the 2023-2024 season, rates for recent hospitals admissions are subject to reporting delays. As hospitalization data are reviewed each week, prior case counts and rates are updated accordingly.

          FluSurvNet Weekly Rate

          View Full Screen

          In this figure, weekly rates for all seasons prior to the 2023-24 season reflect end-of-season rates. For the 2023-24 season, rates for recent hospital admissions are subject to reporting delays and are shown as a dashed line for the current season. As hospitalization data are received each week, prior case counts and rates are updated accordingly.

          Additional FluSurv-NET hospitalization surveillance information for current and past seasons and additional age groups:
          Surveillance Methods |FluView Interactive: Rates by Age, Sex, and Race/Ethnicity or Data on Patient Characteristics | RESP-NET Interactive National Healthcare Safety Network (NHSN) Hospitalization Surveillance


          Hospitals report to NHSN the weekly number of patients admitted with laboratory-confirmed influenza. During Week 8, 10,148 patients with laboratory-confirmed influenza were admitted to a hospital. Nationally, the number of patients admitted to a hospital with laboratory-confirmed influenza for Week 8 remained stable (change of <5%) compared to Week 7. The number of hospitalizations increased in regions 5, 7, and 10, remained stable in regions 1 and 3, and decreased in regions 2, 4, 6, 8, and 9 this week compared to Week 7.


          Additional NHSN Hospitalization Surveillance information:
          Surveillance Methods | Additional Data | FluView Interactive Mortality Surveillance

          National Center for Health Statistics (NCHS) Mortality Surveillance


          Based on NCHS mortality surveillance data available on February 29, 2024, 0.7% of the deaths that occurred during the week ending February 24, 2024 (Week 8), were due to influenza. This percentage remained stable (< 0.1 percentage point change) compared to Week 7. The data presented are preliminary and may change as more data are received and processed.


          Additional pneumonia, influenza and COVID-19 mortality surveillance information for current and past seasons:
          Surveillance Methods | FluView Interactive Influenza-Associated Pediatric Mortality


          Two influenza-associated pediatric deaths occurring during the 2023-2024 season were reported to CDC during Week 8. One death occurred during Week 6 (the week ending February 10, 2024) and one occurred during Week 7 (the week ending February 17, 2024). Both deaths were associated with an influenza B virus with no lineage determined.

          A total of 93 influenza-associated pediatric deaths occurring during the 2023-2024 season have been reported to CDC.


          Additional pediatric mortality surveillance information for current and past seasons:
          Surveillance Methods | FluView Interactive Trend Indicators


          Increasing:
          Decreasing:
          Stable: Indicators Status by System


          Clinical Labs: Up or down arrows indicate a change of greater than or equal to 0.5 percentage points in the percent of specimens positive for influenza compared to the previous week.
          Outpatient Respiratory Illness (ILINet): Up or down arrows indicate a change of greater than 0.1 percentage points in the percent of visits due to respiratory illness (ILI) compared to the previous week.
          NHSN Hospitalizations: Up or down arrows indicate change of greater than or equal to 5% of the number of patients admitted with laboratory-confirmed influenza compared to the previous week.
          NCHS Mortality: Up or down arrows indicate change of greater than 0.1 percentage points of the percent of deaths due to influenza compared to the previous week. Reference Footnotes


          1U.S. Influenza Surveillance: Purpose and Methods (2023 Oct). Centers for Disease Control and Prevention. https://www.cdc.gov/flu/weekly/overview.htm#ILINet.

          2Grohskopf LA, Blanton LH, Ferdinands JM, Chung JR, Broder KR, Talbot HK. Prevention and Control of Seasonal Influenza with Vaccines: Recommendations of the Advisory Committee on Immunization Practices — United States, 2023–24 Influenza Season. MMWR Recomm Rep 2023;72(No. RR-2):1–25. DOI: http://dx.doi.org/10.15585/mmwr.rr7202a1

          3Influenza Antiviral Medications: Summary for Clinicians (2023 Sept). Centers for Disease Control and Prevention. https://www.cdc.gov/flu/professional...clinicians.htm.

          Additional National and International Influenza Surveillance Information


          FluView Interactive: FluView includes enhanced web-based interactive applications that can provide dynamic visuals of the influenza data collected and analyzed by CDC. These FluView Interactive applications allow people to create customized, visual interpretations of influenza data, as well as make comparisons across flu seasons, regions, age groups and a variety of other demographics.

          National Institute for Occupational Safety and Health: Monthly surveillance data on the prevalence of health-related workplace absenteeism among full-time workers in the United States are available from NIOSH.

          U.S. State and local influenza surveillance: Select a jurisdiction below to access the latest local influenza information.
          https://www.cdc.gov/flu/weekly/index.htm
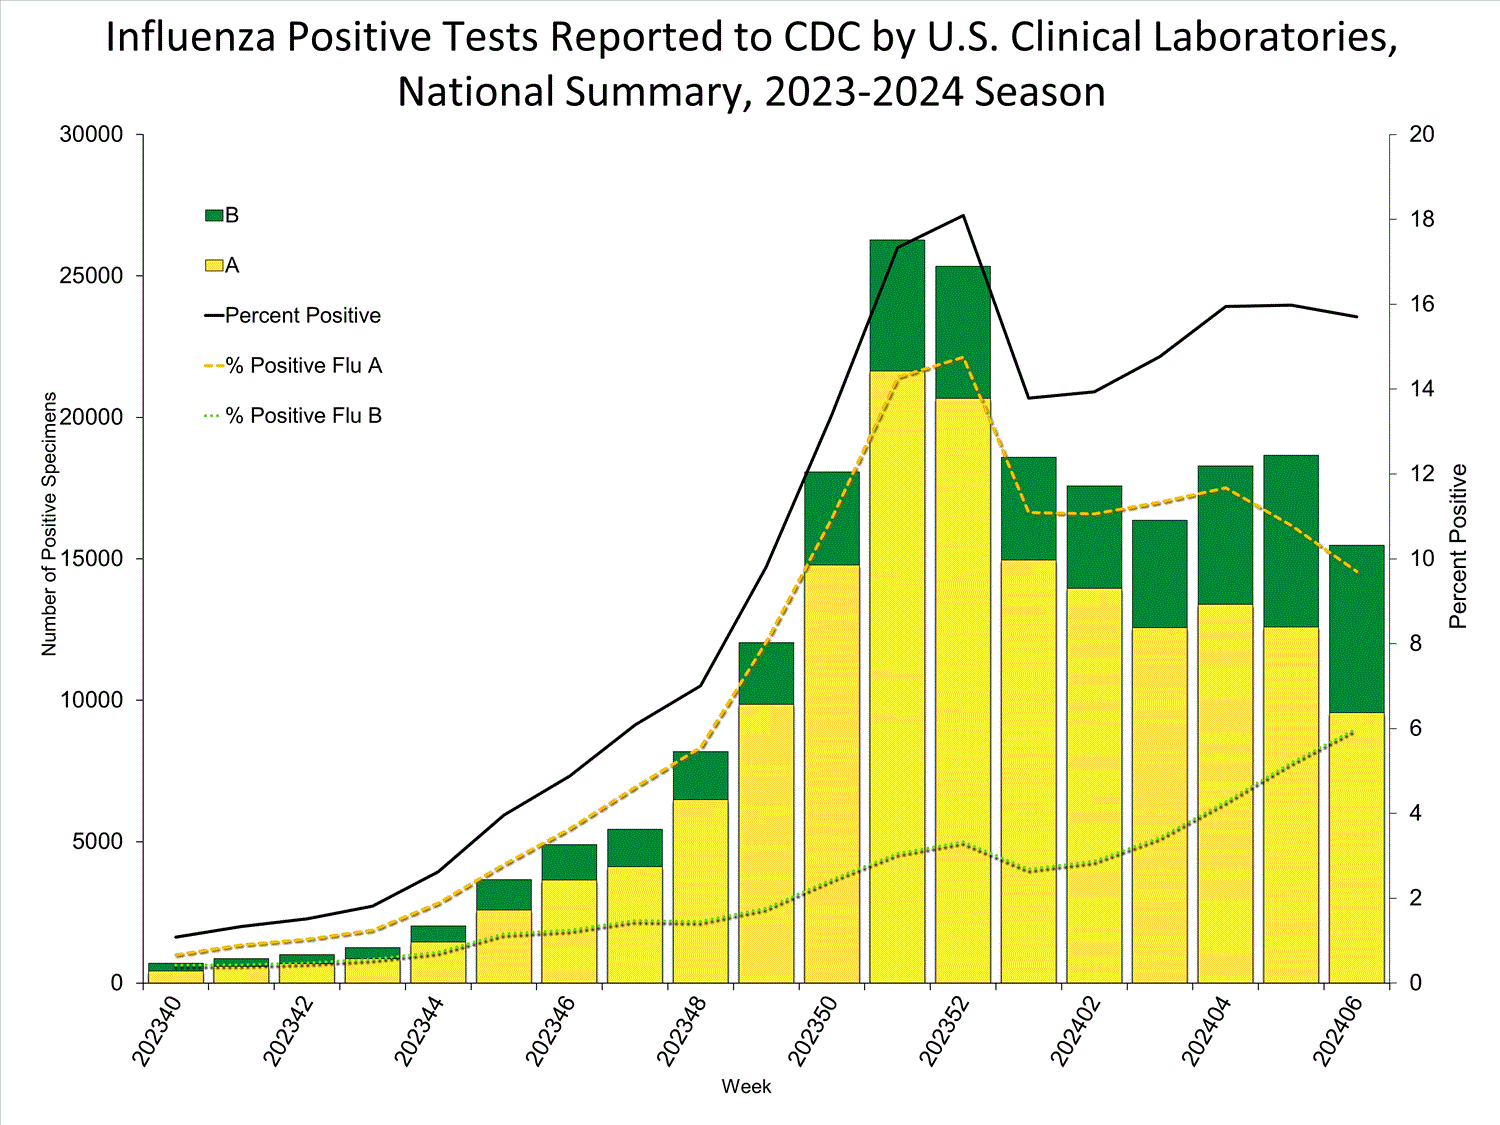
          Comment


          • #20
            Weekly U.S. Influenza Surveillance Report


            Print
            Updated March 8, 2024

            Key Updates for Week 9, ending March 2, 2024

            Seasonal influenza activity remains elevated nationally with increases in some parts of the country. Viruses


            Clinical Lab 13.9%

            (Trend )


            positive for influenza
            this week


            Public Health Lab
            The most frequently reported influenza viruses this week were influenza A(H1N1)pdm09.

            Virus Characterization
            Genetic and antigenic characterization and antiviral susceptibility are summarized in this report. Illness


            Outpatient Respiratory Illness 4.1%

            (Trend )


            of visits to a health care provider this week were for respiratory illness
            (above baseline).


            Outpatient Respiratory Illness: Activity Map
            This week 18 jurisdictions experienced moderate activity and 20 jurisdictions experienced high or very high activity.

            FluSurv-NET 64.8 per 100,000


            cumulative hospitalization rate.

            NHSN Hospitalizations 10,060 (Trend )


            patients admitted to hospitals with influenza this week.

            NCHS Mortality 0.7%

            (Trend )


            of deaths attributed to influenza this week.

            Pediatric Deaths 10


            influenza-associated deaths were reported
            this week for a total of 103 deaths this season.


            All data are preliminary and may change as more reports are received.

            Directional arrows indicate changes between the current week and the previous week. Additional information on the arrows can be found at the bottom of this page.

            A description of the CDC influenza surveillance system, including methodology and detailed descriptions of each data component is available on the surveillance methods page.

            Additional information on the current and previous influenza seasons for each surveillance component are available on FluView Interactive.

            Key Points
            • Seasonal influenza activity remains elevated nationally with increases in some parts of the country.
            • Nationally, percent positivity for influenza remained stable compared to last week. Trends in percent positivity for influenza A and B varied by region.
            • Nationally, outpatient respiratory illness declined slightly but remains above baseline.1 Regions 8 and 10 are below their respective baselines during Week 9 for the first time since early and mid-November, respectively, while the remaining HHS regions remain above their respective baselines.
            • The number of weekly flu hospital admissions remained stable compared to last week. After five weeks of sharp decline between late December and early February, the number of weekly flu hospital admissions has been trending downward slightly since mid-February.
            • During Week 9, of the 615 viruses reported by public health laboratories, 437 (71.1%) were influenza A and 178 (28.9%) were influenza B. Of the 286 influenza A viruses subtyped during Week 9, 164 (57.3%) were influenza A(H1N1) and 122 (42.7%) were A(H3N2).
            • Ten influenza-associated pediatric deaths were reported during Week 9, bringing the 2023-2024 season total to 103 pediatric deaths.
            • CDC estimates that there have been at least 28 million illnesses, 310,000 hospitalizations, and 20,000 deaths from flu so far this season.
            • CDC recommends that everyone 6 months and older get an annual flu vaccine as long as influenza viruses are spreading.2 Vaccination can still provide benefit this season.
            • There also are prescription flu antiviral drugs that can treat flu illness; those should be started as early as possible and are especially important for higher risk patients.3
            • Flu viruses are among several viruses contributing to respiratory disease activity. CDC is providing updated, integrated information about COVID-19, flu, and RSV activity on a weekly basis.
            U.S. Virologic Surveillance


            Nationally, the percentage of respiratory specimens testing positive for influenza in clinical laboratories remained stable (change of <0.5 percentage points) compared to the previous week, but trends varied by region. Region 5 reported an increase; regions 1, 2, 4, 6, and 8 reported a decrease; and regions 3, 7, 9, and 10 remained stable during Week 9 compared to Week 8. The regions with the highest percent positivity were regions 7 (27.9%), 5 (19.8%), and 3 (17.4%). Since Week 40, influenza A(H1N1)pdm09 has been the predominant virus circulating in all regions. However, the distribution of circulating viruses varies by region. For regional and state level data and age group distribution, please visit FluView Interactive. Viruses known to be associated with recent receipt of live attenuated influenza vaccine (LAIV) or found upon further testing to be a vaccine virus are not included, as they are not circulating influenza viruses. Clinical Laboratories


            The results of tests performed by clinical laboratories nationwide are summarized below. Data from clinical laboratories (the percentage of specimens tested that are positive for influenza virus) are used to monitor whether influenza activity is increasing or decreasing.
            No. of specimens tested 81,237 2,346,992
            No. of positive specimens (%) 11,294 (13.9%) 265,084 (11.3%)
            Positive specimens by type
            Influenza A 6,428 (56.9%) 194,842 (73.5%)
            Influenza B 4,866 (43.1%) 70,232 (26.5%)
            6

            INFLUENZA Virus Isolated
            View Chart Data | View Full Screen Public Health Laboratories


            The results of tests performed by public health laboratories nationwide are summarized below. Data from public health laboratories are used to monitor the proportion of circulating influenza viruses that belong to each influenza subtype/lineage.
            No. of specimens tested 2,541 83,981
            No. of positive specimens 615 27,069
            Positive specimens by type/subtype
            Influenza A 437 (71.1%) 21,684 (80.1%)
            Subtyping Performed 286 (65.4%) 17,762 (81.9%)
            (H1N1)pdm09 164 (57.3%) 13,221 (74.4%)
            H3N2 122 (42.7%) 4,541 (25.6%)
            H3N2v 0 (0.0%) 0 (0.0%)
            Subtyping not performed 151 (34.6%) 3,922 (18.1%)
            Influenza B 178 (28.9%) 5,385 (19.9%)
            Lineage testing performed 138 (77.5%) 4,441 (82.5%)
            Yamagata lineage 0 (0.0%) 0 (0.0%)
            Victoria lineage 138 (100%) 4,441 (100%)
            Lineage not performed 40 (22.5%) 944 (17.5%)
            INFLUENZA Virus Isolated
            View Chart Data | View Full Screen

            Additional virologic surveillance information for current and past seasons:
            Surveillance Methods | FluView Interactive: National, Regional, and State Data or Age Data Influenza Virus Characterization


            CDC performs genetic and antigenic characterization of U.S. viruses submitted from state and local public health laboratories according to the Right Size Roadmap submission guidance. These data are used to compare how similar the currently circulating influenza viruses are to the reference viruses representing viruses contained in the current influenza vaccines. The data are also used to monitor evolutionary changes that continually occur in influenza viruses circulating in humans. CDC also tests susceptibility of circulating influenza viruses to antiviral medications including the neuraminidase inhibitors (oseltamivir, zanamivir, and peramivir) and the PA endonuclease inhibitor baloxavir.

            CDC has genetically characterized 2,227 influenza viruses collected since October 1, 2023.
            A/H1 998
            6B.1A.5a 998 (100%) 2a 254 (25.5%)
            2a.1 744 (74.5%)
            A/H3 639
            3C.2a1b.2a 639 (100%) 2a.1b 1 (0.2%)
            2a.3a 1 (0.2%)
            2a.3a.1 636 (99.5%)
            2b 1 (0.2%)
            B/Victoria 590
            V1A 590 (100%) 3a.2 590 (100%)
            B/Yamagata 0
            Y3 0 Y3 0 (0%)
            CDC antigenically characterizes influenza viruses by hemagglutination inhibition (HI) (H1N1pdm09, H3N2, B/Victoria, and B/Yamagata viruses) or neutralization-based HINT (H3N2 viruses) using antisera that ferrets make after being infected with reference viruses representing the 2023-2024 Northern Hemisphere recommended cell or recombinant-based vaccine viruses. Antigenic differences between viruses are determined by comparing how well the antibodies made against the vaccine reference viruses recognize the circulating viruses that have been grown in cell culture. Ferret antisera are useful because antibodies raised against a particular virus can often recognize small changes in the surface proteins of other viruses. In HI assays, viruses with similar antigenic properties have antibody titer differences of less than or equal to 4-fold when compared to the reference (vaccine) virus. In HINT, viruses with similar antigenic properties have antibody neutralization titer differences of less than or equal to 8-fold. Viruses selected for antigenic characterization are a subset representing the genetic changes in the surface proteins seen in genetically characterized viruses.

            Influenza A Viruses
            • A (H1N1)pdm09: 172 A(H1N1)pdm09 viruses were antigenically characterized by HI, and all were well-recognized (reacting at titers that were within 4-fold of the homologous virus titer) by ferret antisera to cell-grown A/Wisconsin/67/2022-like reference viruses representing the A(H1N1)pdm09 component for the cell- and recombinant-based influenza vaccines.
            • A (H3N2): 161 A(H3N2) viruses were antigenically characterized by HI or HINT, and 159 (99%) were well-recognized (reacting at titers that were within 4-fold of the homologous virus titer in HI or reacting at titers that were less than or equal to 8-fold of the homologous virus in HINT) by ferret antisera to cell-grown A/Darwin/6/2021-like reference viruses representing the A(H3N2) component for the cell- and recombinant-based influenza vaccines.

            Influenza B Viruses
            • B/Victoria: One hundred influenza B/Victoria-lineage virus were antigenically characterized by HI, and all were well-recognized (reacting at titers that were within 4-fold of the homologous virus titer) by ferret antisera to cell-grown B/Austria/1359417/2021-like reference viruses representing the B/Victoria component for the cell- and recombinant-based influenza vaccines.
            • B/Yamagata: No influenza B/Yamagata-lineage viruses were available for antigenic characterization.


            2024-2025 Influenza Season – U.S. Influenza Vaccine Composition:

            The World Health Organization (WHO) has recommended the Northern Hemisphere 2024-2025 influenza vaccine composition, and the Food and Drug Administration’s Vaccines and Related Biological Products Advisory Committee (VRBPAC) subsequently made the influenza vaccine composition recommendation for the United States. Both agencies recommend that influenza vaccines contain the following:

            Egg-based vaccines
              • an A/Victoria/4897/2022 (H1N1)pdm09-like virus;
              • an A/Thailand/8/2022 (H3N2)-like virus; and
              • a B/Austria/1359417/2021 (B/Victoria lineage)-like virus.

            Cell- or recombinant-based vaccines
              • an A/Wisconsin/67/2022 (H1N1)pdm09-like virus;
              • an A/Massachusetts/18/2022 (H3N2)-like virus; and
              • a B/Austria/1359417/2021 (B/Victoria lineage)-like virus.

            The Committee recommended that all 2024-2025 U.S. flu vaccines be three-component (trivalent) vaccines and include an influenza A(H1N1), an A(H3N2) and a B/Victoria-lineage vaccine virus. Because influenza B/Yamagata viruses, which are included in current four-component (quadrivalent) influenza vaccines, are no longer actively circulating, their inclusion in flu vaccines is no longer warranted. Further information on vaccine composition for the 2024-2025 influenza season can be found on the CDC Spotlight.


            Assessment of Virus Susceptibility to Antiviral Medications

            CDC assesses susceptibility of influenza viruses to the antiviral medications including the neuraminidase inhibitors (oseltamivir, zanamivir, and peramivir) and the PA endonuclease inhibitor baloxavir using next generation sequence analysis supplemented by laboratory assays. Information about antiviral susceptibility test methods can be found at U.S. Influenza Surveillance: Purpose and Methods | CDC.

            Viruses collected in the U.S. since October 01, 2023, were tested for antiviral susceptibility as follows:
            Neuraminidase Inhibitors Oseltamivir Viruses Tested 2,230 998 640 592
            Reduced Inhibition 1 (0.4%) 1 (0.1%) 0 (0.0%) 0 (0.0%)
            Highly Reduced Inhibition 1 (0.4%) 1 (0.1%) 0 (0.0%) 0 (0.0%)
            Peramivir Viruses Tested 2,230 998 640 592
            Reduced Inhibition 0 (0.0%) 0 (0.0%) 0 (0.0%) 0 (0.0%)
            Highly Reduced Inhibition 1 (0.4%) 1 (0.1%) 0 (0.0%) 0 (0.0%)
            Zanamivir Viruses Tested 2,230 998 640 592
            Reduced Inhibition 0 (0.0%) 0 (0.0%) 0 (0.0%) 0 (0.0%)
            Highly Reduced Inhibition 0 (0.0%) 0 (0.0%) 0 (0.0%) 0 (0.0%)
            PA Cap-Dependent Endonuclease Inhibitor Baloxavir Viruses Tested 2,167 974 623 570
            Decreased Susceptibility 1 (0.5%) 0 (0.0%) 1 (0.2%) 0 (0.0%)
            One A(H1N1)pdm09 virus had NA-H275Y amino acid substitution and showed highly reduced inhibition by oseltamivir and peramivir. One (H1N1)pdm09 virus had NA-I223V and NA-S247N amino acid substitutions and showed reduced inhibition by oseltamivir.

            One A(H3N2) virus had PA-I38T amino acid substitution and showed reduced susceptibility to baloxavir.

            High levels of resistance to the adamantanes (amantadine and rimantadine) persist among influenza A(H1N1)pdm09 and influenza A(H3N2) viruses (the adamantanes are not effective against influenza B viruses). Therefore, use of these antivirals for treatment and prevention of influenza A virus infection is not recommended and data from adamantane resistance testing are not presented. Outpatient Respiratory Illness Surveillance


            The U.S. Outpatient Influenza-like Illness Surveillance Network (ILINet) monitors outpatient visits for respiratory illness referred to as influenza-like illness [ILI (fever plus cough or sore throat)], not laboratory-confirmed influenza and will therefore capture respiratory illness visits due to infection with pathogens that can present with similar symptoms, including influenza viruses, SARS-CoV-2, and RSV. It is important to evaluate syndromic surveillance data, including that from ILINet, in the context of other sources of surveillance data to obtain a more complete and accurate picture of influenza, SARS-CoV-2, and other respiratory virus activity. CDC is providing integrated information about COVID-19, influenza, and RSV activity on a website that is updated weekly. Information about other respiratory virus activity can be found on CDC’s National Respiratory and Enteric Virus Surveillance System (NREVSS) website. Outpatient Respiratory Illness Visits


            Nationwide, during Week 9, 4.1% of patient visits reported through ILINet were due to respiratory illness that included fever plus a cough or sore throat, also referred to as ILI. This has decreased (change of > 0.1 percentage points) compared to Week 8. The percentage of visits for ILI remained stable in regions 2, 3, 5, and 7, and decreased in regions 1, 4, 6, 8, 9, and 10 in Week 9 compared to Week 8. Regions 8 and 10 are below their region-specific baselines in Week 9 for the first time since early and mid-November respectively, while all other regions remain above their region-specific baselines. Multiple respiratory viruses are co-circulating, and the relative contribution of influenza virus infection to ILI varies by location.

            Outpatient Respiratory Illness Visits by Age Group


            About 70% of ILINet participants provide both the number of patient visits for respiratory illness and the total number of patient visits for the week broken out by age group. Data from this subset of providers are used to calculate the percentages of patient visits for respiratory illness by age group.

            The percentage of visits for respiratory illness reported in ILINet decreased in the 0-4 years, 5-24 years, and 25-49 years age groups and remained stable in the 50-64 years and 65+ years age groups during Week 9 compared to Week 8.

            Outpatient Respiratory Illness Activity Map


            Data collected in ILINet are used to produce a measure of ILI activity* by state/jurisdiction and Core Based Statistical Areas (CBSA).
            Week 9
            (Week ending
            Mar. 2, 2024)
            Week 8
            (Week ending
            Feb. 24, 2024)
            Week 9
            (Week ending
            Mar. 2, 2024)
            Week 8
            (Week ending
            Feb. 24, 2024)
            Very High 5 5 16 16
            High 15 21 92 109
            Moderate 18 13 99 120
            Low 9 7 201 209
            Minimal 8 8 296 251
            Insufficient Data 0 1 225 224


            *Data collected in ILINet may disproportionally represent certain populations within a jurisdiction or CBSA, and therefore, may not accurately depict the full picture of influenza activity for the entire jurisdiction or CBSA. Differences in the data presented here by CDC and independently by some health departments likely represent differing levels of data completeness with data presented by the health department likely being the more complete.

            Additional information about medically attended visits for ILI for current and past seasons:
            Surveillance Methods | FluView Interactive: National, Regional, and State Data or ILI Activity Map Hospitalization Surveillance

            FluSurv-NET


            The Influenza Hospitalization Surveillance Network (FluSurv-NET) conducts population-based surveillance for laboratory-confirmed influenza-related hospitalizations in select counties in 14 states and represents approximately 9% of the U.S. population. FluSurv-NET hospitalization data are preliminary. As data are received each week, prior case counts and rates are updated accordingly.

            A total of 19,819 laboratory-confirmed influenza-associated hospitalizations were reported by FluSurv-NET sites between October 1, 2023, and March 2, 2024. The weekly hospitalization rate observed in Week 9 was 2.6 per 100,000 population. The weekly hospitalization rate observed during Week 52 is the third highest peak weekly rate observed during all seasons going back to 2010-2011, following the 2014-2015 and 2017-2018 seasons. The overall cumulative hospitalization rate was 64.8 per 100,000 population. This cumulative hospitalization rate is the second highest cumulative hospitalization rate when compared against previous end-of-season rates for Week 9, and it is the second highest cumulative in-season hospitalization rate observed in Week 9, following the 2017-2018 season (86.3). Cumulative in-season hospitalization rates observed in Week 9 from 2010-2011 through 2022-2023 ranged from 0.7 to 60.0.

            When examining rates by age, the highest cumulative hospitalization rate per 100,000 population was among adults aged 65 years and older (175.8), followed by adults aged 50-64 years (78.5) and children aged 0-4 years (67.6). When examining age-adjusted rates by race and ethnicity, the highest rate of hospitalization per 100,000 population was among non-Hispanic Black persons (124.1), followed by non-Hispanic American Indian or Alaska Native persons (90.1), Hispanic persons (61.2), non-Hispanic White persons (49.3), and non-Hispanic Asian/Pacific Islander persons (34.9).

            Among 19,819 hospitalizations, 17,163 (86.6%) were associated with influenza A virus, 2,504 (12.6%) with influenza B virus, 39 (0.2%) with influenza A virus and influenza B virus co-infection, and 112 (0.6%) with influenza virus for which the type was not determined. Among those with influenza A subtype information, 2,901 (73.1%) were A(H1N1) pdm09 and 1,066 (26.9%) were A(H3N2).

            Among 2,168 hospitalized adults with information on underlying medical conditions, 95.6% had at least one reported underlying medical condition, the most commonly reported were hypertension, cardiovascular disease, obesity, and metabolic disease. Among 1,140 hospitalized women of childbearing age (15-49 years) with information on pregnancy status, 23.3% were pregnant. Among 633 hospitalized children with information on underlying medical conditions, 69.3% had at least one reported underlying medical condition; the most commonly reported was asthma, followed by obesity and neurologic disease.

            FluSurvNet Cumulative Rates

            View Full Screen

            In this figure, cumulative rates for all seasons prior to the 2023-2024 season reflect end-of-season rates. For the 2023-2024 season, rates for recent hospitals admissions are subject to reporting delays. As hospitalization data are reviewed each week, prior case counts and rates are updated accordingly.

            FluSurvNet Weekly Rate

            View Full Screen

            In this figure, weekly rates for all seasons prior to the 2023-24 season reflect end-of-season rates. For the 2023-24 season, rates for recent hospital admissions are subject to reporting delays and are shown as a dashed line for the current season. As hospitalization data are received each week, prior case counts and rates are updated accordingly.

            Additional FluSurv-NET hospitalization surveillance information for current and past seasons and additional age groups:
            Surveillance Methods |FluView Interactive: Rates by Age, Sex, and Race/Ethnicity or Data on Patient Characteristics | RESP-NET Interactive National Healthcare Safety Network (NHSN) Hospitalization Surveillance


            Hospitals report to NHSN the weekly number of patients admitted with laboratory-confirmed influenza. During Week 9, 10,060 patients with laboratory-confirmed influenza were admitted to a hospital. Nationally, the number of patients admitted to a hospital with laboratory-confirmed influenza for Week 9 remained stable (change of <5%) compared to Week 8, and after five weeks of sharp decline between late December and early February, the number of weekly flu hospital admissions has been trending downward slightly since mid-February. The number of hospitalizations increased in regions 1 and 3, remained stable in regions 4, 5, and 7, and decreased in regions 2, 6, 8, 9, and 10 this week compared to Week 8.


            Additional NHSN Hospitalization Surveillance information:
            Surveillance Methods | Additional Data | FluView Interactive Mortality Surveillance

            National Center for Health Statistics (NCHS) Mortality Surveillance


            Based on NCHS mortality surveillance data available on March 7, 2024, 0.7% of the deaths that occurred during the week ending March 2, 2024 (Week 9), were due to influenza. This percentage remained stable (< 0.1 percentage point change) compared to Week 8. The data presented are preliminary and may change as more data are received and processed.


            Additional pneumonia, influenza and COVID-19 mortality surveillance information for current and past seasons:
            Surveillance Methods | FluView Interactive Influenza-Associated Pediatric Mortality


            Ten influenza-associated pediatric deaths occurring during the 2023-2024 season were reported to CDC during Week 9. The deaths occurred during Week 51 of 2023 (the week ending December 23, 2023) and between weeks 3 and 9 of 2024 (the weeks ending January 20, 2024, and March 2, 2024). Six deaths were associated with influenza A viruses. Two of the influenza A viruses had subtyping performed; they were A(H1N1) and A(H3) viruses. Four deaths were associated with influenza B viruses, one of which was determined be a B/Victoria lineage-virus.

            A total of 103 influenza-associated pediatric deaths occurring during the 2023-2024 season have been reported to CDC.


            Additional pediatric mortality surveillance information for current and past seasons:
            Surveillance Methods | FluView Interactive Trend Indicators


            Increasing:
            Decreasing:
            Stable: Indicators Status by System


            Clinical Labs: Up or down arrows indicate a change of greater than or equal to 0.5 percentage points in the percent of specimens positive for influenza compared to the previous week.
            Outpatient Respiratory Illness (ILINet): Up or down arrows indicate a change of greater than 0.1 percentage points in the percent of visits due to respiratory illness (ILI) compared to the previous week.
            NHSN Hospitalizations: Up or down arrows indicate change of greater than or equal to 5% of the number of patients admitted with laboratory-confirmed influenza compared to the previous week.
            NCHS Mortality: Up or down arrows indicate change of greater than 0.1 percentage points of the percent of deaths due to influenza compared to the previous week. Reference Footnotes


            1U.S. Influenza Surveillance: Purpose and Methods (2023 Oct). Centers for Disease Control and Prevention. https://www.cdc.gov/flu/weekly/overview.htm#ILINet.

            2Grohskopf LA, Blanton LH, Ferdinands JM, Chung JR, Broder KR, Talbot HK. Prevention and Control of Seasonal Influenza with Vaccines: Recommendations of the Advisory Committee on Immunization Practices — United States, 2023–24 Influenza Season. MMWR Recomm Rep 2023;72(No. RR-2):1–25. DOI: http://dx.doi.org/10.15585/mmwr.rr7202a1

            3Influenza Antiviral Medications: Summary for Clinicians (2023 Sept). Centers for Disease Control and Prevention. https://www.cdc.gov/flu/professional...clinicians.htm.
            https://www.cdc.gov/flu/weekly/index.htm
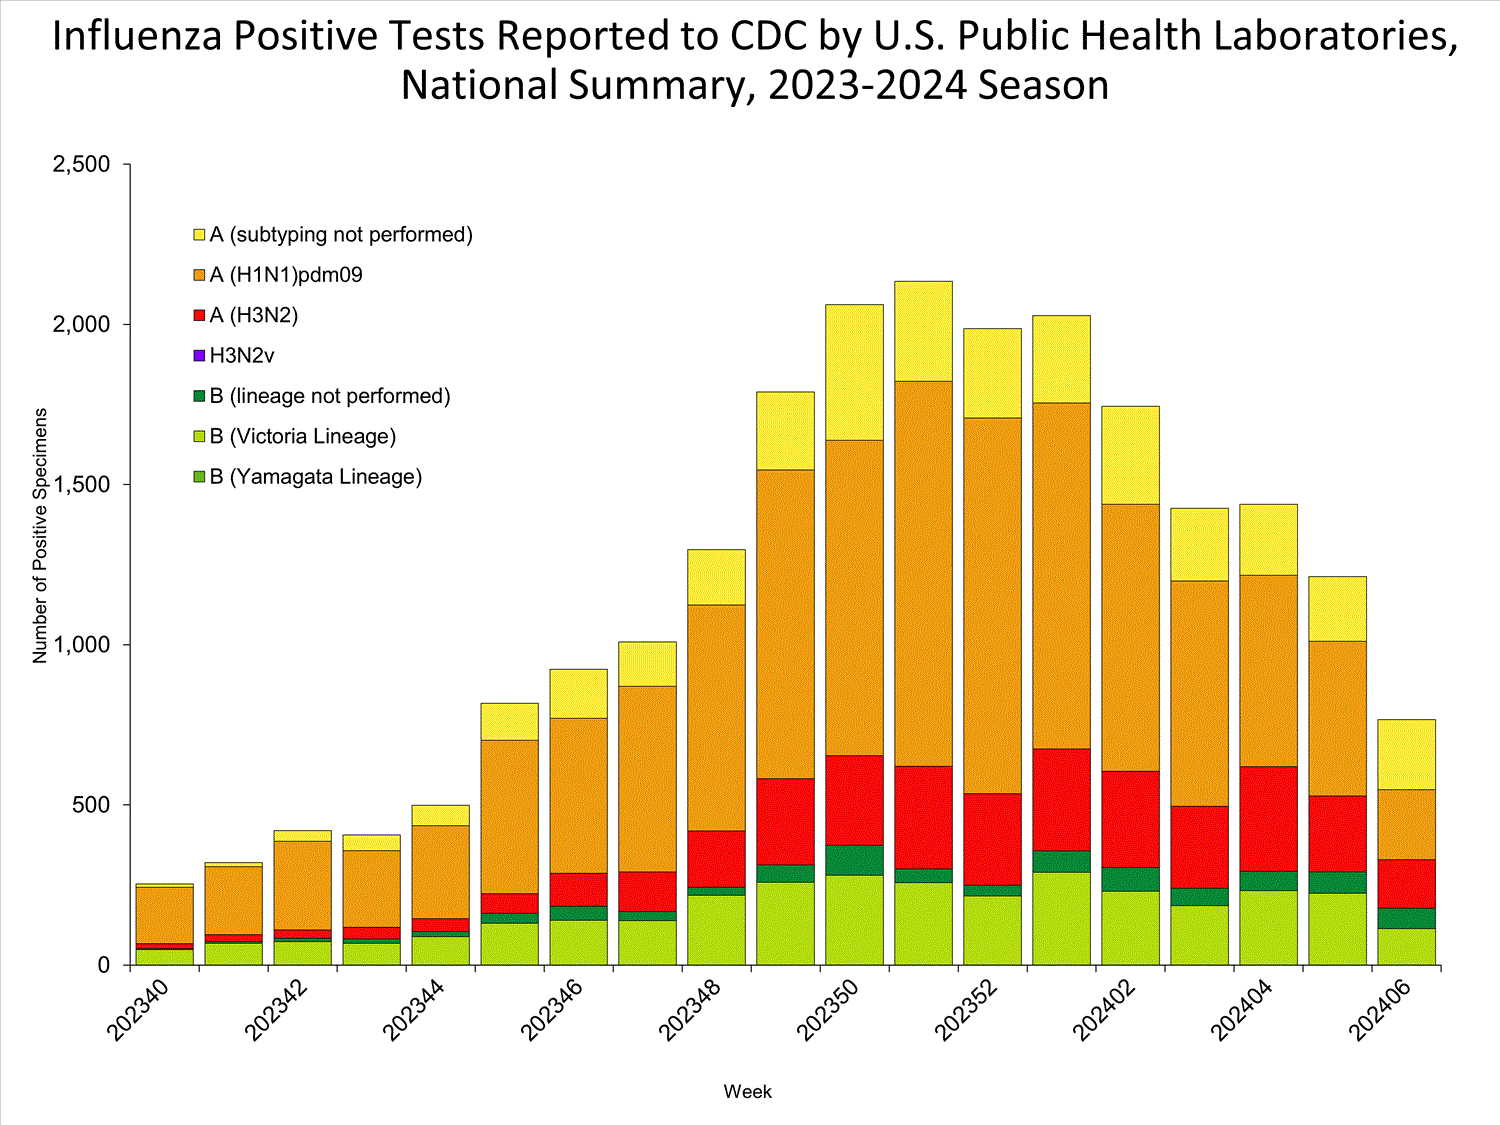
            Comment


            • #21
              Weekly U.S. Influenza Surveillance Report


              Print
              Updated March 15, 2024

              Key Updates for Week 10, ending March 9, 2024

              Seasonal influenza activity remains elevated nationally with increases in some parts of the country. Viruses


              Clinical Lab 15.4%

              (Trend )


              positive for influenza
              this week


              Public Health Lab
              Influenza A(H1N1)pdm09, A(H3N2) and B viruses were reported in approximately equal proportions this week.

              Virus Characterization
              Genetic and antigenic characterization and antiviral susceptibility are summarized in this report. Illness


              Outpatient Respiratory Illness 3.7%

              (Trend )


              of visits to a health care provider this week were for respiratory illness
              (above baseline).


              Outpatient Respiratory Illness: Activity Map
              This week 13 jurisdictions experienced moderate activity and 16 jurisdictions experienced high or very high activity.

              FluSurv-NET 67.9 per 100,000


              cumulative hospitalization rate.

              NHSN Hospitalizations 8,819 (Trend )


              patients admitted to hospitals with influenza this week.

              NCHS Mortality 0.7%

              (Trend )


              of deaths attributed to influenza this week.

              Pediatric Deaths 15


              influenza-associated deaths were reported (2 occurred during 2022-2023 season and 13 occurred during 2023-2024 season).

              All data are preliminary and may change as more reports are received.

              Directional arrows indicate changes between the current week and the previous week. Additional information on the arrows can be found at the bottom of this page.

              A description of the CDC influenza surveillance system, including methodology and detailed descriptions of each data component is available on the surveillance methods page.

              Additional information on the current and previous influenza seasons for each surveillance component are available on FluView Interactive.

              Key Points
              • Seasonal influenza activity remains elevated nationally with increases in some parts of the country.
              • Nationally, percent positivity for both influenza A and B increased compared to last week; however, trends in percent positivity for influenza A and B varied by region.
              • Nationally, outpatient respiratory illness declined but remains above baseline.1 Region 9 is at their baseline during Week 10 for the first time since late October, while the remaining HHS regions remain above their respective baselines.
              • Nationally, the number of weekly flu hospital admissions has been decreasing since January.
              • During Week 10, of the 575 viruses reported by public health laboratories, 384 (66.8%) were influenza A and 191 (33.2%) were influenza B. Of the 258 influenza A viruses subtyped during Week 10, 141 (54.7%) were influenza A(H1N1)pdm09 and 117 (45.3%) were A(H3N2).
              • Thirteen influenza-associated pediatric deaths occurring during the 2023-2024 season were reported to CDC during Week 10, bringing the season total to 116 pediatric deaths.
              • CDC estimates that there have been at least 29 million illnesses, 320,000 hospitalizations, and 20,000 deaths from flu so far this season.
              • CDC recommends that everyone 6 months and older get an annual flu vaccine as long as influenza viruses are spreading.2 Vaccination can still provide benefit this season.
              • There also are prescription flu antiviral drugs that can treat flu illness; those should be started as early as possible and are especially important for higher risk patients.3
              • Flu viruses are among several viruses contributing to respiratory disease activity. CDC is providing updated, integrated information about COVID-19, flu, and RSV activity on a weekly basis.
              U.S. Virologic Surveillance


              Nationally, the percentage of respiratory specimens testing positive for influenza in clinical laboratories increased (change of >0.5 percentage points) compared to the previous week, but trends varied by region. Regions 5 and 10 reported an increase; regions 2, 4, 6, 8, and 9 reported a decrease; and regions 1, 3, and 7 remained stable during Week 10 compared to Week 9. The regions with the highest percent positivity were regions 7 (28.1%), 5 (22.3%), and 3 (17.0%). Nationally, influenza A(H1N1)pdm09, A(H3N2), and B/Victoria viruses circulated at approximately equal proportions during Week 10. However, the distribution of circulating viruses varies by region. For regional and state level data and age group distribution, please visit FluView Interactive. Viruses known to be associated with recent receipt of live attenuated influenza vaccine (LAIV) or found upon further testing to be a vaccine virus are not included, as they are not circulating influenza viruses. Clinical Laboratories


              The results of tests performed by clinical laboratories nationwide are summarized below. Data from clinical laboratories (the percentage of specimens tested that are positive for influenza virus) are used to monitor whether influenza activity is increasing or decreasing.
              No. of specimens tested 65,809 2,419,084
              No. of positive specimens (%) 10,161 (15.4%) 279,439 (11.6%)
              Positive specimens by type
              Influenza A 5,532 (54.4%) 203,348 (72.8%)
              Influenza B 4,629 (45.6%) 76,081 (27.2%)
              6

              INFLUENZA Virus Isolated
              View Chart Data | View Full Screen Public Health Laboratories


              The results of tests performed by public health laboratories nationwide are summarized below. Data from public health laboratories are used to monitor the proportion of circulating influenza viruses that belong to each influenza subtype/lineage.
              No. of specimens tested 2,307 87,432
              No. of positive specimens 575 28,235
              Positive specimens by type/subtype
              Influenza A 384 (66.8%) 22,468 (79.6%)
              Subtyping Performed 258 (67.2%) 18,378 (81.8%)
              (H1N1)pdm09 141 (54.7%) 13,557 (73.8%)
              H3N2 117 (45.3%) 4,821 (26.2%)
              H3N2v 0 (0.0%) 0 (0.0%)
              Subtyping not performed 126 (32.8%) 4,090 (18.2%)
              Influenza B 191 (33.2%) 5,767 (20.4%)
              Lineage testing performed 147 (77.0%) 4,874 (84.5%)
              Yamagata lineage 0 (0.0%) 0 (0.0%)
              Victoria lineage 147 (100.0%) 4,874 (100.0%)
              Lineage not performed 44 (23.0%) 893 (15.5%)
              INFLUENZA Virus Isolated
              View Chart Data | View Full Screen

              Additional virologic surveillance information for current and past seasons:
              Surveillance Methods | FluView Interactive: National, Regional, and State Data or Age Data Influenza Virus Characterization


              CDC performs genetic and antigenic characterization of U.S. viruses submitted from state and local public health laboratories according to the Right Size Roadmap submission guidance. These data are used to compare how similar the currently circulating influenza viruses are to the reference viruses representing viruses contained in the current influenza vaccines. The data are also used to monitor evolutionary changes that continually occur in influenza viruses circulating in humans. CDC also tests susceptibility of circulating influenza viruses to antiviral medications including the neuraminidase inhibitors (oseltamivir, zanamivir, and peramivir) and the PA endonuclease inhibitor baloxavir.

              CDC has genetically characterized 2,640 influenza viruses collected since October 1, 2023.
              A/H1 1,148
              6B.1A.5a 1,148 (100%) 2a 285 (24.8%)
              2a.1 863 (75.2%)
              A/H3 777
              3C.2a1b.2a 777 (100%) 2a.1b 1 (0.1%)
              2a.3a 1 (0.1%)
              2a.3a.1 774 (99.6%)
              2b 1 (0.1%)
              B/Victoria 715
              V1A 715 (100%) 3a.2 715 (100%)
              B/Yamagata 0
              Y3 0 Y3 0 (0%)
              CDC antigenically characterizes influenza viruses by hemagglutination inhibition (HI) (H1N1pdm09, H3N2, B/Victoria, and B/Yamagata viruses) or neutralization-based HINT (H3N2 viruses) using antisera that ferrets make after being infected with reference viruses representing the 2023-2024 Northern Hemisphere recommended cell or recombinant-based vaccine viruses. Antigenic differences between viruses are determined by comparing how well the antibodies made against the vaccine reference viruses recognize the circulating viruses that have been grown in cell culture. Ferret antisera are useful because antibodies raised against a particular virus can often recognize small changes in the surface proteins of other viruses. In HI assays, viruses with similar antigenic properties have antibody titer differences of less than or equal to 4-fold when compared to the reference (vaccine) virus. In HINT, viruses with similar antigenic properties have antibody neutralization titer differences of less than or equal to 8-fold. Viruses selected for antigenic characterization are a subset representing the genetic changes in the surface proteins seen in genetically characterized viruses.

              Influenza A Viruses
              • A (H1N1)pdm09: 172 A(H1N1)pdm09 viruses were antigenically characterized by HI, and all were well-recognized (reacting at titers that were within 4-fold of the homologous virus titer) by ferret antisera to cell-grown A/Wisconsin/67/2022-like reference viruses representing the A(H1N1)pdm09 component for the cell- and recombinant-based influenza vaccines.
              • A (H3N2): 192 A(H3N2) viruses were antigenically characterized by HI or HINT, and 190 (99.0%) were well-recognized (reacting at titers that were within 4-fold of the homologous virus titer in HI or reacting at titers that were less than or equal to 8-fold of the homologous virus in HINT) by ferret antisera to cell-grown A/Darwin/6/2021-like reference viruses representing the A(H3N2) component for the cell- and recombinant-based influenza vaccines.

              Influenza B Viruses
              • B/Victoria: 106 influenza B/Victoria-lineage virus were antigenically characterized by HI, and all were well-recognized (reacting at titers that were within 4-fold of the homologous virus titer) by ferret antisera to cell-grown B/Austria/1359417/2021-like reference viruses representing the B/Victoria component for the cell- and recombinant-based influenza vaccines.
              • B/Yamagata: No influenza B/Yamagata-lineage viruses were available for antigenic characterization.

              Assessment of Virus Susceptibility to Antiviral Medications

              CDC assesses susceptibility of influenza viruses to the antiviral medications including the neuraminidase inhibitors (oseltamivir, zanamivir, and peramivir) and the PA endonuclease inhibitor baloxavir using next generation sequence analysis supplemented by laboratory assays. Information about antiviral susceptibility test methods can be found at U.S. Influenza Surveillance: Purpose and Methods | CDC.

              Viruses collected in the U.S. since October 01, 2023, were tested for antiviral susceptibility as follows:
              Neuraminidase Inhibitors Oseltamivir Viruses Tested 2,594 1,128 778 688
              Reduced Inhibition 1 (0.4%) 1 (0.1%) 0 (0.0%) 0 (0.0%)
              Highly Reduced Inhibition 1 (0.4%) 1 (0.1%) 0 (0.0%) 0 (0.0%)
              Peramivir Viruses Tested 2,594 1,128 778 688
              Reduced Inhibition 0 (0.0%) 0 (0.0%) 0 (0.0%) 0 (0.0%)
              Highly Reduced Inhibition 1 (0.4%) 1 (0.1%) 0 (0.0%) 0 (0.0%)
              Zanamivir Viruses Tested 2,594 1,128 778 688
              Reduced Inhibition 0 (0.0%) 0 (0.0%) 0 (0.0%) 0 (0.0%)
              Highly Reduced Inhibition 0 (0.0%) 0 (0.0%) 0 (0.0%) 0 (0.0%)
              PA Cap-Dependent Endonuclease Inhibitor Baloxavir Viruses Tested 2,518 1,098 759 661
              Decreased Susceptibility 1 (0.4%) 0 (0.0%) 1 (0.1%) 0 (0.0%)
              One A(H1N1)pdm09 virus had NA-H275Y amino acid substitution and showed highly reduced inhibition by oseltamivir and peramivir. One (H1N1)pdm09 virus had NA-I223V and NA-S247N amino acid substitutions and showed reduced inhibition by oseltamivir.

              One A(H3N2) virus had PA-I38T amino acid substitution and showed reduced susceptibility to baloxavir.

              High levels of resistance to the adamantanes (amantadine and rimantadine) persist among influenza A(H1N1)pdm09 and influenza A(H3N2) viruses (the adamantanes are not effective against influenza B viruses). Therefore, use of these antivirals for treatment and prevention of influenza A virus infection is not recommended and data from adamantane resistance testing are not presented. Outpatient Respiratory Illness Surveillance


              The U.S. Outpatient Influenza-like Illness Surveillance Network (ILINet) monitors outpatient visits for respiratory illness referred to as influenza-like illness [ILI (fever plus cough or sore throat)], not laboratory-confirmed influenza and will therefore capture respiratory illness visits due to infection with pathogens that can present with similar symptoms, including influenza viruses, SARS-CoV-2, and RSV. It is important to evaluate syndromic surveillance data, including that from ILINet, in the context of other sources of surveillance data to obtain a more complete and accurate picture of influenza, SARS-CoV-2, and other respiratory virus activity. CDC is providing integrated information about COVID-19, influenza, and RSV activity on a website that is updated weekly. Information about other respiratory virus activity can be found on CDC’s National Respiratory and Enteric Virus Surveillance System (NREVSS) website. Outpatient Respiratory Illness Visits


              Nationwide, during Week 10, 3.7% of patient visits reported through ILINet were due to respiratory illness that included fever plus a cough or sore throat, also referred to as ILI. This has decreased (change of >0.1 percentage points) compared to Week 9 and remains above the national baseline. The percentage of visits for ILI increased in regions 8 and 10 and decreased in all other regions (1, 2, 3, 4, 5, 6, 7, and 9) compared to Week 9. Region 9 is at their baseline, while all other regions remain above their region-specific baselines. Multiple respiratory viruses are co-circulating, and the relative contribution of influenza virus infection to ILI varies by location.

              national levels of ILI and ARI
              * Effective October 3, 2021 (week 40), the ILI definition (fever plus cough or sore throat) no longer includes “without a known cause other than influenza.”

              View Chart Data (current season only) | View Full Screen Outpatient Respiratory Illness Visits by Age Group


              About 70% of ILINet participants provide both the number of patient visits for respiratory illness and the total number of patient visits for the week broken out by age group. Data from this subset of providers are used to calculate the percentages of patient visits for respiratory illness by age group.

              The percentage of visits for respiratory illness reported in ILINet decreased in 4 age groups (0-4 years, 5-24 years, 25-49 years, and 50-64 years), and remained stable in the 65+ years age group during Week 10 compared to Week 9.

              national levels of ILI and ARI by age group
              View Chart Data | View Full Screen Outpatient Respiratory Illness Activity Map


              Data collected in ILINet are used to produce a measure of ILI activity* by state/jurisdiction and Core Based Statistical Areas (CBSA).
              Week 10
              (Week ending
              Mar. 9, 2024)
              Week 9
              (Week ending
              Mar. 2, 2024)
              Week 10
              (Week ending
              Mar. 9, 2024)
              Week 9
              (Week ending
              Mar. 2, 2024)
              Very High 3 5 11 16
              High 13 17 58 92
              Moderate 13 15 95 102
              Low 17 9 203 200
              Minimal 9 9 337 299
              Insufficient Data 0 0 225 220


              *Data collected in ILINet may disproportionally represent certain populations within a jurisdiction or CBSA, and therefore, may not accurately depict the full picture of influenza activity for the entire jurisdiction or CBSA. Differences in the data presented here by CDC and independently by some health departments likely represent differing levels of data completeness with data presented by the health department likely being the more complete.

              Additional information about medically attended visits for ILI for current and past seasons:
              Surveillance Methods | FluView Interactive: National, Regional, and State Data or ILI Activity Map Hospitalization Surveillance

              FluSurv-NET


              The Influenza Hospitalization Surveillance Network (FluSurv-NET) conducts population-based surveillance for laboratory-confirmed influenza-related hospitalizations in select counties in 14 states and represents approximately 9% of the U.S. population. FluSurv-NET hospitalization data are preliminary. As data are received each week, prior case counts and rates are updated accordingly.

              A total of 20,741 laboratory-confirmed influenza-associated hospitalizations were reported by FluSurv-NET sites between October 1, 2023, and March 9, 2024. The weekly hospitalization rate observed in Week 10 was 2.1 per 100,000 population. The weekly hospitalization rate observed during Week 52 is the third highest peak weekly rate observed during all seasons going back to 2010-2011 following the 2014-2015 and 2017-2018 seasons. The overall cumulative hospitalization rate was 67.9 per 100,000 population. This cumulative hospitalization rate is the second highest cumulative hospitalization rate when compared against previous end-of-season rates for Week 10, and it is the second highest cumulative in-season hospitalization rate observed in Week 10, following the 2017-2018 season (89.9). Cumulative in-season hospitalization rates observed in Week 10 from 2010-2011 through 2022-2023 ranged from 0.7 to 61.6.

              When examining rates by age, the highest cumulative hospitalization rate per 100,000 population was among adults aged 65 years and older (184.3), followed by adults aged 50-64 years (81.5) and children aged 0-4 years (71.1). When examining age-adjusted rates by race and ethnicity, the highest rate of hospitalization per 100,000 population was among non-Hispanic Black persons (128.9), followed by non-Hispanic American Indian or Alaska Native persons (94.9), Hispanic persons (64.2), non-Hispanic White persons (51.9), and non-Hispanic Asian/Pacific Islander persons (36.1).

              Among 20,741 hospitalizations, 17,868 (86.1%) were associated with influenza A virus, 2,745 (13.2%) with influenza B virus, 41 (0.2%) with influenza A virus and influenza B virus co-infection, and 87 (0.4%) with influenza virus for which the type was not determined. Among those with influenza A subtype information, 2,997 (72.4%) were A(H1N1) pdm09 and 1,138 (27.5%) were A(H3N2).

              Among 2,315 hospitalized adults with information on underlying medical conditions, 95.6% had at least one reported underlying medical condition, the most commonly reported were hypertension, cardiovascular disease, obesity, and metabolic disease. Among 1,193 hospitalized women of childbearing age (15-49 years) with information on pregnancy status, 23.2% were pregnant. Among 675 hospitalized children with information on underlying medical conditions, 69.5% had at least one reported underlying medical condition; the most commonly reported was asthma, followed by obesity and neurologic disease.

              FluSurvNet Cumulative Rates

              View Full Screen

              In this figure, cumulative rates for all seasons prior to the 2023-2024 season reflect end-of-season rates. For the 2023-2024 season, rates for recent hospitals admissions are subject to reporting delays. As hospitalization data are reviewed each week, prior case counts and rates are updated accordingly.

              FluSurvNet Weekly Rate

              View Full Screen

              In this figure, weekly rates for all seasons prior to the 2023-24 season reflect end-of-season rates. For the 2023-24 season, rates for recent hospital admissions are subject to reporting delays and are shown as a dashed line for the current season. As hospitalization data are received each week, prior case counts and rates are updated accordingly.

              Additional FluSurv-NET hospitalization surveillance information for current and past seasons and additional age groups:
              Surveillance Methods |FluView Interactive: Rates by Age, Sex, and Race/Ethnicity or Data on Patient Characteristics | RESP-NET Interactive National Healthcare Safety Network (NHSN) Hospitalization Surveillance


              Hospitals report to NHSN the weekly number of patients admitted with laboratory-confirmed influenza. During Week 10, 8,819 patients with laboratory-confirmed influenza were admitted to a hospital. Nationally and in all HHS regions, the number of patients admitted to a hospital with laboratory-confirmed influenza for Week 10 decreased (change of >5%) compared to Week 9.


              Additional NHSN Hospitalization Surveillance information:
              Surveillance Methods | Additional Data | FluView Interactive Mortality Surveillance

              National Center for Health Statistics (NCHS) Mortality Surveillance


              Based on NCHS mortality surveillance data available on March 14, 2024, 0.7% of the deaths that occurred during the week ending March 9, 2024 (Week 10) were due to influenza. This percentage increased (≥ 0.1 percentage point change) compared to Week 9. The data presented are preliminary and may change as more data are received and processed.


              Additional pneumonia, influenza and COVID-19 mortality surveillance information for current and past seasons:
              Surveillance Methods | FluView Interactive Influenza-Associated Pediatric Mortality


              Fifteen influenza-associated pediatric deaths were reported to CDC during Week 10.

              Thirteen deaths occurred during the 2023-2024 season, bringing the total pediatric deaths for this season to 116. The deaths occurred during Week 52 of 2023 (the week ending December 30, 2023) and between weeks 4 and 9 of 2024 (the weeks ending January 27, 2024, and March 2, 2024). Nine deaths were associated with influenza A viruses. Six of the influenza A viruses had subtyping performed; five were A(H1N1) viruses and one was an A(H3) virus. Three deaths were associated with influenza B viruses with no lineage determined. One death was associated with a co-infection with influenza A(H1N1) and influenza B viruses.

              Two deaths occurring during the 2022-2023 season were also reported, which brings the total number of pediatric deaths for last season to 184. One death was associated with an influenza A(H3) virus and occurred during Week 47 of 2022 (the week ending November 26, 2022). The other death was associated with an influenza A(H1N1) virus and occurred during Week 1 of 2023 (the week ending January 7, 2023).


              Additional pediatric mortality surveillance information for current and past seasons:
              Surveillance Methods | FluView Interactive Trend Indicators


              Increasing:
              Decreasing:
              Stable: Indicators Status by System


              Clinical Labs: Up or down arrows indicate a change of greater than or equal to 0.5 percentage points in the percent of specimens positive for influenza compared to the previous week.
              Outpatient Respiratory Illness (ILINet): Up or down arrows indicate a change of greater than 0.1 percentage points in the percent of visits due to respiratory illness (ILI) compared to the previous week.
              NHSN Hospitalizations: Up or down arrows indicate change of greater than or equal to 5% of the number of patients admitted with laboratory-confirmed influenza compared to the previous week.
              NCHS Mortality: Up or down arrows indicate change of greater than 0.1 percentage points of the percent of deaths due to influenza compared to the previous week. Reference Footnotes


              1U.S. Influenza Surveillance: Purpose and Methods (2023 Oct). Centers for Disease Control and Prevention. https://www.cdc.gov/flu/weekly/overview.htm#ILINet.

              2Grohskopf LA, Blanton LH, Ferdinands JM, Chung JR, Broder KR, Talbot HK. Prevention and Control of Seasonal Influenza with Vaccines: Recommendations of the Advisory Committee on Immunization Practices — United States, 2023–24 Influenza Season. MMWR Recomm Rep 2023;72(No. RR-2):1–25. DOI: http://dx.doi.org/10.15585/mmwr.rr7202a1

              3Influenza Antiviral Medications: Summary for Clinicians (2023 Sept). Centers for Disease Control and Prevention. https://www.cdc.gov/flu/professional...clinicians.htm.

              Comment


              • #22
                Weekly U.S. Influenza Surveillance Report


                Print
                Updated March 22, 2024

                Key Updates for Week 11, ending March 16, 2024

                Seasonal influenza activity remains elevated nationally but is decreasing. Activity is decreasing or stable in nine HHS regions and increasing slightly in the Pacific Northwest. Viruses


                Clinical Lab 12.0%

                (Trend )


                positive for influenza
                this week


                Public Health Lab
                Influenza A(H1N1)pdm09, A(H3N2), and B viruses were all co-circulating this week.

                Virus Characterization
                Genetic and antigenic characterization and antiviral susceptibility are summarized in this report. Illness


                Outpatient Respiratory Illness 3.4%

                (Trend )


                of visits to a health care provider this week were for respiratory illness
                (above baseline).


                Outpatient Respiratory Illness: Activity Map
                This week 13 jurisdictions experienced moderate activity and 9 jurisdictions experienced high or very high activity.

                FluSurv-NET 70.2 per 100,000


                cumulative hospitalization rate.

                NHSN Hospitalizations 6,973 (Trend )


                patients admitted to hospitals with influenza this week.

                NCHS Mortality 0.6%

                (Trend )


                of deaths attributed to influenza this week.

                Pediatric Deaths 5


                influenza-associated deaths were reported this week for a total of 121 deaths this season.

                All data are preliminary and may change as more reports are received.

                Directional arrows indicate changes between the current week and the previous week. Additional information on the arrows can be found at the bottom of this page.

                A description of the CDC influenza surveillance system, including methodology and detailed descriptions of each data component is available on the surveillance methods page.

                Additional information on the current and previous influenza seasons for each surveillance component are available on FluView Interactive.

                Key Points
                • Seasonal influenza activity remains elevated but is decreasing nationally. Activity is decreasing or stable in nine of the 10 HHS regions; however, the Pacific Northwest reported a slight increase this week.
                • Nationally, percent positivity for both influenza A and B decreased compared to last week.
                • Nationally, outpatient respiratory illness declined but remains above baseline.1 Region 2 is below their baseline, while all other HHS regions remain at or above their region-specific baselines.
                • Nationally, the number of weekly flu hospital admissions has been decreasing since January.
                • During Week 11, of the 426 viruses reported by public health laboratories, 275 (64.6%) were influenza A and 151 (35.4%) were influenza B. Of the 198 influenza A viruses subtyped during Week 11, 87 (43.9%) were influenza A(H1N1)pdm09 and 111 (56.1%) were A(H3N2).
                • Five influenza-associated pediatric deaths occurring during the 2023-2024 season were reported to CDC during Week 11, bringing the season total to 121 pediatric deaths.
                • CDC estimates that there have been at least 30 million illnesses, 340,000 hospitalizations, and 21,000 deaths from flu so far this season.
                • CDC recommends that everyone 6 months and older get an annual flu vaccine as long as influenza viruses are spreading.2 Vaccination can still provide benefit this season.
                • There also are prescription flu antiviral drugs that can treat flu illness; those should be started as early as possible and are especially important for higher risk patients.3
                • Flu viruses are among several viruses contributing to respiratory disease activity. CDC is providing updated, integrated information about COVID-19, flu, and RSV activity on a weekly basis.
                U.S. Virologic Surveillance


                Nationally, the percentage of respiratory specimens testing positive for influenza in clinical laboratories decreased (change of >0.5 percentage points) compared to the previous week. Region 10 reported an increase; regions 1, 2, 3, 4, 5, 6, and 7 reported a decrease; and regions 8 and 9 remained stable during Week 11 compared to Week 10. The regions with the highest percent positivity were regions 7 (24.5%), 5 (18.9%), and 8 (12.4%). Nationally, influenza A(H1N1)pdm09, A(H3N2), and B/Victoria viruses are all co-circulating. However, the distribution of circulating viruses varies by region. For regional and state level data and age group distribution, please visit FluView Interactive. Viruses known to be associated with recent receipt of live attenuated influenza vaccine (LAIV) or found upon further testing to be a vaccine virus are not included, as they are not circulating influenza viruses. Clinical Laboratories


                The results of tests performed by clinical laboratories nationwide are summarized below. Data from clinical laboratories (the percentage of specimens tested that are positive for influenza virus) are used to monitor whether influenza activity is increasing or decreasing.
                No. of specimens tested 82,202 2,577,255
                No. of positive specimens (%) 9,862 (12.0%) 299,652 (11.6%)
                Positive specimens by type
                Influenza A 5,121 (51.9%) 214,693 (71.6%)
                Influenza B 4,741 (48.1%) 84,949 (28.4%)
                Public Health Laboratories


                The results of tests performed by public health laboratories nationwide are summarized below. Data from public health laboratories are used to monitor the proportion of circulating influenza viruses that belong to each influenza subtype/lineage.
                No. of specimens tested 2,012 90,420
                No. of positive specimens 426 29,239
                Positive specimens by type/subtype
                Influenza A 275 (64.6%) 23,120 (79.1%)
                Subtyping Performed 198 (72.0%) 19,010 (82.2%)
                (H1N1)pdm09 87 (43.9%) 13,853 (72.9%)
                H3N2 111 (56.1%) 5,157 (27.1%)
                H3N2v 0 (0.0%) 0 (0.0%)
                Subtyping not performed 77 (28.0%) 4,110 (17.8%)
                Influenza B 151 (35.4%) 6,119 (20.9%)
                Lineage testing performed 118 (78.1%) 5,196 (84.9%)
                Yamagata lineage 0 (0.0%) 0 (0.0%)
                Victoria lineage 118 (100.0%) 5,196 (100.0%)
                Lineage not performed 33 (21.9%) 923 (15.1%)


                Additional virologic surveillance information for current and past seasons:
                Surveillance Methods | FluView Interactive: National, Regional, and State Data or Age Data Influenza Virus Characterization


                CDC performs genetic and antigenic characterization of U.S. viruses submitted from state and local public health laboratories according to the Right Size Roadmap submission guidance. These data are used to compare how similar the currently circulating influenza viruses are to the reference viruses representing viruses contained in the current influenza vaccines. The data are also used to monitor evolutionary changes that continually occur in influenza viruses circulating in humans. CDC also tests susceptibility of circulating influenza viruses to antiviral medications including the neuraminidase inhibitors (oseltamivir, zanamivir, and peramivir) and the PA endonuclease inhibitor baloxavir.

                CDC has genetically characterized 2,816 influenza viruses collected since October 1, 2023.
                A/H1 1,200
                6B.1A.5a 1,200 (100%) 2a 293 (24.4%)
                2a.1 907 (75.6%)
                A/H3 842
                3C.2a1b.2a 842 (100%) 2a.1b 1 (0.1%)
                2a.3a 1 (0.1%)
                2a.3a.1 839 (99.6%)
                2b 1 (0.1%)
                B/Victoria 774
                V1A 774 (100%) 3a.2 774 (100%)
                B/Yamagata 0
                Y3 0 Y3 0 (0%)
                CDC antigenically characterizes influenza viruses by hemagglutination inhibition (HI) (H1N1pdm09, H3N2, B/Victoria, and B/Yamagata viruses) or neutralization-based HINT (H3N2 viruses) using antisera that ferrets make after being infected with reference viruses representing the 2023-2024 Northern Hemisphere recommended cell or recombinant-based vaccine viruses. Antigenic differences between viruses are determined by comparing how well the antibodies made against the vaccine reference viruses recognize the circulating viruses that have been grown in cell culture. Ferret antisera are useful because antibodies raised against a particular virus can often recognize small changes in the surface proteins of other viruses. In HI assays, viruses with similar antigenic properties have antibody titer differences of less than or equal to 4-fold when compared to the reference (vaccine) virus. In HINT, viruses with similar antigenic properties have antibody neutralization titer differences of less than or equal to 8-fold. Viruses selected for antigenic characterization are a subset representing the genetic changes in the surface proteins seen in genetically characterized viruses.

                Influenza A Viruses
                • A (H1N1)pdm09: 200 A(H1N1)pdm09 viruses were antigenically characterized by HI, and all were well-recognized (reacting at titers that were within 4-fold of the homologous virus titer) by ferret antisera to cell-grown A/Wisconsin/67/2022-like reference viruses representing the A(H1N1)pdm09 component for the cell- and recombinant-based influenza vaccines.
                • A (H3N2): 192 A(H3N2) viruses were antigenically characterized by HI or HINT, and 190 (99.0%) were well-recognized (reacting at titers that were within 4-fold of the homologous virus titer in HI or reacting at titers that were less than or equal to 8-fold of the homologous virus in HINT) by ferret antisera to cell-grown A/Darwin/6/2021-like reference viruses representing the A(H3N2) component for the cell- and recombinant-based influenza vaccines.

                Influenza B Viruses
                • B/Victoria: 127 influenza B/Victoria-lineage virus were antigenically characterized by HI, and all were well-recognized (reacting at titers that were within 4-fold of the homologous virus titer) by ferret antisera to cell-grown B/Austria/1359417/2021-like reference viruses representing the B/Victoria component for the cell- and recombinant-based influenza vaccines.
                • B/Yamagata: No influenza B/Yamagata-lineage viruses were available for antigenic characterization.

                Assessment of Virus Susceptibility to Antiviral Medications

                CDC assesses susceptibility of influenza viruses to the antiviral medications including the neuraminidase inhibitors (oseltamivir, zanamivir, and peramivir) and the PA endonuclease inhibitor baloxavir using next generation sequence analysis supplemented by laboratory assays. Information about antiviral susceptibility test methods can be found at U.S. Influenza Surveillance: Purpose and Methods | CDC.

                Viruses collected in the U.S. since October 01, 2023, were tested for antiviral susceptibility as follows:
                Neuraminidase Inhibitors Oseltamivir Viruses Tested 2,812 1,202 840 770
                Reduced Inhibition 1 (0.04%) 1 (0.1%) 0 (0.0%) 0 (0.0%)
                Highly Reduced Inhibition 1 (0.04%) 1 (0.1%) 0 (0.0%) 0 (0.0%)
                Peramivir Viruses Tested 2,812 1,202 840 770
                Reduced Inhibition 0 (0.0%) 0 (0.0%) 0 (0.0%) 0 (0.0%)
                Highly Reduced Inhibition 1 (0.04%) 1 (0.1%) 0 (0.0%) 0 (0.0%)
                Zanamivir Viruses Tested 2,812 1,202 840 770
                Reduced Inhibition 0 (0.0%) 0 (0.0%) 0 (0.0%) 0 (0.0%)
                Highly Reduced Inhibition 0 (0.0%) 0 (0.0%) 0 (0.0%) 0 (0.0%)
                PA Cap-Dependent Endonuclease Inhibitor Baloxavir Viruses Tested 2,737 1,171 823 743
                Decreased Susceptibility 1 (0.04%) 0 (0.0%) 1 (0.1%) 0 (0.0%)
                One A(H1N1)pdm09 virus had NA-H275Y amino acid substitution and showed highly reduced inhibition by oseltamivir and peramivir. One (H1N1)pdm09 virus had NA-I223V and NA-S247N amino acid substitutions and showed reduced inhibition by oseltamivir.

                One A(H3N2) virus had PA-I38T amino acid substitution and showed reduced susceptibility to baloxavir.

                High levels of resistance to the adamantanes (amantadine and rimantadine) persist among influenza A(H1N1)pdm09 and influenza A(H3N2) viruses (the adamantanes are not effective against influenza B viruses). Therefore, use of these antivirals for treatment and prevention of influenza A virus infection is not recommended and data from adamantane resistance testing are not presented. Outpatient Respiratory Illness Surveillance


                The U.S. Outpatient Influenza-like Illness Surveillance Network (ILINet) monitors outpatient visits for respiratory illness referred to as influenza-like illness [ILI (fever plus cough or sore throat)], not laboratory-confirmed influenza and will therefore capture respiratory illness visits due to infection with pathogens that can present with similar symptoms, including influenza viruses, SARS-CoV-2, and RSV. It is important to evaluate syndromic surveillance data, including that from ILINet, in the context of other sources of surveillance data to obtain a more complete and accurate picture of influenza, SARS-CoV-2, and other respiratory virus activity. CDC is providing integrated information about COVID-19, influenza, and RSV activity on a website that is updated weekly. Information about other respiratory virus activity can be found on CDC’s National Respiratory and Enteric Virus Surveillance System (NREVSS) website. Outpatient Respiratory Illness Visits


                Nationwide, during Week 11, 3.4% of patient visits reported through ILINet were due to respiratory illness that included fever plus a cough or sore throat, also referred to as ILI. This has decreased (change of >0.1 percentage points) compared to Week 10 and remains above the national baseline. The percentage of visits for ILI decreased in regions 1, 2, 3, 4, 5, 6, and 7 and remained stable in regions 8, 9, and 10 compared to Week 10. Region 2 is below its baseline, regions 4, 8, and 9 are at their respective baselines, and the remaining regions are above their respective baselines. Multiple respiratory viruses are co-circulating, and the relative contribution of influenza virus infection to ILI varies by location.

                Outpatient Respiratory Illness Visits by Age Group


                About 70% of ILINet participants provide both the number of patient visits for respiratory illness and the total number of patient visits for the week broken out by age group. Data from this subset of providers are used to calculate the percentages of patient visits for respiratory illness by age group.

                The percentage of visits for respiratory illness reported in ILINet decreased in all age groups in Week 11 compared to Week 10.

                Outpatient Respiratory Illness Activity Map


                Data collected in ILINet are used to produce a measure of ILI activity* by state/jurisdiction and Core Based Statistical Areas (CBSA).
                Week 11
                (Week ending
                Mar. 16, 2024)
                Week 10
                (Week ending
                Mar. 9, 2024)
                Week 11
                (Week ending
                Mar. 16, 2024)
                Week 10
                (Week ending
                Mar. 9, 2024)
                Very High 2 3 4 11
                High 7 14 42 60
                Moderate 13 12 69 94
                Low 20 16 194 200
                Minimal 12 10 377 345
                Insufficient Data 1 0 243 219


                *Data collected in ILINet may disproportionally represent certain populations within a jurisdiction or CBSA, and therefore, may not accurately depict the full picture of influenza activity for the entire jurisdiction or CBSA. Differences in the data presented here by CDC and independently by some health departments likely represent differing levels of data completeness with data presented by the health department likely being the more complete.

                Additional information about medically attended visits for ILI for current and past seasons:
                Surveillance Methods | FluView Interactive: National, Regional, and State Data or ILI Activity Map Hospitalization Surveillance

                FluSurv-NET


                The Influenza Hospitalization Surveillance Network (FluSurv-NET) conducts population-based surveillance for laboratory-confirmed influenza-related hospitalizations in select counties in 14 states and represents approximately 9% of the U.S. population. FluSurv-NET hospitalization data are preliminary. As data are received each week, prior case counts and rates are updated accordingly.

                A total of 21,443 laboratory-confirmed influenza-associated hospitalizations were reported by FluSurv-NET sites between October 1, 2023, and March 16, 2024. The weekly hospitalization rate observed in Week 11 was 1.7 per 100,000 population. The weekly hospitalization rate observed during Week 52 is the third highest peak weekly rate observed during all seasons going back to 2010-2011 following the 2014-2015 and 2017-2018 seasons. The overall cumulative hospitalization rate was 70.2 per 100,000 population. This cumulative hospitalization rate is the second highest cumulative hospitalization rate when compared against previous end-of-season rates for Week 11, and it is the second highest cumulative in-season hospitalization rate observed in Week 11, following the 2017-2018 season (93.5). Cumulative in-season hospitalization rates observed in Week 11 from 2010-2011 through 2022-2023 ranged from 0.7 to 65.1.

                When examining rates by age, the highest cumulative hospitalization rate per 100,000 population was among adults aged 65 years and older (191.0), followed by adults aged 50-64 years (83.8) and children aged 0-4 years (73.8). When examining age-adjusted rates by race and ethnicity, the highest rate of hospitalization per 100,000 population was among non-Hispanic Black persons (132.2), followed by non-Hispanic American Indian or Alaska Native persons (97.2), Hispanic persons (65.7), non-Hispanic White persons (53.9), and non-Hispanic Asian/Pacific Islander persons (37.0).

                Among 21,443 hospitalizations, 18,406 (85.8%) were associated with influenza A virus, 2,888 (13.5%) with influenza B virus, 49 (0.2%) with influenza A virus and influenza B virus co-infection, and 100 (0.5%) with influenza virus for which the type was not determined. Among those with influenza A subtype information, 3,081 (72.3%) were A(H1N1) pdm09 and 1,181 (27.7%) were A(H3N2).

                Among 2,491 hospitalized adults with information on underlying medical conditions, 95.5% had at least one reported underlying medical condition, the most commonly reported were hypertension, cardiovascular disease, obesity, and metabolic disease. Among 1,234 hospitalized women of childbearing age (15-49 years) with information on pregnancy status, 22.9% were pregnant. Among 736 hospitalized children with information on underlying medical conditions, 69.9% had at least one reported underlying medical condition; the most commonly reported was asthma, followed by obesity and neurologic disease.


                In this figure, cumulative and weekly rates for all seasons prior to the 2023-2024 season reflect end-of-season rates. For the 2023-2024 season, rates for recent hospitals admissions are subject to reporting delays. As hospitalization data are reviewed each week, prior case counts and rates are updated accordingly.

                Additional FluSurv-NET hospitalization surveillance information for current and past seasons and additional age groups:
                Surveillance Methods |FluView Interactive: Rates by Age, Sex, and Race/Ethnicity or Data on Patient Characteristics | RESP-NET Interactive National Healthcare Safety Network (NHSN) Hospitalization Surveillance


                Hospitals report to NHSN the weekly number of patients admitted with laboratory-confirmed influenza. During Week 11, 6,973 patients with laboratory-confirmed influenza were admitted to a hospital. Nationally and in regions 1, 2, 3, 4, 5, 6, and 7, the number of patients admitted to a hospital with laboratory-confirmed influenza for Week 11 decreased (change of >5%) compared to Week 10. The number of hospitalizations with laboratory-confirmed influenza increased in regions 8 and 10 and remained stable in Region 9.


                Additional NHSN Hospitalization Surveillance information:
                Surveillance Methods | Additional Data | FluView Interactive Mortality Surveillance

                National Center for Health Statistics (NCHS) Mortality Surveillance


                Based on NCHS mortality surveillance data available on March 21, 2024, 0.6% of the deaths that occurred during the week ending March 16, 2024 (Week 11), were due to influenza. This percentage decreased (≥ 0.1 percentage point change) compared to Week 10. The data presented are preliminary and may change as more data are received and processed.


                Additional pneumonia, influenza and COVID-19 mortality surveillance information for current and past seasons:
                Surveillance Methods | FluView Interactive Influenza-Associated Pediatric Mortality


                Five influenza-associated pediatric deaths occurring during the 2023-2024 season were reported to CDC during Week 11. The deaths occurred during weeks 2, 9, and 11 of 2024 (the weeks ending January 13, March 2, and March 16, respectively). Two deaths were associated with influenza A(H1N1) viruses and three deaths were associated with influenza B viruses with no lineage determined.


                Additional pediatric mortality surveillance information for current and past seasons:
                Surveillance Methods | FluView Interactive Trend Indicators


                Increasing:
                Decreasing:
                Stable: Indicators Status by System


                Clinical Labs: Up or down arrows indicate a change of greater than or equal to 0.5 percentage points in the percent of specimens positive for influenza compared to the previous week.
                Outpatient Respiratory Illness (ILINet): Up or down arrows indicate a change of greater than 0.1 percentage points in the percent of visits due to respiratory illness (ILI) compared to the previous week.
                NHSN Hospitalizations: Up or down arrows indicate change of greater than or equal to 5% of the number of patients admitted with laboratory-confirmed influenza compared to the previous week.
                NCHS Mortality: Up or down arrows indicate change of greater than 0.1 percentage points of the percent of deaths due to influenza compared to the previous week. Reference Footnotes


                1U.S. Influenza Surveillance: Purpose and Methods (2023 Oct). Centers for Disease Control and Prevention. https://www.cdc.gov/flu/weekly/overview.htm#ILINet.

                2Grohskopf LA, Blanton LH, Ferdinands JM, Chung JR, Broder KR, Talbot HK. Prevention and Control of Seasonal Influenza with Vaccines: Recommendations of the Advisory Committee on Immunization Practices — United States, 2023–24 Influenza Season. MMWR Recomm Rep 2023;72(No. RR-2):1–25. DOI: http://dx.doi.org/10.15585/mmwr.rr7202a1

                3Influenza Antiviral Medications: Summary for Clinicians (2023 Sept). Centers for Disease Control and Prevention. https://www.cdc.gov/flu/professional...clinicians.htm.

                Additional National and International Influenza Surveillance Information


                FluView Interactive: FluView includes enhanced web-based interactive applications that can provide dynamic visuals of the influenza data collected and analyzed by CDC. These FluView Interactive applications allow people to create customized, visual interpretations of influenza data, as well as make comparisons across flu seasons, regions, age groups and a variety of other demographics.

                National Institute for Occupational Safety and Health: Monthly surveillance data on the prevalence of health-related workplace absenteeism among full-time workers in the United States are available from NIOSH.
                https://www.cdc.gov/flu/weekly/index.htm
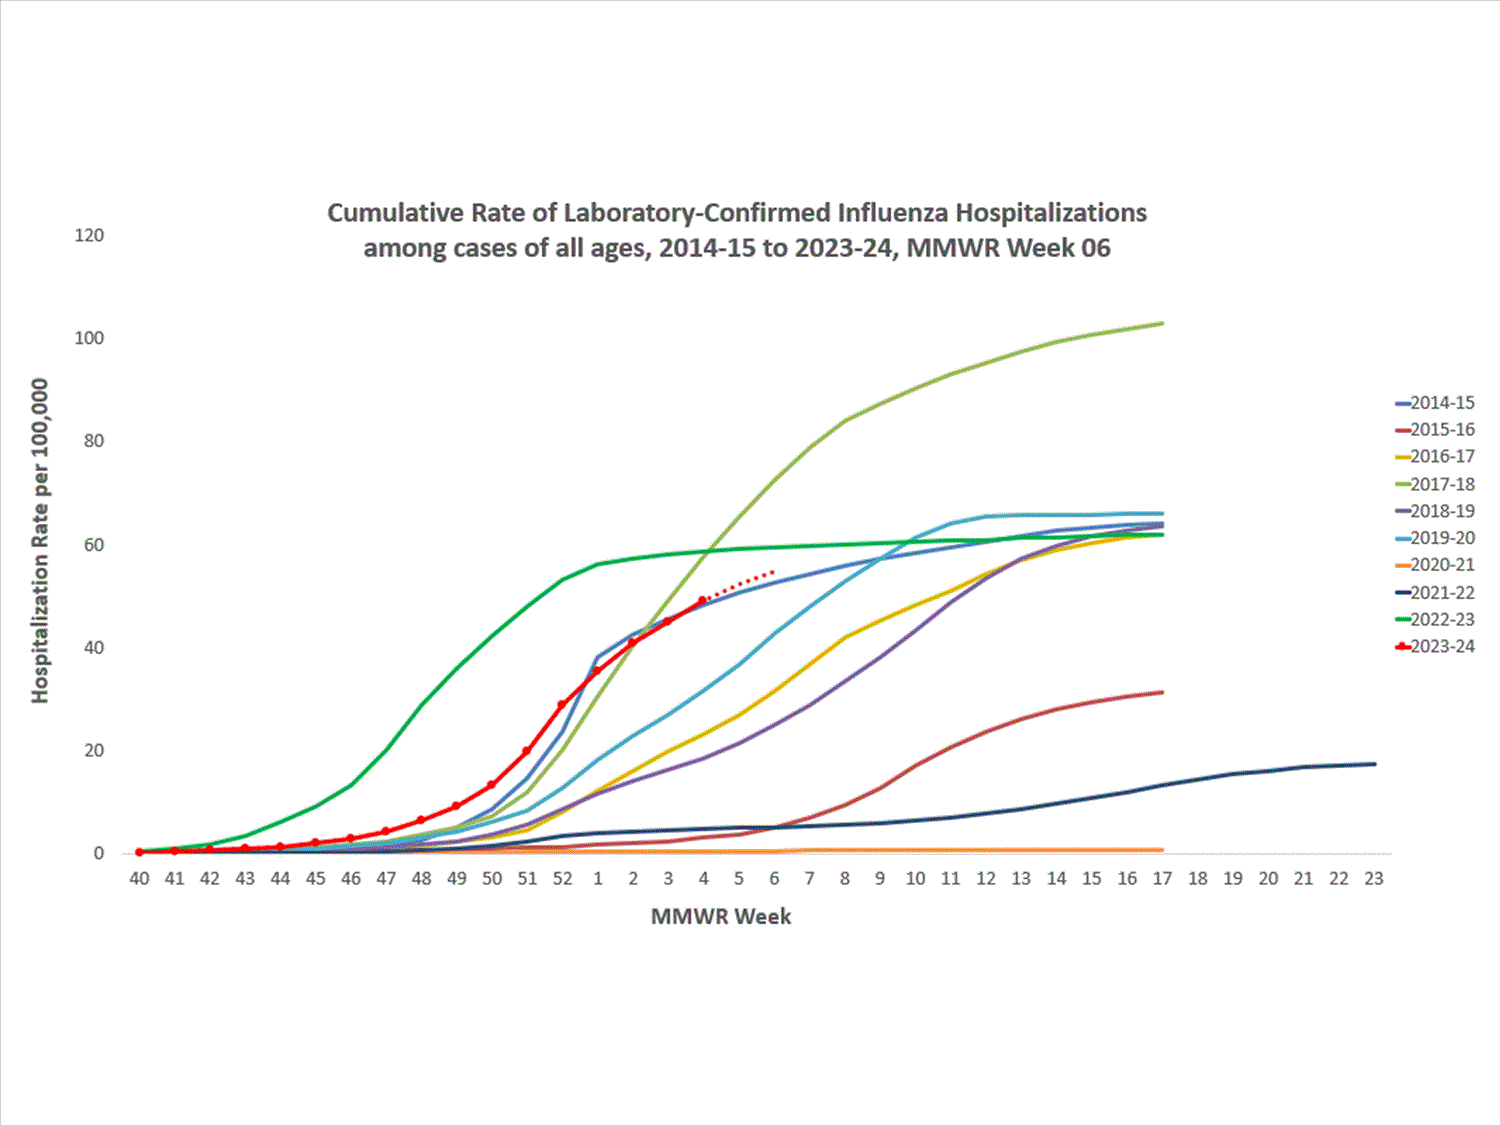
                Comment


                • #23
                  Weekly U.S. Influenza Surveillance Report


                  Print
                  Updated March 29, 2024

                  Key Updates for Week 12, ending March 23, 2024

                  Seasonal influenza activity remains elevated nationally but is decreasing. Viruses


                  Clinical Lab 10.5%

                  (Trend )


                  positive for influenza
                  this week


                  Public Health Lab
                  Influenza A(H1N1)pdm09, A(H3N2), and B viruses were all co-circulating this week.

                  Virus Characterization
                  Genetic and antigenic characterization and antiviral susceptibility are summarized in this report. Illness


                  Outpatient Respiratory Illness 3.1%

                  (Trend )


                  of visits to a health care provider this week were for respiratory illness
                  (above baseline).


                  Outpatient Respiratory Illness: Activity Map
                  This week 4 jurisdictions experienced moderate activity and 9 jurisdictions experienced high activity.

                  FluSurv-NET 72.2 per 100,000


                  cumulative hospitalization rate.

                  NHSN Hospitalizations 5,738 (Trend )


                  patients admitted to hospitals with influenza this week.

                  NCHS Mortality 0.5%

                  (Trend )


                  of deaths attributed to influenza this week.

                  Pediatric Deaths 5


                  influenza-associated deaths were reported this week for a total of 126 deaths this season.

                  All data are preliminary and may change as more reports are received.

                  Directional arrows indicate changes between the current week and the previous week. Additional information on the arrows can be found at the bottom of this page.

                  A description of the CDC influenza surveillance system, including methodology and detailed descriptions of each data component is available on the surveillance methods page.

                  Additional information on the current and previous influenza seasons for each surveillance component are available on FluView Interactive.

                  Key Points
                  • Seasonal influenza activity remains elevated but is decreasing nationally.
                  • Nationally, percent positivity for both influenza A and B decreased compared to last week.
                  • One human infection with an influenza A(H1N2) variant virus was reported by the Pennsylvania Department of Health.
                  • Nationally, outpatient respiratory illness declined but remains above baseline.1 Regions 2, 4, 6, and 8 are below their baselines, while all other HHS regions remain at or above their region-specific baselines.
                  • Nationally, the number of weekly flu hospital admissions has been decreasing since January.
                  • During Week 12, of the 403 viruses reported by public health laboratories, 239 (59.3%) were influenza A and 164 (40.7%) were influenza B. Of the 172 influenza A viruses subtyped during Week 12, 76 (44.2%) were influenza A(H1N1)pdm09 and 96 (55.8%) were A(H3N2).
                  • Five influenza-associated pediatric deaths occurring during the 2023-2024 season were reported to CDC during Week 11, bringing the season total to 126 pediatric deaths.
                  • CDC estimates that there have been at least 31 million illnesses, 350,000 hospitalizations, and 22,000 deaths from flu so far this season.
                  • CDC recommends that everyone 6 months and older get an annual flu vaccine as long as influenza viruses are spreading.2 Vaccination can still provide benefit this season.
                  • There also are prescription flu antiviral drugs that can treat flu illness; those should be started as early as possible and are especially important for higher risk patients.3
                  • Flu viruses are among several viruses contributing to respiratory disease activity. CDC is providing updated, integrated information about COVID-19, flu, and RSV activity on a weekly basis.
                  U.S. Virologic Surveillance


                  Nationally, the percentage of respiratory specimens testing positive for influenza in clinical laboratories decreased (change of >0.5 percentage points) compared to the previous week. Regions 3, 5, 6, 7, 8, and 10 reported a decrease; regions 1, 4, and 9 remained stable; and region 2 reported an increase (likely a reporting artifact) during Week 12 compared to Week 11. The regions with the highest percent positivity were regions 7 (20.1%), 5 (16.4%), and 1 (10.4%). Nationally, influenza A(H1N1)pdm09, A(H3N2), and B/Victoria viruses are all co-circulating. However, the distribution of circulating viruses varies by region. For regional and state level data and age group distribution, please visit FluView Interactive. Viruses known to be associated with recent receipt of live attenuated influenza vaccine (LAIV) or found upon further testing to be a vaccine virus are not included, as they are not circulating influenza viruses. Clinical Laboratories


                  The results of tests performed by clinical laboratories nationwide are summarized below. Data from clinical laboratories (the percentage of specimens tested that are positive for influenza virus) are used to monitor whether influenza activity is increasing or decreasing.
                  No. of specimens tested 77,183 2,663,679
                  No. of positive specimens (%) 8,088 (10.5%) 311,936 (11.7%)
                  Positive specimens by type
                  Influenza A 4,130 (51.1%) 220,085 (70.6%)
                  Influenza B 3,958 (48.9%) 91,841 (29.4%)
                  Public Health Laboratories


                  The results of tests performed by public health laboratories nationwide are summarized below. Data from public health laboratories are used to monitor the proportion of circulating influenza viruses that belong to each influenza subtype/lineage.
                  No. of specimens tested 1,917 93,464
                  No. of positive specimens 403 30,309
                  Positive specimens by type/subtype
                  Influenza A 239 (59.3%) 23,805 (78.5%)
                  Subtyping Performed 172 (72.0%) 19,659 (82.6%)
                  (H1N1)pdm09 76 (44.2%) 14,150 (72.0%)
                  H3N2 96 (55.8%) 5,509 (28.0%)
                  H3N2v 0 (0.0%) 0 (0.0%)
                  Subtyping not performed 67 (28.0%) 4,146 (17.4%)
                  Influenza B 164 (40.7%) 6,504 (21.5%)
                  Lineage testing performed 116 (70.7%) 5,517 (84.8%)
                  Yamagata lineage 0 (0.0%) 0 (0.0%)
                  Victoria lineage 116 (100.0%) 5,517 (100.0%)
                  Lineage not performed 48 (29.3%) 987 (15.2%)


                  Additional virologic surveillance information for current and past seasons:
                  Surveillance Methods | FluView Interactive: National, Regional, and State Data or Age Data Novel Influenza A Virus:


                  A human infection with a novel influenza A virus was reported by the Pennsylvania Department of Health. The patient was infected with an influenza A(H1N2) variant (A(H1N2)v) virus. The patient is < 18 years of age, sought healthcare during the week ending March 9, 2024 (week 10), was hospitalized, and has since recovered. An investigation by local public health officials found that the patient had swine contact prior to their illness onset. Additional investigation identified mild illness in two of the patient’s close contacts who also had contact with swine, that began prior to the patient’s onset of symptoms. No person-to-person transmission of A(H1N2)v virus associated with this patient has been identified. The investigation is ongoing. This is the first human infection with a variant influenza A virus reported in the United States in 2024.

                  When an influenza virus that normally circulates in swine (but not people) is detected in a person, it is called a “variant” influenza virus. Most human infections with variant influenza viruses occur following exposure to swine, but human-to-human transmission can occur. It is important to note that in most cases, variant influenza viruses have not shown the ability to spread easily and sustainably from person to person.

                  Early identification and investigation of human infections with novel influenza A viruses are critical so that the risk of infection can be understood, and appropriate public health measures can be taken.

                  Additional information on influenza in swine, variant influenza virus infection in humans, and guidance to interact safely with swine can be found at www.cdc.gov/flu/swineflu/index.htm.

                  Additional information regarding human infections with novel influenza A viruses:

                  Surveillance Methods | FluView Interactive Influenza Virus Characterization


                  CDC performs genetic and antigenic characterization of U.S. viruses submitted from state and local public health laboratories according to the Right Size Roadmap submission guidance. These data are used to compare how similar the currently circulating influenza viruses are to the reference viruses representing viruses contained in the current influenza vaccines. The data are also used to monitor evolutionary changes that continually occur in influenza viruses circulating in humans. CDC also tests susceptibility of circulating influenza viruses to antiviral medications including the neuraminidase inhibitors (oseltamivir, zanamivir, and peramivir) and the PA endonuclease inhibitor baloxavir.

                  CDC has genetically characterized 3,211 influenza viruses collected since October 1, 2023.
                  A/H1 1,342
                  6B.1A.5a 1,342 (100%) 2a 331 (24.7%)
                  2a.1 1,011 (75.3%)
                  A/H3 989
                  3C.2a1b.2a 989 (100%) 2a.1b 1 (0.1%)
                  2a.3a 1 (0.1%)
                  2a.3a.1 986 (99.7%)
                  2b 1 (0.1%)
                  B/Victoria 880
                  V1A 880 (100%) 3a.2 880 (100%)
                  B/Yamagata 0
                  Y3 0 Y3 0 (0%)
                  CDC antigenically characterizes influenza viruses by hemagglutination inhibition (HI) (H1N1pdm09, H3N2, B/Victoria, and B/Yamagata viruses) or neutralization-based HINT (H3N2 viruses) using antisera that ferrets make after being infected with reference viruses representing the 2023-2024 Northern Hemisphere recommended cell or recombinant-based vaccine viruses. Antigenic differences between viruses are determined by comparing how well the antibodies made against the vaccine reference viruses recognize the circulating viruses that have been grown in cell culture. Ferret antisera are useful because antibodies raised against a particular virus can often recognize small changes in the surface proteins of other viruses. In HI assays, viruses with similar antigenic properties have antibody titer differences of less than or equal to 4-fold when compared to the reference (vaccine) virus. In HINT, viruses with similar antigenic properties have antibody neutralization titer differences of less than or equal to 8-fold. Viruses selected for antigenic characterization are a subset representing the genetic changes in the surface proteins seen in genetically characterized viruses.

                  Influenza A Viruses
                  • A (H1N1)pdm09: 200 A(H1N1)pdm09 viruses were antigenically characterized by HI, and all were well-recognized (reacting at titers that were within 4-fold of the homologous virus titer) by ferret antisera to cell-grown A/Wisconsin/67/2022-like reference viruses representing the A(H1N1)pdm09 component for the cell- and recombinant-based influenza vaccines.
                  • A (H3N2): 223 A(H3N2) viruses were antigenically characterized by HI or HINT, and 221 (99.1%) were well-recognized (reacting at titers that were within 4-fold of the homologous virus titer in HI or reacting at titers that were less than or equal to 8-fold of the homologous virus in HINT) by ferret antisera to cell-grown A/Darwin/6/2021-like reference viruses representing the A(H3N2) component for the cell- and recombinant-based influenza vaccines.

                  Influenza B Viruses
                  • B/Victoria: 149 influenza B/Victoria-lineage virus were antigenically characterized by HI, and all were well-recognized (reacting at titers that were within 4-fold of the homologous virus titer) by ferret antisera to cell-grown B/Austria/1359417/2021-like reference viruses representing the B/Victoria component for the cell- and recombinant-based influenza vaccines.
                  • B/Yamagata: No influenza B/Yamagata-lineage viruses were available for antigenic characterization.

                  Assessment of Virus Susceptibility to Antiviral Medications

                  CDC assesses susceptibility of influenza viruses to the antiviral medications including the neuraminidase inhibitors (oseltamivir, zanamivir, and peramivir) and the PA endonuclease inhibitor baloxavir using next generation sequence analysis supplemented by laboratory assays. Information about antiviral susceptibility test methods can be found at U.S. Influenza Surveillance: Purpose and Methods | CDC.

                  Viruses collected in the U.S. since October 01, 2023, were tested for antiviral susceptibility as follows:
                  Neuraminidase Inhibitors Oseltamivir Viruses Tested 3,106 1,314 937 855
                  Reduced Inhibition 1 (0.03%) 1 (0.1%) 0 (0.0%) 0 (0.0%)
                  Highly Reduced Inhibition 2 (0.1%) 2 (0.2%) 0 (0.0%) 0 (0.0%)
                  Peramivir Viruses Tested 3,106 1,314 937 855
                  Reduced Inhibition 0 (0.0%) 0 (0.0%) 0 (0.0%) 0 (0.0%)
                  Highly Reduced Inhibition 2 (0.1%) 2 (0.2%) 0 (0.0%) 0 (0.0%)
                  Zanamivir Viruses Tested 3,106 1,314 937 855
                  Reduced Inhibition 0 (0.0%) 0 (0.0%) 0 (0.0%) 0 (0.0%)
                  Highly Reduced Inhibition 0 (0.0%) 0 (0.0%) 0 (0.0%) 0 (0.0%)
                  PA Cap-Dependent Endonuclease Inhibitor Baloxavir Viruses Tested 3,018 1,275 915 828
                  Decreased Susceptibility 1 (0.05%) 0 (0.0%) 1 (0.1%) 0 (0.0%)
                  Two A(H1N1)pdm09 viruses had NA-H275Y amino acid substitution and showed highly reduced inhibition by oseltamivir and peramivir. One (H1N1)pdm09 virus had NA-I223V and NA-S247N amino acid substitutions and showed reduced inhibition by oseltamivir. One A(H3N2) virus had PA-I38T amino acid substitution and showed reduced susceptibility to baloxavir.

                  High levels of resistance to the adamantanes (amantadine and rimantadine) persist among influenza A(H1N1)pdm09 and influenza A(H3N2) viruses (the adamantanes are not effective against influenza B viruses). Therefore, use of these antivirals for treatment and prevention of influenza A virus infection is not recommended and data from adamantane resistance testing are not presented. Outpatient Respiratory Illness Surveillance


                  The U.S. Outpatient Influenza-like Illness Surveillance Network (ILINet) monitors outpatient visits for respiratory illness referred to as influenza-like illness [ILI (fever plus cough or sore throat)], not laboratory-confirmed influenza and will therefore capture respiratory illness visits due to infection with pathogens that can present with similar symptoms, including influenza viruses, SARS-CoV-2, and RSV. It is important to evaluate syndromic surveillance data, including that from ILINet, in the context of other sources of surveillance data to obtain a more complete and accurate picture of influenza, SARS-CoV-2, and other respiratory virus activity. CDC is providing integrated information about COVID-19, influenza, and RSV activity on a website that is updated weekly. Information about other respiratory virus activity can be found on CDC’s National Respiratory and Enteric Virus Surveillance System (NREVSS) website. Outpatient Respiratory Illness Visits


                  Nationally, during Week 12, 3.1% of patient visits reported through ILINet were due to respiratory illness that included fever plus a cough or sore throat, also referred to as ILI. This has decreased (change of >0.1 percentage points) for the fourth consecutive week but remains above the national baseline. The percentage of visits for ILI remained stable in regions 2 and 9 and decreased in all other regions in Week 12 compared to Week 11. Regions 2, 4, 6 and 8 are below their baseline, and regions 1, 3, 5, 7, 9, and 10 are at or above their respective baselines. Multiple respiratory viruses are co-circulating, and the relative contribution of influenza virus infection to ILI varies by location.

                  Outpatient Respiratory Illness Visits by Age Group


                  About 70% of ILINet participants provide both the number of patient visits for respiratory illness and the total number of patient visits for the week broken out by age group. Data from this subset of providers are used to calculate the percentages of patient visits for respiratory illness by age group.

                  The percentage of visits for respiratory illness reported in ILINet decreased in the 0-4 years, 5-24 years, and 25-49 years age groups, and remained stable in the 50-64 years and 65+ years age groups in Week 12 compared to Week 11.

                  Outpatient Respiratory Illness Activity Map


                  Data collected in ILINet are used to produce a measure of ILI activity* by state/jurisdiction and Core Based Statistical Areas (CBSA).
                  Week 12
                  (Week ending
                  Mar. 23, 2024)
                  Week 11
                  (Week ending
                  Mar. 16, 2024)
                  Week 12
                  (Week ending
                  Mar. 23, 2024)
                  Week 11
                  (Week ending
                  Mar. 16, 2024)
                  Very High 0 1 2 4
                  High 9 9 25 44
                  Moderate 4 12 53 72
                  Low 20 19 158 188
                  Minimal 22 14 463 393
                  Insufficient Data 0 0 228 228


                  *Data collected in ILINet may disproportionally represent certain populations within a jurisdiction or CBSA, and therefore, may not accurately depict the full picture of influenza activity for the entire jurisdiction or CBSA. Differences in the data presented here by CDC and independently by some health departments likely represent differing levels of data completeness with data presented by the health department likely being the more complete.

                  Additional information about medically attended visits for ILI for current and past seasons:
                  Surveillance Methods | FluView Interactive: National, Regional, and State Data or ILI Activity Map Hospitalization Surveillance

                  FluSurv-NET


                  The Influenza Hospitalization Surveillance Network (FluSurv-NET) conducts population-based surveillance for laboratory-confirmed influenza-related hospitalizations in select counties in 14 states and represents approximately 9% of the U.S. population. FluSurv-NET hospitalization data are preliminary. As data are received each week, prior case counts and rates are updated accordingly.

                  A total of 22,080 laboratory-confirmed influenza-associated hospitalizations were reported by FluSurv-NET sites between October 1, 2023, and March 23, 2024. The weekly hospitalization rate observed in Week 12 was 1.4 per 100,000 population. The peak weekly hospitalization rate was observed during Week 52 and is the third highest peak weekly rate observed during all seasons going back to 2010-2011 following the 2014-2015 and 2017-2018 seasons. The overall cumulative hospitalization rate for the season was 72.2 per 100,000 population. This cumulative hospitalization rate is the second highest cumulative hospitalization rate when compared against previous end-of-season rates for Week 12, and it is the second highest cumulative in-season hospitalization rate observed in Week 12, following the 2017-2018 season (96.1). Cumulative in-season hospitalization rates observed in Week 12 from 2010-2011 through 2022-2023 ranged from 0.7 to 67.3.

                  When examining rates by age, the highest cumulative hospitalization rate per 100,000 population was among adults aged 65 years and older (196.9), followed by adults aged 50-64 years (86.1) and children aged 0-4 years (75.3). When examining age-adjusted rates by race and ethnicity, the highest rate of hospitalization per 100,000 population was among non-Hispanic Black persons (135.0), followed by non-Hispanic American Indian or Alaska Native persons (101.5), Hispanic persons (65.6), non-Hispanic White persons (55.6), and non-Hispanic Asian/Pacific Islander persons (37.8).

                  Among 22,080 hospitalizations, 18,898 (85.6%) were associated with influenza A virus, 3,028 (13.7%) with influenza B virus, 45 (0.2%) with influenza A virus and influenza B virus co-infection, and 109 (0.5%) with influenza virus for which the type was not determined. Among those with influenza A subtype information, 3,173 (71.5%) were A(H1N1) pdm09 and 1,258 (28.4%) were A(H3N2).

                  Among 2,638 hospitalized adults with information on underlying medical conditions, 95.4% had at least one reported underlying medical condition, the most commonly reported were hypertension, cardiovascular disease, obesity, and metabolic disease. Among 1,276 hospitalized women of childbearing age (15-49 years) with information on pregnancy status, 22.6% were pregnant. Among 810 hospitalized children with information on underlying medical conditions, 69.0% had at least one reported underlying medical condition; the most commonly reported was asthma, followed by obesity and neurologic disease.


                  In these figures, cumulative and weekly rates for all seasons prior to the 2023-2024 season reflect end-of-season rates. For the 2023-2024 season, rates for recent hospitals admissions are subject to reporting delays. As hospitalization data are reviewed each week, prior case counts and rates are updated accordingly.

                  Additional FluSurv-NET hospitalization surveillance information for current and past seasons and additional age groups:
                  Surveillance Methods |FluView Interactive: Rates by Age, Sex, and Race/Ethnicity or Data on Patient Characteristics | RESP-NET Interactive National Healthcare Safety Network (NHSN) Hospitalization Surveillance


                  Hospitals report to NHSN the weekly number of patients admitted with laboratory-confirmed influenza. During Week 12, 5,738 patients with laboratory-confirmed influenza were admitted to a hospital. Nationally and in regions 1, 2, 3, 4, 5, 6, 7, 8, and 9, the number of patients admitted to a hospital with laboratory-confirmed influenza for Week 12 decreased (change of >5%) compared to Week 11. The number of hospitalizations with laboratory-confirmed influenza increased slightly in region 10.


                  Additional NHSN Hospitalization Surveillance information:
                  Surveillance Methods | Additional Data | FluView Interactive Mortality Surveillance

                  National Center for Health Statistics (NCHS) Mortality Surveillance


                  Based on NCHS mortality surveillance data available on March 28, 2024, 0.5% of the deaths that occurred during the week ending March 23, 2024 (Week 12), were due to influenza. This percentage remained stable (< 0.1 percentage point change) compared to Week 11. The data presented are preliminary and may change as more data are received and processed.


                  Additional pneumonia, influenza and COVID-19 mortality surveillance information for current and past seasons:
                  Surveillance Methods | FluView Interactive Influenza-Associated Pediatric Mortality


                  Five influenza-associated pediatric deaths occurring during the 2023-2024 season were reported to CDC during Week 12. The deaths occurred during week 52 of 2023 (the week ending December 30, 2023) and during weeks 2 and 10 of 2024 (the weeks ending January 13, 2024, and March 9, 2024). Three deaths were associated with influenza A viruses and two deaths were associated with influenza B viruses. Two of the influenza A viruses had subtyping performed; one was an A(H1N1) virus and one was an A(H3) virus. Neither of the influenza B viruses had lineage determined.


                  Additional pediatric mortality surveillance information for current and past seasons:
                  Surveillance Methods | FluView Interactive Trend Indicators


                  Increasing:
                  Decreasing:
                  Stable: Indicators Status by System


                  Clinical Labs: Up or down arrows indicate a change of greater than or equal to 0.5 percentage points in the percent of specimens positive for influenza compared to the previous week.
                  Outpatient Respiratory Illness (ILINet): Up or down arrows indicate a change of greater than 0.1 percentage points in the percent of visits due to respiratory illness (ILI) compared to the previous week.
                  NHSN Hospitalizations: Up or down arrows indicate change of greater than or equal to 5% of the number of patients admitted with laboratory-confirmed influenza compared to the previous week.
                  NCHS Mortality: Up or down arrows indicate change of greater than 0.1 percentage points of the percent of deaths due to influenza compared to the previous week. Reference Footnotes


                  1U.S. Influenza Surveillance: Purpose and Methods (2023 Oct). Centers for Disease Control and Prevention. https://www.cdc.gov/flu/weekly/overview.htm#ILINet.

                  2Grohskopf LA, Blanton LH, Ferdinands JM, Chung JR, Broder KR, Talbot HK. Prevention and Control of Seasonal Influenza with Vaccines: Recommendations of the Advisory Committee on Immunization Practices — United States, 2023–24 Influenza Season. MMWR Recomm Rep 2023;72(No. RR-2):1–25. DOI: http://dx.doi.org/10.15585/mmwr.rr7202a1

                  3Influenza Antiviral Medications: Summary for Clinicians (2023 Sept). Centers for Disease Control and Prevention. https://www.cdc.gov/flu/professional...clinicians.htm.

                  Additional National and International Influenza Surveillance Information


                  FluView Interactive: FluView includes enhanced web-based interactive applications that can provide dynamic visuals of the influenza data collected and analyzed by CDC. These FluView Interactive applications allow people to create customized, visual interpretations of influenza data, as well as make comparisons across flu seasons, regions, age groups and a variety of other demographics.

                  National Institute for Occupational Safety and Health: Monthly surveillance data on the prevalence of health-related workplace absenteeism among full-time workers in the United States are available from NIOSH.
                  https://www.cdc.gov/flu/weekly/index.htm
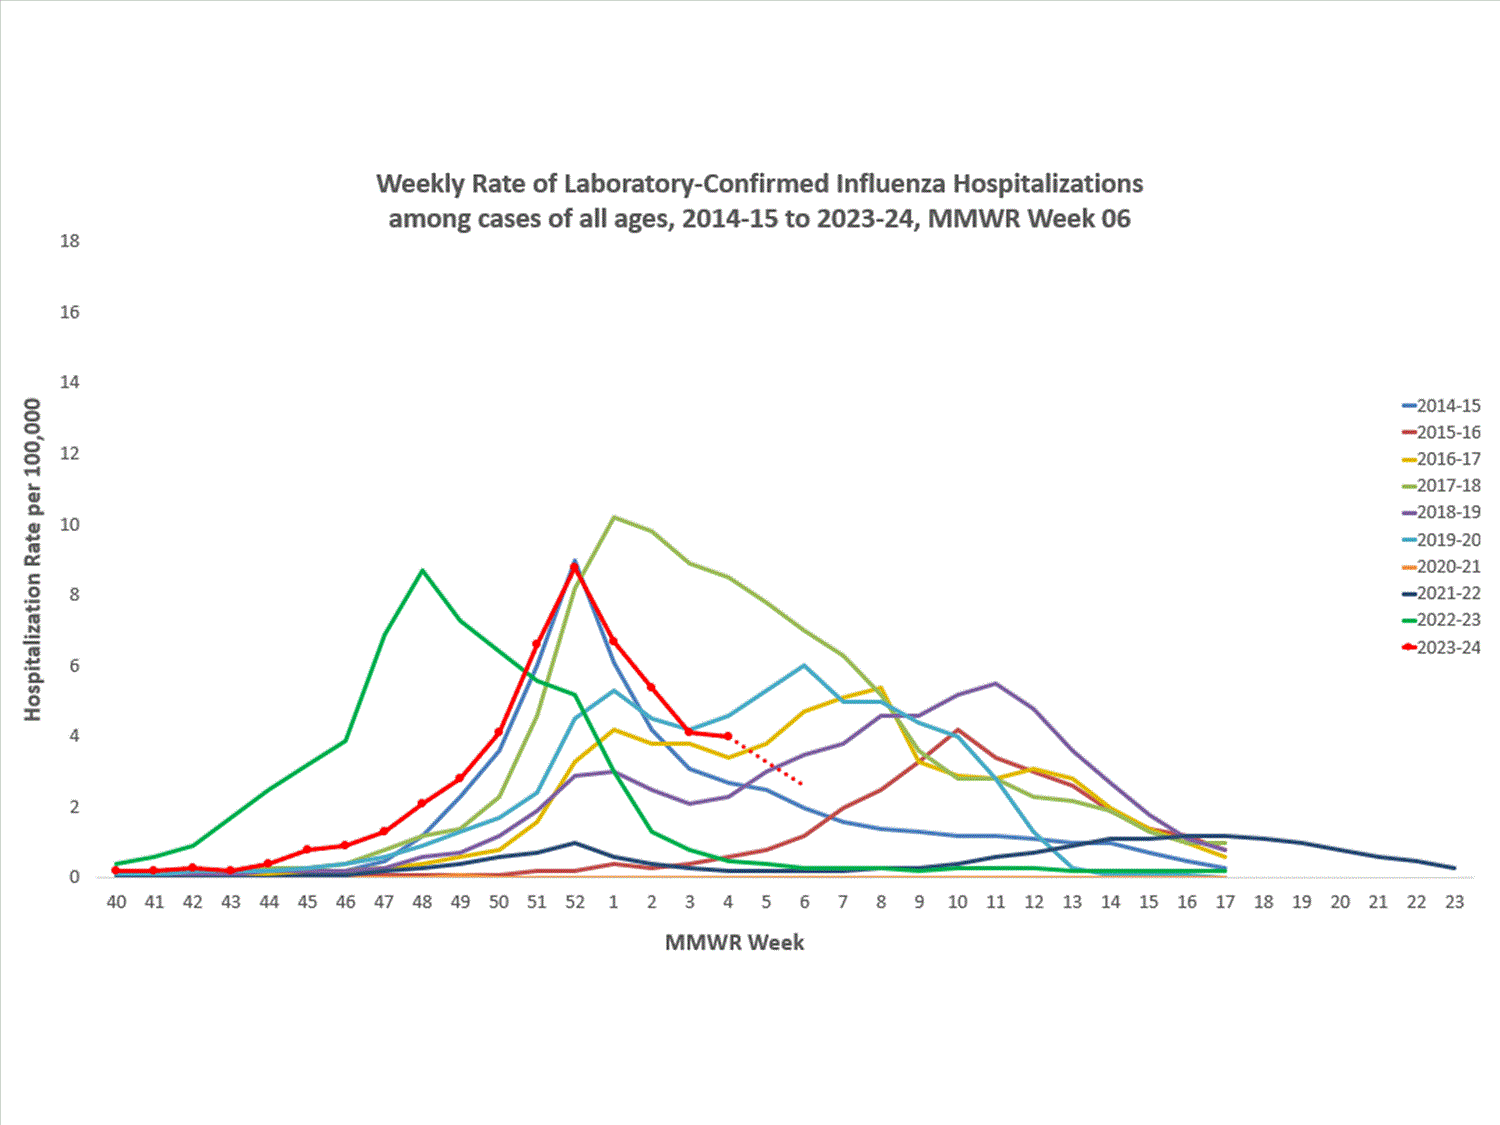
                  Comment


                  • #24
                    Weekly U.S. Influenza Surveillance Report


                    Print
                    Updated April 5, 2024

                    Key Updates for Week 13, ending March 30, 2024

                    Seasonal influenza activity remains elevated nationally but is decreasing. Viruses


                    Clinical Lab 9.1%

                    (Trend )


                    positive for influenza
                    this week


                    Public Health Lab
                    Influenza A(H1N1)pdm09, A(H3N2), and B viruses were all co-circulating this week.

                    Virus Characterization
                    Genetic and antigenic characterization and antiviral susceptibility are summarized in this report. Illness


                    Outpatient Respiratory Illness 3.0%

                    (Trend )


                    of visits to a health care provider this week were for respiratory illness
                    (above baseline).


                    Outpatient Respiratory Illness: Activity Map
                    This week 5 jurisdictions experienced moderate activity and 6 jurisdictions experienced high activity.

                    FluSurv-NET 74.2 per 100,000


                    cumulative hospitalization rate.

                    NHSN Hospitalizations 5,299 (Trend )


                    patients admitted to hospitals with influenza this week.

                    NCHS Mortality 0.5%

                    (Trend )


                    of deaths attributed to influenza this week.

                    Pediatric Deaths 7


                    influenza-associated deaths were reported this week for a total of 133 deaths this season.

                    All data are preliminary and may change as more reports are received.

                    Directional arrows indicate changes between the current week and the previous week. Additional information on the arrows can be found at the bottom of this page.

                    A description of the CDC influenza surveillance system, including methodology and detailed descriptions of each data component is available on the surveillance methods page.

                    Additional information on the current and previous influenza seasons for each surveillance component are available on FluView Interactive.

                    Key Points
                    • Seasonal influenza activity remains elevated but is decreasing nationally.
                    • Nationally, percent positivity for both influenza A and B decreased compared to last week.
                    • One human infection with a highly pathogenic avian influenza (HPAI) A(H5N1) virus was reported by the Texas Department of Health.
                    • Nationally, outpatient respiratory illness declined but remains above baseline.1 Regions 2, 4, 6, 8, 9, and 10 are below their baselines, while all other HHS regions remain at or above their region-specific baselines.
                    • Nationally, the number of weekly flu hospital admissions has been decreasing since January.
                    • During Week 13, of the 329 viruses reported by public health laboratories, 201 (61.1%) were influenza A and 128 (38.9%) were influenza B. Of the 138 influenza A viruses subtyped during Week 13, 69 (50.0%) were influenza A(H1N1)pdm09 and 69 (50.0%) were A(H3N2).
                    • Seven influenza-associated pediatric deaths occurring during the 2023-2024 season were reported to CDC during Week 13, bringing the season total to 133 pediatric deaths.
                    • CDC estimates that there have been at least 32 million illnesses, 360,000 hospitalizations, and 22,000 deaths from flu so far this season.
                    • CDC recommends that everyone 6 months and older get an annual flu vaccine as long as influenza viruses are spreading.2 Vaccination can still provide benefit this season.
                    • There also are prescription flu antiviral drugs that can treat flu illness; those should be started as early as possible and are especially important for higher risk patients.3
                    • Flu viruses are among several viruses contributing to respiratory disease activity. CDC is providing updated, integrated information about COVID-19, flu, and RSV activity on a weekly basis.
                    U.S. Virologic Surveillance


                    Nationally, the percentage of respiratory specimens testing positive for influenza in clinical laboratories decreased (change of >0.5 percentage points) compared to the previous week. Regions 1, 3, 4, 5, 6, 8, 9, and 10 decreased in percent positivity; region 7 remained stable, and region 2 reported an increase during Week 13 compared to Week 12. The regions with the highest percent positivity were regions 7 (19.1%), 5 (14.0%), and 2 (10.8%). Nationally, influenza A(H1N1)pdm09, A(H3N2), and B/Victoria viruses are all co-circulating. However, the distribution of circulating viruses varies by region. For regional and state level data and age group distribution, please visit FluView Interactive. Viruses known to be associated with recent receipt of live attenuated influenza vaccine (LAIV) or found upon further testing to be a vaccine virus are not included, as they are not circulating influenza viruses. Clinical Laboratories


                    The results of tests performed by clinical laboratories nationwide are summarized below. Data from clinical laboratories (the percentage of specimens tested that are positive for influenza virus) are used to monitor whether influenza activity is increasing or decreasing.
                    No. of specimens tested 68,989 2,773,210
                    No. of positive specimens (%) 6,293 (9.1%) 320,162 (11.5%)
                    Positive specimens by type
                    Influenza A 3,081 (49.0%) 224,430 (70.1%)
                    Influenza B 3,212 (51.0%) 95,722 (29.9%)
                    Public Health Laboratories


                    The results of tests performed by public health laboratories nationwide are summarized below. Data from public health laboratories are used to monitor the proportion of circulating influenza viruses that belong to each influenza subtype/lineage.
                    No. of specimens tested 1,785 96,345
                    No. of positive specimens 329 31,394
                    Positive specimens by type/subtype
                    Influenza A 201 (61.1%) 24,500 (78%)
                    Subtyping Performed 138 (68.7%) 20,284 (82.8%)
                    (H1N1)pdm09 69 (50%) 14,449 (71.2%)
                    H3N2 69 (50%) 5,835 (28.8%)
                    H3N2v 0 (0.0%) 0 (0.0%)
                    Subtyping not performed 63 (31.3%) 4,216 (17.2%)
                    Influenza B 128 (38.9%) 6,894 (22%)
                    Lineage testing performed 86 (67.2%) 5,854 (84.9%)
                    Yamagata lineage 0 (0.0%) 0 (0.0%)
                    Victoria lineage 86 (100.0%) 5,854 (100.0%)
                    Lineage not performed 42 (32.8%) 1,040 (15.1%)


                    Additional virologic surveillance information for current and past seasons:
                    Surveillance Methods | FluView Interactive: National, Regional, and State Data or Age Data Novel Influenza A Virus:


                    A human infection with highly pathogenic avian influenza (HPAI) A(H5N1) virus was reported by the Texas Department of State Health Services and confirmed by CDC on March 30, 2024.

                    A patient aged >18 years in Texas developed conjunctivitis on approximately March 27, 2024, while working at a commercial dairy cattle farm. HPAI A(H5N1) virus has been recently detected in dairy cattle, poultry and wild birds in Texas. Respiratory and conjunctival specimens were collected on March 28, 2024, and tested at the Texas Tech University Bioterrorism Response Laboratory that same day. RT-PCR analysis indicated that both specimens were presumptive positive for influenza A(H5) virus. The specimens were then sent to CDC for further testing. They were received and tested at CDC on March 30, 2024, and confirmed as HPAI A(H5N1) virus clade 2.3.4.4b using diagnostic RT-PCR and sequencing. The patient did not report symptoms other than conjunctivitis, was not hospitalized, and is recovering. Starting on March 29, 2024, the patient was recommended to isolate and was provided with influenza antivirals per CDC guidance (https://www.cdc.gov/flu/avianflu/cli...g-patients.htm).

                    Public health officials are conducting surveillance activities in the area in response to this detection. Household contacts of the patient have not reported illness and have been provided influenza antiviral prophylaxis in accordance with CDC recommendations. No additional cases of human infection with HPAI A(H5N1) associated with this case and no human-to-human transmission of HPAI A(H5N1) virus have been identified.

                    This is the second person to test positive for HPAI A(H5N1) virus in the United States. The first was reported in April 2022 in Colorado.

                    Currently in the United States, HPAI A(H5N1) virus detections among wild birds are widespread, there are sporadic outbreaks among poultry and backyard flocks, and sporadic infections in wild mammals have been reported by United States Department of Agriculture (USDA) Animal Plant Health Inspection Service (APHIS). On March 25, USDA reported the first detections of H5N1 in dairy cattle in Texas and Kansas. Since then, additional detections in dairy cattle have been reported from Idaho, Michigan, New Mexico, and Ohio. USDA is continuing to monitor and test samples collected from other farms where cattle are displaying similar symptoms.

                    CDC recommends that state and local public health departments monitor people who were exposed to birds or other animals (including livestock) suspected to be infected with avian influenza viruses for onset of signs and symptoms until 10 days after their last exposure and that people who develop signs or symptoms of respiratory illness and/or conjunctivitis be tested for influenza. During February 9, 2022 — March 29, 2024, over 8,000 people were actively monitored following HPAI exposure.

                    Information about avian influenza is available at https://www.cdc.gov/flu/avianflu/index.htm.

                    Interim recommendations for Prevention, Monitoring, and Public Health Investigations are available at https://www.cdc.gov/flu/avianflu/hpa...endations.html.

                    The latest case reports on avian influenza outbreaks in wild birds, commercial poultry; backyard or hobbyist flocks; and mammals in the United States are available from the USDA at https://www.aphis.usda.gov/aphis/our...enza/2022-hpai.

                    Additional information regarding human infections with novel influenza A viruses:

                    Surveillance Methods | FluView Interactive Influenza Virus Characterization


                    CDC performs genetic and antigenic characterization of U.S. viruses submitted from state and local public health laboratories according to the Right Size Roadmap submission guidance. These data are used to compare how similar the currently circulating influenza viruses are to the reference viruses representing viruses contained in the current influenza vaccines. The data are also used to monitor evolutionary changes that continually occur in influenza viruses circulating in humans. CDC also tests susceptibility of circulating influenza viruses to antiviral medications including the neuraminidase inhibitors (oseltamivir, zanamivir, and peramivir) and the PA endonuclease inhibitor baloxavir.

                    CDC has genetically characterized 3,263 influenza viruses collected since October 1, 2023.
                    A/H1 1,357
                    6B.1A.5a 1,357 (100%) 2a 333 (24.5%)
                    2a.1 1,024 (75.5%)
                    A/H3 1,011
                    3C.2a1b.2a 1,011 (100%) 2a.1b 1 (0.1%)
                    2a.3a 1 (0.1%)
                    2a.3a.1 1,008 (99.7%)
                    2b 1 (0.1%)
                    B/Victoria 895
                    V1A 895 (100%) 3a.2 895 (100%)
                    B/Yamagata 0
                    Y3 0 Y3 0 (0%)
                    CDC antigenically characterizes influenza viruses by hemagglutination inhibition (HI) (H1N1pdm09, H3N2, B/Victoria, and B/Yamagata viruses) or neutralization-based HINT (H3N2 viruses) using antisera that ferrets make after being infected with reference viruses representing the 2023-2024 Northern Hemisphere recommended cell or recombinant-based vaccine viruses. Antigenic differences between viruses are determined by comparing how well the antibodies made against the vaccine reference viruses recognize the circulating viruses that have been grown in cell culture. Ferret antisera are useful because antibodies raised against a particular virus can often recognize small changes in the surface proteins of other viruses. In HI assays, viruses with similar antigenic properties have antibody titer differences of less than or equal to 4-fold when compared to the reference (vaccine) virus. In HINT, viruses with similar antigenic properties have antibody neutralization titer differences of less than or equal to 8-fold. Viruses selected for antigenic characterization are a subset representing the genetic changes in the surface proteins seen in genetically characterized viruses.

                    Influenza A Viruses
                    • A (H1N1)pdm09: 217 A(H1N1)pdm09 viruses were antigenically characterized by HI, and all were well-recognized (reacting at titers that were within 4-fold of the homologous virus titer) by ferret antisera to cell-grown A/Wisconsin/67/2022-like reference viruses representing the A(H1N1)pdm09 component for the cell- and recombinant-based influenza vaccines.
                    • A (H3N2): 249 A(H3N2) viruses were antigenically characterized by HI or HINT, and 246 (99%) were well-recognized (reacting at titers that were within 4-fold of the homologous virus titer in HI or reacting at titers that were less than or equal to 8-fold of the homologous virus in HINT) by ferret antisera to cell-grown A/Darwin/6/2021-like reference viruses representing the A(H3N2) component for the cell- and recombinant-based influenza vaccines.

                    Influenza B Viruses
                    • B/Victoria: 180 influenza B/Victoria-lineage virus were antigenically characterized by HI, and all were well-recognized (reacting at titers that were within 4-fold of the homologous virus titer) by ferret antisera to cell-grown B/Austria/1359417/2021-like reference viruses representing the B/Victoria component for the cell- and recombinant-based influenza vaccines.
                    • B/Yamagata: No influenza B/Yamagata-lineage viruses were available for antigenic characterization.

                    Assessment of Virus Susceptibility to Antiviral Medications

                    CDC assesses susceptibility of influenza viruses to the antiviral medications including the neuraminidase inhibitors (oseltamivir, zanamivir, and peramivir) and the PA endonuclease inhibitor baloxavir using next generation sequence analysis supplemented by laboratory assays. Information about antiviral susceptibility test methods can be found at U.S. Influenza Surveillance: Purpose and Methods | CDC.

                    Viruses collected in the U.S. since October 01, 2023, were tested for antiviral susceptibility as follows:
                    Neuraminidase Inhibitors Oseltamivir Viruses Tested 3,255 1,358 1,008 889
                    Reduced Inhibition 1 (0.03%) 1 (0.07%) 0 (0.0%) 0 (0.0%)
                    Highly Reduced Inhibition 2 (0.06%) 2 (0.1%) 0 (0.0%) 0 (0.0%)
                    Peramivir Viruses Tested 3,255 1,358 1,008 889
                    Reduced Inhibition 0 (0.0%) 0 (0.0%) 0 (0.0%) 0 (0.0%)
                    Highly Reduced Inhibition 2 (0.06%) 2 (0.1%) 0 (0.0%) 0 (0.0%)
                    Zanamivir Viruses Tested 3,255 1,358 1,008 889
                    Reduced Inhibition 0 (0.0%) 0 (0.0%) 0 (0.0%) 0 (0.0%)
                    Highly Reduced Inhibition 0 (0.0%) 0 (0.0%) 0 (0.0%) 0 (0.0%)
                    PA Cap-Dependent Endonuclease Inhibitor Baloxavir Viruses Tested 3,163 1,319 982 862
                    Decreased Susceptibility 1 (0.03%) 0 (0.0%) 1 (0.1%) 0 (0.0%)
                    Two A(H1N1)pdm09 viruses had NA-H275Y amino acid substitution and showed highly reduced inhibition by oseltamivir and peramivir. One (H1N1)pdm09 virus had NA-I223V and NA-S247N amino acid substitutions and showed reduced inhibition by oseltamivir. One A(H3N2) virus had PA-I38T amino acid substitution and showed reduced susceptibility to baloxavir.

                    High levels of resistance to the adamantanes (amantadine and rimantadine) persist among influenza A(H1N1)pdm09 and influenza A(H3N2) viruses (the adamantanes are not effective against influenza B viruses). Therefore, use of these antivirals for treatment and prevention of influenza A virus infection is not recommended and data from adamantane resistance testing are not presented. Outpatient Respiratory Illness Surveillance


                    The U.S. Outpatient Influenza-like Illness Surveillance Network (ILINet) monitors outpatient visits for respiratory illness referred to as influenza-like illness [ILI (fever plus cough or sore throat)], not laboratory-confirmed influenza and will therefore capture respiratory illness visits due to infection with pathogens that can present with similar symptoms, including influenza viruses, SARS-CoV-2, and RSV. It is important to evaluate syndromic surveillance data, including that from ILINet, in the context of other sources of surveillance data to obtain a more complete and accurate picture of influenza, SARS-CoV-2, and other respiratory virus activity. CDC is providing integrated information about COVID-19, influenza, and RSV activity on a website that is updated weekly. Information about other respiratory virus activity can be found on CDC’s National Respiratory and Enteric Virus Surveillance System (NREVSS) website. Outpatient Respiratory Illness Visits


                    Nationally, during Week 13, 3.0% of patient visits reported through ILINet were due to respiratory illness that included fever plus a cough or sore throat, also referred to as ILI. This has remained stable (change of ≤ 0.1 percentage points) since Week 12 and remains above the national baseline. The percentage of visits for ILI decreased in regions 2, 3, 8, and 10, and remained stable in all other regions in Week 13 compared to Week 12. Regions 1, 3, 5, and 7 are at or above their baseline, and all other regions are below their respective baselines. Multiple respiratory viruses are co-circulating, and the relative contribution of influenza virus infection to ILI varies by location.

                    Outpatient Respiratory Illness Visits by Age Group


                    About 70% of ILINet participants provide both the number of patient visits for respiratory illness and the total number of patient visits for the week broken out by age group. Data from this subset of providers are used to calculate the percentages of patient visits for respiratory illness by age group.

                    The percentage of visits for respiratory illness reported in ILINet decreased in the 0-4 years and 5-24 years age groups, and remained stable in the 25-49 years, 50-64 years, and the 65+ years age groups in Week 13 compared to Week 12.

                    Outpatient Respiratory Illness Activity Map


                    Data collected in ILINet are used to produce a measure of ILI activity* by state/jurisdiction and Core Based Statistical Areas (CBSA).
                    Week 13
                    (Week ending
                    Mar. 30, 2024)
                    Week 12
                    (Week ending
                    Mar. 23, 2024)
                    Week 13
                    (Week ending
                    Mar. 30, 2024)
                    Week 12
                    (Week ending
                    Mar. 23, 2024)
                    Very High 0 0 1 2
                    High 6 10 20 28
                    Moderate 5 3 53 52
                    Low 21 19 138 160
                    Minimal 23 23 480 466
                    Insufficient Data 0 0 237 221


                    *Data collected in ILINet may disproportionally represent certain populations within a jurisdiction or CBSA, and therefore, may not accurately depict the full picture of influenza activity for the entire jurisdiction or CBSA. Differences in the data presented here by CDC and independently by some health departments likely represent differing levels of data completeness with data presented by the health department likely being the more complete.

                    Additional information about medically attended visits for ILI for current and past seasons:
                    Surveillance Methods | FluView Interactive: National, Regional, and State Data or ILI Activity Map Hospitalization Surveillance

                    FluSurv-NET


                    The Influenza Hospitalization Surveillance Network (FluSurv-NET) conducts population-based surveillance for laboratory-confirmed influenza-related hospitalizations in select counties in 14 states and represents approximately 9% of the U.S. population. FluSurv-NET hospitalization data are preliminary. As data are received each week, prior case counts and rates are updated accordingly.

                    A total of 22,684 laboratory-confirmed influenza-associated hospitalizations were reported by FluSurv-NET sites between October 1, 2023, and March 30, 2024. The weekly hospitalization rate observed in Week 13 was 1.3 per 100,000 population. The weekly hospitalization rate observed during Week 52 is the third highest peak weekly rate observed during all seasons going back to 2010-2011 following the 2014-2015 and 2017-2018 seasons. The overall cumulative hospitalization rate was 74.2 per 100,000 population. This cumulative hospitalization rate is the second highest cumulative hospitalization rate when compared against previous end-of-season rates for Week 13, and it is the second highest cumulative in-season hospitalization rate observed in Week 13, following the 2017-2018 season (99.9). Cumulative in-season hospitalization rates observed in Week 13 from 2010-2011 through 2022-2023 ranged from 0.7 to 67.9.

                    When examining rates by age, the highest cumulative hospitalization rate per 100,000 population was among adults aged 65 years and older (202.6), followed by adults aged 50-64 years (88.2) and children aged 0-4 years (76.5). When examining age-adjusted rates by race and ethnicity, the highest rate of hospitalization per 100,000 population was among non-Hispanic Black persons (138.4), followed by non-Hispanic American Indian or Alaska Native persons (102.7), Hispanic persons (69.3), non-Hispanic White persons (57.1), and non-Hispanic Asian/Pacific Islander persons (38.9).

                    Among 22,684 hospitalizations, 19,347 (85.3%) were associated with influenza A virus, 3,178 (14.0%) with influenza B virus, 43 (0.2%) with influenza A virus and influenza B virus co-infection, and 116 (0.5%) with influenza virus for which the type was not determined. Among those with influenza A subtype information, 3,249 (71.5%) were A(H1N1) pdm09 and 1,298 (28.5%) were A(H3N2).

                    Among 2,758 hospitalized adults with information on underlying medical conditions, 95.3% had at least one reported underlying medical condition, the most commonly reported were hypertension, cardiovascular disease, obesity, and metabolic disease. Among 1,316 hospitalized women of childbearing age (15-49 years) with information on pregnancy status, 22.6% were pregnant. Among 853 hospitalized children with information on underlying medical conditions, 69.2% had at least one reported underlying medical condition; the most commonly reported was asthma, followed by obesity and neurologic disease.


                    In these figures, cumulative and weekly rates for all seasons prior to the 2023-2024 season reflect end-of-season rates. For the 2023-2024 season, rates for recent hospitals admissions are subject to reporting delays. As hospitalization data are reviewed each week, prior case counts and rates are updated accordingly.

                    Additional FluSurv-NET hospitalization surveillance information for current and past seasons and additional age groups:
                    Surveillance Methods |FluView Interactive: Rates by Age, Sex, and Race/Ethnicity or Data on Patient Characteristics | RESP-NET Interactive National Healthcare Safety Network (NHSN) Hospitalization Surveillance


                    Hospitals report to NHSN the weekly number of patients admitted with laboratory-confirmed influenza. During Week 13, 5,299 patients with laboratory-confirmed influenza were admitted to a hospital. Nationally and in regions 1, 3, 4, 5, 6, 8, 9, and 10, the number of patients admitted to a hospital with laboratory-confirmed influenza for Week 13 decreased (change of >5%) compared to Week 12. The number of hospitalizations with laboratory-confirmed influenza remained stable in regions 2 and 7.


                    Additional NHSN Hospitalization Surveillance information:
                    Surveillance Methods | Additional Data | FluView Interactive Mortality Surveillance

                    National Center for Health Statistics (NCHS) Mortality Surveillance


                    Based on NCHS mortality surveillance data available on April 4, 2024, 0.5% of the deaths that occurred during the week ending March 30, 2024 (Week 13), were due to influenza. This percentage remained stable (< 0.1 percentage point change) compared to Week 12. The data presented are preliminary and may change as more data are received and processed.


                    Additional pneumonia, influenza and COVID-19 mortality surveillance information for current and past seasons:
                    Surveillance Methods | FluView Interactive Influenza-Associated Pediatric Mortality


                    Seven influenza-associated pediatric deaths occurring during the 2023-2024 season were reported to CDC during Week 13. The deaths occurred during weeks 2, 6, 12 and 13 (the weeks ending January 13, February 10, March 23, and March 30 of 2024, respectively). Two deaths were associated with influenza A viruses. One of the influenza A viruses had subtyping performed and it was an A(H1N1) virus. Five deaths were associated with influenza B viruses. Two of the influenza B viruses had lineage determined and both were B/Victoria viruses.


                    Additional pediatric mortality surveillance information for current and past seasons:
                    Surveillance Methods | FluView Interactive Trend Indicators


                    Increasing:
                    Decreasing:
                    Stable: Indicators Status by System


                    Clinical Labs: Up or down arrows indicate a change of greater than or equal to 0.5 percentage points in the percent of specimens positive for influenza compared to the previous week.
                    Outpatient Respiratory Illness (ILINet): Up or down arrows indicate a change of greater than 0.1 percentage points in the percent of visits due to respiratory illness (ILI) compared to the previous week.
                    NHSN Hospitalizations: Up or down arrows indicate change of greater than or equal to 5% of the number of patients admitted with laboratory-confirmed influenza compared to the previous week.
                    NCHS Mortality: Up or down arrows indicate change of greater than 0.1 percentage points of the percent of deaths due to influenza compared to the previous week. Reference Footnotes


                    1U.S. Influenza Surveillance: Purpose and Methods (2023 Oct). Centers for Disease Control and Prevention. https://www.cdc.gov/flu/weekly/overview.htm#ILINet.

                    2Grohskopf LA, Blanton LH, Ferdinands JM, Chung JR, Broder KR, Talbot HK. Prevention and Control of Seasonal Influenza with Vaccines: Recommendations of the Advisory Committee on Immunization Practices — United States, 2023–24 Influenza Season. MMWR Recomm Rep 2023;72(No. RR-2):1–25. DOI: http://dx.doi.org/10.15585/mmwr.rr7202a1

                    3Influenza Antiviral Medications: Summary for Clinicians (2023 Sept). Centers for Disease Control and Prevention. https://www.cdc.gov/flu/professional...clinicians.htm.

                    Additional National and International Influenza Surveillance Information


                    FluView Interactive: FluView includes enhanced web-based interactive applications that can provide dynamic visuals of the influenza data collected and analyzed by CDC. These FluView Interactive applications allow people to create customized, visual interpretations of influenza data, as well as make comparisons across flu seasons, regions, age groups and a variety of other demographics.

                    National Institute for Occupational Safety and Health: Monthly surveillance data on the prevalence of health-related workplace absenteeism among full-time workers in the United States are available from NIOSH.
                    https://www.cdc.gov/flu/weekly/index.htm
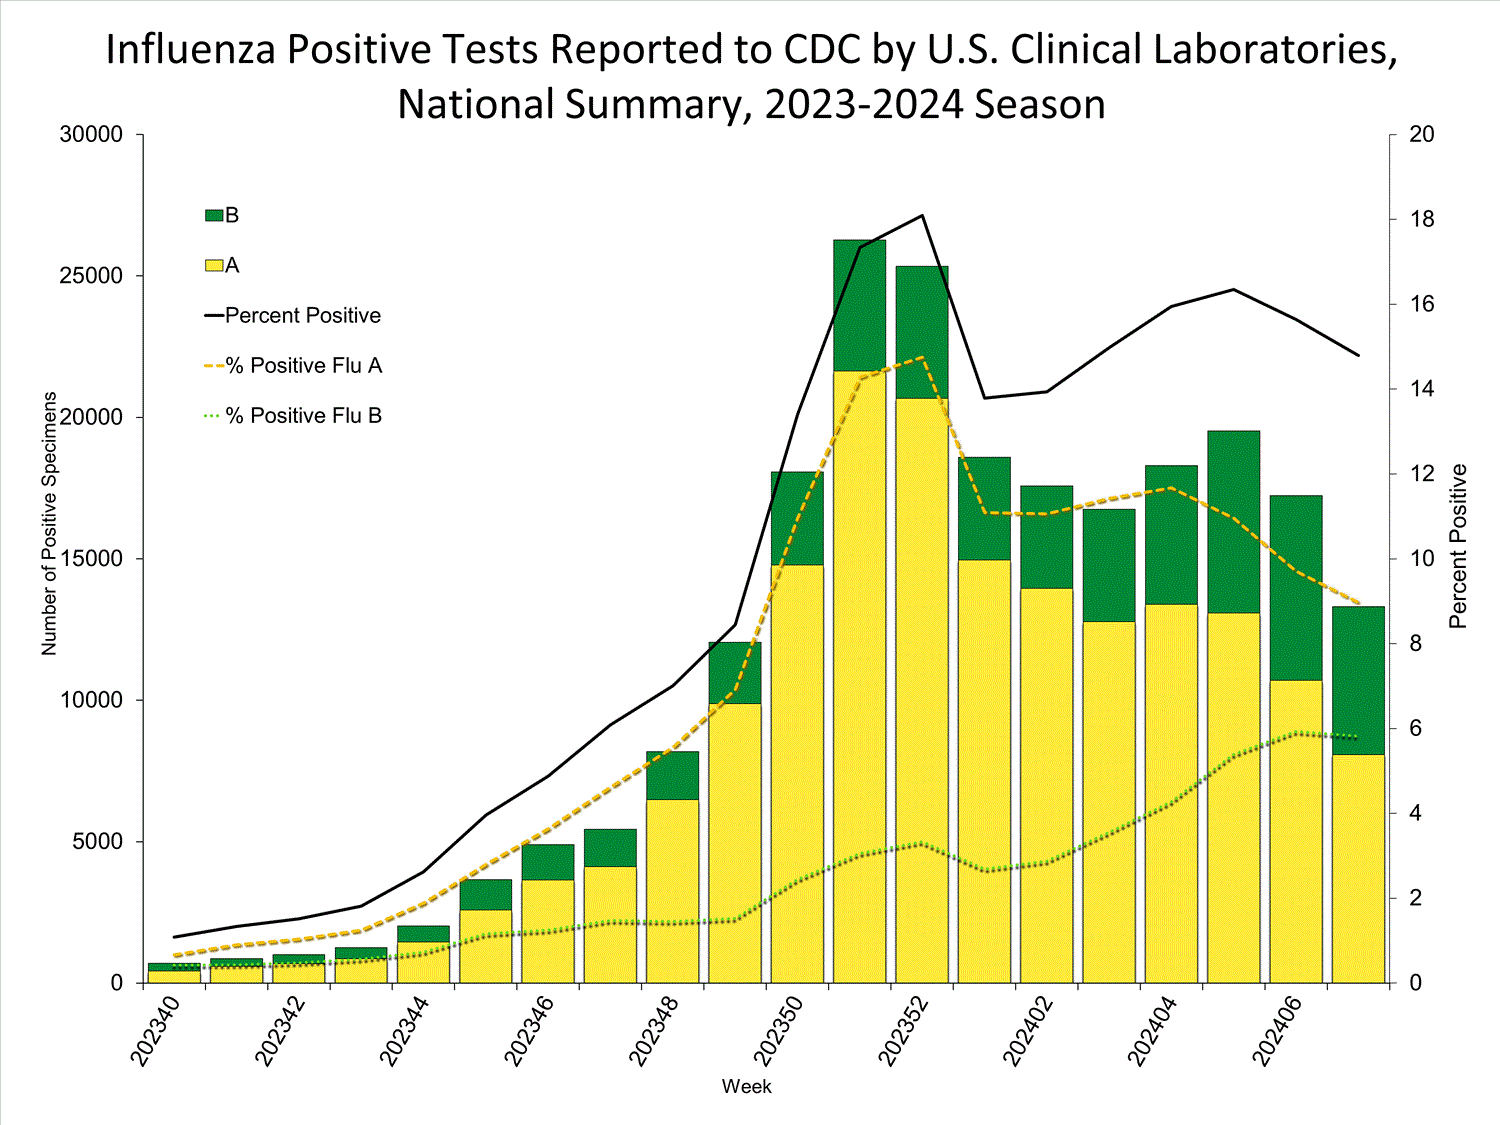
                    Comment


                    • #25
                      Weekly U.S. Influenza Surveillance Report


                      Print
                      Updated April 12, 2024

                      Key Updates for Week 14, ending April 6, 2024

                      Seasonal influenza activity remains elevated nationally but continues to decrease. Viruses


                      Clinical Lab 7.7%

                      (Trend )


                      positive for influenza
                      this week


                      Public Health Lab
                      Influenza A(H1N1)pdm09, A(H3N2), and B viruses were all co-circulating this week.

                      Virus Characterization
                      Genetic and antigenic characterization and antiviral susceptibility are summarized in this report. Illness


                      Outpatient Respiratory Illness 2.8%

                      (Trend )


                      of visits to a health care provider this week were for respiratory illness
                      (below baseline).


                      Outpatient Respiratory Illness: Activity Map
                      This week 7 jurisdictions experienced moderate activity and 1 jurisdictions experienced high activity.

                      FluSurv-NET 76.0 per 100,000


                      cumulative hospitalization rate.

                      NHSN Hospitalizations 4,825 (Trend )


                      patients admitted to hospitals with influenza this week.

                      NCHS Mortality 0.4%

                      (Trend )


                      of deaths attributed to influenza this week.

                      Pediatric Deaths 5


                      influenza-associated deaths were reported this week for a total of 138 deaths this season.

                      All data are preliminary and may change as more reports are received.

                      Directional arrows indicate changes between the current week and the previous week. Additional information on the arrows can be found at the bottom of this page.

                      A description of the CDC influenza surveillance system, including methodology and detailed descriptions of each data component is available on the surveillance methods page.

                      Additional information on the current and previous influenza seasons for each surveillance component are available on FluView Interactive.

                      Key Points
                      • Seasonal influenza activity remains elevated but continues to decrease nationally.
                      • Nationally, percent positivity for both influenza A and B decreased compared to last week.
                      • Nationally, outpatient respiratory illness declined and is below baseline for the first time since late October.1 Regions 2, 3, 4, 6, 8, 9, and 10 are below their baselines, while HHS regions 1, 5 and 7 remain above their region-specific baselines.
                      • Nationally, the number of weekly flu hospital admissions has been decreasing since January.
                      • During Week 14, of the 272 viruses reported by public health laboratories, 160 (58.8%) were influenza A and 112 (41.2%) were influenza B. Of the 104 influenza A viruses subtyped during Week 14, 45 (43.3%) were influenza A(H1N1)pdm09 and 59 (56.7%) were A(H3N2).
                      • Five influenza-associated pediatric deaths occurring during the 2023-2024 season were reported to CDC during Week 14, bringing the season total to 138 pediatric deaths.
                      • CDC estimates that there have been at least 33 million illnesses, 360,000 hospitalizations, and 23,000 deaths from flu so far this season.
                      • CDC recommends that everyone 6 months and older get an annual flu vaccine as long as influenza viruses are spreading.2 Vaccination can still provide benefit this season.
                      • There also are prescription flu antiviral drugs that can treat flu illness; those should be started as early as possible and are especially important for higher risk patients.3
                      • Flu viruses are among several viruses contributing to respiratory disease activity. CDC is providing updated, integrated information about COVID-19, flu, and RSV activity on a weekly basis.
                      U.S. Virologic Surveillance


                      Nationally, the percentage of respiratory specimens testing positive for influenza in clinical laboratories decreased (change of >0.5 percentage points) compared to the previous week. Regions 1, 2, 3, 5, 6, 8, and 10 decreased in percent positivity; regions 4 and 9 remained stable, and Region 7 reported a slight increase during Week 14 compared to Week 13. The regions with the highest percent positivity were regions 7 (17.6%), 5 (11.2%), and 1 (8.7%). Nationally, influenza A(H1N1)pdm09, A(H3N2), and B/Victoria viruses are all co-circulating. However, the distribution of circulating viruses varies by region. For regional and state level data and age group distribution, please visit FluView Interactive. Viruses known to be associated with recent receipt of live attenuated influenza vaccine (LAIV) or found upon further testing to be a vaccine virus are not included, as they are not circulating influenza viruses. Clinical Laboratories


                      The results of tests performed by clinical laboratories nationwide are summarized below. Data from clinical laboratories (the percentage of specimens tested that are positive for influenza virus) are used to monitor whether influenza activity is increasing or decreasing.
                      No. of specimens tested 66,199 2,837,222
                      No. of positive specimens (%) 5,111 (7.7%) 327,063 (11.5%)
                      Positive specimens by type
                      Influenza A 2,692 (52.7%) 228,076 (69.7%)
                      Influenza B 2,419 (47.3%) 98,977 (30.3%)
                      Public Health Laboratories


                      The results of tests performed by public health laboratories nationwide are summarized below. Data from public health laboratories are used to monitor the proportion of circulating influenza viruses that belong to each influenza subtype/lineage.
                      No. of specimens tested 1,117 98,281
                      No. of positive specimens 272 32,302
                      Positive specimens by type/subtype
                      Influenza A 160 (58.8%) 24,958 (77.3%)
                      Subtyping Performed 104 (65.0%) 20,711 (83.0%)
                      (H1N1)pdm09 45 (43.3%) 14,652 (70.7%)
                      H3N2 59 (56.7%) 6,059 (29.3%)
                      H3N2v 0 (0.0%) 0 (0.0%)
                      Subtyping not performed 56 (35.0%) 4,247 (17.0%)
                      Influenza B 112 (41.2%) 7,344 (22.7%)
                      Lineage testing performed 69 (61.6%) 6,140 (83.6%)
                      Yamagata lineage 0 (0.0%) 0 (0.0%)
                      Victoria lineage 69 (100.0%) 6,140 (100.0%)
                      Lineage not performed 43 (38.4%) 1,204 (16.4%)


                      Additional virologic surveillance information for current and past seasons:
                      Surveillance Methods | FluView Interactive: National, Regional, and State Data or Age Data Influenza Virus Characterization


                      CDC performs genetic and antigenic characterization of U.S. viruses submitted from state and local public health laboratories according to the Right Size Roadmap submission guidance. These data are used to compare how similar the currently circulating influenza viruses are to the reference viruses representing viruses contained in the current influenza vaccines. The data are also used to monitor evolutionary changes that continually occur in influenza viruses circulating in humans. CDC also tests susceptibility of circulating influenza viruses to antiviral medications including the neuraminidase inhibitors (oseltamivir, zanamivir, and peramivir) and the PA endonuclease inhibitor baloxavir.

                      CDC has genetically characterized 3,369 influenza viruses collected since October 1, 2023.
                      A/H1 1,378
                      6B.1A.5a 1,378 (100%) 2a 339 (24.6%)
                      2a.1 1,039 (75.4%)
                      A/H3 1,068
                      3C.2a1b.2a 1,068 (100%) 2a.1b 1 (0.1%)
                      2a.3a 1 (0.1%)
                      2a.3a.1 1,065 (99.7%)
                      2b 1 (0.1%)
                      B/Victoria 923
                      V1A 923 (100%) 3a.2 923 (100%)
                      B/Yamagata 0
                      Y3 0 Y3 0 (0%)
                      CDC antigenically characterizes influenza viruses by hemagglutination inhibition (HI) (H1N1pdm09, H3N2, B/Victoria, and B/Yamagata viruses) or neutralization-based HINT (H3N2 viruses) using antisera that ferrets make after being infected with reference viruses representing the 2023-2024 Northern Hemisphere recommended cell or recombinant-based vaccine viruses. Antigenic differences between viruses are determined by comparing how well the antibodies made against the vaccine reference viruses recognize the circulating viruses that have been grown in cell culture. Ferret antisera are useful because antibodies raised against a particular virus can often recognize small changes in the surface proteins of other viruses. In HI assays, viruses with similar antigenic properties have antibody titer differences of less than or equal to 4-fold when compared to the reference (vaccine) virus. In HINT, viruses with similar antigenic properties have antibody neutralization titer differences of less than or equal to 8-fold. Viruses selected for antigenic characterization are a subset representing the genetic changes in the surface proteins seen in genetically characterized viruses.

                      Influenza A Viruses
                      • A (H1N1)pdm09: 217 A(H1N1)pdm09 viruses were antigenically characterized by HI, and all were well-recognized (reacting at titers that were within 4-fold of the homologous virus titer) by ferret antisera to cell-grown A/Wisconsin/67/2022-like reference viruses representing the A(H1N1)pdm09 component for the cell- and recombinant-based influenza vaccines.
                      • A (H3N2): 249 A(H3N2) viruses were antigenically characterized by HI or HINT, and 246 (98.8%) were well-recognized (reacting at titers that were within 4-fold of the homologous virus titer in HI or reacting at titers that were less than or equal to 8-fold of the homologous virus in HINT) by ferret antisera to cell-grown A/Darwin/6/2021-like reference viruses representing the A(H3N2) component for the cell- and recombinant-based influenza vaccines.

                      Influenza B Viruses
                      • B/Victoria: 213 influenza B/Victoria-lineage virus were antigenically characterized by HI, and all were well-recognized (reacting at titers that were within 4-fold of the homologous virus titer) by ferret antisera to cell-grown B/Austria/1359417/2021-like reference viruses representing the B/Victoria component for the cell- and recombinant-based influenza vaccines.
                      • B/Yamagata: No influenza B/Yamagata-lineage viruses were available for antigenic characterization.

                      Assessment of Virus Susceptibility to Antiviral Medications

                      CDC assesses susceptibility of influenza viruses to the antiviral medications including the neuraminidase inhibitors (oseltamivir, zanamivir, and peramivir) and the PA endonuclease inhibitor baloxavir using next generation sequence analysis supplemented by laboratory assays. Information about antiviral susceptibility test methods can be found at U.S. Influenza Surveillance: Purpose and Methods | CDC.

                      Viruses collected in the U.S. since October 01, 2023, were tested for antiviral susceptibility as follows:
                      Neuraminidase Inhibitors Oseltamivir Viruses Tested 3,350 1,379 1,062 909
                      Reduced Inhibition 1 (0.03%) 1 (0.07%) 0 (0.0%) 0 (0.0%)
                      Highly Reduced Inhibition 2 (0.06%) 2 (0.1%) 0 (0.0%) 0 (0.0%)
                      Peramivir Viruses Tested 3,350 1,379 1,062 909
                      Reduced Inhibition 0 (0.0%) 0 (0.0%) 0 (0.0%) 0 (0.0%)
                      Highly Reduced Inhibition 2 (0.06%) 2 (0.1%) 0 (0.0%) 0 (0.0%)
                      Zanamivir Viruses Tested 3,350 1,379 1,062 909
                      Reduced Inhibition 0 (0.0%) 0 (0.0%) 0 (0.0%) 0 (0.0%)
                      Highly Reduced Inhibition 0 (0.0%) 0 (0.0%) 0 (0.0%) 0 (0.0%)
                      PA Cap-Dependent Endonuclease Inhibitor Baloxavir Viruses Tested 3,261 1,340 1,039 882
                      Decreased Susceptibility 1 (0.03%) 0 (0.0%) 1 (0.1%) 0 (0.0%)
                      Two A(H1N1)pdm09 viruses had NA-H275Y amino acid substitution and showed highly reduced inhibition by oseltamivir and peramivir. One (H1N1)pdm09 virus had NA-I223V and NA-S247N amino acid substitutions and showed reduced inhibition by oseltamivir. One A(H3N2) virus had PA-I38T amino acid substitution and showed reduced susceptibility to baloxavir.

                      High levels of resistance to the adamantanes (amantadine and rimantadine) persist among influenza A(H1N1)pdm09 and influenza A(H3N2) viruses (the adamantanes are not effective against influenza B viruses). Therefore, use of these antivirals for treatment and prevention of influenza A virus infection is not recommended and data from adamantane resistance testing are not presented. Outpatient Respiratory Illness Surveillance


                      The U.S. Outpatient Influenza-like Illness Surveillance Network (ILINet) monitors outpatient visits for respiratory illness referred to as influenza-like illness [ILI (fever plus cough or sore throat)], not laboratory-confirmed influenza and will therefore capture respiratory illness visits due to infection with pathogens that can present with similar symptoms, including influenza viruses, SARS-CoV-2, and RSV. It is important to evaluate syndromic surveillance data, including that from ILINet, in the context of other sources of surveillance data to obtain a more complete and accurate picture of influenza, SARS-CoV-2, and other respiratory virus activity. CDC is providing integrated information about COVID-19, influenza, and RSV activity on a website that is updated weekly. Information about other respiratory virus activity can be found on CDC’s National Respiratory and Enteric Virus Surveillance System (NREVSS) website. Outpatient Respiratory Illness Visits


                      Nationally, during Week 14, 2.8% of patient visits reported through ILINet were due to respiratory illness that included fever plus a cough or sore throat, also referred to as ILI. This has decreased (change of ≥ 0.1 percentage points) since Week 13 and is now below the national baseline. The percentage of visits for ILI decreased in regions 2, 4, 5, 6, 7, and 8, and remained stable in all other regions in Week 14 compared to Week 13. Regions 1, 5, and 7 are above their baseline, and all other regions are below their respective baselines. Multiple respiratory viruses are co-circulating, and the relative contribution of influenza virus infection to ILI varies by location.

                      Outpatient Respiratory Illness Visits by Age Group


                      About 70% of ILINet participants provide both the number of patient visits for respiratory illness and the total number of patient visits for the week broken out by age group. Data from this subset of providers are used to calculate the percentages of patient visits for respiratory illness by age group.

                      The percentage of visits for respiratory illness reported in ILINet decreased in the 0-4 years, 5-24 years, and 25-49 years age groups, and remained stable in the 50-64 years and 65+ years age groups in Week 14 compared to Week 13.

                      Outpatient Respiratory Illness Activity Map


                      Data collected in ILINet are used to produce a measure of ILI activity* by state/jurisdiction and Core Based Statistical Areas (CBSA).
                      Week 14
                      (Week ending
                      Apr. 6, 2024)
                      Week 13
                      (Week ending
                      Mar. 30, 2024)
                      Week 14
                      (Week ending
                      Apr. 6, 2024)
                      Week 13
                      (Week ending
                      Mar. 30, 2024)
                      Very High 0 0 0 1
                      High 1 6 13 20
                      Moderate 7 5 37 53
                      Low 13 21 127 136
                      Minimal 33 23 513 495
                      Insufficient Data 1 0 239 224


                      *Data collected in ILINet may disproportionally represent certain populations within a jurisdiction or CBSA, and therefore, may not accurately depict the full picture of influenza activity for the entire jurisdiction or CBSA. Differences in the data presented here by CDC and independently by some health departments likely represent differing levels of data completeness with data presented by the health department likely being the more complete.

                      Additional information about medically attended visits for ILI for current and past seasons:
                      Surveillance Methods | FluView Interactive: National, Regional, and State Data or ILI Activity Map Hospitalization Surveillance

                      FluSurv-NET


                      The Influenza Hospitalization Surveillance Network (FluSurv-NET) conducts population-based surveillance for laboratory-confirmed influenza-related hospitalizations in select counties in 14 states and represents approximately 9% of the U.S. population. FluSurv-NET hospitalization data are preliminary. As data are received each week, prior case counts and rates are updated accordingly.

                      A total of 23,235 laboratory-confirmed influenza-associated hospitalizations were reported by FluSurv-NET sites between October 1, 2023, and April 6, 2024. The weekly hospitalization rate observed in Week 14 was 1.2 per 100,000 population. The weekly hospitalization rate observed during Week 52 is the third highest peak weekly rate observed during all seasons going back to 2010-2011 following the 2014-2015 and 2017-2018 seasons. The overall cumulative hospitalization rate was 76.0 per 100,000 population. This cumulative hospitalization rate is the second highest cumulative hospitalization rate when compared against previous end-of-season rates for Week 14, and it is the second highest cumulative in-season hospitalization rate observed in Week 14, following the 2017-2018 season (101.6). Cumulative in-season hospitalization rates observed in Week 14 from 2010-2011 through 2022-2023 ranged from 0.8 to 68.2.

                      When examining rates by age, the highest cumulative hospitalization rate per 100,000 population was among adults aged 65 years and older (207.5), followed by adults aged 50-64 years (90.2) and children aged 0-4 years (78.0). When examining age-adjusted rates by race and ethnicity, the highest rate of hospitalization per 100,000 population was among non-Hispanic Black persons (139.8), followed by non-Hispanic American Indian or Alaska Native persons (104.8), Hispanic persons (70.8), non-Hispanic White persons (58.5), and non-Hispanic Asian/Pacific Islander persons (39.8).

                      Among 23,235 hospitalizations, 19,767 (85.1%) were associated with influenza A virus, 3,307 (14.2%) with influenza B virus, 42 (0.2%) with influenza A virus and influenza B virus co-infection, and 118 (0.5%) with influenza virus for which the type was not determined. Among those with influenza A subtype information, 3,319 (71.0%) were A(H1N1) pdm09 and 1,358 (29.0%) were A(H3N2).

                      Among 2,879 hospitalized adults with information on underlying medical conditions, 95.4% had at least one reported underlying medical condition, the most commonly reported were hypertension, cardiovascular disease, obesity, and metabolic disease. Among 1,381 hospitalized women of childbearing age (15-49 years) with information on pregnancy status, 22.1% were pregnant. Among 898 hospitalized children with information on underlying medical conditions, 69.5% had at least one reported underlying medical condition; the most commonly reported was asthma, followed by obesity and neurologic disease.


                      In these figures, cumulative and weekly rates for all seasons prior to the 2023-2024 season reflect end-of-season rates. For the 2023-2024 season, rates for recent hospitals admissions are subject to reporting delays. As hospitalization data are reviewed each week, prior case counts and rates are updated accordingly.

                      Additional FluSurv-NET hospitalization surveillance information for current and past seasons and additional age groups:
                      Surveillance Methods |FluView Interactive: Rates by Age, Sex, and Race/Ethnicity or Data on Patient Characteristics | RESP-NET Interactive National Healthcare Safety Network (NHSN) Hospitalization Surveillance


                      Hospitals report to NHSN the weekly number of patients admitted with laboratory-confirmed influenza. During Week 14, 4,825 patients with laboratory-confirmed influenza were admitted to a hospital. The number of patients admitted to a hospital with laboratory-confirmed influenza for Week 14 decreased (change of >5%) compared to Week 13 nationally and in regions 4, 5, 6, 7, 8, 9, and 10. The number of hospitalizations remained stable in regions 1 and 2 and slightly increased in Region 3.


                      Additional NHSN Hospitalization Surveillance information:
                      Surveillance Methods | Additional Data | FluView Interactive Mortality Surveillance

                      National Center for Health Statistics (NCHS) Mortality Surveillance


                      Based on NCHS mortality surveillance data available on April 11, 2024, 0.4% of the deaths that occurred during the week ending April 6, 2024 (Week 14), were due to influenza. This percentage remained stable (< 0.1 percentage point change) compared to Week 13. The data presented are preliminary and may change as more data are received and processed.


                      Additional pneumonia, influenza and COVID-19 mortality surveillance information for current and past seasons:
                      Surveillance Methods | FluView Interactive Influenza-Associated Pediatric Mortality


                      Five influenza-associated pediatric deaths occurring during the 2023-2024 season were reported to CDC during Week 14. The deaths occurred between Week 7 (the week ending February 17, 2024) and Week 13 (the week ending March 30, 2024). Two deaths were associated with influenza A viruses for which no subtyping was performed and three deaths were associated with influenza B viruses with no lineage determined.


                      Additional pediatric mortality surveillance information for current and past seasons:
                      Surveillance Methods | FluView Interactive Trend Indicators


                      Increasing:
                      Decreasing:
                      Stable: Indicators Status by System


                      Clinical Labs: Up or down arrows indicate a change of greater than or equal to 0.5 percentage points in the percent of specimens positive for influenza compared to the previous week.
                      Outpatient Respiratory Illness (ILINet): Up or down arrows indicate a change of greater than 0.1 percentage points in the percent of visits due to respiratory illness (ILI) compared to the previous week.
                      NHSN Hospitalizations: Up or down arrows indicate change of greater than or equal to 5% of the number of patients admitted with laboratory-confirmed influenza compared to the previous week.
                      NCHS Mortality: Up or down arrows indicate change of greater than 0.1 percentage points of the percent of deaths due to influenza compared to the previous week. Reference Footnotes


                      1U.S. Influenza Surveillance: Purpose and Methods (2023 Oct). Centers for Disease Control and Prevention. https://www.cdc.gov/flu/weekly/overview.htm#ILINet.

                      2Grohskopf LA, Blanton LH, Ferdinands JM, Chung JR, Broder KR, Talbot HK. Prevention and Control of Seasonal Influenza with Vaccines: Recommendations of the Advisory Committee on Immunization Practices — United States, 2023–24 Influenza Season. MMWR Recomm Rep 2023;72(No. RR-2):1–25. DOI: http://dx.doi.org/10.15585/mmwr.rr7202a1

                      3Influenza Antiviral Medications: Summary for Clinicians (2023 Sept). Centers for Disease Control and Prevention. https://www.cdc.gov/flu/professional...clinicians.htm.

                      Additional National and International Influenza Surveillance Information


                      FluView Interactive: FluView includes enhanced web-based interactive applications that can provide dynamic visuals of the influenza data collected and analyzed by CDC. These FluView Interactive applications allow people to create customized, visual interpretations of influenza data, as well as make comparisons across flu seasons, regions, age groups and a variety of other demographics.

                      National Institute for Occupational Safety and Health: Monthly surveillance data on the prevalence of health-related workplace absenteeism among full-time workers in the United States are available from NIOSH.
                      https://www.cdc.gov/flu/weekly/index.htm
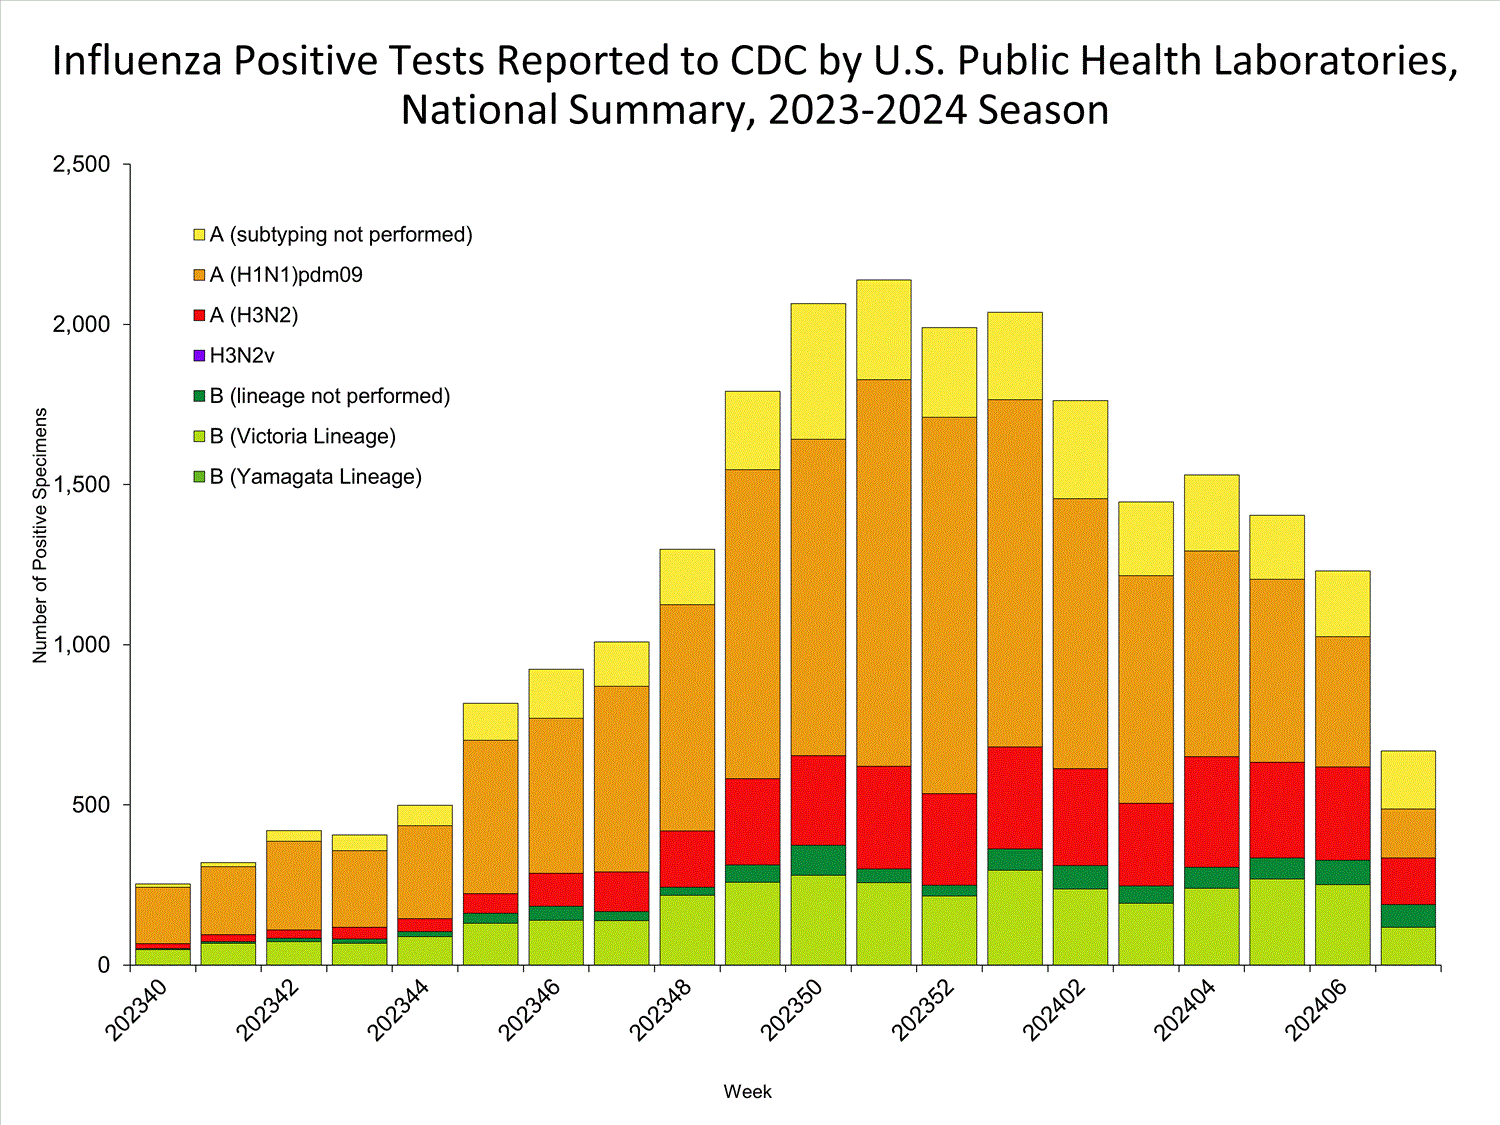
                      Comment


                      • #26
                        Weekly U.S. Influenza Surveillance Report


                        Print
                        Updated April 19, 2024

                        Key Updates for Week 15, ending April 13, 2024

                        Seasonal influenza activity continues to decline in most areas of the country. Viruses


                        Clinical Lab 5.9%

                        (Trend )


                        positive for influenza
                        this week


                        Public Health Lab
                        Influenza A(H1N1)pdm09, A(H3N2), and B viruses were all co-circulating this week.

                        Virus Characterization
                        Genetic and antigenic characterization and antiviral susceptibility are summarized in this report. Illness


                        Outpatient Respiratory Illness 2.5%

                        (Trend )


                        of visits to a health care provider this week were for respiratory illness
                        (below baseline).


                        Outpatient Respiratory Illness: Activity Map
                        This week 3 jurisdictions experienced moderate activity and 2 jurisdictions experienced high activity.

                        FluSurv-NET 77.5 per 100,000


                        cumulative hospitalization rate.

                        NHSN Hospitalizations 3,844 (Trend )


                        patients admitted to hospitals with influenza this week.

                        NCHS Mortality 0.4%

                        (Trend )


                        of deaths attributed to influenza this week.

                        Pediatric Deaths 4


                        influenza-associated deaths were reported this week for a total of 142 deaths this season.

                        All data are preliminary and may change as more reports are received.

                        Directional arrows indicate changes between the current week and the previous week. Additional information on the arrows can be found at the bottom of this page.

                        A description of the CDC influenza surveillance system, including methodology and detailed descriptions of each data component is available on the surveillance methods page.

                        Additional information on the current and previous influenza seasons for each surveillance component are available on FluView Interactive.

                        Key Points
                        • Seasonal influenza activity continues to decline nationally and in most areas of the country.
                        • Nationally, percent positivity for both influenza A and B decreased compared to last week.
                        • Nationally, outpatient respiratory illness declined and is below baseline for the second week in a row.1 HHS regions 2, 3, 4, 5, 6, 7, 8, 9, and 10 are below their baselines, while Region 1 remains above its region-specific baselines.
                        • Nationally, the number of weekly flu hospital admissions has been decreasing since January.
                        • During Week 15, of the 210 viruses reported by public health laboratories, 131 (62.4%) were influenza A and 79 (37.6%) were influenza B. Of the 91 influenza A viruses subtyped during Week 15, 43 (47.3%) were influenza A(H1N1)pdm09 and 48 (52.7%) were A(H3N2).
                        • Four influenza-associated pediatric deaths occurring during the 2023-2024 season were reported to CDC during Week 15, bringing the season total to 142 pediatric deaths.
                        • CDC estimates that there have been at least 33 million illnesses, 370,000 hospitalizations, and 24,000 deaths from flu so far this season.
                        • CDC recommends that everyone 6 months and older get an annual flu vaccine as long as influenza viruses are spreading.2 Vaccination can still provide benefit this season.
                        • There also are prescription flu antiviral drugs that can treat flu illness; those should be started as early as possible and are especially important for higher risk patients.3
                        • Flu viruses are among several viruses contributing to respiratory disease activity. CDC is providing updated, integrated information about COVID-19, flu, and RSV activity on a weekly basis.
                        U.S. Virologic Surveillance


                        Nationally, the percentage of respiratory specimens testing positive for influenza in clinical laboratories decreased (change of >0.5 percentage points) compared to the previous week. Regions 1, 2, 3, 4, 5, 6, 7, and 10 decreased in percent positivity, while regions 8 and 9 remained stable during Week 15 compared to Week 14. The regions with the highest percent positivity were regions 7 (13.4%), 1 (8.3%), and 5 (8.2%). Nationally, influenza A(H1N1)pdm09, A(H3N2), and B/Victoria viruses are all co-circulating. However, the distribution of circulating viruses varies by region. For regional and state level data and age group distribution, please visit FluView Interactive. Viruses known to be associated with recent receipt of live attenuated influenza vaccine (LAIV) or found upon further testing to be a vaccine virus are not included, as they are not circulating influenza viruses. Clinical Laboratories


                        The results of tests performed by clinical laboratories nationwide are summarized below. Data from clinical laboratories (the percentage of specimens tested that are positive for influenza virus) are used to monitor whether influenza activity is increasing or decreasing.
                        No. of specimens tested 60,070 2,943,347
                        No. of positive specimens (%) 3,569 (5.9%) 333,038 (11.3%)
                        Positive specimens by type
                        Influenza A 1,929 (54.0%) 231,132 (69.4%)
                        Influenza B 1,640 (46.0%) 101,896 (30.6%)
                        Public Health Laboratories


                        The results of tests performed by public health laboratories nationwide are summarized below. Data from public health laboratories are used to monitor the proportion of circulating influenza viruses that belong to each influenza subtype/lineage.
                        No. of specimens tested 962 100,576
                        No. of positive specimens 210 33,071
                        Positive specimens by type/subtype
                        Influenza A 131 (62.4%) 25,433 (76.9%)
                        Subtyping Performed 91 (69.5%) 21,112 (83.0%)
                        (H1N1)pdm09 43 (47.3%) 14,839 (70.3%)
                        H3N2 48 (52.7%) 6,273 (29.7%)
                        H3N2v 0 (0.0%) 0 (0.0%)
                        Subtyping not performed 40 (30.5%) 4,321 (17.0%)
                        Influenza B 79 (37.6%) 7,638 (23.1%)
                        Lineage testing performed 58 (73.4%) 6,341 (83.0%)
                        Yamagata lineage 0 (0.0%) 0 (0.0%)
                        Victoria lineage 58 (100%) 6,341 (100%)
                        Lineage not performed 21 (26.6%) 1,297 (17.0%)


                        Additional virologic surveillance information for current and past seasons:
                        Surveillance Methods | FluView Interactive: National, Regional, and State Data or Age Data Influenza Virus Characterization


                        CDC performs genetic and antigenic characterization of U.S. viruses submitted from state and local public health laboratories according to the Right Size Roadmap submission guidance. These data are used to compare how similar the currently circulating influenza viruses are to the reference viruses representing viruses contained in the current influenza vaccines. The data are also used to monitor evolutionary changes that continually occur in influenza viruses circulating in humans. CDC also tests susceptibility of circulating influenza viruses to antiviral medications including the neuraminidase inhibitors (oseltamivir, zanamivir, and peramivir) and the PA endonuclease inhibitor baloxavir.

                        CDC has genetically characterized 3,626 influenza viruses collected since October 1, 2023.
                        A/H1 1,457
                        6B.1A.5a 1,457 (100%) 2a 350 (24.0%)
                        2a.1 1,107 (76.0%)
                        A/H3 1,173
                        3C.2a1b.2a 1,173 (100%) 2a.1b 1 (0.1%)
                        2a.3a 1 (0.1%)
                        2a.3a.1 1,170 (99.7%)
                        2b 1 (0.1%)
                        B/Victoria 996
                        V1A 996 (100%) 3a.2 996 (100%)
                        B/Yamagata 0
                        Y3 0 Y3 0 (0%)
                        CDC antigenically characterizes influenza viruses by hemagglutination inhibition (HI) (H1N1pdm09, H3N2, B/Victoria, and B/Yamagata viruses) or neutralization-based HINT (H3N2 viruses) using antisera that ferrets make after being infected with reference viruses representing the 2023-2024 Northern Hemisphere recommended cell or recombinant-based vaccine viruses. Antigenic differences between viruses are determined by comparing how well the antibodies made against the vaccine reference viruses recognize the circulating viruses that have been grown in cell culture. Ferret antisera are useful because antibodies raised against a particular virus can often recognize small changes in the surface proteins of other viruses. In HI assays, viruses with similar antigenic properties have antibody titer differences of less than or equal to 4-fold when compared to the reference (vaccine) virus. In HINT, viruses with similar antigenic properties have antibody neutralization titer differences of less than or equal to 8-fold. Viruses selected for antigenic characterization are a subset representing the genetic changes in the surface proteins seen in genetically characterized viruses.

                        Influenza A Viruses
                        • A (H1N1)pdm09: 244 A(H1N1)pdm09 viruses were antigenically characterized by HI, and 244 (100%) were well-recognized (reacting at titers that were within 4-fold of the homologous virus titer) by ferret antisera to cell-grown A/Wisconsin/67/2022-like reference viruses representing the A(H1N1)pdm09 component for the cell- and recombinant-based influenza vaccines.
                        • A (H3N2): 249 A(H3N2) viruses were antigenically characterized by HI or HINT, and 246 (98.8%) were well-recognized (reacting at titers that were within 4-fold of the homologous virus titer in HI or reacting at titers that were less than or equal to 8-fold of the homologous virus in HINT) by ferret antisera to cell-grown A/Darwin/6/2021-like reference viruses representing the A(H3N2) component for the cell- and recombinant-based influenza vaccines.

                        Influenza B Viruses
                        • B/Victoria: 235 influenza B/Victoria-lineage virus were antigenically characterized by HI, and all were well-recognized (reacting at titers that were within 4-fold of the homologous virus titer) by ferret antisera to cell-grown B/Austria/1359417/2021-like reference viruses representing the B/Victoria component for the cell- and recombinant-based influenza vaccines.
                        • B/Yamagata: No influenza B/Yamagata-lineage viruses were available for antigenic characterization.

                        Assessment of Virus Susceptibility to Antiviral Medications

                        CDC assesses susceptibility of influenza viruses to the antiviral medications including the neuraminidase inhibitors (oseltamivir, zanamivir, and peramivir) and the PA endonuclease inhibitor baloxavir using next generation sequence analysis supplemented by laboratory assays. Information about antiviral susceptibility test methods can be found at U.S. Influenza Surveillance: Purpose and Methods | CDC.

                        Viruses collected in the U.S. since October 01, 2023, were tested for antiviral susceptibility as follows:
                        Neuraminidase Inhibitors Oseltamivir Viruses Tested 3,637 1,469 1,178 990
                        Reduced Inhibition 1 (0.03%) 1 (0.07%) 0 (0.0%) 0 (0.0%)
                        Highly Reduced Inhibition 2 (0.05%) 2 (0.1%) 0 (0.0%) 0 (0.0%)
                        Peramivir Viruses Tested 3,637 1,469 1,178 990
                        Reduced Inhibition 0 (0.0%) 0 (0.0%) 0 (0.0%) 0 (0.0%)
                        Highly Reduced Inhibition 2 (0.05%) 2 (0.1%) 0 (0.0%) 0 (0.0%)
                        Zanamivir Viruses Tested 3,637 1,469 1,178 990
                        Reduced Inhibition 0 (0.0%) 0 (0.0%) 0 (0.0%) 0 (0.0%)
                        Highly Reduced Inhibition 0 (0.0%) 0 (0.0%) 0 (0.0%) 0 (0.0%)
                        PA Cap-Dependent Endonuclease Inhibitor Baloxavir Viruses Tested 3,519 1,412 1,146 961
                        Decreased Susceptibility 1 (0.03%) 0 (0.0%) 1 (0.09%) 0 (0.0%)
                        Two A(H1N1)pdm09 viruses had NA-H275Y amino acid substitution conferring highly reduced inhibition by oseltamivir and peramivir. One (H1N1)pdm09 virus had NA-I223V and NA-S247N amino acid substitutions and showed reduced inhibition by oseltamivir. One A(H3N2) virus had PA-I38T amino acid substitution and showed reduced susceptibility to baloxavir.

                        High levels of resistance to the adamantanes (amantadine and rimantadine) persist among influenza A(H1N1)pdm09 and influenza A(H3N2) viruses (the adamantanes are not effective against influenza B viruses). Therefore, use of these antivirals for treatment and prevention of influenza A virus infection is not recommended and data from adamantane resistance testing are not presented. Outpatient Respiratory Illness Surveillance


                        The U.S. Outpatient Influenza-like Illness Surveillance Network (ILINet) monitors outpatient visits for respiratory illness referred to as influenza-like illness [ILI (fever plus cough or sore throat)], not laboratory-confirmed influenza and will therefore capture respiratory illness visits due to infection with pathogens that can present with similar symptoms, including influenza viruses, SARS-CoV-2, and RSV. It is important to evaluate syndromic surveillance data, including that from ILINet, in the context of other sources of surveillance data to obtain a more complete and accurate picture of influenza, SARS-CoV-2, and other respiratory virus activity. CDC is providing integrated information about COVID-19, influenza, and RSV activity on a website that is updated weekly. Information about other respiratory virus activity can be found on CDC’s National Respiratory and Enteric Virus Surveillance System (NREVSS) website. Outpatient Respiratory Illness Visits


                        Nationally, during Week 15, 2.5% of patient visits reported through ILINet were due to respiratory illness that included fever plus a cough or sore throat, also referred to as ILI. This has decreased (change of > 0.1 percentage points) since Week 14 and is below the national baseline. The percentage of visits for ILI decreased in regions 1, 2, 3, 4, 5, 6, and 7 and remained stable in regions 8, 9, and 10 in Week 15 compared to Week 14. Region 1 is above its region-specific baseline, and all other regions are below their respective baselines. Multiple respiratory viruses are co-circulating, and the relative contribution of influenza virus infection to ILI varies by location.

                        Outpatient Respiratory Illness Visits by Age Group


                        About 70% of ILINet participants provide both the number of patient visits for respiratory illness and the total number of patient visits for the week broken out by age group. Data from this subset of providers are used to calculate the percentages of patient visits for respiratory illness by age group.

                        The percentage of visits for respiratory illness reported in ILINet decreased in the 0-4 years, 5-24 years, 25-49 years, and 50-64 years age groups, and remained stable in the 65+ years age groups in Week 15 compared to Week 14.

                        Outpatient Respiratory Illness Activity Map


                        Data collected in ILINet are used to produce a measure of ILI activity* by state/jurisdiction and Core Based Statistical Areas (CBSA).
                        Week 15
                        (Week ending
                        Apr. 13, 2024)
                        Week 14
                        (Week ending
                        Apr. 6, 2024)
                        Week 15
                        (Week ending
                        Apr. 13, 2024)
                        Week 14
                        (Week ending
                        Apr. 6, 2024)
                        Very High 0 0 0 0
                        High 2 2 6 12
                        Moderate 3 7 25 37
                        Low 11 12 98 127
                        Minimal 38 34 571 535
                        Insufficient Data 1 0 229 218


                        *Data collected in ILINet may disproportionally represent certain populations within a jurisdiction or CBSA, and therefore, may not accurately depict the full picture of influenza activity for the entire jurisdiction or CBSA. Differences in the data presented here by CDC and independently by some health departments likely represent differing levels of data completeness with data presented by the health department likely being the more complete.

                        Additional information about medically attended visits for ILI for current and past seasons:
                        Surveillance Methods | FluView Interactive: National, Regional, and State Data or ILI Activity Map Hospitalization Surveillance

                        FluSurv-NET


                        The Influenza Hospitalization Surveillance Network (FluSurv-NET) conducts population-based surveillance for laboratory-confirmed influenza-related hospitalizations in select counties in 14 states and represents approximately 9% of the U.S. population. FluSurv-NET hospitalization data are preliminary. As data are received each week, prior case counts and rates are updated accordingly.

                        A total of 23,694 laboratory-confirmed influenza-associated hospitalizations were reported by FluSurv-NET sites between October 1, 2023, and April 13, 2024. The weekly hospitalization rate observed in Week 15 was 0.9 per 100,000 population. The weekly hospitalization rate peaked this season during Week 52, and is the third highest weekly rate peak observed during all seasons going back to 2010-2011 following the 2014-2015 and 2017-2018 seasons. The overall cumulative hospitalization rate was 77.5 per 100,000 population. This cumulative hospitalization rate is the second highest cumulative hospitalization rate when compared against previous end-of-season rates for Week 15, and it is the second highest cumulative in-season hospitalization rate observed in Week 15, following the 2017-2018 season (103.7). Cumulative in-season hospitalization rates observed in Week 15, from 2010-2011 through 2022-2023 ranged from 0.8 to 68.3.

                        When examining rates by age, the highest cumulative hospitalization rate per 100,000 population was among adults aged 65 years and older (211.7), followed by adults aged 50-64 years (92.1) and children aged 0-4 years (79.5). When examining age-adjusted rates by race and ethnicity, the highest rate of hospitalization per 100,000 population was among non-Hispanic Black persons (142.4), followed by non-Hispanic American Indian or Alaska Native persons (106.3), Hispanic persons (72.5), non-Hispanic White persons (59.8), and non-Hispanic Asian/Pacific Islander persons (41.3).

                        Among 23,694 hospitalizations, 20,127 (84.9%) were associated with influenza A virus, 3,403 (14.4%) with influenza B virus, 42 (0.2%) with influenza A virus and influenza B virus co-infection, and 122 (0.5%) with influenza virus for which the type was not determined. Among those with influenza A subtype information, 3,386 (70.4%) were A(H1N1) pdm09 and 1,421 (29.6%) were A(H3N2).

                        Among 3,099 hospitalized adults with information on underlying medical conditions, 95.5% had at least one reported underlying medical condition, the most commonly reported were hypertension, cardiovascular disease, obesity, and metabolic disease. Among 1,419 hospitalized women of childbearing age (15-49 years) with information on pregnancy status, 22.1% were pregnant. Among 963 hospitalized children with information on underlying medical conditions, 69.8% had at least one reported underlying medical condition; the most commonly reported was asthma, followed by obesity and neurologic disease.


                        In these figures, cumulative and weekly rates for all seasons prior to the 2023-2024 season reflect end-of-season rates. For the 2023-2024 season, rates for recent hospitals admissions are subject to reporting delays. As hospitalization data are reviewed each week, prior case counts and rates are updated accordingly.

                        Additional FluSurv-NET hospitalization surveillance information for current and past seasons and additional age groups:
                        Surveillance Methods |FluView Interactive: Rates by Age, Sex, and Race/Ethnicity or Data on Patient Characteristics | RESP-NET Interactive National Healthcare Safety Network (NHSN) Hospitalization Surveillance


                        Hospitals report to NHSN the weekly number of patients admitted with laboratory-confirmed influenza. During Week 15, 3,844 patients with laboratory-confirmed influenza were admitted to a hospital. The number of patients admitted to a hospital with laboratory-confirmed influenza for Week 15 decreased (change of >5%) compared to Week 14 nationally and in regions 1, 2, 3, 4, 5, 6, 7, 8, and 10. The number of hospitalizations remained stable in Region 9.


                        Additional NHSN Hospitalization Surveillance information:
                        Surveillance Methods | Additional Data | FluView Interactive Mortality Surveillance

                        National Center for Health Statistics (NCHS) Mortality Surveillance


                        Based on NCHS mortality surveillance data available on April 18, 2024, 0.4% of the deaths that occurred during the week ending April 13, 2024 (Week 15), were due to influenza. This percentage increased (≥ 0.1 percentage point change) slightly compared to Week 14. The data presented are preliminary and may change as more data are received and processed.


                        Additional pneumonia, influenza and COVID-19 mortality surveillance information for current and past seasons:
                        Surveillance Methods | FluView Interactive Influenza-Associated Pediatric Mortality


                        Four influenza-associated pediatric deaths occurring during the 2023-2024 season were reported to CDC during Week 15. The deaths occurred during Week 44 of 2023 (the week ending November 4, 2023) and during weeks 13 and 14 of 2024 (the weeks ending March 30, 2024, and April 6, 2024). Two deaths were associated with influenza A viruses and two deaths were associated with influenza B viruses with no lineage determined. Both influenza A viruses had subtyping performed; one was an A(H1N1) virus and one was an A(H3) virus.


                        Additional pediatric mortality surveillance information for current and past seasons:
                        Surveillance Methods | FluView Interactive Trend Indicators


                        Increasing:
                        Decreasing:
                        Stable: Indicators Status by System


                        Clinical Labs: Up or down arrows indicate a change of greater than or equal to 0.5 percentage points in the percent of specimens positive for influenza compared to the previous week.
                        Outpatient Respiratory Illness (ILINet): Up or down arrows indicate a change of greater than 0.1 percentage points in the percent of visits due to respiratory illness (ILI) compared to the previous week.
                        NHSN Hospitalizations: Up or down arrows indicate change of greater than or equal to 5% of the number of patients admitted with laboratory-confirmed influenza compared to the previous week.
                        NCHS Mortality: Up or down arrows indicate change of greater than 0.1 percentage points of the percent of deaths due to influenza compared to the previous week. Reference Footnotes


                        1U.S. Influenza Surveillance: Purpose and Methods (2023 Oct). Centers for Disease Control and Prevention. https://www.cdc.gov/flu/weekly/overview.htm#ILINet.

                        2Grohskopf LA, Blanton LH, Ferdinands JM, Chung JR, Broder KR, Talbot HK. Prevention and Control of Seasonal Influenza with Vaccines: Recommendations of the Advisory Committee on Immunization Practices — United States, 2023–24 Influenza Season. MMWR Recomm Rep 2023;72(No. RR-2):1–25. DOI: http://dx.doi.org/10.15585/mmwr.rr7202a1

                        3Influenza Antiviral Medications: Summary for Clinicians (2023 Sept). Centers for Disease Control and Prevention. https://www.cdc.gov/flu/professional...clinicians.htm.

                        Additional National and International Influenza Surveillance Information


                        FluView Interactive: FluView includes enhanced web-based interactive applications that can provide dynamic visuals of the influenza data collected and analyzed by CDC. These FluView Interactive applications allow people to create customized, visual interpretations of influenza data, as well as make comparisons across flu seasons, regions, age groups and a variety of other demographics.

                        National Institute for Occupational Safety and Health: Monthly surveillance data on the prevalence of health-related workplace absenteeism among full-time workers in the United States are available from NIOSH.
                        https://www.cdc.gov/flu/weekly/index.htm
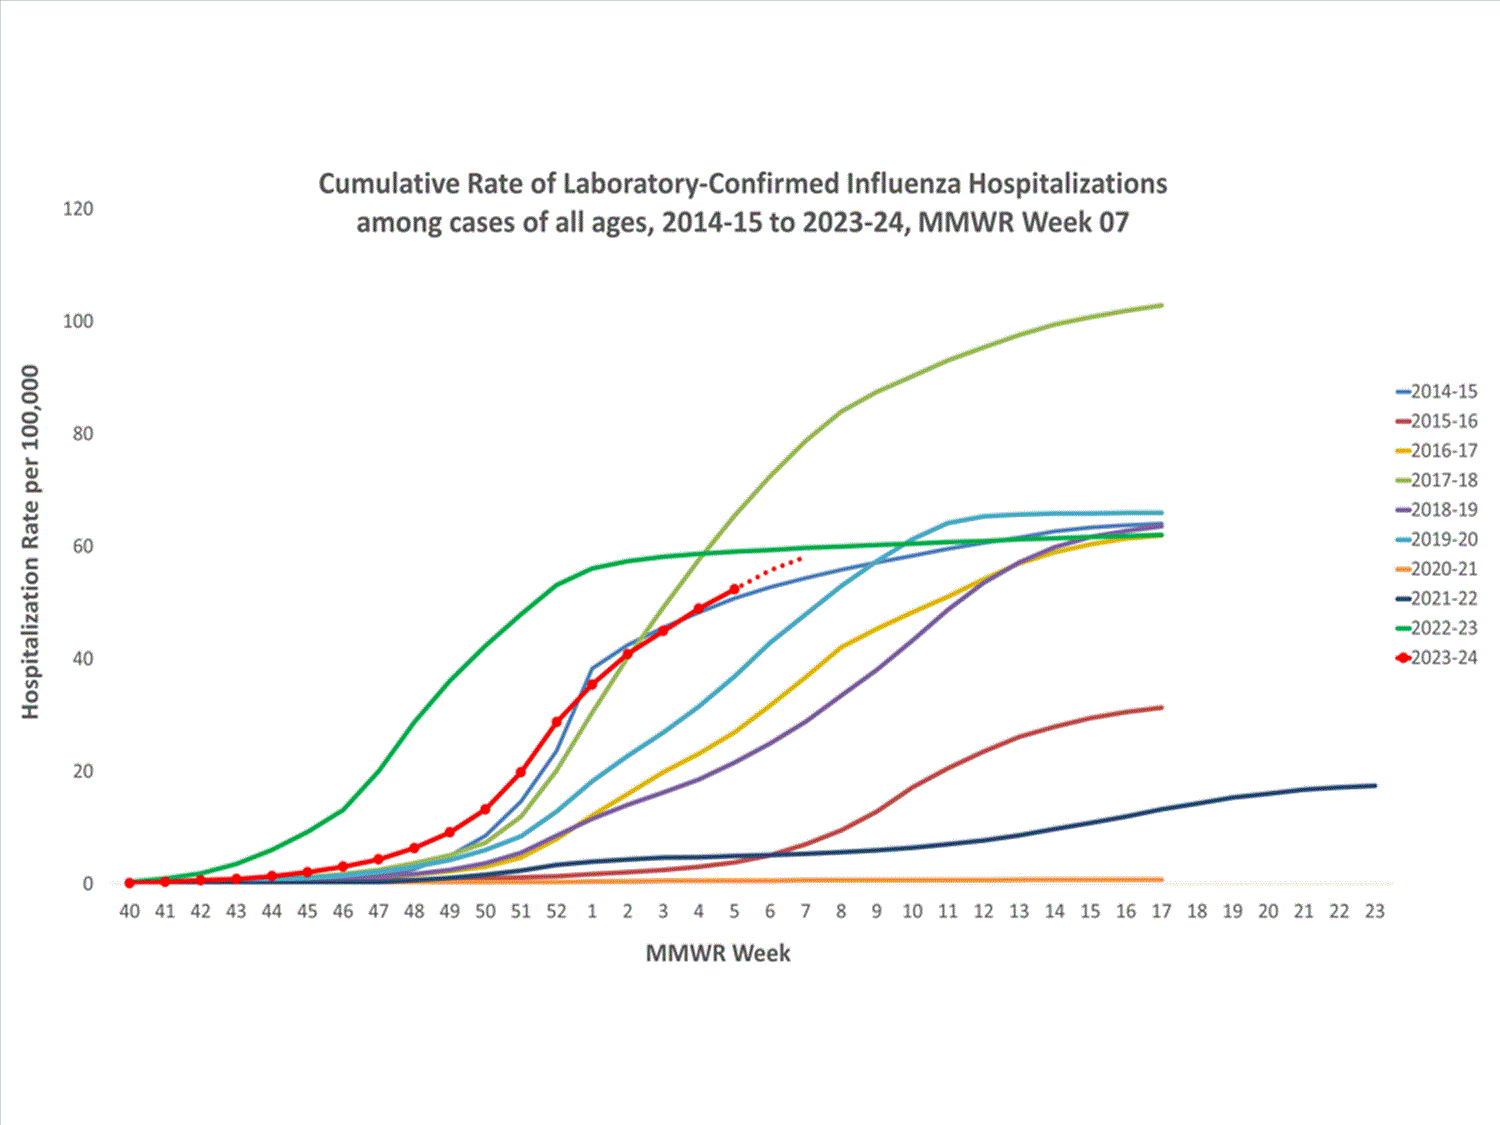
                        Comment


                        • #27
                          Weekly U.S. Influenza Surveillance Report


                          Print
                          Updated April 26, 2024

                          Key Updates for Week 16, ending April 20, 2024

                          Seasonal influenza activity continues to decline in most areas of the country. Viruses


                          Clinical Lab 4.8%

                          (Trend )


                          positive for influenza
                          this week


                          Public Health Lab
                          Influenza A(H1N1)pdm09, A(H3N2), and B viruses were all co-circulating this week.

                          Virus Characterization
                          Genetic and antigenic characterization and antiviral susceptibility are summarized in this report. Illness


                          Outpatient Respiratory Illness 2.3%

                          (Trend )


                          of visits to a health care provider this week were for respiratory illness
                          (below baseline).


                          Outpatient Respiratory Illness: Activity Map
                          1 moderate jurisdiction

                          FluSurv-NET 79.0 per 100,000


                          cumulative hospitalization rate.

                          NHSN Hospitalizations 2,762 (Trend )


                          patients admitted to hospitals with influenza this week.

                          NCHS Mortality 0.3%

                          (Trend )


                          of deaths attributed to influenza this week.

                          Pediatric Deaths 6


                          influenza-associated deaths were reported this week for a total of 148 deaths this season.

                          All data are preliminary and may change as more reports are received.

                          Directional arrows indicate changes between the current week and the previous week. Additional information on the arrows can be found at the bottom of this page.

                          A description of the CDC influenza surveillance system, including methodology and detailed descriptions of each data component is available on the surveillance methods page.

                          Additional information on the current and previous influenza seasons for each surveillance component are available on FluView Interactive.

                          Key Points
                          • Seasonal influenza activity continues to decline nationally and in most areas of the country.
                          • Nationally, percent positivity for both influenza A and B decreased compared to last week.
                          • Nationally, outpatient respiratory illness declined and is below baseline for the third week in a row.1 HHS regions 2, 3, 4, 5, 6, 7, 8, 9, and 10 are below their baselines, while Region 1 is at its region-specific baseline.
                          • Nationally, the number of weekly flu hospital admissions has been decreasing since January.
                          • During Week 16, of the 185 viruses reported by public health laboratories, 116 (62.7%) were influenza A and 69 (37.3%) were influenza B. Of the 63 influenza A viruses subtyped during Week 16, 21 (33.3%) were influenza A(H1N1)pdm09 and 42 (66.7%) were A(H3N2).
                          • Six influenza-associated pediatric deaths occurring during the 2023-2024 season were reported to CDC during Week 16, bringing the season total to 148 pediatric deaths.
                          • CDC estimates that there have been at least 34 million illnesses, 380,000 hospitalizations, and 24,000 deaths from flu so far this season.
                          • CDC recommends that everyone 6 months and older get an annual flu vaccine as long as flu activity continues.2
                          • There also are prescription flu antiviral drugs that can treat flu illness; those should be started as early as possible and are especially important for higher risk patients.3
                          • Flu viruses are among several viruses contributing to respiratory disease activity. CDC is providing updated, integrated information about COVID-19, flu, and RSV activity on a weekly basis.
                          U.S. Virologic Surveillance


                          Nationally, the percentage of respiratory specimens testing positive for influenza in clinical laboratories decreased (change of >0.5 percentage points) compared to the previous week. Regions 1, 2, 3, 5, 6, 7, and 8 decreased in percent positivity, Region 9 slightly increased in percent positivity while regions 4 and 10 remained stable during Week 16 compared to Week 15. The regions with the highest percent positivity were regions 7 (9.7%), 1 (6.5%), and 5 (5.9%). Nationally, influenza A(H1N1)pdm09, A(H3N2), and B/Victoria viruses are all co-circulating. However, the distribution of circulating viruses varies by region. For regional and state level data and age group distribution, please visit FluView Interactive. Viruses known to be associated with recent receipt of live attenuated influenza vaccine (LAIV) or found upon further testing to be a vaccine virus are not included, as they are not circulating influenza viruses. Clinical Laboratories


                          The results of tests performed by clinical laboratories nationwide are summarized below. Data from clinical laboratories (the percentage of specimens tested that are positive for influenza virus) are used to monitor whether influenza activity is increasing or decreasing.
                          No. of specimens tested 56,206 2,989,749
                          No. of positive specimens (%) 2,720 (4.8%) 336,223 (11.2%)
                          Positive specimens by type
                          Influenza A 1,532 (56.3%) 232,930 (69.3%)
                          Influenza B 1,188 (43.7%) 103,282 (30.7%)
                          Public Health Laboratories


                          The results of tests performed by public health laboratories nationwide are summarized below. Data from public health laboratories are used to monitor the proportion of circulating influenza viruses that belong to each influenza subtype/lineage.
                          No. of specimens tested 900 102,610
                          No. of positive specimens 185 33,910
                          Positive specimens by type/subtype
                          Influenza A 116 (62.7%) 25,982 (76.6%)
                          Subtyping Performed 63 (54.3%) 21,493 (82.7%)
                          (H1N1)pdm09 21 (33.3%) 14,982 (69.7%)
                          H3N2 42 (66.7%) 6,511 (30.3%)
                          H3N2v 0 (0.0%) 0 (0.0%)
                          Subtyping not performed 53 (45.7%) 4,489 (17.3%)
                          Influenza B 69 (37.3%) 7,928 (23.4%)
                          Lineage testing performed 39 (56.5%) 6,561 (82.8%)
                          Yamagata lineage 0 (0.0%) 0 (0.0%)
                          Victoria lineage 39 (100.0%) 6,561 (100.0%)
                          Lineage not performed 30 (43.5%) 1,367 (17.2%)


                          Additional virologic surveillance information for current and past seasons:
                          Surveillance Methods | FluView Interactive: National, Regional, and State Data or Age Data Influenza Virus Characterization


                          CDC performs genetic and antigenic characterization of U.S. viruses submitted from state and local public health laboratories according to the Right Size Roadmap submission guidance. These data are used to compare how similar the currently circulating influenza viruses are to the reference viruses representing viruses contained in the current influenza vaccines. The data are also used to monitor evolutionary changes that continually occur in influenza viruses circulating in humans. CDC also tests susceptibility of circulating influenza viruses to antiviral medications including the neuraminidase inhibitors (oseltamivir, zanamivir, and peramivir) and the PA endonuclease inhibitor baloxavir.

                          CDC has genetically characterized 3,842 influenza viruses collected since October 1, 2023.
                          A/H1 1,457
                          6B.1A.5a 1,457 (100%) 2a 350 (24.0%)
                          2a.1 1,107 (76.0%)
                          A/H3 1,173
                          3C.2a1b.2a 1,173 (100%) 2a.1b 1 (0.1%)
                          2a.3a 1 (0.1%)
                          2a.3a.1 1,170 (99.7%)
                          2b 1 (0.1%)
                          B/Victoria 996
                          V1A 996 (100%) 3a.2 996 (100%)
                          B/Yamagata 0
                          Y3 0 Y3 0 (0%)
                          CDC antigenically characterizes influenza viruses by hemagglutination inhibition (HI) (H1N1pdm09, H3N2, B/Victoria, and B/Yamagata viruses) or neutralization-based HINT (H3N2 viruses) using antisera that ferrets make after being infected with reference viruses representing the 2023-2024 Northern Hemisphere recommended cell or recombinant-based vaccine viruses. Antigenic differences between viruses are determined by comparing how well the antibodies made against the vaccine reference viruses recognize the circulating viruses that have been grown in cell culture. Ferret antisera are useful because antibodies raised against a particular virus can often recognize small changes in the surface proteins of other viruses. In HI assays, viruses with similar antigenic properties have antibody titer differences of less than or equal to 4-fold when compared to the reference (vaccine) virus. In HINT, viruses with similar antigenic properties have antibody neutralization titer differences of less than or equal to 8-fold. Viruses selected for antigenic characterization are a subset representing the genetic changes in the surface proteins seen in genetically characterized viruses.

                          Influenza A Viruses
                          • A (H1N1)pdm09: 244 A(H1N1)pdm09 viruses were antigenically characterized by HI, and all were well-recognized (reacting at titers that were within 4-fold of the homologous virus titer) by ferret antisera to cell-grown A/Wisconsin/67/2022-like reference viruses representing the A(H1N1)pdm09 component for the cell- and recombinant-based influenza vaccines.
                          • A (H3N2): 265 A(H3N2) viruses were antigenically characterized by HI or HINT, and 262 (98.7%) were well-recognized (reacting at titers that were within 4-fold of the homologous virus titer in HI or reacting at titers that were less than or equal to 8-fold of the homologous virus in HINT) by ferret antisera to cell-grown A/Darwin/6/2021-like reference viruses representing the A(H3N2) component for the cell- and recombinant-based influenza vaccines.

                          Influenza B Viruses
                          • B/Victoria: 235 influenza B/Victoria-lineage virus were antigenically characterized by HI, and all were well-recognized (reacting at titers that were within 4-fold of the homologous virus titer) by ferret antisera to cell-grown B/Austria/1359417/2021-like reference viruses representing the B/Victoria component for the cell- and recombinant-based influenza vaccines.
                          • B/Yamagata: No influenza B/Yamagata-lineage viruses were available for antigenic characterization.

                          Assessment of Virus Susceptibility to Antiviral Medications

                          CDC assesses susceptibility of influenza viruses to the antiviral medications including the neuraminidase inhibitors (oseltamivir, zanamivir, and peramivir) and the PA endonuclease inhibitor baloxavir using next generation sequence analysis supplemented by laboratory assays. Information about antiviral susceptibility test methods can be found at U.S. Influenza Surveillance: Purpose and Methods | CDC.

                          Viruses collected in the U.S. since October 1, 2023, were tested for antiviral susceptibility as follows:
                          Neuraminidase Inhibitors Oseltamivir Viruses Tested 3,911 1,552 1,276 1,083
                          Reduced Inhibition 1 (0.03%) 1 (0.06%) 0 (0.0%) 0 (0.0%)
                          Highly Reduced Inhibition 2 (0.05%) 2 (0.1%) 0 (0.0%) 0 (0.0%)
                          Peramivir Viruses Tested 3,911 1,552 1,276 1,083
                          Reduced Inhibition 0 (0.0%) 0 (0.0%) 0 (0.0%) 0 (0.0%)
                          Highly Reduced Inhibition 2 (0.05%) 2 (0.1%) 0 (0.0%) 0 (0.0%)
                          Zanamivir Viruses Tested 3,911 1,552 1,276 1,083
                          Reduced Inhibition 0 (0.0%) 0 (0.0%) 0 (0.0%) 0 (0.0%)
                          Highly Reduced Inhibition 0 (0.0%) 0 (0.0%) 0 (0.0%) 0 (0.0%)
                          PA Cap-Dependent Endonuclease Inhibitor Baloxavir Viruses Tested 3,792 1,503 1,237 1,052
                          Decreased Susceptibility 1 (0.03%) 0 (0.0%) 1 (0.08%) 0 (0.0%)
                          Two A(H1N1)pdm09 viruses had NA-H275Y amino acid substitution conferring highly reduced inhibition by oseltamivir and peramivir. One (H1N1)pdm09 virus had NA-I223V and NA-S247N amino acid substitutions and showed reduced inhibition by oseltamivir. One A(H3N2) virus had PA-I38T amino acid substitution and showed reduced susceptibility to baloxavir.

                          High levels of resistance to the adamantanes (amantadine and rimantadine) persist among influenza A(H1N1)pdm09 and influenza A(H3N2) viruses (the adamantanes are not effective against influenza B viruses). Therefore, use of these antivirals for treatment and prevention of influenza A virus infection is not recommended and data from adamantane resistance testing are not presented. Outpatient Respiratory Illness Surveillance


                          The U.S. Outpatient Influenza-like Illness Surveillance Network (ILINet) monitors outpatient visits for respiratory illness referred to as influenza-like illness [ILI (fever plus cough or sore throat)], not laboratory-confirmed influenza and will therefore capture respiratory illness visits due to infection with pathogens that can present with similar symptoms, including influenza viruses, SARS-CoV-2, and RSV. It is important to evaluate syndromic surveillance data, including that from ILINet, in the context of other sources of surveillance data to obtain a more complete and accurate picture of influenza, SARS-CoV-2, and other respiratory virus activity. CDC is providing integrated information about COVID-19, influenza, and RSV activity on a website that is updated weekly. Information about other respiratory virus activity can be found on CDC’s National Respiratory and Enteric Virus Surveillance System (NREVSS) website. Outpatient Respiratory Illness Visits


                          Nationally, during Week 16, 2.3% of patient visits reported through ILINet were due to respiratory illness that included fever plus a cough or sore throat, also referred to as ILI. This has decreased (change of > 0.1 percentage points) since Week 15 and is below the national baseline. The percentage of visits for ILI decreased in regions 1, 2, 3, 4, 5, 6, 8, 9, and 10 and remained stable in Region 7 in Week 16 compared to Week 15. Region 1 is at its region-specific baseline, and all other regions are below their respective baselines. Multiple respiratory viruses are co-circulating, and the relative contribution of influenza virus infection to ILI varies by location.

                          Outpatient Respiratory Illness Visits by Age Group


                          About 70% of ILINet participants provide both the number of patient visits for respiratory illness and the total number of patient visits for the week broken out by age group. Data from this subset of providers are used to calculate the percentages of patient visits for respiratory illness by age group.

                          The percentage of visits for respiratory illness reported in ILINet decreased in the 0-4 years, 5-24 years, 25-49 years, and 50-64 years age groups, and remained stable in the 65+ years age groups in Week 16 compared to Week 15.

                          Outpatient Respiratory Illness Activity Map


                          Data collected in ILINet are used to produce a measure of ILI activity* by state/jurisdiction and Core Based Statistical Areas (CBSA).
                          Week 16
                          (Week ending
                          Apr. 20, 2024)
                          Week 15
                          (Week ending
                          Apr. 13, 2024)
                          Week 16
                          (Week ending
                          Apr. 20, 2024)
                          Week 15
                          (Week ending
                          Apr. 13, 2024)
                          Very High 0 0 0 0
                          High 0 1 1 5
                          Moderate 1 4 8 24
                          Low 7 11 59 99
                          Minimal 46 39 626 577
                          Insufficient Data 1 0 235 224


                          *Data collected in ILINet may disproportionally represent certain populations within a jurisdiction or CBSA, and therefore, may not accurately depict the full picture of influenza activity for the entire jurisdiction or CBSA. Differences in the data presented here by CDC and independently by some health departments likely represent differing levels of data completeness with data presented by the health department likely being the more complete.

                          Additional information about medically attended visits for ILI for current and past seasons:
                          Surveillance Methods | FluView Interactive: National, Regional, and State Data or ILI Activity Map Hospitalization Surveillance

                          FluSurv-NET


                          The Influenza Hospitalization Surveillance Network (FluSurv-NET) conducts population-based surveillance for laboratory-confirmed influenza-related hospitalizations in select counties in 14 states and represents approximately 9% of the U.S. population. FluSurv-NET hospitalization data are preliminary. As data are received each week, prior case counts and rates are updated accordingly.

                          A total of 24,140 laboratory-confirmed influenza-associated hospitalizations were reported by FluSurv-NET sites between October 1, 2023, and April 20, 2024. The weekly hospitalization rate observed in Week 16 was 0.7 per 100,000 population. The weekly hospitalization rate observed during Week 52 is tied with the 2014-2015 season for the second highest peak weekly rate observed during all seasons going back to 2010-2011 and only lower than the 2017-2018 season. The overall cumulative hospitalization rate was 79.0 per 100,000 population. This cumulative hospitalization rate is the second highest cumulative hospitalization rate when compared against previous end-of-season rates for Week 16, and it is the second highest cumulative in-season hospitalization rate observed in Week 16, following the 2017-2018 season (105.3). Cumulative in-season hospitalization rates observed in Week 16, from 2010-2011 through 2022-2023 (excluding the 2017-2018 season) ranged from 0.8 to 68.6.

                          When examining rates by age, the highest cumulative hospitalization rate per 100,000 population was among adults aged 65 years and older (215.8) followed by adults aged 50-64 years (93.8) and children aged 0-4 years (80.9). When examining age-adjusted rates by race and ethnicity, the highest rate of hospitalization per 100,000 population was among non-Hispanic Black persons (144.3), followed by non-Hispanic American Indian or Alaska Native persons (108.2), Hispanic persons (73.7), non-Hispanic White persons (60.9), and non-Hispanic Asian/Pacific Islander persons (41.8).

                          Among 24,140 hospitalizations, 20,474 (84.8%) were associated with influenza A virus, 3,495 (14.5%) with influenza B virus, 45 (0.2%) with influenza A virus and influenza B virus co-infection, and 126 (0.5%) with influenza virus for which the type was not determined. Among those with influenza A subtype information, 3,426 (70.2%) were A(H1N1) pdm09 and 1,453 (29.8%) were A(H3N2).

                          Among 3,259 hospitalized adults with information on underlying medical conditions, 95.6% had at least one reported underlying medical condition; the most commonly reported were hypertension, cardiovascular disease, obesity, and metabolic disease. Among 1,449 hospitalized women of childbearing age (15-49 years) with information on pregnancy status, 22.2% were pregnant. Among 991 hospitalized children with information on underlying medical conditions, 68.8% had at least one reported underlying medical condition; the most commonly reported was asthma, followed by obesity and neurologic disease.


                          In these figures, cumulative and weekly rates for all seasons prior to the 2023-2024 season reflect end-of-season rates. For the 2023-2024 season, rates for recent hospitals admissions are subject to reporting delays. As hospitalization data are reviewed each week, prior case counts and rates are updated accordingly.

                          Additional FluSurv-NET hospitalization surveillance information for current and past seasons and additional age groups:
                          Surveillance Methods |FluView Interactive: Rates by Age, Sex, and Race/Ethnicity or Data on Patient Characteristics | RESP-NET Interactive National Healthcare Safety Network (NHSN) Hospitalization Surveillance


                          Hospitals report to NHSN the weekly number of patients admitted with laboratory-confirmed influenza. During Week 16, 2,762 patients with laboratory-confirmed influenza were admitted to a hospital. The number of patients admitted to a hospital with laboratory-confirmed influenza for Week 16 decreased (change of >5%) compared to Week 15 nationally and in all 10 regions.

                          Effective May 1, 2024, hospitals are no longer required to report hospital admissions, hospital capacity, or hospital occupancy data to HHS through NHSN. After May 3, 2024, the NHSN flu hospitalization data will not be included in FluView/FluView Interactive for the remainder of the 2023-2024 season.


                          Additional NHSN Hospitalization Surveillance information:
                          Surveillance Methods | Additional Data | FluView Interactive Mortality Surveillance

                          National Center for Health Statistics (NCHS) Mortality Surveillance


                          Based on NCHS mortality surveillance data available on April 25, 2024, 0.3% of the deaths that occurred during the week ending April 20, 2024 (Week 16), were due to influenza. This percentage remained stable (< 0.1 percentage point change) compared to Week 15. The data presented are preliminary and may change as more data are received and processed.


                          Additional pneumonia, influenza and COVID-19 mortality surveillance information for current and past seasons:
                          Surveillance Methods | FluView Interactive Influenza-Associated Pediatric Mortality


                          Six influenza-associated pediatric deaths occurring during the 2023-2024 season were reported to CDC during Week 16. The deaths occurred during weeks 46 and 50 of 2023 (the weeks ending November 18 and December 16 of 2023) and during weeks 3, 7, 8, and 14 of 2024 (the weeks ending January 20, February 17, February 24, and April 6 of 2024, respectively). Three deaths were associated with influenza A viruses for which subtyping was not performed, and three deaths were associated with influenza B viruses. Two of the influenza B viruses had lineage determined, and both were B/Victoria viruses.


                          Additional pediatric mortality surveillance information for current and past seasons:
                          Surveillance Methods | FluView Interactive Trend Indicators


                          Increasing:
                          Decreasing:
                          Stable: Indicators Status by System


                          Clinical Labs: Up or down arrows indicate a change of greater than or equal to 0.5 percentage points in the percent of specimens positive for influenza compared to the previous week.
                          Outpatient Respiratory Illness (ILINet): Up or down arrows indicate a change of greater than 0.1 percentage points in the percent of visits due to respiratory illness (ILI) compared to the previous week.
                          NHSN Hospitalizations: Up or down arrows indicate change of greater than or equal to 5% of the number of patients admitted with laboratory-confirmed influenza compared to the previous week.
                          NCHS Mortality: Up or down arrows indicate change of greater than 0.1 percentage points of the percent of deaths due to influenza compared to the previous week. Reference Footnotes


                          1U.S. Influenza Surveillance: Purpose and Methods (2023 Oct). Centers for Disease Control and Prevention. https://www.cdc.gov/flu/weekly/overview.htm#ILINet.

                          2Grohskopf LA, Blanton LH, Ferdinands JM, Chung JR, Broder KR, Talbot HK. Prevention and Control of Seasonal Influenza with Vaccines: Recommendations of the Advisory Committee on Immunization Practices — United States, 2023–24 Influenza Season. MMWR Recomm Rep 2023;72(No. RR-2):1–25. DOI: http://dx.doi.org/10.15585/mmwr.rr7202a1

                          3Influenza Antiviral Medications: Summary for Clinicians (2023 Sept). Centers for Disease Control and Prevention. https://www.cdc.gov/flu/professional...clinicians.htm.

                          Additional National and International Influenza Surveillance Information


                          FluView Interactive: FluView includes enhanced web-based interactive applications that can provide dynamic visuals of the influenza data collected and analyzed by CDC. These FluView Interactive applications allow people to create customized, visual interpretations of influenza data, as well as make comparisons across flu seasons, regions, age groups and a variety of other demographics.

                          National Institute for Occupational Safety and Health: Monthly surveillance data on the prevalence of health-related workplace absenteeism among full-time workers in the United States are available from NIOSH.
                          https://www.cdc.gov/flu/weekly/index.htm
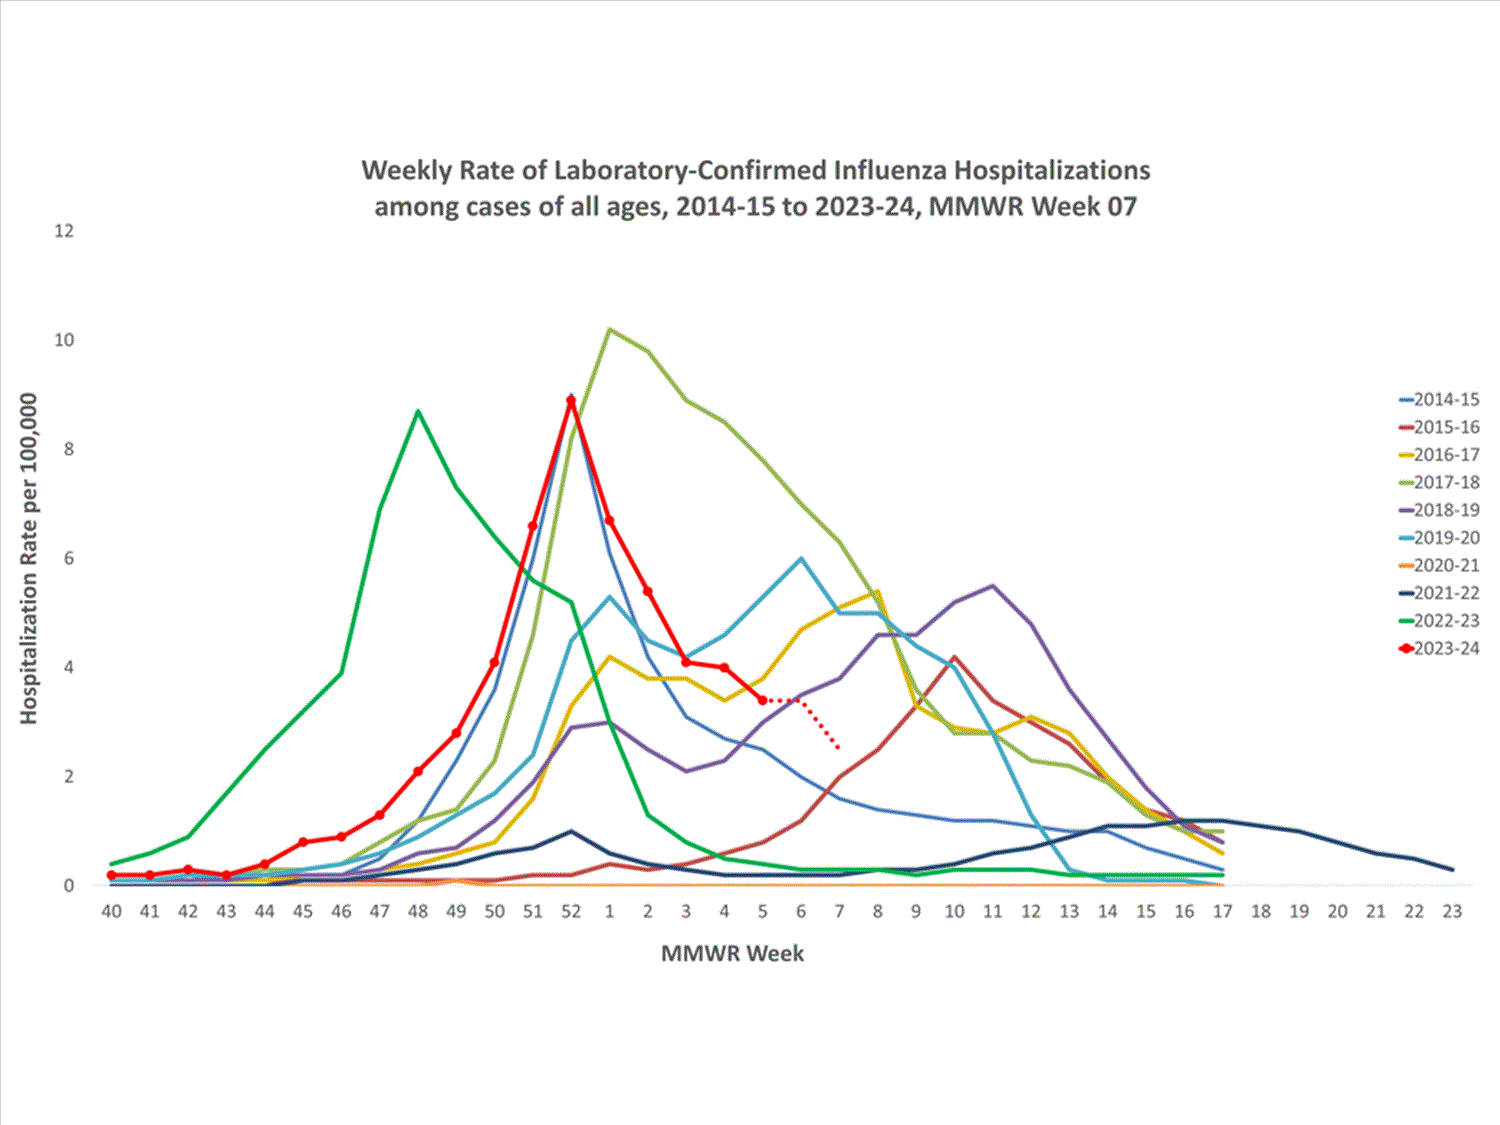
                          Comment


                          • #28
                            Weekly U.S. Influenza Surveillance Report


                            Print
                            Updated May 3, 2024

                            Key Updates for Week 17, ending April 27, 2024

                            Seasonal influenza activity continues to decline in most areas of the country. Viruses


                            Clinical Lab 3.9%

                            (Trend )


                            positive for influenza
                            this week


                            Public Health Lab
                            Influenza A(H1N1)pdm09, A(H3N2), and B viruses were all co-circulating this week.

                            Virus Characterization
                            Genetic and antigenic characterization and antiviral susceptibility are summarized in this report. Illness


                            Outpatient Respiratory Illness 2.2%

                            (Trend )


                            of visits to a health care provider this week were for respiratory illness
                            (below baseline).


                            Outpatient Respiratory Illness: Activity Map
                            0 moderate jurisdictions and 0 high or very high jurisdictions

                            FluSurv-NET 79.8 per 100,000


                            cumulative hospitalization rate.

                            NHSN Hospitalizations 2,302 (Trend )


                            patients admitted to hospitals with influenza this week.

                            NCHS Mortality 0.2%

                            (Trend )


                            of deaths attributed to influenza this week.

                            Pediatric Deaths 10


                            influenza-associated deaths were reported this week for a total of 158 deaths this season.

                            All data are preliminary and may change as more reports are received.

                            Directional arrows indicate changes between the current week and the previous week. Additional information on the arrows can be found at the bottom of this page.

                            A description of the CDC influenza surveillance system, including methodology and detailed descriptions of each data component is available on the surveillance methods page.

                            Additional information on the current and previous influenza seasons for each surveillance component are available on FluView Interactive.

                            Key Points
                            • Seasonal influenza activity continues to decline nationally and in most areas of the country.
                            • Nationally, percent positivity for both influenza A and B decreased compared to last week.
                            • Nationally, outpatient respiratory illness remained stable and is below baseline for the fourth week in a row.1 All 10 HHS regions are below their region-specific baselines.
                            • Nationally, the number of weekly flu hospital admissions has been decreasing since January.
                            • During Week 17, of the 157 viruses reported by public health laboratories, 101 (64.3%) were influenza A and 56 (35.7%) were influenza B. Of the 69 influenza A viruses subtyped during Week 17, 23 (33.3%) were influenza A(H1N1)pdm09 and 46 (66.7%) were A(H3N2).
                            • Ten influenza-associated pediatric deaths occurring during the 2023-2024 season were reported to CDC during Week 17, bringing the season total to 158 pediatric deaths.
                            • CDC estimates that there have been at least 34 million illnesses, 380,000 hospitalizations, and 24,000 deaths from flu so far this season.
                            • CDC recommends that everyone 6 months and older get an annual flu vaccine as long as flu activity continues.2
                            • There also are prescription flu antiviral drugs that can treat flu illness; those should be started as early as possible and are especially important for higher risk patients.3
                            • Flu viruses are among several viruses contributing to respiratory disease activity. CDC is providing updated, integrated information about COVID-19, flu, and RSV activity on a weekly basis.
                            U.S. Virologic Surveillance


                            Nationally, the percentage of respiratory specimens testing positive for influenza in clinical laboratories decreased (change of >0.5 percentage points) compared to the previous week. Regions 1, 2, 3, 5, 6, 7, and 8 decreased in percent positivity while regions 4, 9, and 10 remained stable during Week 17 compared to Week 16. The regions with the highest percent positivity were regions 7 (5.9%), 1 (5.0%), and 5 (4.4%). Nationally, influenza A(H1N1)pdm09, A(H3N2), and B/Victoria viruses are all co-circulating. However, the distribution of circulating viruses varies by region. For regional and state level data and age group distribution, please visit FluView Interactive. Viruses known to be associated with recent receipt of live attenuated influenza vaccine (LAIV) or found upon further testing to be a vaccine virus are not included, as they are not circulating influenza viruses. Clinical Laboratories


                            The results of tests performed by clinical laboratories nationwide are summarized below. Data from clinical laboratories (the percentage of specimens tested that are positive for influenza virus) are used to monitor whether influenza activity is increasing or decreasing.
                            No. of specimens tested 58,844 3,084,016
                            No. of positive specimens (%) 2,263 (3.8%) 339,304 (11.0%)
                            Positive specimens by type
                            Influenza A 1,323 (58.5%) 234,716 (69.2%)
                            Influenza B 940 (41.5%) 104,577 (30.8%)
                            Public Health Laboratories


                            The results of tests performed by public health laboratories nationwide are summarized below. Data from public health laboratories are used to monitor the proportion of circulating influenza viruses that belong to each influenza subtype/lineage.
                            No. of specimens tested 915 104,214
                            No. of positive specimens 157 34,456
                            Positive specimens by type/subtype
                            Influenza A 101 (64.3%) 26,333 (76.4%)
                            Subtyping Performed 69 (68.3%) 21,818 (82.9%)
                            (H1N1)pdm09 23 (33.3%) 15,115 (69.3%)
                            H3N2 46 (66.7%) 6,703 (30.7%)
                            H3N2v 0 (0.0%) 0 (0.0%)
                            Subtyping not performed 32 (31.7%) 4,515 (17.1%)
                            Influenza B 56 (35.7%) 8,123 (23.6%)
                            Lineage testing performed 29 (51.8%) 6,716 (82.7%)
                            Yamagata lineage 0 (0.0%) 0 (0.0%)
                            Victoria lineage 29 (100.0%) 6,716 (100.0%)
                            Lineage not performed 27 (48.2%) 1,407 (17.3%)


                            Additional virologic surveillance information for current and past seasons:
                            Surveillance Methods | FluView Interactive: National, Regional, and State Data or Age Data Influenza Virus Characterization


                            CDC performs genetic and antigenic characterization of U.S. viruses submitted from state and local public health laboratories according to the Right Size Roadmap submission guidance. These data are used to compare how similar the currently circulating influenza viruses are to the reference viruses representing viruses contained in the current influenza vaccines. The data are also used to monitor evolutionary changes that continually occur in influenza viruses circulating in humans. CDC also tests susceptibility of circulating influenza viruses to antiviral medications including the neuraminidase inhibitors (oseltamivir, zanamivir, and peramivir) and the PA endonuclease inhibitor baloxavir.

                            CDC has genetically characterized 4,012 influenza viruses collected since October 1, 2023.
                            A/H1 1,582
                            6B.1A.5a 1,582 (100%) 2a 366 (23.1%)
                            2a.1 1,216 (76.9%)
                            A/H3 1,293
                            3C.2a1b.2a 1,293 (100%) 2a.1b 1 (0.1%)
                            2a.3a 1 (0.1%)
                            2a.3a.1 1,290 (99.7%)
                            2b 1 (0.1%)
                            B/Victoria 1,137
                            V1A 1,137 (100%) 3a.2 1,137 (100%)
                            B/Yamagata 0
                            Y3 0 Y3 0 (0%)
                            CDC antigenically characterizes influenza viruses by hemagglutination inhibition (HI) (H1N1pdm09, H3N2, B/Victoria, and B/Yamagata viruses) or neutralization-based HINT (H3N2 viruses) using antisera that ferrets make after being infected with reference viruses representing the 2023-2024 Northern Hemisphere recommended cell or recombinant-based vaccine viruses. Antigenic differences between viruses are determined by comparing how well the antibodies made against the vaccine reference viruses recognize the circulating viruses that have been grown in cell culture. Ferret antisera are useful because antibodies raised against a particular virus can often recognize small changes in the surface proteins of other viruses. In HI assays, viruses with similar antigenic properties have antibody titer differences of less than or equal to 4-fold when compared to the reference (vaccine) virus. In HINT, viruses with similar antigenic properties have antibody neutralization titer differences of less than or equal to 8-fold. Viruses selected for antigenic characterization are a subset representing the genetic changes in the surface proteins seen in genetically characterized viruses.

                            Influenza A Viruses
                            • A (H1N1)pdm09: 325 A(H1N1)pdm09 viruses were antigenically characterized by HI, and all were well-recognized (reacting at titers that were within 4-fold of the homologous virus titer) by ferret antisera to cell-grown A/Wisconsin/67/2022-like reference viruses representing the A(H1N1)pdm09 component for the cell- and recombinant-based influenza vaccines.
                            • A (H3N2): 306 A(H3N2) viruses were antigenically characterized by HI or HINT, and 302 (98.7%) were well-recognized (reacting at titers that were within 4-fold of the homologous virus titer in HI or reacting at titers that were less than or equal to 8-fold of the homologous virus in HINT) by ferret antisera to cell-grown A/Darwin/6/2021-like reference viruses representing the A(H3N2) component for the cell- and recombinant-based influenza vaccines.

                            Influenza B Viruses
                            • B/Victoria: 235 influenza B/Victoria-lineage virus were antigenically characterized by HI, and all were well-recognized (reacting at titers that were within 4-fold of the homologous virus titer) by ferret antisera to cell-grown B/Austria/1359417/2021-like reference viruses representing the B/Victoria component for the cell- and recombinant-based influenza vaccines.
                            • B/Yamagata: No influenza B/Yamagata-lineage viruses were available for antigenic characterization.

                            Assessment of Virus Susceptibility to Antiviral Medications

                            CDC assesses susceptibility of influenza viruses to the antiviral medications including the neuraminidase inhibitors (oseltamivir, zanamivir, and peramivir) and the PA endonuclease inhibitor baloxavir using next generation sequence analysis supplemented by laboratory assays. Information about antiviral susceptibility test methods can be found at U.S. Influenza Surveillance: Purpose and Methods | CDC.

                            Viruses collected in the U.S. since October 1, 2023, were tested for antiviral susceptibility as follows:
                            Neuraminidase Inhibitors Oseltamivir Viruses Tested 4,011 1,585 1,293 1,133
                            Reduced Inhibition 1 (0.02%) 1 (0.06%) 0 (0.00%) 0 (0.00%)
                            Highly Reduced Inhibition 2 (0.05%) 2 (0.1%) 0 (0.00%) 0 (0.00%)
                            Peramivir Viruses Tested 4,011 1,585 1,293 1,133
                            Reduced Inhibition 0 (0.00%) 0 (0.00%) 0 (0.00%) 0 (0.00%)
                            Highly Reduced Inhibition 2 (0.05%) 2 (0.1%) 0 (0.00%) 0 (0.00%)
                            Zanamivir Viruses Tested 4,011 1,585 1,293 1,133
                            Reduced Inhibition 0 (0.00%) 0 (0.00%) 0 (0.00%) 0 (0.00%)
                            Highly Reduced Inhibition 0 (0.00%) 0 (0.00%) 0 (0.00%) 0 (0.00%)
                            PA Cap-Dependent Endonuclease Inhibitor Baloxavir Viruses Tested 3,887 1,534 1,254 1,099
                            Decreased Susceptibility 1 (0.03%) 0 (0.0%) 1 (0.1%) 0 (0.0%)
                            Two A(H1N1)pdm09 viruses had NA-H275Y amino acid substitution conferring highly reduced inhibition by oseltamivir and peramivir. One (H1N1)pdm09 virus had NA-I223V and NA-S247N amino acid substitutions and showed reduced inhibition by oseltamivir. One A(H3N2) virus had PA-I38T amino acid substitution and showed reduced susceptibility to baloxavir.

                            High levels of resistance to the adamantanes (amantadine and rimantadine) persist among influenza A(H1N1)pdm09 and influenza A(H3N2) viruses (the adamantanes are not effective against influenza B viruses). Therefore, use of these antivirals for treatment and prevention of influenza A virus infection is not recommended and data from adamantane resistance testing are not presented. Outpatient Respiratory Illness Surveillance


                            The U.S. Outpatient Influenza-like Illness Surveillance Network (ILINet) monitors outpatient visits for respiratory illness referred to as influenza-like illness [ILI (fever plus cough or sore throat)], not laboratory-confirmed influenza and will therefore capture respiratory illness visits due to infection with pathogens that can present with similar symptoms, including influenza viruses, SARS-CoV-2, and RSV. It is important to evaluate syndromic surveillance data, including that from ILINet, in the context of other sources of surveillance data to obtain a more complete and accurate picture of influenza, SARS-CoV-2, and other respiratory virus activity. CDC is providing integrated information about COVID-19, influenza, and RSV activity on a website that is updated weekly. Information about other respiratory virus activity can be found on CDC’s National Respiratory and Enteric Virus Surveillance System (NREVSS) website. Outpatient Respiratory Illness Visits


                            Nationally, during Week 17, 2.2% of patient visits reported through ILINet were due to respiratory illness that included fever plus a cough or sore throat, also referred to as ILI. This has remained stable (change of ≤ 0.1 percentage points) since Week 16 and is below the national baseline. The percentage of visits for ILI decreased in regions 1, 2, 7, and 8 and remained stable in regions 3, 4, 6, 9, and 10 in Week 17 compared to Week 16. All 10 regions are below their respective baselines. Multiple respiratory viruses are co-circulating, and the relative contribution of influenza virus infection to ILI varies by location.

                            Outpatient Respiratory Illness Visits by Age Group


                            About 70% of ILINet participants provide both the number of patient visits for respiratory illness and the total number of patient visits for the week broken out by age group. Data from this subset of providers are used to calculate the percentages of patient visits for respiratory illness by age group.

                            The percentage of visits for respiratory illness reported in ILINet remained stable in all age groups in Week 17 compared to Week 16.

                            Outpatient Respiratory Illness Activity Map


                            Data collected in ILINet are used to produce a measure of ILI activity* by state/jurisdiction and Core Based Statistical Areas (CBSA).
                            Week 17
                            (Week ending
                            Apr. 27, 2024)
                            Week 16
                            (Week ending
                            Apr. 20, 2024)
                            Week 17
                            (Week ending
                            Apr. 27, 2024)
                            Week 16
                            (Week ending
                            Apr. 20, 2024)
                            Very High 0 0 0 0
                            High 0 0 3 1
                            Moderate 0 1 4 11
                            Low 5 8 49 57
                            Minimal 49 45 645 639
                            Insufficient Data 1 1 228 221


                            *Data collected in ILINet may disproportionally represent certain populations within a jurisdiction or CBSA, and therefore, may not accurately depict the full picture of influenza activity for the entire jurisdiction or CBSA. Differences in the data presented here by CDC and independently by some health departments likely represent differing levels of data completeness with data presented by the health department likely being the more complete.

                            Additional information about medically attended visits for ILI for current and past seasons:
                            Surveillance Methods | FluView Interactive: National, Regional, and State Data or ILI Activity Map Hospitalization Surveillance

                            FluSurv-NET


                            The Influenza Hospitalization Surveillance Network (FluSurv-NET) conducts population-based surveillance for laboratory-confirmed influenza-related hospitalizations in select counties in 14 states and represents approximately 9% of the U.S. population. FluSurv-NET hospitalization data are preliminary. As data are received each week, prior case counts and rates are updated accordingly.

                            A total of 24,385 laboratory-confirmed influenza-associated hospitalizations were reported by FluSurv-NET sites between October 1, 2023, and April 27, 2024. The weekly hospitalization rate observed in Week 17 was 0.5 per 100,000 population. The weekly hospitalization rate observed during Week 52 is tied with the 2014-2015 season for the second highest peak weekly rate observed during all seasons going back to 2010-2011, and only lower than the 2017-2018 season. The overall cumulative hospitalization rate was 79.8 per 100,000 population. This cumulative hospitalization rate is the second highest cumulative hospitalization rate when compared against previous end-of-season rates for Week 17, and it is the second highest cumulative in-season hospitalization rate observed in Week 17, following the 2017-2018 season (106.0). Cumulative in-season hospitalization rates observed in Week 17, from 2010-2011 through 2022-2023 (excluding 2017-2018) ranged from 0.8 to 69.0.

                            When examining rates by age, the highest cumulative hospitalization rate per 100,000 population was among adults aged 65 years and older (218.2), followed by adults aged 50-64 years (94.7) and children aged 0-4 years (82.0). When examining age-adjusted rates by race and ethnicity, the highest rate of hospitalization per 100,000 population was among non-Hispanic Black persons (145.5), followed by non-Hispanic American Indian or Alaska Native persons (109.7), Hispanic persons (75.4), non-Hispanic White persons (61.6), and non-Hispanic Asian/Pacific Islander persons (42.9).

                            Among 24,385 hospitalizations, 20,666 (84.7%) were associated with influenza A virus, 3,546 (14.5%) with influenza B virus, 46 (0.2%) with influenza A virus and influenza B virus co-infection, and 127 (0.5%) with influenza virus for which the type was not determined. Among those with influenza A subtype information, 3,487 (69.9%) were A(H1N1) pdm09 and 1,501 (30.1%) were A(H3N2).

                            Among 3,450 hospitalized adults with information on underlying medical conditions, 95.6% had at least one reported underlying medical condition, the most commonly reported were hypertension, cardiovascular disease, obesity, and metabolic disease. Among 1,509 hospitalized women of childbearing age (15-49 years) with information on pregnancy status, 22.7% were pregnant. Among 1,015 hospitalized children with information on underlying medical conditions, 68.6% had at least one reported underlying medical condition; the most commonly reported was asthma, followed by obesity and neurologic disease.


                            In these figures, cumulative and weekly rates for all seasons prior to the 2023-2024 season reflect end-of-season rates. For the 2023-2024 season, rates for recent hospitals admissions are subject to reporting delays. As hospitalization data are reviewed each week, prior case counts and rates are updated accordingly.

                            Additional FluSurv-NET hospitalization surveillance information for current and past seasons and additional age groups:
                            Surveillance Methods |FluView Interactive: Rates by Age, Sex, and Race/Ethnicity or Data on Patient Characteristics | RESP-NET Interactive National Healthcare Safety Network (NHSN) Hospitalization Surveillance


                            Hospitals report to NHSN the weekly number of patients admitted with laboratory-confirmed influenza. During Week 17, 2,302 patients with laboratory-confirmed influenza were admitted to a hospital. The number of patients admitted to a hospital with laboratory-confirmed influenza for Week 17 decreased (change of >5%) compared to Week 16 nationally and in regions 1, 2, 3, 4, 5, 6, 7, and 8. The number of hospitalizations reported in regions 9 and 10 increased slightly compared to last week.

                            Effective May 1, 2024, hospitals are no longer required to report hospital admissions, hospital capacity, or hospital occupancy data to HHS through NHSN. After May 3, 2024, the NHSN flu hospitalization data will not be included in FluView/FluView Interactive for the remainder of the 2023-2024 season.


                            Additional NHSN Hospitalization Surveillance information:
                            Surveillance Methods | Additional Data | FluView Interactive Mortality Surveillance

                            National Center for Health Statistics (NCHS) Mortality Surveillance


                            Based on NCHS mortality surveillance data available on May 2, 2024, 0.2% of the deaths that occurred during the week ending April 27, 2024 (Week 17), were due to influenza. This percentage decreased (≥ 0.1 percentage point change) compared to Week 16. The data presented are preliminary and may change as more data are received and processed.


                            Additional pneumonia, influenza and COVID-19 mortality surveillance information for current and past seasons:
                            Surveillance Methods | FluView Interactive Influenza-Associated Pediatric Mortality


                            Ten influenza-associated pediatric deaths occurring during the 2023-2024 season were reported to CDC during Week 17. The deaths occurred between weeks 1 and 10 (the weeks ending January 6, 2024, and March 9, 2024) and during Week 16 (the week ending April 20, 2024). Six deaths were associated with influenza A viruses. Four of the influenza A viruses had subtyping performed; three were A(pdm09H1N1) viruses and one was an A(H3N2) virus. Three deaths were associated with influenza B viruses with no lineage determined. Lastly, one death was associated with a co-infection of influenza A and B viruses.


                            Additional pediatric mortality surveillance information for current and past seasons:
                            Surveillance Methods | FluView Interactive Trend Indicators


                            Increasing:
                            Decreasing:
                            Stable: Indicators Status by System


                            Clinical Labs: Up or down arrows indicate a change of greater than or equal to 0.5 percentage points in the percent of specimens positive for influenza compared to the previous week.
                            Outpatient Respiratory Illness (ILINet): Up or down arrows indicate a change of greater than 0.1 percentage points in the percent of visits due to respiratory illness (ILI) compared to the previous week.
                            NHSN Hospitalizations: Up or down arrows indicate change of greater than or equal to 5% of the number of patients admitted with laboratory-confirmed influenza compared to the previous week.
                            NCHS Mortality: Up or down arrows indicate change of greater than 0.1 percentage points of the percent of deaths due to influenza compared to the previous week. Reference Footnotes


                            1U.S. Influenza Surveillance: Purpose and Methods (2023 Oct). Centers for Disease Control and Prevention. https://www.cdc.gov/flu/weekly/overview.htm#ILINet.

                            2Grohskopf LA, Blanton LH, Ferdinands JM, Chung JR, Broder KR, Talbot HK. Prevention and Control of Seasonal Influenza with Vaccines: Recommendations of the Advisory Committee on Immunization Practices — United States, 2023–24 Influenza Season. MMWR Recomm Rep 2023;72(No. RR-2):1–25. DOI: http://dx.doi.org/10.15585/mmwr.rr7202a1

                            3Influenza Antiviral Medications: Summary for Clinicians (2023 Sept). Centers for Disease Control and Prevention. https://www.cdc.gov/flu/professional...clinicians.htm.

                            Additional National and International Influenza Surveillance Information


                            FluView Interactive: FluView includes enhanced web-based interactive applications that can provide dynamic visuals of the influenza data collected and analyzed by CDC. These FluView Interactive applications allow people to create customized, visual interpretations of influenza data, as well as make comparisons across flu seasons, regions, age groups and a variety of other demographics.

                            National Institute for Occupational Safety and Health: Monthly surveillance data on the prevalence of health-related workplace absenteeism among full-time workers in the United States are available from NIOSH.
                            https://www.cdc.gov/flu/weekly/index.htm
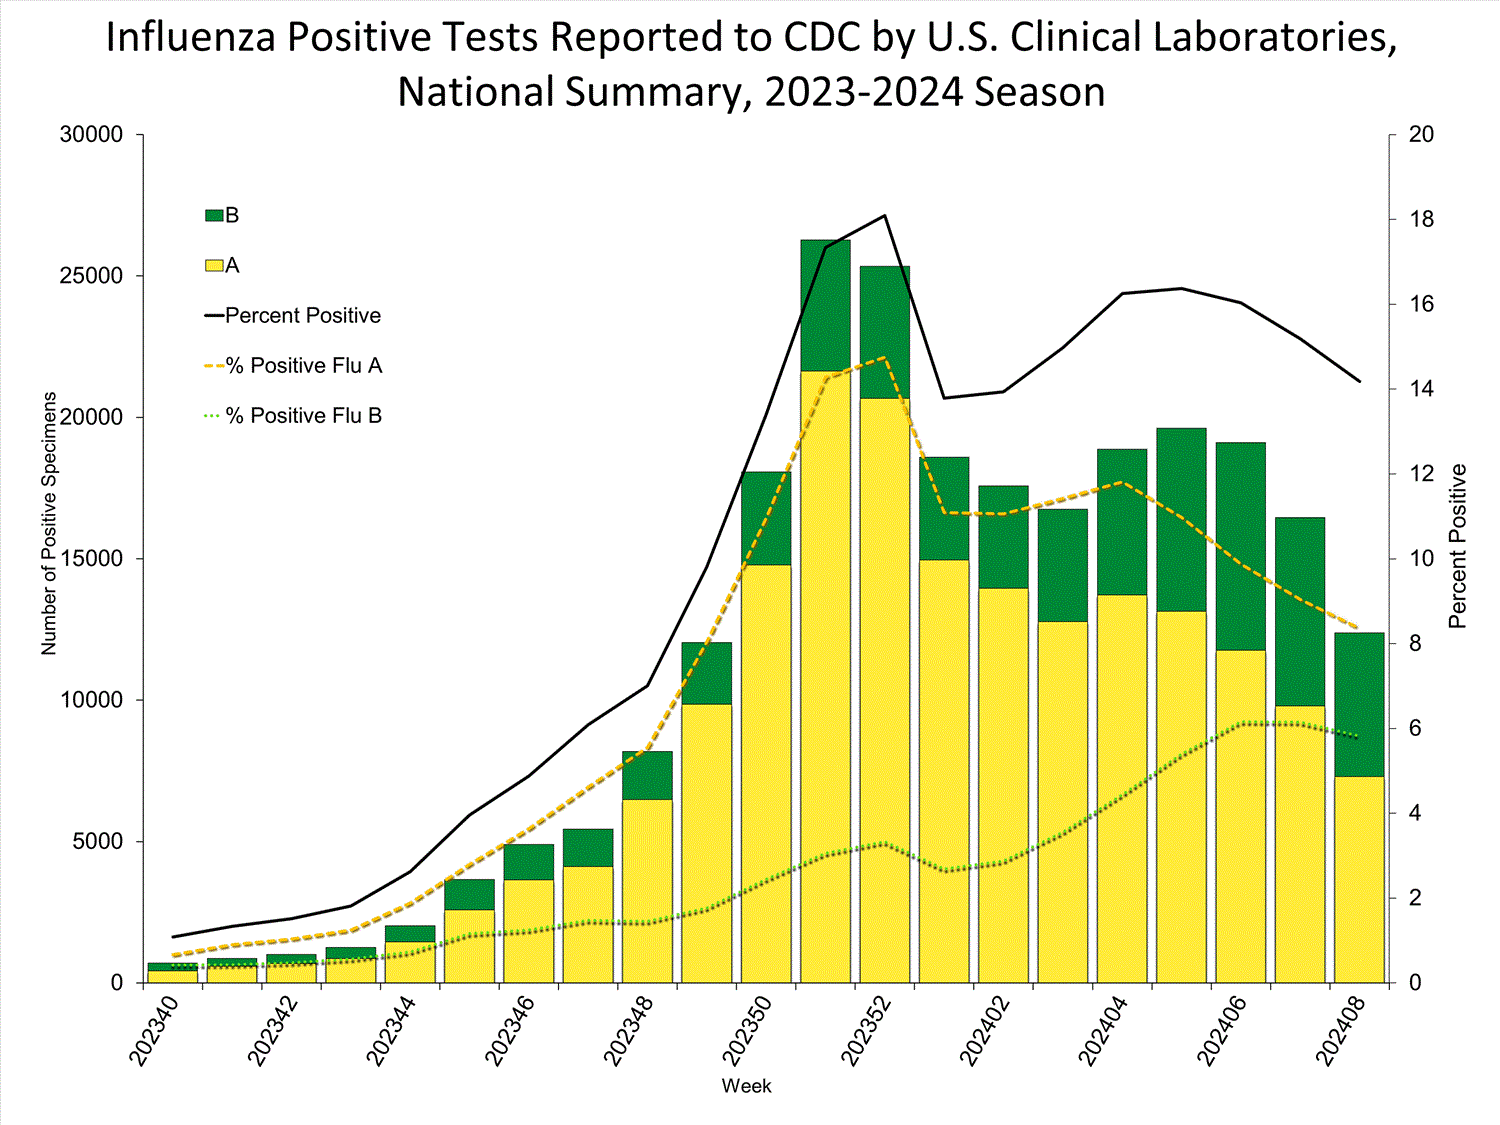
                            Comment


                            • #29
                              Weekly U.S. Influenza Surveillance Report


                              Print
                              Updated May 10, 2024

                              Key Updates for Week 18, ending May 4, 2024

                              Seasonal influenza activity continues to decline in most areas of the country. Viruses


                              Clinical Lab 3.1%

                              (Trend )


                              positive for influenza
                              this week


                              Public Health Lab
                              Influenza A(H1N1)pdm09, A(H3N2), and B viruses were all co-circulating this week.

                              Virus Characterization
                              Genetic and antigenic characterization and antiviral susceptibility are summarized in this report. Illness


                              Outpatient Respiratory Illness 2.1%

                              (Trend )


                              of visits to a health care provider this week were for respiratory illness
                              (below baseline).


                              Outpatient Respiratory Illness: Activity Map
                              This week no jurisdictions experienced moderate, high, or very high activity.

                              FluSurv-NET 80.3 per 100,000


                              cumulative hospitalization rate.

                              NHSN Hospitalizations
                              Mandatory reporting is no longer required.

                              NCHS Mortality 0.2%

                              (Trend )


                              of deaths attributed to influenza this week.

                              Pediatric Deaths 7


                              influenza-associated deaths were reported (1 occurred during 2022-2023 season and 6 occurred during 2023-2024 season)

                              All data are preliminary and may change as more reports are received.

                              Directional arrows indicate changes between the current week and the previous week. Additional information on the arrows can be found at the bottom of this page.

                              A description of the CDC influenza surveillance system, including methodology and detailed descriptions of each data component is available on the surveillance methods page.

                              Additional information on the current and previous influenza seasons for each surveillance component are available on FluView Interactive.

                              Key Points
                              • Seasonal influenza activity continues to decline nationally and in most areas of the country.
                              • Nationally, outpatient respiratory illness remained stable and is below baseline for the fifth week in a row.1 All 10 HHS regions are below their region-specific baselines.
                              • During Week 18, of the 109 viruses reported by public health laboratories, 77 (70.6%) were influenza A and 32 (29.4%) were influenza B. Of the 54 influenza A viruses subtyped during Week 18, 25 (46.3%) were influenza A(H1N1)pdm09 and 29 (53.7%) were A(H3N2).
                              • Six influenza-associated pediatric deaths occurring during the 2023-2024 season were reported to CDC during Week 18, bringing the season total to 164 pediatric deaths.
                              • CDC estimates that there have been at least 34 million illnesses, 380,000 hospitalizations, and 24,000 deaths from flu so far this season.
                              • CDC recommends that everyone 6 months and older get an annual flu vaccine as long as flu activity continues.2
                              • There also are prescription flu antiviral drugs that can treat flu illness; those should be started as early as possible and are especially important for higher risk patients.3
                              • Flu viruses are among several viruses contributing to respiratory disease activity. CDC is providing updated, integrated information about COVID-19, flu, and RSV activity on a weekly basis.
                              U.S. Virologic Surveillance


                              Nationally, the percentage of respiratory specimens testing positive for influenza in clinical laboratories decreased (change of >0.5 percentage points) compared to the previous week. Regions 3, 5, 7, and 10 decreased in percent positivity while regions 1, 2, 4, 6, 8, and 9 remained stable during Week 18 compared to Week 17. The regions with the highest percent positivity were regions 1 (4.9%), 7 (4.4%), and 9 (3.9%). Nationally, influenza A(H1N1)pdm09, A(H3N2), and B/Victoria viruses are all co-circulating. However, the distribution of circulating viruses varies by region. For regional and state level data and age group distribution, please visit FluView Interactive. Viruses known to be associated with recent receipt of live attenuated influenza vaccine (LAIV) or found upon further testing to be a vaccine virus are not included, as they are not circulating influenza viruses. Clinical Laboratories


                              The results of tests performed by clinical laboratories nationwide are summarized below. Data from clinical laboratories (the percentage of specimens tested that are positive for influenza virus) are used to monitor whether influenza activity is increasing or decreasing.
                              No. of specimens tested 46,245 3,117,205
                              No. of positive specimens (%) 1,426 (3.1%) 340,899 (10.9%)
                              Positive specimens by type
                              Influenza A 839 (58.8%) 235,659 (69.1%)
                              Influenza B 587 (41.2%) 105,229 (30.9%)
                              Public Health Laboratories


                              The results of tests performed by public health laboratories nationwide are summarized below. Data from public health laboratories are used to monitor the proportion of circulating influenza viruses that belong to each influenza subtype/lineage.
                              No. of specimens tested 787 105,685
                              No. of positive specimens 109 34,984
                              Positive specimens by type/subtype
                              Influenza A 77 (70.6%) 26,681 (76.3%)
                              Subtyping Performed 54 (70.1%) 22,074 (82.7%)
                              (H1N1)pdm09 25 (46.3%) 15,231 (69.0%)
                              H3N2 29 (53.7%) 6,843 (31.0%)
                              H3N2v 0 (0.0%) 0 (0.0%)
                              Subtyping not performed 23 (29.9%) 4,607 (17.3%)
                              Influenza B 32 (29.4%) 8,303 (23.7%)
                              Lineage testing performed 18 (56.3%) 6,884 (82.9%)
                              Yamagata lineage 0 (0.0%) 0 (0.0%)
                              Victoria lineage 18 (100.0%) 6,884 (100.0%)
                              Lineage not performed 14 (43.8%) 1,419 (17.1%)


                              Additional virologic surveillance information for current and past seasons:
                              Surveillance Methods | FluView Interactive: National, Regional, and State Data or Age Data Influenza Virus Characterization


                              CDC performs genetic and antigenic characterization of U.S. viruses submitted from state and local public health laboratories according to the Right Size Roadmap submission guidance. These data are used to compare how similar the currently circulating influenza viruses are to the reference viruses representing viruses contained in the current influenza vaccines. The data are also used to monitor evolutionary changes that continually occur in influenza viruses circulating in humans. CDC also tests susceptibility of circulating influenza viruses to antiviral medications including the neuraminidase inhibitors (oseltamivir, zanamivir, and peramivir) and the PA endonuclease inhibitor baloxavir.

                              CDC has genetically characterized 4,257 influenza viruses collected since October 1, 2023.
                              A/H1 1,638
                              6B.1A.5a 1,638 (100%) 2a 375 (22.9%)
                              2a.1 1,263 (77.1%)
                              A/H3 1,429
                              3C.2a1b.2a 1,429 (100%) 2a.1b 1 (0.1%)
                              2a.3a 1 (0.1%)
                              2a.3a.1 1,426 (99.8%)
                              2b 1 (0.1%)
                              B/Victoria 1,190
                              V1A 1,190 (100%) 3a.2 1,190 (100%)
                              B/Yamagata 0
                              Y3 0 Y3 0 (0%)
                              CDC antigenically characterizes influenza viruses by hemagglutination inhibition (HI) (H1N1pdm09, H3N2, B/Victoria, and B/Yamagata viruses) or neutralization-based HINT (H3N2 viruses) using antisera that ferrets make after being infected with reference viruses representing the 2023-2024 Northern Hemisphere recommended cell or recombinant-based vaccine viruses. Antigenic differences between viruses are determined by comparing how well the antibodies made against the vaccine reference viruses recognize the circulating viruses that have been grown in cell culture. Ferret antisera are useful because antibodies raised against a particular virus can often recognize small changes in the surface proteins of other viruses. In HI assays, viruses with similar antigenic properties have antibody titer differences of less than or equal to 4-fold when compared to the reference (vaccine) virus. In HINT, viruses with similar antigenic properties have antibody neutralization titer differences of less than or equal to 8-fold. Viruses selected for antigenic characterization are a subset representing the genetic changes in the surface proteins seen in genetically characterized viruses.

                              Influenza A Viruses
                              • A (H1N1)pdm09: 364 A(H1N1)pdm09 viruses were antigenically characterized by HI, and all were well-recognized (reacting at titers that were within 4-fold of the homologous virus titer) by ferret antisera to cell-grown A/Wisconsin/67/2022-like reference viruses representing the A(H1N1)pdm09 component for the cell- and recombinant-based influenza vaccines.
                              • A (H3N2): 349 A(H3N2) viruses were antigenically characterized by HI or HINT, and 342 (98.0%) were well-recognized (reacting at titers that were within 4-fold of the homologous virus titer in HI or reacting at titers that were less than or equal to 8-fold of the homologous virus in HINT) by ferret antisera to cell-grown A/Darwin/6/2021-like reference viruses representing the A(H3N2) component for the cell- and recombinant-based influenza vaccines.

                              Influenza B Viruses
                              • B/Victoria: 264 influenza B/Victoria-lineage virus were antigenically characterized by HI, and all were well-recognized (reacting at titers that were within 4-fold of the homologous virus titer) by ferret antisera to cell-grown B/Austria/1359417/2021-like reference viruses representing the B/Victoria component for the cell- and recombinant-based influenza vaccines.
                              • B/Yamagata: No influenza B/Yamagata-lineage viruses were available for antigenic characterization.

                              Assessment of Virus Susceptibility to Antiviral Medications

                              CDC assesses susceptibility of influenza viruses to the antiviral medications including the neuraminidase inhibitors (oseltamivir, zanamivir, and peramivir) and the PA endonuclease inhibitor baloxavir using next generation sequence analysis supplemented by laboratory assays. Information about antiviral susceptibility test methods can be found at U.S. Influenza Surveillance: Purpose and Methods | CDC.

                              Viruses collected in the U.S. since October 1, 2023, were tested for antiviral susceptibility as follows:
                              Neuraminidase Inhibitors Oseltamivir Viruses Tested 4,261 1,642 1,432 1,187
                              Reduced Inhibition 1 (0.02%) 1 (0.1%) 0 (0.00%) 0 (0.00%)
                              Highly Reduced Inhibition 2 (0.05%) 2 (0.1%) 0 (0.00%) 0 (0.00%)
                              Peramivir Viruses Tested 4,261 1,642 1,432 1,187
                              Reduced Inhibition 0 (0.00%) 0 (0.00%) 0 (0.00%) 0 (0.00%)
                              Highly Reduced Inhibition 2 (0.05%) 2 (0.1%) 0 (0.00%) 0 (0.00%)
                              Zanamivir Viruses Tested 4,261 1,642 1,432 1,187
                              Reduced Inhibition 0 (0.00%) 0 (0.00%) 0 (0.00%) 0 (0.00%)
                              Highly Reduced Inhibition 0 (0.00%) 0 (0.00%) 0 (0.00%) 0 (0.00%)
                              PA Cap-Dependent Endonuclease Inhibitor Baloxavir Viruses Tested 4,139 1,589 1,394 1,156
                              Decreased Susceptibility 1 (0.02%) 0 (0.0%) 1 (0.1%) 0 (0.0%)
                              Two A(H1N1)pdm09 viruses had NA-H275Y amino acid substitution conferring highly reduced inhibition by oseltamivir and peramivir. One (H1N1)pdm09 virus had NA-I223V and NA-S247N amino acid substitutions and showed reduced inhibition by oseltamivir. One A(H3N2) virus had PA-I38T amino acid substitution and showed reduced susceptibility to baloxavir.

                              High levels of resistance to the adamantanes (amantadine and rimantadine) persist among influenza A(H1N1)pdm09 and influenza A(H3N2) viruses (the adamantanes are not effective against influenza B viruses). Therefore, use of these antivirals for treatment and prevention of influenza A virus infection is not recommended and data from adamantane resistance testing are not presented. Outpatient Respiratory Illness Surveillance


                              The U.S. Outpatient Influenza-like Illness Surveillance Network (ILINet) monitors outpatient visits for respiratory illness referred to as influenza-like illness [ILI (fever plus cough or sore throat)], not laboratory-confirmed influenza and will therefore capture respiratory illness visits due to infection with pathogens that can present with similar symptoms, including influenza viruses, SARS-CoV-2, and RSV. It is important to evaluate syndromic surveillance data, including that from ILINet, in the context of other sources of surveillance data to obtain a more complete and accurate picture of influenza, SARS-CoV-2, and other respiratory virus activity. CDC is providing integrated information about COVID-19, influenza, and RSV activity on a website that is updated weekly. Information about other respiratory virus activity can be found on CDC’s National Respiratory and Enteric Virus Surveillance System (NREVSS) website. Outpatient Respiratory Illness Visits


                              Nationally, during Week 18, 2.1% of patient visits reported through ILINet were due to respiratory illness that included fever plus a cough or sore throat, also referred to as ILI. This has remained stable (change of ≤ 0.1 percentage points) since Week 17 and is below the national baseline. The percentage of visits for ILI decreased in regions 5 and 7 and remained stable in all other regions in Week 18 compared to Week 17. All 10 regions are below their respective baselines. Multiple respiratory viruses are co-circulating, and the relative contribution of influenza virus infection to ILI varies by location.

                              Outpatient Respiratory Illness Visits by Age Group


                              About 70% of ILINet participants provide both the number of patient visits for respiratory illness and the total number of patient visits for the week broken out by age group. Data from this subset of providers are used to calculate the percentages of patient visits for respiratory illness by age group.

                              The percentage of visits for respiratory illness reported in ILINet remained stable in all age groups in Week 18 compared to Week 17.

                              Outpatient Respiratory Illness Activity Map


                              Data collected in ILINet are used to produce a measure of ILI activity* by state/jurisdiction and Core Based Statistical Areas (CBSA).
                              Week 18
                              (Week ending
                              May 4, 2024)
                              Week 17
                              (Week ending
                              Apr. 27, 2024)
                              Week 18
                              (Week ending
                              May 4, 2024)
                              Week 17
                              (Week ending
                              Apr. 27, 2024)
                              Very High 0 0 0 0
                              High 0 0 1 4
                              Moderate 0 0 6 3
                              Low 3 6 32 49
                              Minimal 52 49 654 649
                              Insufficient Data 0 0 236 224


                              *Data collected in ILINet may disproportionally represent certain populations within a jurisdiction or CBSA, and therefore, may not accurately depict the full picture of influenza activity for the entire jurisdiction or CBSA. Differences in the data presented here by CDC and independently by some health departments likely represent differing levels of data completeness with data presented by the health department likely being the more complete.

                              Additional information about medically attended visits for ILI for current and past seasons:
                              Surveillance Methods | FluView Interactive: National, Regional, and State Data or ILI Activity Map Hospitalization Surveillance

                              FluSurv-NET


                              The Influenza Hospitalization Surveillance Network (FluSurv-NET) conducts population-based surveillance for laboratory-confirmed influenza-related hospitalizations in select counties in 14 states and represents approximately 9% of the U.S. population. FluSurv-NET hospitalization data are preliminary. As data are received each week, prior case counts and rates are updated accordingly.

                              A total of 24,547 laboratory-confirmed influenza-associated hospitalizations were reported by FluSurv-NET sites between October 1, 2023, and May 4, 2024. The weekly hospitalization rate observed in Week 18 was 0.3 per 100,000 population The weekly hospitalization rate observed during Week 52 is tied with the 2014-2015 season for the second highest peak weekly rate observed during all seasons going back to 2010-2011, and only lower than the 2017-2018 season. The overall cumulative hospitalization rate was 80.3 per 100,000 population. This cumulative hospitalization rate is the second highest cumulative hospitalization rate when compared against previous end-of-season rates for Week 18, and it is the second highest cumulative in-season hospitalization rate observed in Week 18, following the 2017-2018 season (106.7). Cumulative in-season hospitalization rates observed in Week 18, from 2010-2011 through 2022-2023 (excluding the 2017-2018 season) ranged from 0.8 to 69.4.

                              When examining rates by age, the highest cumulative hospitalization rate per 100,000 population was among adults aged 65 years and older (219.8) followed by adults aged 50-64 years (95.2) and children aged 0-4 years (82.6). When examining age-adjusted rates by race and ethnicity, the highest rate of hospitalization per 100,000 population was among non-Hispanic Black persons (146.1), followed by non-Hispanic American Indian or Alaska Native persons (110.9), Hispanic persons (76.0), non-Hispanic White persons (62.1), and non-Hispanic Asian/Pacific Islander persons (43.3).

                              Among 24,547 hospitalizations, 20,782 (84.7%) were associated with influenza A virus, 3,588 (14.6%) with influenza B virus, 48 (0.2%) with influenza A virus and influenza B virus co-infection, and 125 (0.5%) with influenza virus for which the type was not determined. Among those with influenza A subtype information, 3,551 (69.4%) were A(H1N1) pdm09 and 1,566 (30.6%) were A(H3N2).

                              Among 3,689 hospitalized adults with information on underlying medical conditions, 95.4% had at least one reported underlying medical condition, the most commonly reported were hypertension, cardiovascular disease, obesity, and metabolic disease. Among 1,553 hospitalized women of childbearing age (15-49 years) with information on pregnancy status, 22.7% were pregnant. Among 1,049 hospitalized children with information on underlying medical conditions, 67.9% had at least one reported underlying medical condition; the most commonly reported was asthma, followed by obesity and neurologic disease.


                              In these figures, cumulative and weekly rates for all seasons prior to the 2023-2024 season reflect end-of-season rates. For the 2023-2024 season, rates for recent hospitals admissions are subject to reporting delays. As hospitalization data are reviewed each week, prior case counts and rates are updated accordingly.

                              Additional FluSurv-NET hospitalization surveillance information for current and past seasons and additional age groups:
                              Surveillance Methods |FluView Interactive: Rates by Age, Sex, and Race/Ethnicity or Data on Patient Characteristics | RESP-NET Interactive National Healthcare Safety Network (NHSN) Hospitalization Surveillance


                              Effective May 1, 2024, hospitals are no longer required to report hospital admissions, hospital capacity, or hospital occupancy data to HHS through NHSN. After May 3, 2024, NHSN flu hospitalization data will not be included in FluView/FluView Interactive for the remainder of the 2023-2024 season.

                              Additional NHSN Hospitalization Surveillance information:
                              Surveillance Methods | Additional Data | FluView Interactive Mortality Surveillance

                              National Center for Health Statistics (NCHS) Mortality Surveillance


                              Based on NCHS mortality surveillance data available on May 9, 2024, 0.2% of the deaths that occurred during the week ending May 4, 2024 (Week 18), were due to influenza. This percentage remained stable (< 0.1 percentage point change) compared to Week 17. The data presented are preliminary and may change as more data are received and processed.


                              Additional pneumonia, influenza and COVID-19 mortality surveillance information for current and past seasons:
                              Surveillance Methods | FluView Interactive Influenza-Associated Pediatric Mortality


                              Seven influenza-associated pediatric deaths were reported to CDC during Week 18.

                              Six deaths occurred during the 2023-2024 season, bringing the total pediatric deaths for this season to 164. The deaths occurred during Week 49 of 2023 (the week ending December 9, 2023) and between weeks 7 and 14 of 2024 (the weeks ending February 17, 2024, and April 6, 2024). Two deaths were associated with influenza A viruses and four deaths were associated with influenza B viruses with no lineage determined. One of the influenza A viruses had subtyping performed and it was an A(H3N2) virus.

                              One death occurring during the 2022-2023 season was also reported, which brings the total number of pediatric deaths for last season to 185. The death was associated with an influenza A(H3N2) virus and occurred during Week 45 of 2022 (the week ending November 12, 2022).


                              Additional pediatric mortality surveillance information for current and past seasons:
                              Surveillance Methods | FluView Interactive Trend Indicators


                              Increasing:
                              Decreasing:
                              Stable: Indicators Status by System


                              Clinical Labs: Up or down arrows indicate a change of greater than or equal to 0.5 percentage points in the percent of specimens positive for influenza compared to the previous week.
                              Outpatient Respiratory Illness (ILINet): Up or down arrows indicate a change of greater than 0.1 percentage points in the percent of visits due to respiratory illness (ILI) compared to the previous week.
                              NHSN Hospitalizations: Up or down arrows indicate change of greater than or equal to 5% of the number of patients admitted with laboratory-confirmed influenza compared to the previous week.
                              NCHS Mortality: Up or down arrows indicate change of greater than 0.1 percentage points of the percent of deaths due to influenza compared to the previous week. Reference Footnotes


                              1U.S. Influenza Surveillance: Purpose and Methods (2023 Oct). Centers for Disease Control and Prevention. https://www.cdc.gov/flu/weekly/overview.htm#ILINet.

                              2Grohskopf LA, Blanton LH, Ferdinands JM, Chung JR, Broder KR, Talbot HK. Prevention and Control of Seasonal Influenza with Vaccines: Recommendations of the Advisory Committee on Immunization Practices — United States, 2023–24 Influenza Season. MMWR Recomm Rep 2023;72(No. RR-2):1–25. DOI: http://dx.doi.org/10.15585/mmwr.rr7202a1

                              3Influenza Antiviral Medications: Summary for Clinicians (2023 Sept). Centers for Disease Control and Prevention. https://www.cdc.gov/flu/professional...clinicians.htm.

                              Additional National and International Influenza Surveillance Information


                              FluView Interactive: FluView includes enhanced web-based interactive applications that can provide dynamic visuals of the influenza data collected and analyzed by CDC. These FluView Interactive applications allow people to create customized, visual interpretations of influenza data, as well as make comparisons across flu seasons, regions, age groups and a variety of other demographics.

                              National Institute for Occupational Safety and Health: Monthly surveillance data on the prevalence of health-related workplace absenteeism among full-time workers in the United States are available from NIOSH.
                              https://www.cdc.gov/flu/weekly/index.htm
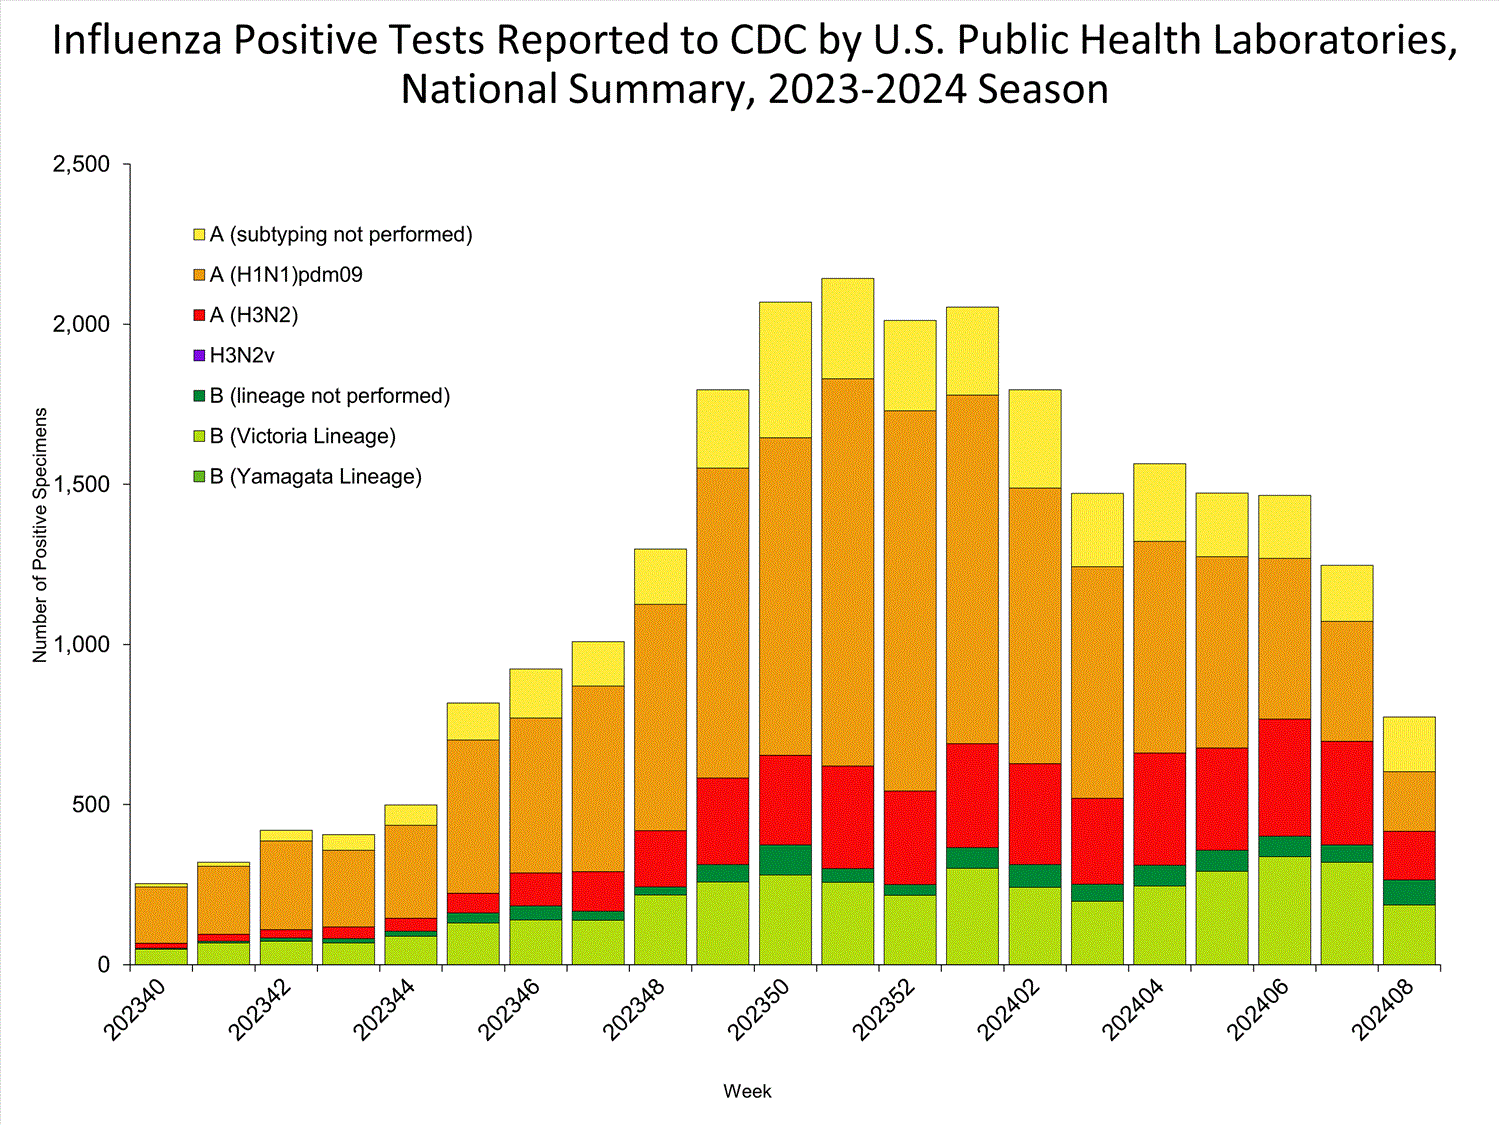
                              Comment


                              • #30
                                Weekly U.S. Influenza Surveillance Report


                                Print
                                Updated May 17, 2024

                                Key Updates for Week 19, ending May 11, 2024

                                Seasonal influenza activity is low nationally. Viruses


                                Clinical Lab 2.4%

                                (Trend )


                                positive for influenza
                                this week


                                Public Health Lab
                                Influenza A(H1N1)pdm09, A(H3N2), and B viruses were all co-circulating this week.

                                Virus Characterization
                                Genetic and antigenic characterization and antiviral susceptibility are summarized in this report. Illness


                                Outpatient Respiratory Illness 2.0%

                                (Trend )


                                of visits to a health care provider this week were for respiratory illness
                                (below baseline).


                                Outpatient Respiratory Illness: Map
                                This week no jurisdictions experienced moderate, high, or very high activity.

                                FluSurv-NET 80.6 per 100,000


                                cumulative hospitalization rate.

                                NCHS Mortality 0.1%

                                (Trend )


                                of deaths attributed to influenza this week.

                                Pediatric Deaths 3


                                influenza-associated deaths were reported this week for a total of 167 deaths this season.

                                All data are preliminary and may change as more reports are received.

                                Directional arrows indicate changes between the current week and the previous week. Additional information on the arrows can be found at the bottom of this page.

                                A description of the CDC influenza surveillance system, including methodology and detailed descriptions of each data component is available on the surveillance methods page.

                                Additional information on the current and previous influenza seasons for each surveillance component are available on FluView Interactive.

                                Key Points
                                • Seasonal influenza activity is low nationally.
                                • Nationally, outpatient respiratory illness remained stable and is below baseline for the sixth week in a row.1 All 10 HHS regions are below their region-specific baselines.
                                • During Week 19, of the 94 viruses reported by public health laboratories, 57 (60.6%) were influenza A and 37 (39.4%) were influenza B. Of the 43 influenza A viruses subtyped during Week 19, 17 (39.5%) were influenza A(H1N1)pdm09 and 26 (60.5%) were A(H3N2).
                                • Three influenza-associated pediatric deaths were reported to CDC during Week 19, bringing the season total to 167 pediatric deaths.
                                • CDC estimates that there have been at least 35 million illnesses, 390,000 hospitalizations, and 24,000 deaths from flu so far this season.
                                • CDC recommends that everyone 6 months and older get an annual flu vaccine as long as flu activity continues.2
                                • There also are prescription flu antiviral drugs that can treat flu illness; those should be started as early as possible and are especially important for higher risk patients.3
                                • Seasonal flu viruses are among several viruses contributing to respiratory disease activity. CDC is providing updated, integrated information about COVID-19, flu, and RSV activity on a weekly basis.
                                U.S. Virologic Surveillance


                                Nationally, the percentage of respiratory specimens testing positive for influenza in clinical laboratories decreased (change of >0.5 percentage points) compared to the previous week. Regions 1, 2, 3, 5, 6, 7, and 8 decreased in percent positivity while regions 4 and 9 remained stable and Region 10 increased slightly during Week 19 compared to Week 18. The regions with the highest percent positivity were regions 10 (4.4%), 9 (4.0%), and 7 (3.1%). Nationally, influenza A(H1N1)pdm09, A(H3N2), and B/Victoria viruses are all co-circulating. However, the distribution of circulating viruses varies by region. For regional and state level data and age group distribution, please visit FluView Interactive. Viruses known to be associated with recent receipt of live attenuated influenza vaccine (LAIV) or found upon further testing to be a vaccine virus are not included, as they are not circulating influenza viruses. Clinical Laboratories


                                The results of tests performed by clinical laboratories nationwide are summarized below. Data from clinical laboratories (the percentage of specimens tested that are positive for influenza virus) are used to monitor whether influenza activity is increasing or decreasing.
                                No. of specimens tested 44,071 3,208,299
                                No. of positive specimens (%) 1,048 (2.4%) 343,365 (10.7%)
                                Positive specimens by type
                                Influenza A 676 (64.5%) 236,845 (69.0%)
                                Influenza B 372 (35.5%) 106,509 (31.0%)
                                Public Health Laboratories


                                The results of tests performed by public health laboratories nationwide are summarized below. Data from public health laboratories are used to monitor the proportion of circulating influenza viruses that belong to each influenza subtype/lineage.
                                No. of specimens tested 796 107,016
                                No. of positive specimens 94 35,385
                                Positive specimens by type/subtype
                                Influenza A 57 (60.6%) 26,958 (76.2%)
                                Subtyping Performed 43 (75.4%) 22,327 (82.8%)
                                (H1N1)pdm09 17 (39.5%) 15,333 (68.7%)
                                H3N2 26 (60.5%) 6,994 (31.3%)
                                H3N2v 0 (0.0%) 0 (0.0%)
                                Subtyping not performed 14 (24.6%) 4,631 (17.2%)
                                Influenza B 37 (39.4%) 8,427 (23.8%)
                                Lineage testing performed 13 (35.1%) 6,994 (83.0%)
                                Yamagata lineage 0 (0.0%) 0 (0.0%)
                                Victoria lineage 13 (100.0%) 6,994 (100.0%)
                                Lineage not performed 24 (64.9%) 1,433 (17.0%)


                                Additional virologic surveillance information for current and past seasons:
                                Surveillance Methods | FluView Interactive: National, Regional, and State Data or Age Data Influenza Virus Characterization


                                CDC performs genetic and antigenic characterization of U.S. viruses submitted from state and local public health laboratories according to the Right Size Roadmap submission guidance. These data are used to compare how similar the currently circulating influenza viruses are to the reference viruses representing viruses contained in the current influenza vaccines. The data are also used to monitor evolutionary changes that continually occur in influenza viruses circulating in humans. CDC also tests susceptibility of circulating influenza viruses to antiviral medications including the neuraminidase inhibitors (oseltamivir, zanamivir, and peramivir) and the PA endonuclease inhibitor baloxavir.

                                CDC has genetically characterized 4,374 influenza viruses collected since October 1, 2023.
                                A/H1 1,673
                                6B.1A.5a 1,673 (100%) 2a 387 (23.1%)
                                2a.1 1,286 (76.9%)
                                A/H3 1,466
                                3C.2a1b.2a 1,466 (100%) 2a.1b 1 (0.1%)
                                2a.3a 1 (0.1%)
                                2a.3a.1 1,463 (99.8%)
                                2b 1 (0.1%)
                                B/Victoria 1,235
                                V1A 1,235 (100%) 3a.2 1,235 (100%)
                                B/Yamagata 0
                                Y3 0 Y3 0 (0%)
                                CDC antigenically characterizes influenza viruses by hemagglutination inhibition (HI) (H1N1pdm09, H3N2, B/Victoria, and B/Yamagata viruses) or neutralization-based HINT (H3N2 viruses) using antisera that ferrets make after being infected with reference viruses representing the 2023-2024 Northern Hemisphere recommended cell or recombinant-based vaccine viruses. Antigenic differences between viruses are determined by comparing how well the antibodies made against the vaccine reference viruses recognize the circulating viruses that have been grown in cell culture. Ferret antisera are useful because antibodies raised against a particular virus can often recognize small changes in the surface proteins of other viruses. In HI assays, viruses with similar antigenic properties have antibody titer differences of less than or equal to 4-fold when compared to the reference (vaccine) virus. In HINT, viruses with similar antigenic properties have antibody neutralization titer differences of less than or equal to 8-fold. Viruses selected for antigenic characterization are a subset representing the genetic changes in the surface proteins seen in genetically characterized viruses.

                                Influenza A Viruses
                                • A (H1N1)pdm09: 387 A(H1N1)pdm09 viruses were antigenically characterized by HI, and all were well-recognized (reacting at titers that were within 4-fold of the homologous virus titer) by ferret antisera to cell-grown A/Wisconsin/67/2022-like reference viruses representing the A(H1N1)pdm09 component for the cell- and recombinant-based influenza vaccines.
                                • A (H3N2): 371 A(H3N2) viruses were antigenically characterized by HI or HINT, and 364 (98.1%) were well-recognized (reacting at titers that were within 4-fold of the homologous virus titer in HI or reacting at titers that were less than or equal to 8-fold of the homologous virus in HINT) by ferret antisera to cell-grown A/Darwin/6/2021-like reference viruses representing the A(H3N2) component for the cell- and recombinant-based influenza vaccines.

                                Influenza B Viruses
                                • B/Victoria: 264 influenza B/Victoria-lineage virus were antigenically characterized by HI, and all were well-recognized (reacting at titers that were within 4-fold of the homologous virus titer) by ferret antisera to cell-grown B/Austria/1359417/2021-like reference viruses representing the B/Victoria component for the cell- and recombinant-based influenza vaccines.
                                • B/Yamagata: No influenza B/Yamagata-lineage viruses were available for antigenic characterization.

                                Assessment of Virus Susceptibility to Antiviral Medications

                                CDC assesses susceptibility of influenza viruses to the antiviral medications including the neuraminidase inhibitors (oseltamivir, zanamivir, and peramivir) and the PA endonuclease inhibitor baloxavir using next generation sequence analysis supplemented by laboratory assays. Information about antiviral susceptibility test methods can be found at U.S. Influenza Surveillance: Purpose and Methods | CDC.

                                Viruses collected in the U.S. since October 1, 2023, were tested for antiviral susceptibility as follows:
                                Neuraminidase Inhibitors Oseltamivir Viruses Tested 4,279 1,648 1,438 1,193
                                Reduced Inhibition 1 (0.02%) 1 (0.06%) 0 (0.00%) 0 (0.00%)
                                Highly Reduced Inhibition 2 (0.05%) 2 (0.1%) 0 (0.00%) 0 (0.00%)
                                Peramivir Viruses Tested 4,279 1,648 1,438 1,193
                                Reduced Inhibition 0 (0.00%) 0 (0.00%) 0 (0.00%) 0 (0.00%)
                                Highly Reduced Inhibition 2 (0.05%) 2 (0.1%) 0 (0.00%) 0 (0.00%)
                                Zanamivir Viruses Tested 4,279 1,648 1,438 1,193
                                Reduced Inhibition 0 (0.00%) 0 (0.00%) 0 (0.00%) 0 (0.00%)
                                Highly Reduced Inhibition 0 (0.00%) 0 (0.00%) 0 (0.00%) 0 (0.00%)
                                PA Cap-Dependent Endonuclease Inhibitor Baloxavir Viruses Tested 4,155 1,594 1,399 1,162
                                Decreased Susceptibility 1 (0.02%) 0 (0.0%) 1 (0.1%) 0 (0.0%)
                                Two A(H1N1)pdm09 viruses had NA-H275Y amino acid substitution conferring highly reduced inhibition by oseltamivir and peramivir. One (H1N1)pdm09 virus had NA-I223V and NA-S247N amino acid substitutions and showed reduced inhibition by oseltamivir. One A(H3N2) virus had PA-I38T amino acid substitution and showed reduced susceptibility to baloxavir.

                                High levels of resistance to the adamantanes (amantadine and rimantadine) persist among influenza A(H1N1)pdm09 and influenza A(H3N2) viruses (the adamantanes are not effective against influenza B viruses). Therefore, use of these antivirals for treatment and prevention of influenza A virus infection is not recommended and data from adamantane resistance testing are not presented. Outpatient Respiratory Illness Surveillance


                                The U.S. Outpatient Influenza-like Illness Surveillance Network (ILINet) monitors outpatient visits for respiratory illness referred to as influenza-like illness [ILI (fever plus cough or sore throat)], not laboratory-confirmed influenza and will therefore capture respiratory illness visits due to infection with pathogens that can present with similar symptoms, including influenza viruses, SARS-CoV-2, and RSV. It is important to evaluate syndromic surveillance data, including that from ILINet, in the context of other sources of surveillance data to obtain a more complete and accurate picture of influenza, SARS-CoV-2, and other respiratory virus activity. CDC is providing integrated information about COVID-19, influenza, and RSV activity on a website that is updated weekly. Information about other respiratory virus activity can be found on CDC’s National Respiratory and Enteric Virus Surveillance System (NREVSS) website. Outpatient Respiratory Illness Visits


                                Nationally, during Week 19, 2.0% of patient visits reported through ILINet were due to respiratory illness that included fever plus a cough or sore throat, also referred to as ILI. This has remained stable (change of ≤ 0.1 percentage points) since Week 18 and is below the national baseline. The percentage of visits for ILI decreased in regions 1 and 5 and remained stable in all other regions in Week 19 compared to Week 18. All 10 regions are below their respective baselines. Multiple respiratory viruses are co-circulating, and the relative contribution of influenza virus infection to ILI varies by location.

                                Outpatient Respiratory Illness Visits by Age Group


                                About 70% of ILINet participants provide both the number of patient visits for respiratory illness and the total number of patient visits for the week broken out by age group. Data from this subset of providers are used to calculate the percentages of patient visits for respiratory illness by age group.

                                The percentage of visits for respiratory illness reported in ILINet decreased in the 0-4 years and 5-24 years age groups and remained stable in all other age groups in Week 19 compared to Week 18.

                                Outpatient Respiratory Illness Activity Map


                                Data collected in ILINet are used to produce a measure of ILI activity* by state/jurisdiction and Core Based Statistical Areas (CBSA).
                                Week 19
                                (Week ending
                                May 11, 2024)
                                Week 18
                                (Week ending
                                May 4, 2024)
                                Week 19
                                (Week ending
                                May 11, 2024)
                                Week 18
                                (Week ending
                                May 4, 2024)
                                Very High 0 0 0 0
                                High 0 0 1 1
                                Moderate 0 0 1 6
                                Low 4 4 36 33
                                Minimal 51 51 655 657
                                Insufficient Data 0 0 236 232


                                *Data collected in ILINet may disproportionally represent certain populations within a jurisdiction or CBSA, and therefore, may not accurately depict the full picture of influenza activity for the entire jurisdiction or CBSA. Differences in the data presented here by CDC and independently by some health departments likely represent differing levels of data completeness with data presented by the health department likely being the more complete.

                                Additional information about medically attended visits for ILI for current and past seasons:
                                Surveillance Methods | FluView Interactive: National, Regional, and State Data or ILI Activity Map Hospitalization Surveillance

                                FluSurv-NET


                                The Influenza Hospitalization Surveillance Network (FluSurv-NET) conducts population-based surveillance for laboratory-confirmed influenza-related hospitalizations in select counties in 14 states and represents approximately 9% of the U.S. population. FluSurv-NET hospitalization data are preliminary. As data are received each week, prior case counts and rates are updated accordingly.

                                A total of 24,643 laboratory-confirmed influenza-associated hospitalizations were reported by FluSurv-NET sites between October 1, 2023, and May 11, 2024. The weekly hospitalization rate observed in Week 19 was 0.2 per 100,000 population. The weekly hospitalization rate observed during Week 52 is tied with the 2014-2015 season for the second highest peak weekly rate observed during all seasons going back to 2010-2011 and only lower than the 2017-2018 season. The overall cumulative hospitalization rate was 80.6 per 100,000 population.

                                When examining rates by age, the highest cumulative hospitalization rate per 100,000 population was among adults aged 65 years and older (220.7) followed by adults aged 50-64 years (95.6) and children aged 0-4 years (82.9). When examining age-adjusted rates by race and ethnicity, the highest rate of hospitalization per 100,000 population was among non-Hispanic Black persons (146.7), followed by non-Hispanic American Indian or Alaska Native persons (111.9), Hispanic persons (76.6), non-Hispanic White persons (62.3), and non-Hispanic Asian/Pacific Islander persons (43.6).

                                Among 24,643 hospitalizations, 20,857 (84.6%) were associated with influenza A virus, 3,609 (14.7%) with influenza B virus, 48 (0.2%) with influenza A virus and influenza B virus co-infection, and 128 (0.5%) with influenza virus for which the type was not determined. Among those with influenza A subtype information, 3,563 (69.3%) were A(H1N1) pdm09 and 1,578 (30.7%) were A(H3N2).

                                Among 3,845 hospitalized adults with information on underlying medical conditions, 95.4% had at least one reported underlying medical condition, the most commonly reported were hypertension, cardiovascular disease, obesity, and metabolic disease. Among 1,582 hospitalized women of childbearing age (15-49 years) with information on pregnancy status, 22.9% were pregnant. Among 1,085 hospitalized children with information on underlying medical conditions, 67.7% had at least one reported underlying medical condition; the most commonly reported was asthma, followed by obesity and neurologic disease.


                                In these figures, cumulative and weekly rates for all seasons prior to the 2023-2024 season reflect end-of-season rates. For the 2023-2024 season, rates for recent hospitals admissions are subject to reporting delays. As hospitalization data are reviewed each week, prior case counts and rates are updated accordingly.

                                Additional FluSurv-NET hospitalization surveillance information for current and past seasons and additional age groups:
                                Surveillance Methods |FluView Interactive: Rates by Age, Sex, and Race/Ethnicity or Data on Patient Characteristics | RESP-NET Interactive National Healthcare Safety Network (NHSN) Hospitalization Surveillance


                                Effective May 1, 2024, hospitals are no longer required to report hospital admissions, hospital capacity, or hospital occupancy data to HHS through NHSN. Voluntarily reported NHSN hospital data can found at Weekly United States Hospitalization Metrics by Jurisdiction.

                                Additional NHSN Hospitalization Surveillance information:
                                Surveillance Methods | Additional Data | FluView Interactive Mortality Surveillance

                                National Center for Health Statistics (NCHS) Mortality Surveillance


                                Based on NCHS mortality surveillance data available on May 16, 2024, 0.1% of the deaths that occurred during the week ending May 11, 2024 (Week 19), were due to influenza. This percentage remained stable (< 0.1 percentage point change) compared to Week 18. The data presented are preliminary and may change as more data are received and processed.


                                Additional pneumonia, influenza and COVID-19 mortality surveillance information for current and past seasons:
                                Surveillance Methods | FluView Interactive Influenza-Associated Pediatric Mortality


                                Three influenza-associated pediatric deaths were reported to CDC during Week 19, bringing the total pediatric deaths for this season to 167. The deaths occurred during weeks 1, 9, and 12 of 2024 (the weeks ending January 6, March 2, and March 23, 2024). Two deaths were associated with influenza A viruses and one death was associated with an influenza B/Victoria virus. One of the influenza A viruses had subtyping performed and was an A(H3N2) virus.


                                Additional pediatric mortality surveillance information for current and past seasons:
                                Surveillance Methods | FluView Interactive Trend Indicators


                                Increasing:
                                Decreasing:
                                Stable: Indicators Status by System


                                Clinical Labs: Up or down arrows indicate a change of greater than or equal to 0.5 percentage points in the percent of specimens positive for influenza compared to the previous week.
                                Outpatient Respiratory Illness (ILINet): Up or down arrows indicate a change of greater than 0.1 percentage points in the percent of visits due to respiratory illness (ILI) compared to the previous week.
                                NHSN Hospitalizations: Up or down arrows indicate change of greater than or equal to 5% of the number of patients admitted with laboratory-confirmed influenza compared to the previous week.
                                NCHS Mortality: Up or down arrows indicate change of greater than 0.1 percentage points of the percent of deaths due to influenza compared to the previous week. Reference Footnotes


                                1U.S. Influenza Surveillance: Purpose and Methods (2023 Oct). Centers for Disease Control and Prevention. https://www.cdc.gov/flu/weekly/overview.htm#ILINet.

                                2Grohskopf LA, Blanton LH, Ferdinands JM, Chung JR, Broder KR, Talbot HK. Prevention and Control of Seasonal Influenza with Vaccines: Recommendations of the Advisory Committee on Immunization Practices — United States, 2023–24 Influenza Season. MMWR Recomm Rep 2023;72(No. RR-2):1–25. DOI: http://dx.doi.org/10.15585/mmwr.rr7202a1

                                3Influenza Antiviral Medications: Summary for Clinicians (2023 Sept). Centers for Disease Control and Prevention. https://www.cdc.gov/flu/professional...clinicians.htm.

                                Additional National and International Influenza Surveillance Information


                                FluView Interactive: FluView includes enhanced web-based interactive applications that can provide dynamic visuals of the influenza data collected and analyzed by CDC. These FluView Interactive applications allow people to create customized, visual interpretations of influenza data, as well as make comparisons across flu seasons, regions, age groups and a variety of other demographics.

                                National Institute for Occupational Safety and Health: Monthly surveillance data on the prevalence of health-related workplace absenteeism among full-time workers in the United States are available from NIOSH.
                                https://www.cdc.gov/flu/weekly/index.htm
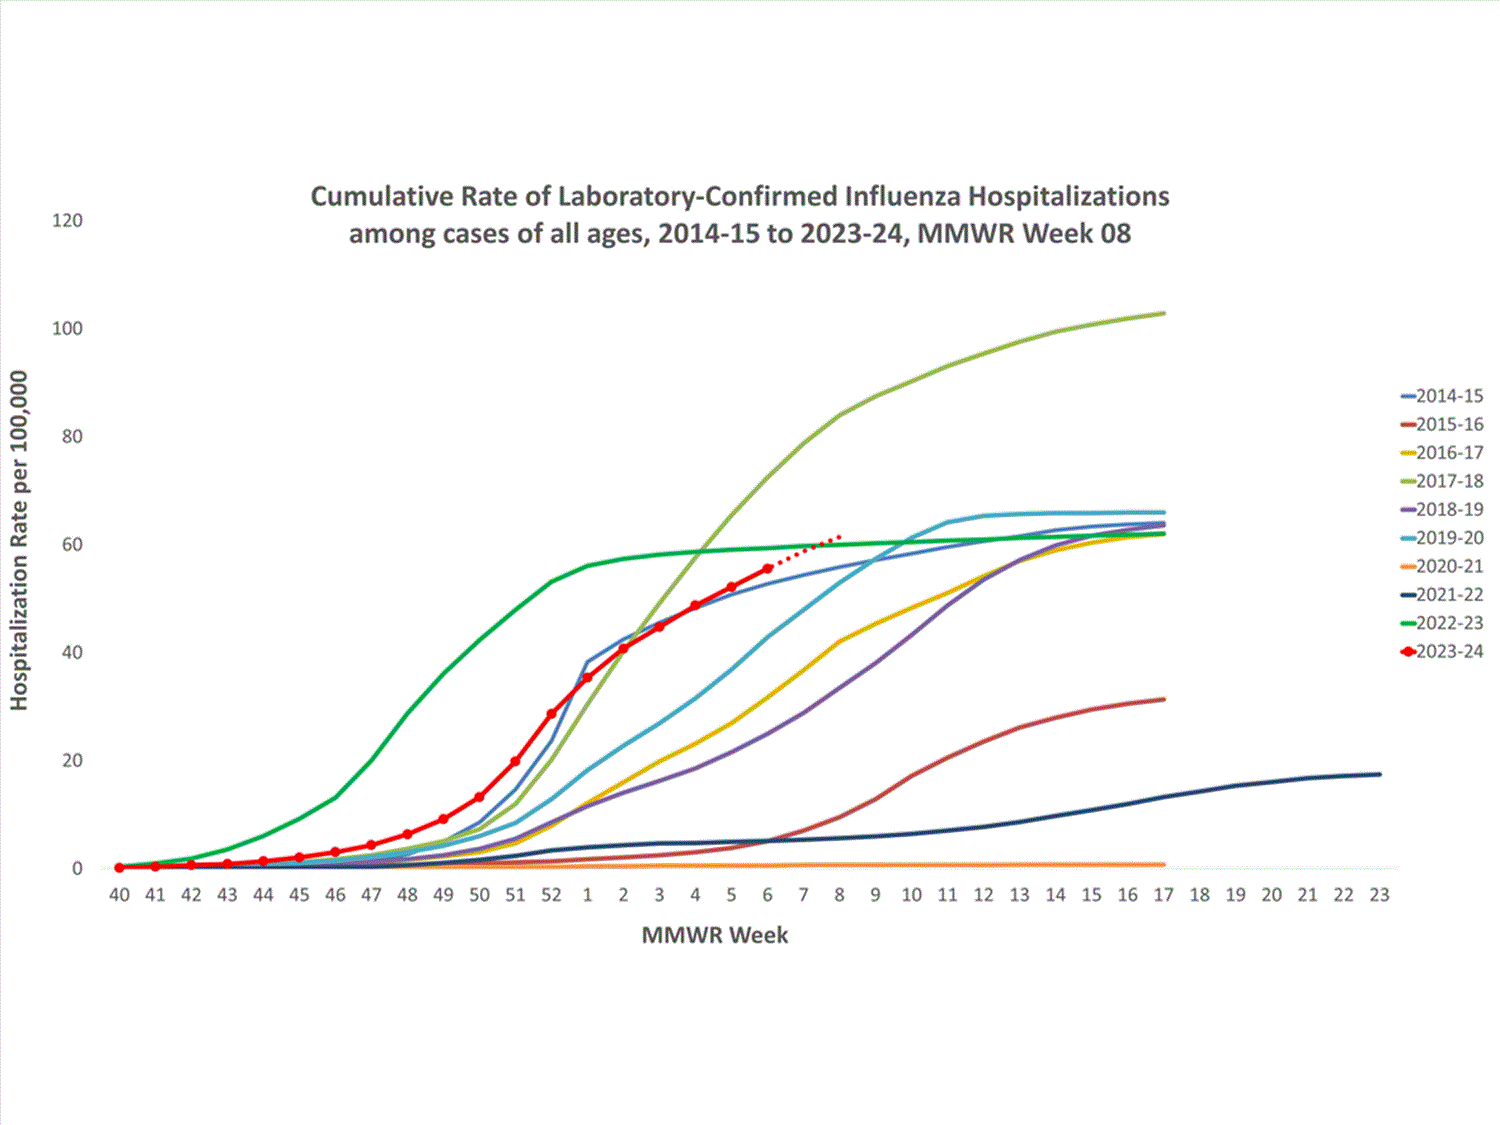
                                Comment

                                Working...
                                X