• FluTrackers.com Inc. does not provide medical advice. Information on this web site is collected from various internet resources, and the FluTrackers board of directors makes no warranty to the safety, efficacy, correctness or completeness of the information posted on this site by any author or poster. The information collated here is for instructional and/or discussion purposes only and is NOT intended to diagnose or treat any disease, illness, or other medical condition. Every individual reader or poster should seek advice from their personal physician/healthcare practitioner before considering or using any interventions that are discussed on this website. By continuing to access this website you agree to consult your personal physican before using any interventions posted on this website, and you agree to hold harmless FluTrackers.com Inc., the board of directors, the members, and all authors and posters for any effects from use of any medication, supplement, vitamin or other substance, device, intervention, etc. mentioned in posts on this website, or other internet venues referenced in posts on this website.
  • We are not asking for any donations. Do not donate to any entity who says they are raising funds for us.

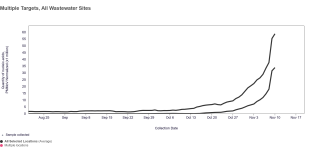
Wastewater data now shows >50% of all Influenza viral load nationwide is H5

blacknail

Well-known member
Is this the point where the wastewater alarm has gone off, or is this entirely from dairy processing plants?

image.png - Click image for larger version  Name:	image.png Views:	1 Size:	123.8 KB ID:	1000806
​​
Link
 

Attachments

  • WWSCAN_Multiple_Targets_All_Wastewater_Sites_20241120.png
    WWSCAN_Multiple_Targets_All_Wastewater_Sites_20241120.png
    113.4 KB · Views: 0
Is this from the Stanford group? Please post a link to source.

Any number is possible with the amount of environmental H5N1 contamination at this point. Dairy cattle farm or no. And I don't think it means only people either. I am talking about all manner of wild avians and mammals contamination that ends up in the storm drain systems. We are saturated.

For me the wastewater data is in the interesting category. It is a data point to look at but provides no detail.

Honestly, we are so screwed. It is everywhere.
 
This is from the Wastewater scan site. I did post the link in the original post however, the link it only shows the H5 graph and not the total Influenza A load all on one chart. I don't know why the link doesn't reproduce both on the same chart for comparison but it means you would have to create the chart yourself to get the comparison that I posted. I also labeled the chart for clarity.
 
H5 detection in wastewater is concentrated in California:

image.png - Click image for larger version  Name:	image.png Views:	1 Size:	38.7 KB ID:	1001036


...
Wastewater Data for Avian Influenza A(H5)

H5 detection in wastewater in the past week

...
Time Period: November 10 - November 16, 2024

H5 Detection
46 sites (14.2%)

No Detection
279 sites (85.8%)

No samples in last week
24 sites​

image.png - Click image for larger version  Name:	image.png Views:	1 Size:	38.7 KB ID:	1001036


Data Updated November 21, 2024
...

https://www.cdc.gov/nwss/rv/wwd-h5.html
 
Back
Top