

Sally Furniss
Well-known member
Note on the Periodicity of Influenza.
By
John Brownlee, M.D., D.Sc,
Director of Statistics, Medical Research Committee.
INTRODUCTION.
Some time ago I made a short note in the Lancet* (Lancet, 8th November 1919) on the periodicity
of influenza epidemics, with the intention of returning again to the subject.
Owing to the difficulty of obtaining series of statistics with regard to other
cities, I have not been able to extend the investigation, but one or two points
have emerged. The main part of the investigation stands and is reproduced.
Reference, however, is made to more recent papers.
Periodicity and Characteristics of Recorded Epidemics.
In the first place the series of epidemics of influenza between the years
1889 and 1917, beginning with the last great invasion of the disease, in
those places for which statistics are accessible, present a singular phenomenon.
Epidemics seem to be of extreme rarity between the end of June and the
beginning of December, so rare in fact as to be almost non-existent. This
is the season of the year in which bronchitis and pneumonia are least
frequent. Influenza, then, does not, if epidemic, assume a form which
causes death to any extent until either a bronchitic or pneumonic " con-
stitution " has been established. The great epidemic which occurred in
October 1919 falls completely out of line with what happened between 1889
and 1917. Some small epidemics, it is true, occurred at this season, but
none comparable in size to the last.
The statistics of the epidemics which have been specially investigated
are those of London between 1889 and 1896. For this city the weekly
number of deaths since 1889 has been published. Also what is of the
greatest advantage, the weekly numbers of deaths from bronchitis and
pneumonia are available since the year 1870. Considering specially the
years 1889 to 1896 as the most typical years, it is seen that the epidemics
of influenza have had their maxima from the beginning of January to the
end of May. Applying the ordinary method of the periodogram, it is found
that the interval between the epidemics is 33 weeks, there being a missed
epidemic when an epidemic is due in the autumn. The periodicity is rigid
within these years, though later years show some considerable aberration.
The method of the periodogram, however, allows us to extend the know-
ledge acquired with regard to influenza to the associated diseases, bronchitis
and pneumonia. There is no question at all that the period between the
influenza epidemics between 1889 and 1896 is 33 weeks. "Whether this
periodicity is accidental or dependent on the special organism of the
disease does not affect the next step in the investigation. If it is found
that there is no periodicity of 33 weeks with regard to bronchitis or pneu-
monia in the absence of influenza, and if this periodicity appears with
regard to these diseases after the return of influenza it must be taken as
associated definitely with that disease. It is found on examination that
between 1876 and 1890 there is no such periodicity with regard to bronchitis
and pneumonia, but that from 1889 to 1896 it is very marked. The graphs
for 33 weeks may then be compared for the three diseases. It is found on
inspection that the deaths from pneumonia precede the deaths from
influenza by a little over a week, while the deaths ascribed to bronchitis
have their epidemic rise a full fortnight before the rise of influenza. The
number of these deaths for bronchitis and pneumonia ascertained by this
method of grouping is fully twice the number of deaths ascribed to
influenza. It thus seems certain that in these years influenza appeared, on
its epidemic onset, first with bronchitic symptoms, slightly later with
pneumonic symptoms, and, lastly with those symptoms more definitely
associated with influenza proper. When the several sets of deaths are
added together in 33-week periods a very typical epidemic makes its
appearance. I have not, so far, been able to obtain weekly statistics of any
other great city, but I have examined the monthly statistics of Glasgow,
Aberdeen, Massachusetts, &c, and have found nothing which differs
essentially from the phenomena found in London.
Deductions drawn from the Data.
Before passing from this subject it may be said that what has been
ascertained with regard to the sequence of these diseases, bronchitis,
pneumonia, and influenza from a consideration of a 33-weeks period, also
holds when the annual variations are compared. Between the years 1876
and 1889 the annual curve which gives the variations of bronchitis possesses
two maxima, one at the end of January and the second in the middle of
March. From this point the decline in the number of deaths from
bronchitis is very rapid. The reappearance of the disease dates from the
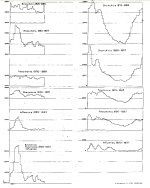
beginning of October. When the eight years 1889 to 1896, however, are
examined, it is found that the maximum number of deaths from bronchitis
occur in the second week in January and in the last week of February.
Both these maxima are a fortnight before the maxima of the epidemics of
influenza as before found. This suggests that the advent of influenza has
brought a change in the seasonal prevalence of bronchitis, and also supports
the view that the earlier portion of the influenza epidemic is associated with
bronchitic symptoms. The same phenomenon holds for pneumonia as a
like alteration has occurred in the seasonal curve of the death-rates of this
disease before and after 1889. The maximum numbers of deaths from
pneumonia are thrown earlier into the year and precede the maximum
number of deaths from influenza by about a week.
Since the preceding remarks were published, two papers have
appeared on the subject, one by Mr. Stallybrass* of the Department
of Health in Liverpool, who finds the same phenomena in Liverpool
which have already been found to exist in London and elsewhere, and
who also gives a number of further details. Both my paper and the
preceding have been criticised by Mr. Spear.† He states dogmatically
" that the method can only yield correct results when the data to which it is
" applied can be described as recurring ' waves ' of approximately uniform
" ' amplitude.' " There is, however, no necessity that the waves of the
epidemic be of uniform amplitude as Mr. Spear thinks. He further says :
" How then, is the result found by Dr. Brownlee by the periodogram method
" to be accounted for? The explanation lies in the fact that the ' ampli-
" tudes ' of the successive ' waves' of influenza mortality—the number of*
" deaths during the week of climax—in certain of the epidemics in this
" period are so great as to overshadow and practically to eliminate the smaller
" outbreaks when the data are subjected to analysis by the periodogram
" method."
The fallacies of the method are of course quite familiar to me. Mr. Spear's
statement, however, last quoted is quite wrong, there is no evidence that two
or more large epidemics have exercised a dominating influence. His error is
illustrated exceedingly well if the course of the epidemic of influenza in
Boston from 1889 to 1900 are examined.
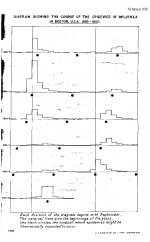
The facts are illustrated in the accompanying diagram. This diagram
has been constructed by the following method: Each division in the diagram
refers to the death-rate for two years in months, the first month on the left-
hand side being the month of September, and the last month August of the
next year. The vertical lines mark the beginning of the year and the black
dots indicate the points at which the maxima of the epidemics would occur
if the period was rigidly 33 weeks. It will be seen that the centre of the
main epidemics varies very little from its theoretical placing. In only two
cases is it more than a month out of place. The diagram shows further, if
the difficulty of an epidemic occurring between the end of June and the
middle of December be admitted, that a 33-weeks period explains all the
facts. Thus in the years 1895-96 and 1897-98 the theoretical maxima fall
in that part of the year and almost no deaths from influenza occurred, but
when the following maxima, fell in the appropriate season the epidemics
re-appeared in their proper place. After 1899 the rhythm broke. The facts
for London are identical except that the rhythm broke eighteen months
earlier. This diagram is a sufficient refutation of Mr. Spear's statement,
that the 33-weeks period arises from conjunction of two or three large
epidemics.
Mr. Spear further mentions an amplitude with a 50-weeks period.
This amplitude I was fully acquainted with when I wrote my note. If a 33-
weeks period exists with the further requirements that every third epidemic
is missed, the form of the curve arising if the figure be added up in rows of
50 weeks is identical with that found in this case. This amplitude being
thus fully explained, it did not seem necessary to make special reference to it.
When the note was written the following remarks were added.
From 13th July 1918 to 1st March 1919 the maximum points of two of
the last epidemics is 33 weeks; from 1st March to 21st October is also
33 weeks. An epidemic is therefore due, but it falls at the unsuitable
season of the year and should, therefore, be small. "With regard to the
aberrant October epidemic, this might be expected to have been followed
by an epidemic in June, a season of the year at which an epidemic is
still possible but very unlikely. If the October epidemic, therefore, has a
33-weeks sequence, the next epidemic would occur in January or February
of the New Year. Of course, it is to be remembered that the intervals
between epidemics are never exact; only their average approaches exactitude.
A month either way is of no moment.
How far, then, has the prophecy been fulfilled ?
Dr. Wladyslaw Szenajeh, commenting on the note in the Polish " Journal
of Epidemiology," says : " This announcement has, on the whole, proved true
" in England and in America, but here (in Poland) the epidemic has reached
" its highest in January 1920, the interval between the end of one epidemic
" and the commencement of the other amounted to 30 weeks, or up to the
" greatest prevalence to 33 weeks." So that even in Poland there was no
great divergence.
http://influenza.sph.unimelb.edu.au/data/S0001/chapters/app_12.pdf
By
John Brownlee, M.D., D.Sc,
Director of Statistics, Medical Research Committee.
INTRODUCTION.
Some time ago I made a short note in the Lancet* (Lancet, 8th November 1919) on the periodicity
of influenza epidemics, with the intention of returning again to the subject.
Owing to the difficulty of obtaining series of statistics with regard to other
cities, I have not been able to extend the investigation, but one or two points
have emerged. The main part of the investigation stands and is reproduced.
Reference, however, is made to more recent papers.
Periodicity and Characteristics of Recorded Epidemics.
In the first place the series of epidemics of influenza between the years
1889 and 1917, beginning with the last great invasion of the disease, in
those places for which statistics are accessible, present a singular phenomenon.
Epidemics seem to be of extreme rarity between the end of June and the
beginning of December, so rare in fact as to be almost non-existent. This
is the season of the year in which bronchitis and pneumonia are least
frequent. Influenza, then, does not, if epidemic, assume a form which
causes death to any extent until either a bronchitic or pneumonic " con-
stitution " has been established. The great epidemic which occurred in
October 1919 falls completely out of line with what happened between 1889
and 1917. Some small epidemics, it is true, occurred at this season, but
none comparable in size to the last.
The statistics of the epidemics which have been specially investigated
are those of London between 1889 and 1896. For this city the weekly
number of deaths since 1889 has been published. Also what is of the
greatest advantage, the weekly numbers of deaths from bronchitis and
pneumonia are available since the year 1870. Considering specially the
years 1889 to 1896 as the most typical years, it is seen that the epidemics
of influenza have had their maxima from the beginning of January to the
end of May. Applying the ordinary method of the periodogram, it is found
that the interval between the epidemics is 33 weeks, there being a missed
epidemic when an epidemic is due in the autumn. The periodicity is rigid
within these years, though later years show some considerable aberration.
The method of the periodogram, however, allows us to extend the know-
ledge acquired with regard to influenza to the associated diseases, bronchitis
and pneumonia. There is no question at all that the period between the
influenza epidemics between 1889 and 1896 is 33 weeks. "Whether this
periodicity is accidental or dependent on the special organism of the
disease does not affect the next step in the investigation. If it is found
that there is no periodicity of 33 weeks with regard to bronchitis or pneu-
monia in the absence of influenza, and if this periodicity appears with
regard to these diseases after the return of influenza it must be taken as
associated definitely with that disease. It is found on examination that
between 1876 and 1890 there is no such periodicity with regard to bronchitis
and pneumonia, but that from 1889 to 1896 it is very marked. The graphs
for 33 weeks may then be compared for the three diseases. It is found on
inspection that the deaths from pneumonia precede the deaths from
influenza by a little over a week, while the deaths ascribed to bronchitis
have their epidemic rise a full fortnight before the rise of influenza. The
number of these deaths for bronchitis and pneumonia ascertained by this
method of grouping is fully twice the number of deaths ascribed to
influenza. It thus seems certain that in these years influenza appeared, on
its epidemic onset, first with bronchitic symptoms, slightly later with
pneumonic symptoms, and, lastly with those symptoms more definitely
associated with influenza proper. When the several sets of deaths are
added together in 33-week periods a very typical epidemic makes its
appearance. I have not, so far, been able to obtain weekly statistics of any
other great city, but I have examined the monthly statistics of Glasgow,
Aberdeen, Massachusetts, &c, and have found nothing which differs
essentially from the phenomena found in London.
Deductions drawn from the Data.
Before passing from this subject it may be said that what has been
ascertained with regard to the sequence of these diseases, bronchitis,
pneumonia, and influenza from a consideration of a 33-weeks period, also
holds when the annual variations are compared. Between the years 1876
and 1889 the annual curve which gives the variations of bronchitis possesses
two maxima, one at the end of January and the second in the middle of
March. From this point the decline in the number of deaths from
bronchitis is very rapid. The reappearance of the disease dates from the
beginning of October. When the eight years 1889 to 1896, however, are
examined, it is found that the maximum number of deaths from bronchitis
occur in the second week in January and in the last week of February.
Both these maxima are a fortnight before the maxima of the epidemics of
influenza as before found. This suggests that the advent of influenza has
brought a change in the seasonal prevalence of bronchitis, and also supports
the view that the earlier portion of the influenza epidemic is associated with
bronchitic symptoms. The same phenomenon holds for pneumonia as a
like alteration has occurred in the seasonal curve of the death-rates of this
disease before and after 1889. The maximum numbers of deaths from
pneumonia are thrown earlier into the year and precede the maximum
number of deaths from influenza by about a week.
Since the preceding remarks were published, two papers have
appeared on the subject, one by Mr. Stallybrass* of the Department
of Health in Liverpool, who finds the same phenomena in Liverpool
which have already been found to exist in London and elsewhere, and
who also gives a number of further details. Both my paper and the
preceding have been criticised by Mr. Spear.† He states dogmatically
" that the method can only yield correct results when the data to which it is
" applied can be described as recurring ' waves ' of approximately uniform
" ' amplitude.' " There is, however, no necessity that the waves of the
epidemic be of uniform amplitude as Mr. Spear thinks. He further says :
" How then, is the result found by Dr. Brownlee by the periodogram method
" to be accounted for? The explanation lies in the fact that the ' ampli-
" tudes ' of the successive ' waves' of influenza mortality—the number of*
" deaths during the week of climax—in certain of the epidemics in this
" period are so great as to overshadow and practically to eliminate the smaller
" outbreaks when the data are subjected to analysis by the periodogram
" method."
The fallacies of the method are of course quite familiar to me. Mr. Spear's
statement, however, last quoted is quite wrong, there is no evidence that two
or more large epidemics have exercised a dominating influence. His error is
illustrated exceedingly well if the course of the epidemic of influenza in
Boston from 1889 to 1900 are examined.
The facts are illustrated in the accompanying diagram. This diagram
has been constructed by the following method: Each division in the diagram
refers to the death-rate for two years in months, the first month on the left-
hand side being the month of September, and the last month August of the
next year. The vertical lines mark the beginning of the year and the black
dots indicate the points at which the maxima of the epidemics would occur
if the period was rigidly 33 weeks. It will be seen that the centre of the
main epidemics varies very little from its theoretical placing. In only two
cases is it more than a month out of place. The diagram shows further, if
the difficulty of an epidemic occurring between the end of June and the
middle of December be admitted, that a 33-weeks period explains all the
facts. Thus in the years 1895-96 and 1897-98 the theoretical maxima fall
in that part of the year and almost no deaths from influenza occurred, but
when the following maxima, fell in the appropriate season the epidemics
re-appeared in their proper place. After 1899 the rhythm broke. The facts
for London are identical except that the rhythm broke eighteen months
earlier. This diagram is a sufficient refutation of Mr. Spear's statement,
that the 33-weeks period arises from conjunction of two or three large
epidemics.
Mr. Spear further mentions an amplitude with a 50-weeks period.
This amplitude I was fully acquainted with when I wrote my note. If a 33-
weeks period exists with the further requirements that every third epidemic
is missed, the form of the curve arising if the figure be added up in rows of
50 weeks is identical with that found in this case. This amplitude being
thus fully explained, it did not seem necessary to make special reference to it.
When the note was written the following remarks were added.
From 13th July 1918 to 1st March 1919 the maximum points of two of
the last epidemics is 33 weeks; from 1st March to 21st October is also
33 weeks. An epidemic is therefore due, but it falls at the unsuitable
season of the year and should, therefore, be small. "With regard to the
aberrant October epidemic, this might be expected to have been followed
by an epidemic in June, a season of the year at which an epidemic is
still possible but very unlikely. If the October epidemic, therefore, has a
33-weeks sequence, the next epidemic would occur in January or February
of the New Year. Of course, it is to be remembered that the intervals
between epidemics are never exact; only their average approaches exactitude.
A month either way is of no moment.
How far, then, has the prophecy been fulfilled ?
Dr. Wladyslaw Szenajeh, commenting on the note in the Polish " Journal
of Epidemiology," says : " This announcement has, on the whole, proved true
" in England and in America, but here (in Poland) the epidemic has reached
" its highest in January 1920, the interval between the end of one epidemic
" and the commencement of the other amounted to 30 weeks, or up to the
" greatest prevalence to 33 weeks." So that even in Poland there was no
great divergence.
http://influenza.sph.unimelb.edu.au/data/S0001/chapters/app_12.pdf
