Giuseppe
Emeritus
Euro Surveill. Pandemic H1N1 influenza: predicting the course of a pandemic and assessing the efficacy of the planned vaccination programme in the United States (edited)
Eurosurveillance, Volume 14, Issue 41, 15 October 2009
Rapid communications
Pandemic H1N1 influenza: predicting the course of a pandemic and assessing the efficacy of the planned vaccination programme in the United States
S Towers 1, Z Feng 2
1. Department of Statistics, Purdue University, West Lafayette, Indiana, United States
2. Department of Mathematics, Purdue University, West Lafayette, Indiana, United States
Citation style for this article: Towers S, Feng Z. Pandemic H1N1 influenza: predicting the course of a pandemic and assessing the efficacy of the planned vaccination programme in the United States. Euro Surveill. 2009;14(41) ii=19358. Available online: http://www.eurosurveillance.org/ViewArticle.aspx?ArticleId=19358
Date of submission: 08 October 2009
We use data on confirmed cases of pandemic influenza A(H1N1), disseminated by the United States Centers for Disease Control and Prevention(US CDC), to fit the parameters of a seasonally forced Susceptible, Infective, Recovered (SIR) model. We use the resulting model to predict the course of the H1N1 influenza pandemic in autumn 2009, and we assess the efficacy of the planned CDC H1N1 vaccination campaign. The model predicts that there will be a significant wave in autumn, with 63% of the population being infected, and that this wave will peak so early that the planned CDC vaccination campaign will likely not have a large effect on the total number of people ultimately infected by the pandemic H1N1 influenza virus.
Introduction
For several years the United States (US) Centers for Disease Control and Prevention (CDC) have had an established protocol for laboratory influenza testing and collection, and dissemination of associated statistics [1]. These statistics are published and regularly updated online [2].
With the recognition of a new, potentially pandemic strain of influenza A(H1N1) in April 2009, the laboratories at the US CDC and the World Health Organization (WHO) dramatically increased their testing activity from week 17 onwards (week ending 2 May 2009), as can be seen in Figure 1. In this analysis, we use the extrapolation of a model fitted to the confirmed influenza A(H1N1)v case counts during summer 2009 to predict the behaviour of the pandemic during autumn 2009.
[Figure 1. Influenza-positive tests reported to the US CDC by US WHO/NREVSS-collaborating laboratories, national summary, United States, 2009 until 26 September]
Methods
The CDC/WHO influenza count data used in these studies were obtained from the weekly online surveillance reports [2]. At the time of writing, the data up to week 38 (week ending 26 September 2009) were the most recent. However, we observed that in each weekly update the data significantly change for at least five weeks prior to the week of the update, likely due to a large backlog in testing. In this analysis we thus used data only up to week 33 (week ending 22 August).
The pandemic potential of influenza A(H1N1)v was recognised during week 16 (week ending 25 April) [3]. We assumed that there was no time bias in the CDC/WHO seasonal influenza count data prior to that date. Based on the extrapolation of the exponential decline behaviour of regular seasonal influenza prior to week 16 into the temporal region of heightened testing activity, we found that the data after week 20 (ending 23 May) contain no significant time bias. We thus used the data from week 21 to 33 (from 24 May to 22 August 2009).
The behaviour of the H1N1 influenza pandemic over time was modelled using a seasonally forced deterministic Susceptible, Infective, Recovered (SIR) model [4]: dS/dt=-β(t) SI/N (1) dI/dt=β(t) SI/N - γI, (2) where N=350,000,000.
We assumed that γ=1/3 days-1 [5], and that the contact rate, β(t), was periodically forced via β(t)=β0+β1 cos(2πt) (3)The reproduction number was given by R0=β(t)/γ.
To simulate the time evolution of the influenza H1N1 pandemic, we assumed an initial number of infective individuals and susceptibles, I0=1/N and S0=N, respectively, at an initial time t0. Given particular values of β0, β1, and t0, we numerically solved equations (1) and (2) to estimate the fraction of the population infected with pandemic H1N1 influenza each week.
We compared the shape of the results of the deterministic model to the shape of the actual pandemic influenza data, and found the parameters {β0,β1,t0} that provided the best Pearson chi-square statistics.
The grid search for the parameters that minimised the chi-square value was performed with parameter ranges: β0 between 0.92 to 2.52 in increments of 0.02, β1 between 0.05 to 0.80 in increments of 0.01, and t0 between weeks -8 to 10 (relative to the beginning of 2009), in increments of one week.
The planned CDC vaccination programme against pandemic H1N1 influenza will begin with six to seven million doses being delivered by the end of the first full week in October (week 40), with 10 to 20 million doses being delivered weekly thereafter [6]. We included the effects of this vaccination campaign into our seasonally forced SIR model by decreasing the number of susceptibles in the population by the corresponding amounts. For healthy adults, full immunity to H1N1 influenza is achieved about two weeks after vaccination with one dose of the vaccine [7,8], and we took this into account in the model by beginning the reduction in susceptibles in week 42 instead of in week 40. We optimistically assumed the higher-end estimate of the planned vaccine roll-out, and we also optimistically assumed that 100% of vaccinated people would achieve full immunity within two weeks.
Results
When the seasonally forced SIR model was compared to the influenza H1N1 data, the parameters {β0,β1,t0} that yielded the minimum chi-square value were {1.56, 0.54, 24 Feb 2009}, with 95% confidence intervals (CI) of {1.43,1.77, 0.39,0.54, 8 Feb 2009,7 Mar 2009}.
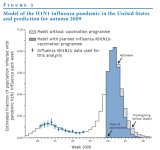
The best-fit model is shown in Figure 2, with the influenza H1N1 data overlaid. The model predicts that the peak wave of infection will occur near the end of October in week 42 (95% CI: week 39,43), with 8% of the population being infected during that week (95% CI: 6%,13%). By the end of 2009, the model predicts that a total of 63% of the population will have been infected (95% CI: 57%,70%).
[Figure 2. Model of the H1N1 influenza pandemic in the United States and prediction for autumn 2009]
When the model was modified to include the effect of the planned vaccination scheme, it predicted a relative reduction of about 6% in the total number of people infected with influenza A(H1N1)v virus by the end of the year 2009 (95% CI: 1%,17%). The predictions of the modified model are shown in Figure 2.
Discussion
Based on a model with simple harmonic seasonal forcing, the peak of the H1N1 influenza pandemic was predicted to occur between weeks 39 to 43 with 95% confidence. However, it should be noted that the actual periodic function underlying seasonal forcing of influenza has not been well studied, and the uncertainties in the model predictions arising from seasonal forcing assumptions are difficult to quantify.
The 95% confidence interval for t0 predicted by this analysis was [8 Feb 2009, 7 Mar 2009], which is in good agreement with the genetic analysis presented in Fraser et al. that found t0 between 3 November 2008 and 2 March 2009 with 95% confidence [9]. Further, the value of R0 predicted by the model between mid-March and the end of April 2009 was between 1.3 and 1.7. This is in agreement with the results presented in Fraser et al. , who estimate R0 to be in the range 1.4 to 1.6, based on an analysis of Mexican H1N1 influenza data collected during that time period [9].We predict that almost two thirds of the US population will be infected with pandemic H1N1 influenza by the end of 2009. However, the serological analysis presented in King et al. showed that up to 60% of seasonal influenza infections are asymptomatic [10]. If the same is true of the current pandemic influenza, about a quarter of the population will fall ill.
The most optimistic assumptions about the CDC vaccination campaign yielded a relative reduction of only 6% in the total number of infected individuals. If we assume a 40% symptomatic infection rate, and a mortality rate of between 0.05% and 0.5%, this corresponds to an estimated prevention of between 2,500 and 25,000 deaths. The actual reduction would certainly be lower because 10-30% of adults vaccinated will not achieve immunity [7,8]. Also a large fraction of the population targeted by influenza A(H1N1) vaccinations are children. Vaccination immunity in children develops at least four weeks after vaccination and would occur too late in the pandemic to make a significant difference to the number of infected in that age group.
The cost benefit analysis involved in devising a pandemic influenza vaccination campaign is extremely complicated, especially due to the ever evolving nature of the pandemic. What we learn from the successes and mistakes of vaccination programmes developed during the current H1N1 influenza pandemic will greatly aid us in decision making during future influenza pandemics.
References
1. Questions and Answers: Seasonal Influenza. Atlanta: Centers for Disease Control and Prevention. [accessed 2009 Oct 2]. Available from: http://www.cdc.gov/flu/about/qa/disease.htm
2. FluView: 2008-2009 Influenza Season Week 38 ending September 26, 2009. Atlanta: Centers for Disease Control and Prevention. [accessed 2009 Oct 2]. Available from: http://www.cdc.gov/flu/weekly/fluactivity.htm
3. Influenza-like illness in the United States and Mexico. Geneva: World Health Organization; 22 April 2009. Avaliable from: http://www.who.int/csr/don/2009_04_24/en/index.html
4. Dushoff J, Plotkin JB, Levin SA, Earn DJ. Dynamical resonance can account for seasonal influenza epidemics. Proc Natl Acad Sci USA. 2004;101(48):16915-6.
5. Colizza V, Barrat A, Barthelemy M, Valleron A-J, Vespignani A. Modeling the worldwide spread of pandemic influenza: baseline case and containment interventions. PloS Med. 2007;4(1):e13.
6. Orders for Live Attenuated Influenza Vaccine. Washington: US Department of Health and Human Services [accessed 2009 Oct 2]. Available from: http://www.flu.gov/individualfamily/vaccination/orders.html
7. Hannoun C, Megas F, Piercy J. Immunogenicity and Protective Efficacy of Influenza Vaccination. Virus Res. 2004 Jul;103(1-2):133-8.
8. Clark TW, Pareek M, Hoschler K, Dillon H, Nicholson KG, Groth N, et al. Trial of influenza A (H1N1) 2009 monovalent MF59-adjuvanted vaccine -preliminary report. N Engl J Med. 2009;361. DOI: 10.1056/NEJMoa0907650.
9. Fraser C, Donnelly CA, Cauchemez S, Hanage WP, Van Kerkhove MD, Hollingsworth TD, et al; WHO Rapid pandemic Assessment Collaboration. Pandemic potential of a strain of influenza A (H1N1): early findings. Science. 2009;324(5934):1557-61.
10. King JC Jr, Haugh CJ, Dupont WD, Thompson JM, Wright PF, Edwards KM. Laboratory and Epidemiological Assessment of a Recent Influenza B Outbreak. J Med Virol. 1988;25(3):361-8.
-
<cite cite="http://www.eurosurveillance.org/ViewArticle.aspx?ArticleId=19358">Eurosurveillance - View Article</cite>Rapid communications
Pandemic H1N1 influenza: predicting the course of a pandemic and assessing the efficacy of the planned vaccination programme in the United States
S Towers 1, Z Feng 2
1. Department of Statistics, Purdue University, West Lafayette, Indiana, United States
2. Department of Mathematics, Purdue University, West Lafayette, Indiana, United States
Citation style for this article: Towers S, Feng Z. Pandemic H1N1 influenza: predicting the course of a pandemic and assessing the efficacy of the planned vaccination programme in the United States. Euro Surveill. 2009;14(41)
ii=19358. Available online: http://www.eurosurveillance.org/ViewArticle.aspx?ArticleId=19358Date of submission: 08 October 2009
We use data on confirmed cases of pandemic influenza A(H1N1), disseminated by the United States Centers for Disease Control and Prevention(US CDC), to fit the parameters of a seasonally forced Susceptible, Infective, Recovered (SIR) model. We use the resulting model to predict the course of the H1N1 influenza pandemic in autumn 2009, and we assess the efficacy of the planned CDC H1N1 vaccination campaign. The model predicts that there will be a significant wave in autumn, with 63% of the population being infected, and that this wave will peak so early that the planned CDC vaccination campaign will likely not have a large effect on the total number of people ultimately infected by the pandemic H1N1 influenza virus.
Introduction
For several years the United States (US) Centers for Disease Control and Prevention (CDC) have had an established protocol for laboratory influenza testing and collection, and dissemination of associated statistics [1]. These statistics are published and regularly updated online [2].
With the recognition of a new, potentially pandemic strain of influenza A(H1N1) in April 2009, the laboratories at the US CDC and the World Health Organization (WHO) dramatically increased their testing activity from week 17 onwards (week ending 2 May 2009), as can be seen in Figure 1. In this analysis, we use the extrapolation of a model fitted to the confirmed influenza A(H1N1)v case counts during summer 2009 to predict the behaviour of the pandemic during autumn 2009.
[Figure 1. Influenza-positive tests reported to the US CDC by US WHO/NREVSS-collaborating laboratories, national summary, United States, 2009 until 26 September]
Methods
The CDC/WHO influenza count data used in these studies were obtained from the weekly online surveillance reports [2]. At the time of writing, the data up to week 38 (week ending 26 September 2009) were the most recent. However, we observed that in each weekly update the data significantly change for at least five weeks prior to the week of the update, likely due to a large backlog in testing. In this analysis we thus used data only up to week 33 (week ending 22 August).
The pandemic potential of influenza A(H1N1)v was recognised during week 16 (week ending 25 April) [3]. We assumed that there was no time bias in the CDC/WHO seasonal influenza count data prior to that date. Based on the extrapolation of the exponential decline behaviour of regular seasonal influenza prior to week 16 into the temporal region of heightened testing activity, we found that the data after week 20 (ending 23 May) contain no significant time bias. We thus used the data from week 21 to 33 (from 24 May to 22 August 2009).
The behaviour of the H1N1 influenza pandemic over time was modelled using a seasonally forced deterministic Susceptible, Infective, Recovered (SIR) model [4]: dS/dt=-β(t) SI/N (1) dI/dt=β(t) SI/N - γI, (2) where N=350,000,000.
We assumed that γ=1/3 days-1 [5], and that the contact rate, β(t), was periodically forced via β(t)=β0+β1 cos(2πt) (3)The reproduction number was given by R0=β(t)/γ.
To simulate the time evolution of the influenza H1N1 pandemic, we assumed an initial number of infective individuals and susceptibles, I0=1/N and S0=N, respectively, at an initial time t0. Given particular values of β0, β1, and t0, we numerically solved equations (1) and (2) to estimate the fraction of the population infected with pandemic H1N1 influenza each week.
We compared the shape of the results of the deterministic model to the shape of the actual pandemic influenza data, and found the parameters {β0,β1,t0} that provided the best Pearson chi-square statistics.
The grid search for the parameters that minimised the chi-square value was performed with parameter ranges: β0 between 0.92 to 2.52 in increments of 0.02, β1 between 0.05 to 0.80 in increments of 0.01, and t0 between weeks -8 to 10 (relative to the beginning of 2009), in increments of one week.
The planned CDC vaccination programme against pandemic H1N1 influenza will begin with six to seven million doses being delivered by the end of the first full week in October (week 40), with 10 to 20 million doses being delivered weekly thereafter [6]. We included the effects of this vaccination campaign into our seasonally forced SIR model by decreasing the number of susceptibles in the population by the corresponding amounts. For healthy adults, full immunity to H1N1 influenza is achieved about two weeks after vaccination with one dose of the vaccine [7,8], and we took this into account in the model by beginning the reduction in susceptibles in week 42 instead of in week 40. We optimistically assumed the higher-end estimate of the planned vaccine roll-out, and we also optimistically assumed that 100% of vaccinated people would achieve full immunity within two weeks.
Results
When the seasonally forced SIR model was compared to the influenza H1N1 data, the parameters {β0,β1,t0} that yielded the minimum chi-square value were {1.56, 0.54, 24 Feb 2009}, with 95% confidence intervals (CI) of {1.43,1.77, 0.39,0.54, 8 Feb 2009,7 Mar 2009}.
The best-fit model is shown in Figure 2, with the influenza H1N1 data overlaid. The model predicts that the peak wave of infection will occur near the end of October in week 42 (95% CI: week 39,43), with 8% of the population being infected during that week (95% CI: 6%,13%). By the end of 2009, the model predicts that a total of 63% of the population will have been infected (95% CI: 57%,70%).
[Figure 2. Model of the H1N1 influenza pandemic in the United States and prediction for autumn 2009]
When the model was modified to include the effect of the planned vaccination scheme, it predicted a relative reduction of about 6% in the total number of people infected with influenza A(H1N1)v virus by the end of the year 2009 (95% CI: 1%,17%). The predictions of the modified model are shown in Figure 2.
Discussion
Based on a model with simple harmonic seasonal forcing, the peak of the H1N1 influenza pandemic was predicted to occur between weeks 39 to 43 with 95% confidence. However, it should be noted that the actual periodic function underlying seasonal forcing of influenza has not been well studied, and the uncertainties in the model predictions arising from seasonal forcing assumptions are difficult to quantify.
The 95% confidence interval for t0 predicted by this analysis was [8 Feb 2009, 7 Mar 2009], which is in good agreement with the genetic analysis presented in Fraser et al. that found t0 between 3 November 2008 and 2 March 2009 with 95% confidence [9]. Further, the value of R0 predicted by the model between mid-March and the end of April 2009 was between 1.3 and 1.7. This is in agreement with the results presented in Fraser et al. , who estimate R0 to be in the range 1.4 to 1.6, based on an analysis of Mexican H1N1 influenza data collected during that time period [9].We predict that almost two thirds of the US population will be infected with pandemic H1N1 influenza by the end of 2009. However, the serological analysis presented in King et al. showed that up to 60% of seasonal influenza infections are asymptomatic [10]. If the same is true of the current pandemic influenza, about a quarter of the population will fall ill.
The most optimistic assumptions about the CDC vaccination campaign yielded a relative reduction of only 6% in the total number of infected individuals. If we assume a 40% symptomatic infection rate, and a mortality rate of between 0.05% and 0.5%, this corresponds to an estimated prevention of between 2,500 and 25,000 deaths. The actual reduction would certainly be lower because 10-30% of adults vaccinated will not achieve immunity [7,8]. Also a large fraction of the population targeted by influenza A(H1N1) vaccinations are children. Vaccination immunity in children develops at least four weeks after vaccination and would occur too late in the pandemic to make a significant difference to the number of infected in that age group.
The cost benefit analysis involved in devising a pandemic influenza vaccination campaign is extremely complicated, especially due to the ever evolving nature of the pandemic. What we learn from the successes and mistakes of vaccination programmes developed during the current H1N1 influenza pandemic will greatly aid us in decision making during future influenza pandemics.
References
1. Questions and Answers: Seasonal Influenza. Atlanta: Centers for Disease Control and Prevention. [accessed 2009 Oct 2]. Available from: http://www.cdc.gov/flu/about/qa/disease.htm
2. FluView: 2008-2009 Influenza Season Week 38 ending September 26, 2009. Atlanta: Centers for Disease Control and Prevention. [accessed 2009 Oct 2]. Available from: http://www.cdc.gov/flu/weekly/fluactivity.htm
3. Influenza-like illness in the United States and Mexico. Geneva: World Health Organization; 22 April 2009. Avaliable from: http://www.who.int/csr/don/2009_04_24/en/index.html
4. Dushoff J, Plotkin JB, Levin SA, Earn DJ. Dynamical resonance can account for seasonal influenza epidemics. Proc Natl Acad Sci USA. 2004;101(48):16915-6.
5. Colizza V, Barrat A, Barthelemy M, Valleron A-J, Vespignani A. Modeling the worldwide spread of pandemic influenza: baseline case and containment interventions. PloS Med. 2007;4(1):e13.
6. Orders for Live Attenuated Influenza Vaccine. Washington: US Department of Health and Human Services [accessed 2009 Oct 2]. Available from: http://www.flu.gov/individualfamily/vaccination/orders.html
7. Hannoun C, Megas F, Piercy J. Immunogenicity and Protective Efficacy of Influenza Vaccination. Virus Res. 2004 Jul;103(1-2):133-8.
8. Clark TW, Pareek M, Hoschler K, Dillon H, Nicholson KG, Groth N, et al. Trial of influenza A (H1N1) 2009 monovalent MF59-adjuvanted vaccine -preliminary report. N Engl J Med. 2009;361. DOI: 10.1056/NEJMoa0907650.
9. Fraser C, Donnelly CA, Cauchemez S, Hanage WP, Van Kerkhove MD, Hollingsworth TD, et al; WHO Rapid pandemic Assessment Collaboration. Pandemic potential of a strain of influenza A (H1N1): early findings. Science. 2009;324(5934):1557-61.
10. King JC Jr, Haugh CJ, Dupont WD, Thompson JM, Wright PF, Edwards KM. Laboratory and Epidemiological Assessment of a Recent Influenza B Outbreak. J Med Virol. 1988;25(3):361-8.
-