
Install the app
How to install the app on iOS
Follow along with the video below to see how to install our site as a web app on your home screen.
Note: This feature may not be available in some browsers.
-
FluTrackers.com Inc. does not provide medical advice. Information on this web site is collected from various internet resources, and the FluTrackers board of directors makes no warranty to the safety, efficacy, correctness or completeness of the information posted on this site by any author or poster. The information collated here is for instructional and/or discussion purposes only and is NOT intended to diagnose or treat any disease, illness, or other medical condition. Every individual reader or poster should seek advice from their personal physician/healthcare practitioner before considering or using any interventions that are discussed on this website. By continuing to access this website you agree to consult your personal physican before using any interventions posted on this website, and you agree to hold harmless FluTrackers.com Inc., the board of directors, the members, and all authors and posters for any effects from use of any medication, supplement, vitamin or other substance, device, intervention, etc. mentioned in posts on this website, or other internet venues referenced in posts on this website. -
We are not asking for any donations. Do not donate to any entity who says they are raising funds for us.
- Home
- Forums
- Forum
- How to Prepare for a Pandemic and How to Cope
- National & International Government & NGO Preparat
- CDC General Information
You are using an out of date browser. It may not display this or other websites correctly.
You should upgrade or use an alternative browser.
You should upgrade or use an alternative browser.
CDC Weekly Report: Influenza Summary Update
- Thread starter cartski
- Start date

Niko
Editor, Senior Moderator
Re: CDC Weekly Report: Influenza Summary Update
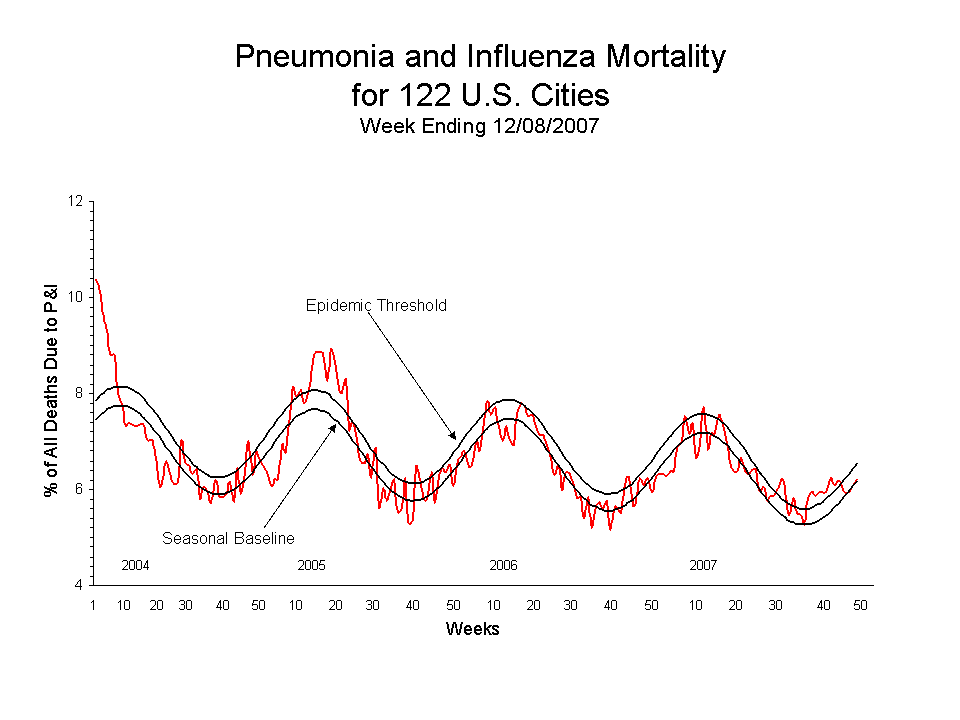
What does this mean?
"The proportion of deaths attributed to pneumonia and influenza was below the epidemic threshold."
Thanks,
J.

Snowy Owl
Retired in 2010, In Memoriam
Re: CDC Weekly Report: Influenza Summary Update
2007-2008 Influenza Season Week 51, ending December 22, 2007
(All data are preliminary and may change as more reports are received.) Synopsis
During week 51 (December 16-22, 2007), influenza activity continued to increase in the United States.
</caption> <tbody><tr valign="top"> <th rowspan="2" valign="bottom" width="85">
* Elevated means the % of visits for ILI or ARI is at or above the national or region-specific baseline
? National data is for current week; regional data is for the most recent 3 weeks.
? Includes all 50 states and the District of Columbia
Laboratory Surveillance
During week 51, WHO and NREVSS laboratories reported 2,059 specimens tested for influenza viruses, 77 (3.7%) of which were positive, including 16 influenza A (H1) viruses, four influenza A (H3) viruses, 38 influenza A viruses that were not subtyped, and 19 influenza B viruses. The District of Columbia and 39 states from all nine surveillance regions have reported laboratory-confirmed influenza this season.
Since September 30, 2007, WHO and NREVSS laboratories have tested a total of 37,275 specimens for influenza viruses and 980 (2.6%) were positive. Among the 980 influenza viruses, 873 (89.1%) were influenza A viruses and 107 (10.9%) were influenza B viruses. Two hundred fifty-five (29.2%) of the 873 influenza A viruses have been subtyped: 201 (78.8%) were influenza A (H1) viruses and 54 (21.2%) were influenza A (H3) viruses.
<center>

View WHO-NREVSS Regional Bar Charts | View Chart Data | View Full Screen </center> Antigenic Characterization:
CDC has antigenically characterized 66 influenza viruses [32 influenza A (H1), 19 influenza A (H3), and 15 influenza B viruses] collected by U.S. laboratories since September 30, 2007.
During week 51, 6.6% of all deaths reported through the 122-Cities Mortality Reporting System were reported as due to P&I. This percentage is below the epidemic threshold of 6.7% for week 51.
<center>

View Full Screen</center> Influenza-Associated Pediatric Mortality
One influenza-associated pediatric death was reported during week 51 from New York City. This death occurred during the 2006-07 season bringing the total number of cases occurring during that season to 74. One influenza-associated pediatric death occurring during the 2007-08 season has been reported.
<center>

View Full Screen</center> Influenza-Associated Pediatric Hospitalizations
Laboratory-confirmed influenza-associated pediatric hospitalizations are monitored in two population-based surveillance networks: the New Vaccine Surveillance Network (NVSN) and the Emerging Infections Program (EIP).
No influenza-associated pediatric hospitalizations have been reported from the NVSN.
During September 30-December 8, 2007, the preliminary laboratory-confirmed influenza-associated hospitalization rate reported by the EIP for children 0?17 years old was 0.02 per 10,000. For children aged 0-4 years and 5-17 years, the rate was 0.03 per 10,000 and 0.005 per 10,000, respectively.
<center>

View Full Screen </center> Outpatient Illness Surveillance
Nationwide during week 51, 2.2% of outpatient visits reported through the U.S. Influenza Sentinel Provider Surveillance Network were due to influenza-like illness (ILI) and 2.5% of patient visits to Department of Veteran?s Affairs (VA) and Department of Defense (DoD) outpatient treatment facilities were for acute respiratory illness (ARI). The percentage of visits for ILI was equal to the national baseline of 2.2%, while the percentage of visits for ARI was below the national baseline of 3.2%. On a regional level, the percentage of visits for ILI ranged from 0.9% to 5.1% and the percentage of visits for ARI ranged from 1.2% to 3.1%. The Mountain, Pacific, and West South Central regions reported ILI above their region-specific baselines. The increase in the percentage of patient visits for ILI may be influenced by a reduction in routine healthcare visits during the holiday season, as has occurred in previous seasons. All nine regions reported percentages of visits for ARI below their respective region-specific baselines. All five age groups reported percentages of visits for ARI below their respective age-specific baselines.
<center>

View Sentinel Providers Regional Charts | View Chart Data |View Full Screen

View Full Screen </center> Geographic Spread of Influenza as Assessed by State and Territorial Epidemiologists
During week 51 the following influenza activity was reported:
A description of surveillance methods is available at: http://www.cdc.gov/flu/weekly/fluactivity.htm
<script type="text/javascript"> <!-- function popupnr(mylink, windowname, refocus) { var mywin, href; if (typeof(mylink) == 'string') href=""mylink; else href=mylink.href; mywin = window.open('', windowname, 'width=450,height=550,scrollbars=yes'); // if opened the window if ( mywin.closed || (! mywin.document.URL) || (mywin.document.URL.indexOf("about") == 0) ) mywin.location=href; else if (refocus) mywin.focus(); return false; } //--> </script>
2007-2008 Influenza Season Week 51, ending December 22, 2007
(All data are preliminary and may change as more reports are received.) Synopsis
During week 51 (December 16-22, 2007), influenza activity continued to increase in the United States.
- Seventy-seven (3.7%) specimens tested by U.S. World Health Organization (WHO) and National Respiratory and Enteric Virus Surveillance System (NREVSS) collaborating laboratories were positive for influenza.
- The proportion of deaths attributed to pneumonia and influenza was below the epidemic threshold.
- The proportion of outpatient visits for influenza-like illness (ILI) was equal to the national baseline. The Mountain, Pacific, and West South Central regions reported ILI above their region-specific baselines. The proportion of outpatient visits for acute respiratory illness (ARI) was below national baseline levels.
- Three states reported regional influenza activity; six states reported local influenza activity; 32 states reported sporadic influenza activity; eight states reported no influenza activity; and one state and the District of Columbia did not report.
</caption> <tbody><tr valign="top"> <th rowspan="2" valign="bottom" width="85">
Region
</th> <th colspan="4" align="center" nowrap="nowrap" width="300">Data for current week</th> <th colspan="5" align="center" nowrap="nowrap" width="276">Data cumulative for the season</th> </tr> <tr valign="top"> <th align="center" width="72">Sentinel Provider ILI*</th> <th align="center" width="72">DoD and VA ARI*</th> <th align="center" width="60">% pos. for flu?</th> <th align="center" width="96"># jurisdictions reporting regional or widespread activity? </th> <th align="center" nowrap="nowrap" width="48">A (H1)</th> <th align="center" nowrap="nowrap" width="48">A (H3)</th> <th align="center" width="60">A Unsub-typed</th> <th align="center" nowrap="nowrap" width="48">B</th> <th align="center" width="72">Pediatric Deaths</th> </tr> <tr> <td align="left" width="85">Nation</td> <td align="center" nowrap="nowrap" width="72">Elevated</td> <td align="center" nowrap="nowrap" width="72">Normal</td> <td align="center" nowrap="nowrap" width="60">3.7 % </td> <td align="center" nowrap="nowrap" width="96">3 of 51 </td> <td align="center" nowrap="nowrap" width="48">201</td> <td align="center" nowrap="nowrap" width="48">54</td> <td align="center" nowrap="nowrap" width="60">618</td> <td align="center" nowrap="nowrap" width="48">107</td> <td align="center" nowrap="nowrap" width="72">1</td> </tr> <tr> <td align="left" width="85">New England</td> <td align="center" nowrap="nowrap" width="72">Normal</td> <td align="center" nowrap="nowrap" width="72">Normal</td> <td align="center" nowrap="nowrap" width="60">2.0 % </td> <td align="center" nowrap="nowrap" width="96">0 of 6</td> <td align="center" nowrap="nowrap" width="48">8</td> <td align="center" nowrap="nowrap" width="48">0</td> <td align="center" nowrap="nowrap" width="60">15</td> <td align="center" nowrap="nowrap" width="48">6</td> <td align="center" nowrap="nowrap" width="72">0</td> </tr> <tr> <td align="left" width="85">Mid-Atlantic</td> <td align="center" nowrap="nowrap" width="72">Normal</td> <td align="center" nowrap="nowrap" width="72">Normal</td> <td align="center" nowrap="nowrap" width="60">1.9 % </td> <td align="center" nowrap="nowrap" width="96">0 of 3</td> <td align="center" nowrap="nowrap" width="48">5</td> <td align="center" nowrap="nowrap" width="48">1</td> <td align="center" nowrap="nowrap" width="60">13</td> <td align="center" nowrap="nowrap" width="48">16</td> <td align="center" nowrap="nowrap" width="72">0</td> </tr> <tr> <td align="left" width="85">East North Central</td> <td align="center" nowrap="nowrap" width="72">Normal</td> <td align="center" nowrap="nowrap" width="72">Normal</td> <td align="center" nowrap="nowrap" width="60">7.1 % </td> <td align="center" nowrap="nowrap" width="96">0 of 5</td> <td align="center" nowrap="nowrap" width="48">5</td> <td align="center" nowrap="nowrap" width="48">11</td> <td align="center" nowrap="nowrap" width="60">6</td> <td align="center" nowrap="nowrap" width="48">6</td> <td align="center" nowrap="nowrap" width="72">0</td> </tr> <tr> <td align="left" width="85">West North Central</td> <td align="center" nowrap="nowrap" width="72">Normal</td> <td align="center" nowrap="nowrap" width="72">Normal</td> <td align="center" nowrap="nowrap" width="60">1.2 % </td> <td align="center" nowrap="nowrap" width="96">0 of 7</td> <td align="center" nowrap="nowrap" width="48">5</td> <td align="center" nowrap="nowrap" width="48">2</td> <td align="center" nowrap="nowrap" width="60">24</td> <td align="center" nowrap="nowrap" width="48">7</td> <td align="center" nowrap="nowrap" width="72">0</td> </tr> <tr> <td align="left" width="85">South Atlantic</td> <td align="center" nowrap="nowrap" width="72">Normal</td> <td align="center" nowrap="nowrap" width="72">Normal</td> <td align="center" nowrap="nowrap" width="60">3.7 % </td> <td align="center" nowrap="nowrap" width="96">0 of 9</td> <td align="center" nowrap="nowrap" width="48">5</td> <td align="center" nowrap="nowrap" width="48">9</td> <td align="center" nowrap="nowrap" width="60">149</td> <td align="center" nowrap="nowrap" width="48">35</td> <td align="center" nowrap="nowrap" width="72">0</td> </tr> <tr> <td align="left" width="85">East South Central</td> <td align="center" nowrap="nowrap" width="72">Normal</td> <td align="center" nowrap="nowrap" width="72">Normal</td> <td align="center" nowrap="nowrap" width="60">0.4 % </td> <td align="center" nowrap="nowrap" width="96">0 of 4</td> <td align="center" nowrap="nowrap" width="48">2</td> <td align="center" nowrap="nowrap" width="48">1</td> <td align="center" nowrap="nowrap" width="60">0</td> <td align="center" nowrap="nowrap" width="48">0</td> <td align="center" nowrap="nowrap" width="72">0</td> </tr> <tr> <td align="left" width="85">West South Central</td> <td align="center" nowrap="nowrap" width="72">Elevated</td> <td align="center" nowrap="nowrap" width="72">Normal</td> <td align="center" nowrap="nowrap" width="60">7.6 % </td> <td align="center" nowrap="nowrap" width="96">1 of 4</td> <td align="center" nowrap="nowrap" width="48">8</td> <td align="center" nowrap="nowrap" width="48">24</td> <td align="center" nowrap="nowrap" width="60">299</td> <td align="center" nowrap="nowrap" width="48">11</td> <td align="center" nowrap="nowrap" width="72">1</td> </tr> <tr> <td align="left" width="85">Mountain</td> <td align="center" nowrap="nowrap" width="72">Elevated</td> <td align="center" nowrap="nowrap" width="72">Normal</td> <td align="center" nowrap="nowrap" width="60">8.1 % </td> <td align="center" nowrap="nowrap" width="96">2 of 8</td> <td align="center" nowrap="nowrap" width="48">100</td> <td align="center" nowrap="nowrap" width="48">0</td> <td align="center" nowrap="nowrap" width="60">58</td> <td align="center" nowrap="nowrap" width="48">18</td> <td align="center" nowrap="nowrap" width="72">0</td> </tr> <tr> <td align="left" width="85">Pacific</td> <td align="center" nowrap="nowrap" width="72">Elevated</td> <td align="center" nowrap="nowrap" width="72">Normal</td> <td align="center" nowrap="nowrap" width="60">4.3 % </td> <td align="center" nowrap="nowrap" width="96">0 of 5</td> <td align="center" nowrap="nowrap" width="48">63</td> <td align="center" nowrap="nowrap" width="48">6</td> <td align="center" nowrap="nowrap" width="60">54</td> <td align="center" nowrap="nowrap" width="48">8</td> <td align="center" nowrap="nowrap" width="72">0</td> </tr> </tbody></table> * Elevated means the % of visits for ILI or ARI is at or above the national or region-specific baseline
? National data is for current week; regional data is for the most recent 3 weeks.
? Includes all 50 states and the District of Columbia
Laboratory Surveillance
During week 51, WHO and NREVSS laboratories reported 2,059 specimens tested for influenza viruses, 77 (3.7%) of which were positive, including 16 influenza A (H1) viruses, four influenza A (H3) viruses, 38 influenza A viruses that were not subtyped, and 19 influenza B viruses. The District of Columbia and 39 states from all nine surveillance regions have reported laboratory-confirmed influenza this season.
Since September 30, 2007, WHO and NREVSS laboratories have tested a total of 37,275 specimens for influenza viruses and 980 (2.6%) were positive. Among the 980 influenza viruses, 873 (89.1%) were influenza A viruses and 107 (10.9%) were influenza B viruses. Two hundred fifty-five (29.2%) of the 873 influenza A viruses have been subtyped: 201 (78.8%) were influenza A (H1) viruses and 54 (21.2%) were influenza A (H3) viruses.
<center>
View WHO-NREVSS Regional Bar Charts | View Chart Data | View Full Screen </center> Antigenic Characterization:
CDC has antigenically characterized 66 influenza viruses [32 influenza A (H1), 19 influenza A (H3), and 15 influenza B viruses] collected by U.S. laboratories since September 30, 2007.
Influenza A (H1) [32]
- All 32 viruses were characterized as A/Solomon Islands/3/2006, the influenza A (H1) component of the 2007-08 influenza vaccine for the Northern Hemisphere and the 2008 influenza A (H1) component for the Southern Hemisphere
Influenza A (H3) [19]
- Four viruses were characterized as A/Wisconsin/67/2005-like, the influenza A (H3) component of the 2007-08 influenza vaccine for the Northern Hemisphere.
- Fourteen viruses were characterized as A/Brisbane/10/2007-like. A/Brisbane/10/2007 is a recent antigenic variant which evolved from A/Wisconsin/67/2005-like. A/Brisbane/10/2007-like virus is the recommended influenza A (H3) component for the 2008 Southern Hemisphere vaccine.
- One virus showed somewhat reduced titers with antisera produced against A/Wisconsin/67/2005 and A/Brisbane/10/2007.
Influenza B (B/Victoria/02/87 and B/Yamagata/16/88 lineages) [15]
It is too early in the influenza season to determine which influenza viruses will predominate or how well the vaccine and circulating strains will match. Pneumonia and Influenza (P&I) Mortality Surveillance- Victoria lineage [0]
- The recommended influenza B component for the 2007-08 influenza vaccine is a B/Malaysia/2506/2004-like virus, belonging to the B/Victoria lineage.
- Yamagata lineage [15]
- All 15 viruses were identified as belonging to the B/Yamagata lineage.
During week 51, 6.6% of all deaths reported through the 122-Cities Mortality Reporting System were reported as due to P&I. This percentage is below the epidemic threshold of 6.7% for week 51.
<center>
View Full Screen</center> Influenza-Associated Pediatric Mortality
One influenza-associated pediatric death was reported during week 51 from New York City. This death occurred during the 2006-07 season bringing the total number of cases occurring during that season to 74. One influenza-associated pediatric death occurring during the 2007-08 season has been reported.
<center>
View Full Screen</center> Influenza-Associated Pediatric Hospitalizations
Laboratory-confirmed influenza-associated pediatric hospitalizations are monitored in two population-based surveillance networks: the New Vaccine Surveillance Network (NVSN) and the Emerging Infections Program (EIP).
No influenza-associated pediatric hospitalizations have been reported from the NVSN.
During September 30-December 8, 2007, the preliminary laboratory-confirmed influenza-associated hospitalization rate reported by the EIP for children 0?17 years old was 0.02 per 10,000. For children aged 0-4 years and 5-17 years, the rate was 0.03 per 10,000 and 0.005 per 10,000, respectively.
<center>
View Full Screen </center> Outpatient Illness Surveillance
Nationwide during week 51, 2.2% of outpatient visits reported through the U.S. Influenza Sentinel Provider Surveillance Network were due to influenza-like illness (ILI) and 2.5% of patient visits to Department of Veteran?s Affairs (VA) and Department of Defense (DoD) outpatient treatment facilities were for acute respiratory illness (ARI). The percentage of visits for ILI was equal to the national baseline of 2.2%, while the percentage of visits for ARI was below the national baseline of 3.2%. On a regional level, the percentage of visits for ILI ranged from 0.9% to 5.1% and the percentage of visits for ARI ranged from 1.2% to 3.1%. The Mountain, Pacific, and West South Central regions reported ILI above their region-specific baselines. The increase in the percentage of patient visits for ILI may be influenced by a reduction in routine healthcare visits during the holiday season, as has occurred in previous seasons. All nine regions reported percentages of visits for ARI below their respective region-specific baselines. All five age groups reported percentages of visits for ARI below their respective age-specific baselines.
<center>
View Sentinel Providers Regional Charts | View Chart Data |View Full Screen
View Full Screen </center> Geographic Spread of Influenza as Assessed by State and Territorial Epidemiologists
During week 51 the following influenza activity was reported:
- Regional activity was reported by three states (Arizona, Colorado, and Texas).
- Local activity was reported by six states (Florida, Hawaii, Maryland, Montana, New Jersey, and Virginia).
- Sporadic activity was reported by the 32 states (Alabama, Alaska, California, Connecticut, Delaware, Illinois, Indiana, Iowa, Kansas, Kentucky, Louisiana, Maine, Massachusetts, Michigan, Minnesota, Missouri, Nebraska, New Hampshire, New Mexico, New York, North Carolina, North Dakota, Oklahoma, Oregon, Pennsylvania, Rhode Island, South Dakota, Tennessee, Utah, Washington, Wisconsin, and Wyoming).
- No activity was reported by eight states (Arkansas, Georgia, Idaho, Mississippi, Ohio, South Carolina, Vermont, and West Virginia).
- One state (Nevada) and the District of Columbia did not report
<embed type="application/x-shockwave-flash" src="http://www.cdc.gov/flu/weekly/smallmap/SmallFluActivity_v2.swf?c=FluMap&n=1185712619187" id="Banner" name="Banner" quality="high" height="420" width="100%">
<script type="text/javascript"> var stamp = new Date() var movieurl = "/flu/weekly/smallmap/SmallFluActivity_v2.swf?c=FluMap&n=" + stamp.getTime(); var so = new SWFObject(movieurl, "Banner", "100%", "420", "7"); so.write("flashALTcontent"); so.addParam("scale", "noorder"); so.addParam("allowScriptAccess","sameDomain"); so.addParam("wmode", "transparent"); so.addParam("quality", "best"); so.addParam("salign", "r"); so.addParam("type", "application/x-shockwave-flash"); </script>
--------------------------------------------------------------------------------<script type="text/javascript"> var stamp = new Date() var movieurl = "/flu/weekly/smallmap/SmallFluActivity_v2.swf?c=FluMap&n=" + stamp.getTime(); var so = new SWFObject(movieurl, "Banner", "100%", "420", "7"); so.write("flashALTcontent"); so.addParam("scale", "noorder"); so.addParam("allowScriptAccess","sameDomain"); so.addParam("wmode", "transparent"); so.addParam("quality", "best"); so.addParam("salign", "r"); so.addParam("type", "application/x-shockwave-flash"); </script>
A description of surveillance methods is available at: http://www.cdc.gov/flu/weekly/fluactivity.htm
<script type="text/javascript"> <!-- function popupnr(mylink, windowname, refocus) { var mywin, href; if (typeof(mylink) == 'string') href=""mylink; else href=mylink.href; mywin = window.open('', windowname, 'width=450,height=550,scrollbars=yes'); // if opened the window if ( mywin.closed || (! mywin.document.URL) || (mywin.document.URL.indexOf("about") == 0) ) mywin.location=href; else if (refocus) mywin.focus(); return false; } //--> </script>
- <!--
- Page last reviewed-->
- Page last updated December 28, 2007
- Content Source: Coordinating Center for Infectious Diseases (CCID)
- National Center for Immunization and Respiratory Diseases (NCIRD)
Snowy Owl
Retired in 2010, In Memoriam
Re: CDC Weekly Report: Influenza Summary Update
2007-2008 Influenza Season Week 52, ending December 29, 2007
(All data are preliminary and may change as more reports are received.) Synopsis
During week 52 (December 23-29, 2007), influenza activity continued to increase in the United States.
</caption> <tbody><tr valign="top"> <th rowspan="2" valign="bottom" width="85">
* Elevated means the % of visits for ILI or ARI is at or above the national or region-specific baseline
? National data is for current week; regional data is for the most recent 3 weeks.
? Includes all 50 states and the District of Columbia
Laboratory Surveillance
During week 52, WHO and NREVSS laboratories reported 3,358 specimens tested for influenza viruses, 108 (3.2%) of which were positive, including 20 influenza A (H1) viruses, seven influenza A (H3) viruses, 57 influenza A viruses that were not subtyped, and 24 influenza B viruses. The District of Columbia and 39 states from all nine surveillance regions have reported laboratory-confirmed influenza this season.
Since September 30, 2007, WHO and NREVSS laboratories have tested a total of 43,184 specimens for influenza viruses and 1,197 (2.8%) were positive. Among the 1,197 influenza viruses, 1,051 (87.8%) were influenza A viruses and 146 (12.2%) were influenza B viruses. Three hundred twenty-six (31.0%) of the 1,051 influenza A viruses have been subtyped: 253 (77.6%) were influenza A (H1) viruses and 73 (22.4%) were influenza A (H3) viruses.
<center>

View WHO-NREVSS Regional Bar Charts | View Chart Data | View Full Screen </center> Antigenic Characterization:
CDC has antigenically characterized 79 influenza viruses [32 influenza A (H1), 19 influenza A (H3), and 28 influenza B viruses] collected by U.S. laboratories since September 30, 2007.
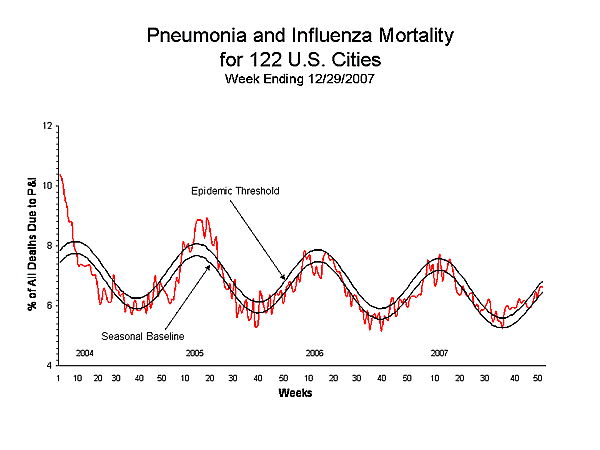
During week 52, 6.6% of all deaths reported through the 122-Cities Mortality Reporting System were reported as due to P&I. This percentage is below the epidemic threshold of 6.8% for week 52.
<center>
View Full Screen</center> Influenza-Associated Pediatric Mortality
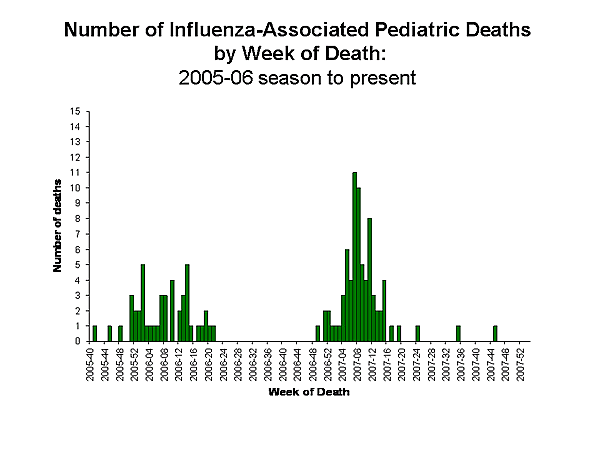
No influenza pediatric deaths were reported during week 52. One influenza-associated pediatric death occurring during the 2007-08 season has been reported.
<center>
View Full Screen</center> Influenza-Associated Pediatric Hospitalizations
Laboratory-confirmed influenza-associated pediatric hospitalizations are monitored in two population-based surveillance networks: the New Vaccine Surveillance Network (NVSN) and the Emerging Infections Program (EIP).
No influenza-associated pediatric hospitalizations have been reported from the NVSN.
During September 30-December 22, 2007, the preliminary laboratory-confirmed influenza-associated hospitalization rate reported by the EIP for children 0?17 years old was 0.05 per 10,000. For children aged 0-4 years and 5-17 years, the rate was 0.12 per 10,000 and 0.01 per 10,000, respectively.
<center>

View Full Screen </center> Outpatient Illness Surveillance
Nationwide during week 52, 2.5% of outpatient visits reported through the U.S. Influenza Sentinel Provider Surveillance Network were due to influenza-like illness (ILI) and 3.5% of patient visits to Department of Veteran?s Affairs (VA) and Department of Defense (DoD) outpatient treatment facilities were for acute respiratory illness (ARI). These percentages are above the national baselines of 2.2% and 3.2%, respectively. On a regional level, the percentage of visits for ILI ranged from 0.9% to 4.4% and the percentage of visits for ARI ranged from 1.7% to 4.4%. The East North Central, East South Central, Mountain, New England, South Atlantic, and West South Central regions reported ILI equal to or above their regions specific baselines, and the East North Central, Pacific, and West South Central regions reported ARI equal to or above their region-specific baselines. The percentages of visits reported for ARI in the 18-49 years, 50-64 years, and >64 years age groups were above their respective age-specific baselines. The increase in the percentage of patient visits for ILI and ARI may be influenced by a reduction in routine healthcare visits during the holiday season, as has occurred in previous seasons.
<center>

View Sentinel Providers Regional Charts | View Chart Data |View Full Screen

View Full Screen </center> Geographic Spread of Influenza as Assessed by State and Territorial Epidemiologists
During week 52 the following influenza activity was reported:
A description of surveillance methods is available at: http://www.cdc.gov/flu/weekly/fluactivity.htm
<script type="text/javascript"> <!-- function popupnr(mylink, windowname, refocus) { var mywin, href; if (typeof(mylink) == 'string') href=""mylink; else href=mylink.href; mywin = window.open('', windowname, 'width=450,height=550,scrollbars=yes'); // if opened the window if ( mywin.closed || (! mywin.document.URL) || (mywin.document.URL.indexOf("about") == 0) ) mywin.location=href; else if (refocus) mywin.focus(); return false; } //--> </script>
2007-2008 Influenza Season Week 52, ending December 29, 2007
(All data are preliminary and may change as more reports are received.) Synopsis
During week 52 (December 23-29, 2007), influenza activity continued to increase in the United States.
- One hundred eight (3.2%) specimens tested by U.S. World Health Organization (WHO) and National Respiratory and Enteric Virus Surveillance System (NREVSS) collaborating laboratories were positive for influenza.
- The proportion of deaths attributed to pneumonia and influenza was below the epidemic threshold.
- The proportion of outpatient visits for influenza-like illness (ILI) and acute respiratory illness (ARI) was above national baseline levels. The East North Central, East South Central, Mountain, New England, South Atlantic, and West South Central regions reported ILI equal to or above their region-specific baselines, and the East North Central, Pacific, and West South Central regions reported ARI equal to or above their region-specific baselines.
- Five states reported regional influenza activity; nine states reported local influenza activity; 33 states, the District of Columbia, and Puerto Rico reported sporadic influenza activity; and three states reported no influenza activity.
</caption> <tbody><tr valign="top"> <th rowspan="2" valign="bottom" width="85">
Region
</th> <th colspan="4" align="center" nowrap="nowrap" width="300">Data for current week</th> <th colspan="5" align="center" nowrap="nowrap" width="276">Data cumulative for the season</th> </tr> <tr valign="top"> <th align="center" width="72">Sentinel Provider ILI*</th> <th align="center" width="72">DoD and VA ARI*</th> <th align="center" width="60">% pos. for flu?</th> <th align="center" width="96"># jurisdictions reporting regional or widespread activity? </th> <th align="center" nowrap="nowrap" width="48">A (H1)</th> <th align="center" nowrap="nowrap" width="48">A (H3)</th> <th align="center" width="60">A Unsub-typed</th> <th align="center" nowrap="nowrap" width="48">B</th> <th align="center" width="72">Pediatric Deaths</th> </tr> <tr> <td align="left" width="85">Nation</td> <td align="center" nowrap="nowrap" width="72">Elevated</td> <td align="center" nowrap="nowrap" width="72">Elevated</td> <td align="center" nowrap="nowrap" width="60">3.2 % </td> <td align="center" nowrap="nowrap" width="96">5 of 51 </td> <td align="center" nowrap="nowrap" width="48">253</td> <td align="center" nowrap="nowrap" width="48">73</td> <td align="center" nowrap="nowrap" width="60">725</td> <td align="center" nowrap="nowrap" width="48">146</td> <td align="center" nowrap="nowrap" width="72">1</td> </tr> <tr> <td align="left" width="85">New England</td> <td align="center" nowrap="nowrap" width="72">Elevated</td> <td align="center" nowrap="nowrap" width="72">Normal</td> <td align="center" nowrap="nowrap" width="60">2.7 % </td> <td align="center" nowrap="nowrap" width="96">0 of 6</td> <td align="center" nowrap="nowrap" width="48">12</td> <td align="center" nowrap="nowrap" width="48">1</td> <td align="center" nowrap="nowrap" width="60">21</td> <td align="center" nowrap="nowrap" width="48">9</td> <td align="center" nowrap="nowrap" width="72">0</td> </tr> <tr> <td align="left" width="85">Mid-Atlantic</td> <td align="center" nowrap="nowrap" width="72">Normal</td> <td align="center" nowrap="nowrap" width="72">Normal</td> <td align="center" nowrap="nowrap" width="60">2.1 % </td> <td align="center" nowrap="nowrap" width="96">1 of 3</td> <td align="center" nowrap="nowrap" width="48">5</td> <td align="center" nowrap="nowrap" width="48">1</td> <td align="center" nowrap="nowrap" width="60">19</td> <td align="center" nowrap="nowrap" width="48">26</td> <td align="center" nowrap="nowrap" width="72">0</td> </tr> <tr> <td align="left" width="85">East North Central</td> <td align="center" nowrap="nowrap" width="72">Elevated</td> <td align="center" nowrap="nowrap" width="72">Elevated</td> <td align="center" nowrap="nowrap" width="60">15.8 % </td> <td align="center" nowrap="nowrap" width="96">0 of 5</td> <td align="center" nowrap="nowrap" width="48">21</td> <td align="center" nowrap="nowrap" width="48">13</td> <td align="center" nowrap="nowrap" width="60">6</td> <td align="center" nowrap="nowrap" width="48">9</td> <td align="center" nowrap="nowrap" width="72">0</td> </tr> <tr> <td align="left" width="85">West North Central</td> <td align="center" nowrap="nowrap" width="72">Normal</td> <td align="center" nowrap="nowrap" width="72">Normal</td> <td align="center" nowrap="nowrap" width="60">1.4 % </td> <td align="center" nowrap="nowrap" width="96">0 of 7</td> <td align="center" nowrap="nowrap" width="48">5</td> <td align="center" nowrap="nowrap" width="48">3</td> <td align="center" nowrap="nowrap" width="60">25</td> <td align="center" nowrap="nowrap" width="48">10</td> <td align="center" nowrap="nowrap" width="72">0</td> </tr> <tr> <td align="left" width="85">South Atlantic</td> <td align="center" nowrap="nowrap" width="72">Elevated</td> <td align="center" nowrap="nowrap" width="72">Normal</td> <td align="center" nowrap="nowrap" width="60">3.6 % </td> <td align="center" nowrap="nowrap" width="96">0 of 9</td> <td align="center" nowrap="nowrap" width="48">12</td> <td align="center" nowrap="nowrap" width="48">10</td> <td align="center" nowrap="nowrap" width="60">163</td> <td align="center" nowrap="nowrap" width="48">39</td> <td align="center" nowrap="nowrap" width="72">0</td> </tr> <tr> <td align="left" width="85">East South Central</td> <td align="center" nowrap="nowrap" width="72">Elevated</td> <td align="center" nowrap="nowrap" width="72">Normal</td> <td align="center" nowrap="nowrap" width="60">0.0 % </td> <td align="center" nowrap="nowrap" width="96">0 of 4</td> <td align="center" nowrap="nowrap" width="48">2</td> <td align="center" nowrap="nowrap" width="48">1</td> <td align="center" nowrap="nowrap" width="60">0</td> <td align="center" nowrap="nowrap" width="48">0</td> <td align="center" nowrap="nowrap" width="72">0</td> </tr> <tr> <td align="left" width="85">West South Central</td> <td align="center" nowrap="nowrap" width="72">Elevated</td> <td align="center" nowrap="nowrap" width="72">Elevated</td> <td align="center" nowrap="nowrap" width="60">4.1 % </td> <td align="center" nowrap="nowrap" width="96">1 of 4</td> <td align="center" nowrap="nowrap" width="48">14</td> <td align="center" nowrap="nowrap" width="48">34</td> <td align="center" nowrap="nowrap" width="60">343</td> <td align="center" nowrap="nowrap" width="48">16</td> <td align="center" nowrap="nowrap" width="72">1</td> </tr> <tr> <td align="left" width="85">Mountain</td> <td align="center" nowrap="nowrap" width="72">Elevated</td> <td align="center" nowrap="nowrap" width="72">Normal</td> <td align="center" nowrap="nowrap" width="60">11.2 % </td> <td align="center" nowrap="nowrap" width="96">2 of 8</td> <td align="center" nowrap="nowrap" width="48">114</td> <td align="center" nowrap="nowrap" width="48">3</td> <td align="center" nowrap="nowrap" width="60">91</td> <td align="center" nowrap="nowrap" width="48">27</td> <td align="center" nowrap="nowrap" width="72">0</td> </tr> <tr> <td align="left" width="85">Pacific</td> <td align="center" nowrap="nowrap" width="72">Normal</td> <td align="center" nowrap="nowrap" width="72">Elevated</td> <td align="center" nowrap="nowrap" width="60">4.5 % </td> <td align="center" nowrap="nowrap" width="96">1 of 5</td> <td align="center" nowrap="nowrap" width="48">68</td> <td align="center" nowrap="nowrap" width="48">7</td> <td align="center" nowrap="nowrap" width="60">57</td> <td align="center" nowrap="nowrap" width="48">10</td> <td align="center" nowrap="nowrap" width="72">0</td> </tr> </tbody></table> * Elevated means the % of visits for ILI or ARI is at or above the national or region-specific baseline
? National data is for current week; regional data is for the most recent 3 weeks.
? Includes all 50 states and the District of Columbia
Laboratory Surveillance
During week 52, WHO and NREVSS laboratories reported 3,358 specimens tested for influenza viruses, 108 (3.2%) of which were positive, including 20 influenza A (H1) viruses, seven influenza A (H3) viruses, 57 influenza A viruses that were not subtyped, and 24 influenza B viruses. The District of Columbia and 39 states from all nine surveillance regions have reported laboratory-confirmed influenza this season.
Since September 30, 2007, WHO and NREVSS laboratories have tested a total of 43,184 specimens for influenza viruses and 1,197 (2.8%) were positive. Among the 1,197 influenza viruses, 1,051 (87.8%) were influenza A viruses and 146 (12.2%) were influenza B viruses. Three hundred twenty-six (31.0%) of the 1,051 influenza A viruses have been subtyped: 253 (77.6%) were influenza A (H1) viruses and 73 (22.4%) were influenza A (H3) viruses.
<center>
View WHO-NREVSS Regional Bar Charts | View Chart Data | View Full Screen </center> Antigenic Characterization:
CDC has antigenically characterized 79 influenza viruses [32 influenza A (H1), 19 influenza A (H3), and 28 influenza B viruses] collected by U.S. laboratories since September 30, 2007.
Influenza A (H1) [32]
- All 32 viruses were characterized as A/Solomon Islands/3/2006, the influenza A (H1) component of the 2007-08 influenza vaccine for the Northern Hemisphere and the 2008 influenza A (H1) component for the Southern Hemisphere.
Influenza A (H3) [19]
- Four viruses were characterized as A/Wisconsin/67/2005-like, the influenza A (H3) component of the 2007-08 influenza vaccine for the Northern Hemisphere.
- Fourteen viruses were characterized as A/Brisbane/10/2007-like. A/Brisbane/10/2007 is a recent antigenic variant which evolved from A/Wisconsin/67/2005-like. A/Brisbane/10/2007-like virus is the recommended influenza A (H3) component for the 2008 Southern Hemisphere vaccine.
- One virus showed somewhat reduced titers with antisera produced against A/Wisconsin/67/2005 and A/Brisbane/10/2007.
Influenza B (B/Victoria/02/87 and B/Yamagata/16/88 lineages) [28]
It is too early in the influenza season to determine which influenza viruses will predominate or how well the vaccine and circulating strains will match. Pneumonia and Influenza (P&I) Mortality Surveillance- Victoria lineage [3]
- Two viruses were characterized as B/Ohio/01/2005-like. The recommended influenza B component for the 2007-08 influenza vaccine is a B/Malaysia/2506/2004-like virus, belonging to the B/Victoria lineage. B/Ohio/01/2005 is a recent B/Malaysia/2506/2004-like reference strain.
- One virus showed somewhat reduced titers with antisera produced against B/Ohio/01/2005 and B/Malaysia/2506/2004.
- Yamagata lineage [25]
- Twenty-five viruses were identified as belonging to the B/Yamagata lineage.
During week 52, 6.6% of all deaths reported through the 122-Cities Mortality Reporting System were reported as due to P&I. This percentage is below the epidemic threshold of 6.8% for week 52.
<center>
View Full Screen</center> Influenza-Associated Pediatric Mortality
No influenza pediatric deaths were reported during week 52. One influenza-associated pediatric death occurring during the 2007-08 season has been reported.
<center>
View Full Screen</center> Influenza-Associated Pediatric Hospitalizations
Laboratory-confirmed influenza-associated pediatric hospitalizations are monitored in two population-based surveillance networks: the New Vaccine Surveillance Network (NVSN) and the Emerging Infections Program (EIP).
No influenza-associated pediatric hospitalizations have been reported from the NVSN.
During September 30-December 22, 2007, the preliminary laboratory-confirmed influenza-associated hospitalization rate reported by the EIP for children 0?17 years old was 0.05 per 10,000. For children aged 0-4 years and 5-17 years, the rate was 0.12 per 10,000 and 0.01 per 10,000, respectively.
<center>
View Full Screen </center> Outpatient Illness Surveillance
Nationwide during week 52, 2.5% of outpatient visits reported through the U.S. Influenza Sentinel Provider Surveillance Network were due to influenza-like illness (ILI) and 3.5% of patient visits to Department of Veteran?s Affairs (VA) and Department of Defense (DoD) outpatient treatment facilities were for acute respiratory illness (ARI). These percentages are above the national baselines of 2.2% and 3.2%, respectively. On a regional level, the percentage of visits for ILI ranged from 0.9% to 4.4% and the percentage of visits for ARI ranged from 1.7% to 4.4%. The East North Central, East South Central, Mountain, New England, South Atlantic, and West South Central regions reported ILI equal to or above their regions specific baselines, and the East North Central, Pacific, and West South Central regions reported ARI equal to or above their region-specific baselines. The percentages of visits reported for ARI in the 18-49 years, 50-64 years, and >64 years age groups were above their respective age-specific baselines. The increase in the percentage of patient visits for ILI and ARI may be influenced by a reduction in routine healthcare visits during the holiday season, as has occurred in previous seasons.
<center>
View Sentinel Providers Regional Charts | View Chart Data |View Full Screen
View Full Screen </center> Geographic Spread of Influenza as Assessed by State and Territorial Epidemiologists
During week 52 the following influenza activity was reported:
- Regional activity was reported by five states (Alaska, Arizona, Colorado, New York, and Texas).
- Local activity was reported by nine states (California, Connecticut, Hawaii, Illinois, Maryland, Massachusetts, Michigan, Montana, and Virginia).
- Sporadic activity was reported by the District of Columbia, Puerto Rico, and 33 states (Alabama, Arkansas, Delaware, Georgia, Florida, Idaho, Indiana, Iowa, Kansas, Kentucky, Louisiana, Maine, Minnesota, Missouri, Nebraska, Nevada, New Hampshire, New Jersey, New Mexico, North Carolina, North Dakota, Ohio, Oklahoma, Oregon, Pennsylvania, Rhode Island, South Dakota, Tennessee, Utah, Washington, West Virginia, Wisconsin, and Wyoming).
- No activity was reported by three states (Mississippi, South Carolina, and Vermont).
<embed type="application/x-shockwave-flash" src="http://www.cdc.gov/flu/weekly/smallmap/SmallFluActivity_v2.swf?c=FluMap&n=1199492292062" id="Banner" name="Banner" quality="high" height="420" width="100%">
<script type="text/javascript"> var stamp = new Date() var movieurl = "/flu/weekly/smallmap/SmallFluActivity_v2.swf?c=FluMap&n=" + stamp.getTime(); var so = new SWFObject(movieurl, "Banner", "100%", "420", "7"); so.write("flashALTcontent"); so.addParam("scale", "noorder"); so.addParam("allowScriptAccess","sameDomain"); so.addParam("wmode", "transparent"); so.addParam("quality", "best"); so.addParam("salign", "r"); so.addParam("type", "application/x-shockwave-flash"); </script>
--------------------------------------------------------------------------------<script type="text/javascript"> var stamp = new Date() var movieurl = "/flu/weekly/smallmap/SmallFluActivity_v2.swf?c=FluMap&n=" + stamp.getTime(); var so = new SWFObject(movieurl, "Banner", "100%", "420", "7"); so.write("flashALTcontent"); so.addParam("scale", "noorder"); so.addParam("allowScriptAccess","sameDomain"); so.addParam("wmode", "transparent"); so.addParam("quality", "best"); so.addParam("salign", "r"); so.addParam("type", "application/x-shockwave-flash"); </script>
A description of surveillance methods is available at: http://www.cdc.gov/flu/weekly/fluactivity.htm
<script type="text/javascript"> <!-- function popupnr(mylink, windowname, refocus) { var mywin, href; if (typeof(mylink) == 'string') href=""mylink; else href=mylink.href; mywin = window.open('', windowname, 'width=450,height=550,scrollbars=yes'); // if opened the window if ( mywin.closed || (! mywin.document.URL) || (mywin.document.URL.indexOf("about") == 0) ) mywin.location=href; else if (refocus) mywin.focus(); return false; } //--> </script>
- <!--
- Page last reviewed-->
- Page last updated January 4, 2008
- Content Source: Coordinating Center for Infectious Diseases (CCID)
- National Center for Immunization and Respiratory Diseases (NCIRD)

Blue
Well-known member
Re: CDC Weekly Report: Influenza Summary Update
2007-2008 Influenza Season Week 1, ending January 5, 2008
(All data are preliminary and may change as more reports are received.)
Synopsis
During week 1 (December 30, 2007-January 5, 2008), influenza activity continued to increase in the United States.
Two hundred twenty-one (7.2%) specimens tested by U.S. World Health Organization (WHO) and National Respiratory and Enteric Virus Surveillance System (NREVSS) collaborating laboratories were positive for influenza.
The proportion of deaths attributed to pneumonia and influenza was below the epidemic threshold.
The proportion of outpatient visits for influenza-like illness (ILI) was below national baseline levels, and the proportion of outpatient visits for acute respiratory illness (ARI) was above national baseline levels. The East North Central, New England, and West South Central regions reported ILI equal to or above their region-specific baselines, and the East North Central, Mid-Atlantic, Pacific, and West South Central regions reported ARI equal to or above their region-specific baselines.
One state reported widespread influenza activity; 10 states reported regional influenza activity; 12 states and the District of Columbia reported local influenza activity; 26 states and Puerto Rico reported sporadic influenza activity; and one state reported no influenza activity.
http://www.cdc.gov/flu/weekly/
2007-2008 Influenza Season Week 1, ending January 5, 2008
(All data are preliminary and may change as more reports are received.)
Synopsis
During week 1 (December 30, 2007-January 5, 2008), influenza activity continued to increase in the United States.
Two hundred twenty-one (7.2%) specimens tested by U.S. World Health Organization (WHO) and National Respiratory and Enteric Virus Surveillance System (NREVSS) collaborating laboratories were positive for influenza.
The proportion of deaths attributed to pneumonia and influenza was below the epidemic threshold.
The proportion of outpatient visits for influenza-like illness (ILI) was below national baseline levels, and the proportion of outpatient visits for acute respiratory illness (ARI) was above national baseline levels. The East North Central, New England, and West South Central regions reported ILI equal to or above their region-specific baselines, and the East North Central, Mid-Atlantic, Pacific, and West South Central regions reported ARI equal to or above their region-specific baselines.
One state reported widespread influenza activity; 10 states reported regional influenza activity; 12 states and the District of Columbia reported local influenza activity; 26 states and Puerto Rico reported sporadic influenza activity; and one state reported no influenza activity.
http://www.cdc.gov/flu/weekly/

JohnW
Well-known member
Re: CDC Weekly Report: Influenza Summary Update
(Still trying to figure this stuff out
I presume that A/Brisbane is the same strain that caused such a severe flu season in Australia. If 14 out of 19 specimens in the US were A/Brisbane, does this imply the US is going to have a severe flu season this year as well? Given that the current tri-valent vaccine did not include A/Brisbane, does this imply that those who received flu shots would not have protection against A/Brisbane?Influenza A (H3) [19]
- Four viruses were characterized as A/Wisconsin/67/2005-like, the influenza A (H3) component of the 2007-08 influenza vaccine for the Northern Hemisphere.
- Fourteen viruses were characterized as A/Brisbane/10/2007-like. A/Brisbane/10/2007 is a recent antigenic variant which evolved from A/Wisconsin/67/2005-like. A/Brisbane/10/2007-like virus is the recommended influenza A (H3) component for the 2008 Southern Hemisphere vaccine.
- One virus showed somewhat reduced titers with antisera produced against A/Wisconsin/67/2005 and A/Brisbane/10/2007.
(Still trying to figure this stuff out

Treyfish
Moderator
Re: CDC Weekly Report: Influenza Summary Update
Synopsis
During week 9 (February 24 ? March 1, 2008), influenza activity continued to decrease in the United States.
</CAPTION><TBODY><TR vAlign=top><TH class=" ie7_class405" vAlign=bottom width=85 rowSpan=2>
* Elevated means the % of visits for ILI or ARI is at or above the national or region-specific baseline
? National data is for current week; regional data is for the most recent 3 weeks.
? Includes all 50 states and the District of Columbia
Laboratory Surveillance
During week 9, WHO and NREVSS laboratories reported 8,814 specimens tested for influenza viruses, 2,401 (27.2%) of which were positive, including 54 influenza A (H1) viruses, 327 influenza A (H3) viruses, 1,280 influenza A viruses that were not subtyped, and 740 influenza B viruses.
Since September 30, 2007, WHO and NREVSS laboratories have tested a total of 138,546 specimens for influenza viruses and 23,533 (17.0%) were positive. Among the 23,533 influenza viruses, 18,791 (79.8%) were influenza A viruses and 4,742 (20.2%) were influenza B viruses. Four thousand nine hundred sixty-seven (26.4%) of the 18,791 influenza A viruses have been subtyped: 1,550 (31.2%) were influenza A (H1) viruses and 3,417 (68.8%) were influenza A (H3) viruses.
Although influenza A (H1) viruses predominated through mid-January, an increasing proportion of subtyped influenza A viruses are influenza A (H3) viruses. Influenza A (H3) viruses have been reported more frequently than influenza A (H1) viruses since week 4 (January 20-26), and during week 6 (February 3-9), influenza A (H3) became the predominant virus for the season overall. This season influenza A (H3) viruses have been reported more frequently than A (H1) viruses nationally, as well as in five of the nine surveillance regions (East North Central, East South Central, South Atlantic, West North Central, and West South Central). Influenza A (H1) viruses have predominated circulation this season in the remaining four regions (Mid-Atlantic, Mountain, New England, and Pacific).
<CENTER>

http://www.cdc.gov/flu/weekly/weeklyarchives2007-2008/data/whoAllregt09.htmView WHO-NREVSS Regional Bar Charts | View Chart Data | View Full Screen </CENTER>Composition of the 2008-09 Influenza Vaccine:
WHO and FDA have recommended that the 2008-09 trivalent influenza vaccine for the Northern Hemisphere contain A/Brisbane/59/2007-like (H1N1), A/Brisbane/10/2007-like (H3N2), and B/Florida/4/2006-like viruses. All three components have been changed from the 2007-08 Northern Hemisphere vaccine formulation. A/Brisbane/10/2007-like (H3N2) and B/Florida/4/2006-like viruses are currently included in the 2008 Southern Hemisphere vaccines. This recommendation was based on surveillance data related to epidemiology and antigenic characteristics, serological responses to 2007-08 vaccines, and the availability of candidate strains and reagents.
Antigenic Characterization:
CDC has antigenically characterized 366 influenza viruses [191 influenza A (H1N1), 86 influenza A (H3N2), and 89 influenza B viruses] collected by U.S. laboratories since September 30, 2007.
Antiviral Resistance:
In the United States, two groups of antiviral drugs have been approved by FDA for use in treating or preventing influenza virus infections. These two groups of antiviral drugs are: neuraminidase inhibitors (oseltamivir and zanamivir) and adamantanes (amantadine and rimantidine). A description of these drugs can be found at: http://www.cdc.gov/flu/protect/antiviral/index.htm.
During week 9, 8.9% of all deaths reported through the 122 Cities Mortality Reporting System were reported as due to P&I. This percentage is above the epidemic threshold of 7.2% for week 9. Including week 9, P&I mortality has been above epidemic threshold for eight consecutive weeks.
<CENTER>

View Full Screen</CENTER>Influenza-Associated Pediatric Mortality
Nine influenza-associated pediatric deaths were reported to CDC during week 9 [GA (2), IA (3), MN, MS, NY, and OH]. One of these deaths occurred during the 2006-07 season, bringing the total number of cases occurring during that season to 75. Since September 30, 2007, CDC has received a total of 32 reports of influenza-associated pediatric deaths that occurred during the current season.
<CENTER>

View Full Screen</CENTER>Influenza-Associated Pediatric Hospitalizations
Laboratory-confirmed influenza-associated pediatric hospitalizations are monitored in two population-based surveillance networks: the New Vaccine Surveillance Network (NVSN) and the Emerging Infections Program (EIP). These two systems provide updates of surveillance data every two weeks. As a result of differing dates for initiating surveillance in the 2007-08 season, these updates occur on alternating weeks.
During November 4, 2007-February 23, 2008, the preliminary laboratory-confirmed influenza-associated hospitalization rate reported by the NVSN for children 0-4 years old was 3.48 per 10,000.
<CENTER>

View Full Screen </CENTER>
During September 30 ? February 16, 2008, the preliminary laboratory-confirmed influenza-associated hospitalization rate reported by the EIP for children 0?17 years old was 0.57 per 10,000. For children aged 0-4 years and 5-17 years, the rate was 1.54 per 10,000 and 0.18 per 10,000, respectively.
<CENTER>

View Full Screen </CENTER>Outpatient Illness Surveillance
Nationwide during week 9, 4.8% of outpatient visits reported through the U.S. Influenza Sentinel Provider Surveillance Network were due to influenza-like illness (ILI), which is above the national baseline of 2.2%. On a regional level, the percentage of visits for ILI decreased in seven of the nine regions compared to last week and ranged from 3.1% to 8.9%. All nine regions reported ILI above their region-specific baselines.
Starting in week 5, New York City began reporting ILI data collected electronically from emergency departments city-wide, adding approximately 60,000 additional patient visits per week to the U.S. Influenza Sentinel Provider Surveillance Network. Retrospective reports were submitted for all earlier weeks this season. While this change increases the total patient visits per week by approximately 15%, it is not expected to influence the national ILI outpatient visit percentage after population weighting, but may have a larger impact on the Mid-Atlantic regional ILI percentage.
During week 9, 3.2% of patient visits to Department of Veteran?s Affairs (VA) and Department of Defense (DoD) outpatient treatment facilities were for acute respiratory illness (ARI), which was at the national baseline of 3.2%. On a regional level, the percentage of visits for ARI ranged from 1.8% to 3.8%, and was at or above the region-specific baselines in two of the nine regions (Mid-Atlantic and West North Central). The percentage of visits reported for ARI was at or above age-specific baselines in the 5-17 years, 18-49 years, 50-64 years, and >64 years age groups.
<CENTER>

View Sentinel Providers Regional Charts | View Chart Data |View Full Screen

View Full Screen </CENTER>Geographic Spread of Influenza as Assessed by State and Territorial Epidemiologists
During week 9 the following influenza activity was reported:

<SCRIPT type=text/javascript> var stamp = new Date() var movieurl = "/flu/weekly/smallmap/SmallFluActivity_v2.swf?c=FluMap&n=" + stamp.getTime(); var so = new SWFObject(movieurl, "Banner", "100%", "420", "7"); so.write("flashALTcontent"); so.addParam("scale", "noorder"); so.addParam("allowScriptAccess","sameDomain"); so.addParam("wmode", "transparent"); so.addParam("quality", "best"); so.addParam("salign", "r"); so.addParam("type", "application/x-shockwave-flash"); </SCRIPT>--------------------------------------------------------------------------------
A description of surveillance methods is available at: http://www.cdc.gov/flu/weekly/fluactivity.htm
<SCRIPT type=text/javascript> <!-- function popupnr(mylink, windowname, refocus) { var mywin, href; if (typeof(mylink) == 'string') href=""mylink; else href=mylink.href; mywin = window.open('', windowname, 'width=450,height=550,scrollbars=yes'); // if opened the window if ( mywin.closed || (! mywin.document.URL) || (mywin.document.URL.indexOf("about") == 0) ) mywin.location=href; else if (refocus) mywin.focus(); return false; } //--> </SCRIPT>
<?xml:namespace prefix = ie7 /><ie7:! class="ie7_anon ie7_class360" style="CLEAR: both; DISPLAY: block; VISIBILITY: hidden; HEIGHT: 0px; ie7-height: 0; ie7_recalc7: 1; content: '.'" ie7_anon>.</ie7:!>
Synopsis
During week 9 (February 24 ? March 1, 2008), influenza activity continued to decrease in the United States.
- <LI class=" ie7_class15 ie7_class252">Two thousand four hundred one (27.2%) specimens tested by U.S. World Health Organization (WHO) and National Respiratory and Enteric Virus Surveillance System (NREVSS) collaborating laboratories were positive for influenza. <LI class=" ie7_class15 ie7_class252">The proportion of deaths attributed to pneumonia and influenza was above the epidemic threshold for the eighth consecutive week. <LI class=" ie7_class15 ie7_class252">The proportion of outpatient visits for influenza-like illness (ILI) and acute respiratory illness (ARI) was above national baseline levels. ILI decreased in seven of the nine regions compared to week 8, but remained above region-specific baselines in all nine regions. The Mid-Atlantic and West North Central regions reported ARI at or above their region specific baselines.
- Forty-seven states reported widespread influenza activity; three states reported regional influenza activity; and the District of Columbia reported local influenza activity.
</CAPTION><TBODY><TR vAlign=top><TH class=" ie7_class405" vAlign=bottom width=85 rowSpan=2>
Region
</TH><TH class=" ie7_class405" noWrap align=middle width=300 colSpan=4>Data for current week</STRONG></TH><TH class=" ie7_class405" noWrap align=middle width=276 colSpan=5>Data cumulative for the season</TH></TR><TR vAlign=top><TH class=" ie7_class405" align=middle width=72>Sentinel Provider ILI*</TH><TH class=" ie7_class405" align=middle width=72>DoD and VA ARI*</TH><TH class=" ie7_class405" align=middle width=60>% pos. for flu?</TH><TH class=" ie7_class405" align=middle width=96># jurisdictions reporting regional or widespread activity? </TH><TH class=" ie7_class405" noWrap align=middle width=48>A (H1)</TH><TH class=" ie7_class405" noWrap align=middle width=48>A (H3)</TH><TH class=" ie7_class405" align=middle width=60>A Unsub-typed</TH><TH class=" ie7_class405" noWrap align=middle width=48>B</TH><TH class=" ie7_class405" align=middle width=72>Pediatric Deaths</TH></TR><TR><TD class=" ie7_class404" align=left width=85>Nation</TD><TD class=" ie7_class404" noWrap align=middle width=72>Elevated</TD><TD class=" ie7_class404" noWrap align=middle width=72>Elevated</TD><TD class=" ie7_class404" noWrap align=middle width=60>27.2 % </TD><TD class=" ie7_class404" noWrap align=middle width=96>50 of 51 </TD><TD class=" ie7_class404" noWrap align=middle width=48>1550</TD><TD class=" ie7_class404" noWrap align=middle width=48>3417</TD><TD class=" ie7_class404" noWrap align=middle width=60>13824</TD><TD class=" ie7_class404" noWrap align=middle width=48>4742</TD><TD class=" ie7_class404" noWrap align=middle width=72>32</TD></TR><TR><TD class=" ie7_class404" align=left width=85>New England</TD><TD class=" ie7_class404" noWrap align=middle width=72>Elevated</TD><TD class=" ie7_class404" noWrap align=middle width=72>Normal</TD><TD class=" ie7_class404" noWrap align=middle width=60>25.4 % </TD><TD class=" ie7_class404" noWrap align=middle width=96>6 of 6</TD><TD class=" ie7_class404" noWrap align=middle width=48>53</TD><TD class=" ie7_class404" noWrap align=middle width=48>33</TD><TD class=" ie7_class404" noWrap align=middle width=60>590</TD><TD class=" ie7_class404" noWrap align=middle width=48>479</TD><TD class=" ie7_class404" noWrap align=middle width=72>0</TD></TR><TR><TD class=" ie7_class404" align=left width=85>Mid-Atlantic</TD><TD class=" ie7_class404" noWrap align=middle width=72>Elevated</TD><TD class=" ie7_class404" noWrap align=middle width=72>Elevated</TD><TD class=" ie7_class404" noWrap align=middle width=60>24.8 % </TD><TD class=" ie7_class404" noWrap align=middle width=96>3 of 3</TD><TD class=" ie7_class404" noWrap align=middle width=48>71</TD><TD class=" ie7_class404" noWrap align=middle width=48>50</TD><TD class=" ie7_class404" noWrap align=middle width=60>700</TD><TD class=" ie7_class404" noWrap align=middle width=48>762</TD><TD class=" ie7_class404" noWrap align=middle width=72>4</TD></TR><TR><TD class=" ie7_class404" align=left width=85>East North Central</TD><TD class=" ie7_class404" noWrap align=middle width=72>Elevated</TD><TD class=" ie7_class404" noWrap align=middle width=72>Normal</TD><TD class=" ie7_class404" noWrap align=middle width=60>42.8 % </TD><TD class=" ie7_class404" noWrap align=middle width=96>5 of 5</TD><TD class=" ie7_class404" noWrap align=middle width=48>128</TD><TD class=" ie7_class404" noWrap align=middle width=48>698</TD><TD class=" ie7_class404" noWrap align=middle width=60>482</TD><TD class=" ie7_class404" noWrap align=middle width=48>269</TD><TD class=" ie7_class404" noWrap align=middle width=72>4</TD></TR><TR><TD class=" ie7_class404" align=left width=85>West North Central</TD><TD class=" ie7_class404" noWrap align=middle width=72>Elevated</TD><TD class=" ie7_class404" noWrap align=middle width=72>Elevated</TD><TD class=" ie7_class404" noWrap align=middle width=60>31.7 % </TD><TD class=" ie7_class404" noWrap align=middle width=96>7 of 7</TD><TD class=" ie7_class404" noWrap align=middle width=48>71</TD><TD class=" ie7_class404" noWrap align=middle width=48>102</TD><TD class=" ie7_class404" noWrap align=middle width=60>1683</TD><TD class=" ie7_class404" noWrap align=middle width=48>480</TD><TD class=" ie7_class404" noWrap align=middle width=72>4</TD></TR><TR><TD class=" ie7_class404" align=left width=85>South Atlantic</TD><TD class=" ie7_class404" noWrap align=middle width=72>Elevated</TD><TD class=" ie7_class404" noWrap align=middle width=72>Normal</TD><TD class=" ie7_class404" noWrap align=middle width=60>33.5 % </TD><TD class=" ie7_class404" noWrap align=middle width=96>8 of 9</TD><TD class=" ie7_class404" noWrap align=middle width=48>278</TD><TD class=" ie7_class404" noWrap align=middle width=48>1307</TD><TD class=" ie7_class404" noWrap align=middle width=60>3557</TD><TD class=" ie7_class404" noWrap align=middle width=48>875</TD><TD class=" ie7_class404" noWrap align=middle width=72>3</TD></TR><TR><TD class=" ie7_class404" align=left width=85>East South Central</TD><TD class=" ie7_class404" noWrap align=middle width=72>Elevated</TD><TD class=" ie7_class404" noWrap align=middle width=72>Normal</TD><TD class=" ie7_class404" noWrap align=middle width=60>45.1 % </TD><TD class=" ie7_class404" noWrap align=middle width=96>4 of 4</TD><TD class=" ie7_class404" noWrap align=middle width=48>29</TD><TD class=" ie7_class404" noWrap align=middle width=48>493</TD><TD class=" ie7_class404" noWrap align=middle width=60>64</TD><TD class=" ie7_class404" noWrap align=middle width=48>22</TD><TD class=" ie7_class404" noWrap align=middle width=72>5</TD></TR><TR><TD class=" ie7_class404" align=left width=85>West South Central</TD><TD class=" ie7_class404" noWrap align=middle width=72>Elevated</TD><TD class=" ie7_class404" noWrap align=middle width=72>Normal</TD><TD class=" ie7_class404" noWrap align=middle width=60>30.8 % </TD><TD class=" ie7_class404" noWrap align=middle width=96>4 of 4</TD><TD class=" ie7_class404" noWrap align=middle width=48>87</TD><TD class=" ie7_class404" noWrap align=middle width=48>337</TD><TD class=" ie7_class404" noWrap align=middle width=60>5428</TD><TD class=" ie7_class404" noWrap align=middle width=48>924</TD><TD class=" ie7_class404" noWrap align=middle width=72>6</TD></TR><TR><TD class=" ie7_class404" align=left width=85>Mountain</TD><TD class=" ie7_class404" noWrap align=middle width=72>Elevated</TD><TD class=" ie7_class404" noWrap align=middle width=72>Normal</TD><TD class=" ie7_class404" noWrap align=middle width=60>24.5 % </TD><TD class=" ie7_class404" noWrap align=middle width=96>8 of 8</TD><TD class=" ie7_class404" noWrap align=middle width=48>387</TD><TD class=" ie7_class404" noWrap align=middle width=48>270</TD><TD class=" ie7_class404" noWrap align=middle width=60>719</TD><TD class=" ie7_class404" noWrap align=middle width=48>560</TD><TD class=" ie7_class404" noWrap align=middle width=72>2</TD></TR><TR><TD class=" ie7_class404" align=left width=85>Pacific</TD><TD class=" ie7_class404" noWrap align=middle width=72>Elevated</TD><TD class=" ie7_class404" noWrap align=middle width=72>Normal</TD><TD class=" ie7_class404" noWrap align=middle width=60>17.0 % </TD><TD class=" ie7_class404" noWrap align=middle width=96>5 of 5</TD><TD class=" ie7_class404" noWrap align=middle width=48>446</TD><TD class=" ie7_class404" noWrap align=middle width=48>127</TD><TD class=" ie7_class404" noWrap align=middle width=60>601</TD><TD class=" ie7_class404" noWrap align=middle width=48>371</TD><TD class=" ie7_class404" noWrap align=middle width=72>4</TD></TR></TBODY></TABLE>* Elevated means the % of visits for ILI or ARI is at or above the national or region-specific baseline
? National data is for current week; regional data is for the most recent 3 weeks.
? Includes all 50 states and the District of Columbia
Laboratory Surveillance
During week 9, WHO and NREVSS laboratories reported 8,814 specimens tested for influenza viruses, 2,401 (27.2%) of which were positive, including 54 influenza A (H1) viruses, 327 influenza A (H3) viruses, 1,280 influenza A viruses that were not subtyped, and 740 influenza B viruses.
Since September 30, 2007, WHO and NREVSS laboratories have tested a total of 138,546 specimens for influenza viruses and 23,533 (17.0%) were positive. Among the 23,533 influenza viruses, 18,791 (79.8%) were influenza A viruses and 4,742 (20.2%) were influenza B viruses. Four thousand nine hundred sixty-seven (26.4%) of the 18,791 influenza A viruses have been subtyped: 1,550 (31.2%) were influenza A (H1) viruses and 3,417 (68.8%) were influenza A (H3) viruses.
Although influenza A (H1) viruses predominated through mid-January, an increasing proportion of subtyped influenza A viruses are influenza A (H3) viruses. Influenza A (H3) viruses have been reported more frequently than influenza A (H1) viruses since week 4 (January 20-26), and during week 6 (February 3-9), influenza A (H3) became the predominant virus for the season overall. This season influenza A (H3) viruses have been reported more frequently than A (H1) viruses nationally, as well as in five of the nine surveillance regions (East North Central, East South Central, South Atlantic, West North Central, and West South Central). Influenza A (H1) viruses have predominated circulation this season in the remaining four regions (Mid-Atlantic, Mountain, New England, and Pacific).
<CENTER>
http://www.cdc.gov/flu/weekly/weeklyarchives2007-2008/data/whoAllregt09.htmView WHO-NREVSS Regional Bar Charts | View Chart Data | View Full Screen </CENTER>Composition of the 2008-09 Influenza Vaccine:
WHO and FDA have recommended that the 2008-09 trivalent influenza vaccine for the Northern Hemisphere contain A/Brisbane/59/2007-like (H1N1), A/Brisbane/10/2007-like (H3N2), and B/Florida/4/2006-like viruses. All three components have been changed from the 2007-08 Northern Hemisphere vaccine formulation. A/Brisbane/10/2007-like (H3N2) and B/Florida/4/2006-like viruses are currently included in the 2008 Southern Hemisphere vaccines. This recommendation was based on surveillance data related to epidemiology and antigenic characteristics, serological responses to 2007-08 vaccines, and the availability of candidate strains and reagents.
Antigenic Characterization:
CDC has antigenically characterized 366 influenza viruses [191 influenza A (H1N1), 86 influenza A (H3N2), and 89 influenza B viruses] collected by U.S. laboratories since September 30, 2007.
Influenza A (H1) [191]
- <LI class=" ie7_class15 ie7_class252">One hundred forty-seven (77%) of the 191 viruses were characterized as A/Solomon Islands/3/2006-like, the influenza A (H1N1) component of the 2007-08 influenza vaccine for the Northern Hemisphere and the 2008 influenza A (H1N1) component for the Southern Hemisphere. <LI class=" ie7_class15 ie7_class252">Nineteen (10%) of the 191 viruses showed somewhat reduced titers with antisera produced against A/Solomon Islands/3/2006.
- Twenty-five (13%) of the 191 viruses were characterized as A/Brisbane/59/2007-like. A/Brisbane/59/2007 is a recent genetic/antigenic variant which evolved from A/Solomon Islands/03/2006. An A/Brisbane/59/2007-like virus is the WHO recommended strain for the 2008-09 Northern Hemisphere vaccine formulation.
Influenza A (H3) [86]
- <LI class=" ie7_class15 ie7_class252">Twelve (14%) of the 86 viruses were characterized as A/Wisconsin/67/2005-like, the influenza A (H3N2) component of the 2007-08 influenza vaccine for the Northern Hemisphere. <LI class=" ie7_class15 ie7_class252">Sixty-seven (78%) of the 86 viruses were characterized as A/Brisbane/10/2007-like. A/Brisbane/10/2007-like viruses are a recent antigenic variant which evolved from, but are antigenically distinct from, A/Wisconsin/67/2005-like viruses. A/Brisbane/10/2007-like virus is the recommended influenza A (H3N2) component for the 2008 Southern Hemisphere and 2008-09 Northern Hemisphere vaccines.
- Seven (8%) of the 86 viruses showed somewhat reduced titers with antisera produced against A/Wisconsin/67/2005 and A/Brisbane/10/2007.
Influenza B (B/Victoria/02/87 and B/Yamagata/16/88 lineages) [89]
These data indicate similarities and differences between a sample of circulating strains and this year's vaccine strains as determined by laboratory studies. Clinical vaccine effectiveness cannot be accurately predicted using these data, and in previous years, influenza vaccination has been shown to provide measurable protection against influenza illness and influenza-related complications, even when vaccine strains are antigenically distinct from circulating strains. - Victoria lineage [6]
- Six (7%) of the 89 influenza B viruses characterized belong to the B/Victoria lineage of viruses.
- o Four (67%) of these 4 viruses were characterized as B/Ohio/01/2005-like. The recommended influenza B component for the 2007-08 influenza vaccine is a B/Malaysia/2506/2004-like virus, belonging to the B/Victoria lineage. B/Ohio/01/2005 is a recent B/Malaysia/2506/2004-like reference strain.
o Two (33%) of these 4 viruses showed somewhat reduced titers with antisera produced against B/Ohio/01/2005 and B/Malaysia/2506/2004.
- o Four (67%) of these 4 viruses were characterized as B/Ohio/01/2005-like. The recommended influenza B component for the 2007-08 influenza vaccine is a B/Malaysia/2506/2004-like virus, belonging to the B/Victoria lineage. B/Ohio/01/2005 is a recent B/Malaysia/2506/2004-like reference strain.
- Eighty-three (93%) of the 89 influenza B viruses characterized belong to the B/Yamagata lineage of viruses.
- o Eighty-two (99%) of these 83 viruses were identified as B/Florida/04/2006-like, the recommended influenza B component for the 2008-09 Northern Hemisphere vaccine formulation.
o One (1%) of these 83 viruses showed a somewhat reduced titer with antiserum produced against B/Florida/04/2006.
- o Eighty-two (99%) of these 83 viruses were identified as B/Florida/04/2006-like, the recommended influenza B component for the 2008-09 Northern Hemisphere vaccine formulation.
Antiviral Resistance:
In the United States, two groups of antiviral drugs have been approved by FDA for use in treating or preventing influenza virus infections. These two groups of antiviral drugs are: neuraminidase inhibitors (oseltamivir and zanamivir) and adamantanes (amantadine and rimantidine). A description of these drugs can be found at: http://www.cdc.gov/flu/protect/antiviral/index.htm.
- Neuraminidase Inhibitor Antiviral Drugs: Of the 743 influenza A and B viruses from the United States tested for antiviral resistance so far this season, 45 (6.1%) have been found to be resistant to oseltamivir. Currently all of the resistant viruses are H1N1 viruses, with 45 (8.7%) of 519 H1N1 viruses tested exhibiting a genetic mutation that confers oseltamivir resistance. All tested viruses retain their sensitivity to zanamivir. Additional information on antiviral resistance can be found at:http://www.cdc.gov/mmwr/preview/mmwrhtml/rr5606a1.htm
Adamantane Antiviral Drugs: Resistance to the adamantanes continues to be high. Among 511 influenza A viruses tested, 111 (21.7%) are resistant to adamantanes, including 98.9% of H3N2 viruses and 4.3% of H1N1 viruses. The adamantanes are not effective against influenza B viruses.
Based on the level of oseltamivir resistance observed in only one influenza subtype, H1N1, and persisting high levels of resistance to the adamantanes in both H3N2 and H1N1 viruses, CDC continues to recommend the use of oseltamivir and zanamivir for the treatment or prevention of influenza. Use of amantadine or rimantadine is not recommended. Guidance on influenza antiviral use can be found at: http://www.cdc.gov/mmwr/preview/mmwrhtml/rr5606a1.htm
During week 9, 8.9% of all deaths reported through the 122 Cities Mortality Reporting System were reported as due to P&I. This percentage is above the epidemic threshold of 7.2% for week 9. Including week 9, P&I mortality has been above epidemic threshold for eight consecutive weeks.
<CENTER>
View Full Screen</CENTER>Influenza-Associated Pediatric Mortality
Nine influenza-associated pediatric deaths were reported to CDC during week 9 [GA (2), IA (3), MN, MS, NY, and OH]. One of these deaths occurred during the 2006-07 season, bringing the total number of cases occurring during that season to 75. Since September 30, 2007, CDC has received a total of 32 reports of influenza-associated pediatric deaths that occurred during the current season.
<CENTER>
View Full Screen</CENTER>Influenza-Associated Pediatric Hospitalizations
Laboratory-confirmed influenza-associated pediatric hospitalizations are monitored in two population-based surveillance networks: the New Vaccine Surveillance Network (NVSN) and the Emerging Infections Program (EIP). These two systems provide updates of surveillance data every two weeks. As a result of differing dates for initiating surveillance in the 2007-08 season, these updates occur on alternating weeks.
During November 4, 2007-February 23, 2008, the preliminary laboratory-confirmed influenza-associated hospitalization rate reported by the NVSN for children 0-4 years old was 3.48 per 10,000.
<CENTER>
View Full Screen </CENTER>
During September 30 ? February 16, 2008, the preliminary laboratory-confirmed influenza-associated hospitalization rate reported by the EIP for children 0?17 years old was 0.57 per 10,000. For children aged 0-4 years and 5-17 years, the rate was 1.54 per 10,000 and 0.18 per 10,000, respectively.
<CENTER>
View Full Screen </CENTER>Outpatient Illness Surveillance
Nationwide during week 9, 4.8% of outpatient visits reported through the U.S. Influenza Sentinel Provider Surveillance Network were due to influenza-like illness (ILI), which is above the national baseline of 2.2%. On a regional level, the percentage of visits for ILI decreased in seven of the nine regions compared to last week and ranged from 3.1% to 8.9%. All nine regions reported ILI above their region-specific baselines.
Starting in week 5, New York City began reporting ILI data collected electronically from emergency departments city-wide, adding approximately 60,000 additional patient visits per week to the U.S. Influenza Sentinel Provider Surveillance Network. Retrospective reports were submitted for all earlier weeks this season. While this change increases the total patient visits per week by approximately 15%, it is not expected to influence the national ILI outpatient visit percentage after population weighting, but may have a larger impact on the Mid-Atlantic regional ILI percentage.
During week 9, 3.2% of patient visits to Department of Veteran?s Affairs (VA) and Department of Defense (DoD) outpatient treatment facilities were for acute respiratory illness (ARI), which was at the national baseline of 3.2%. On a regional level, the percentage of visits for ARI ranged from 1.8% to 3.8%, and was at or above the region-specific baselines in two of the nine regions (Mid-Atlantic and West North Central). The percentage of visits reported for ARI was at or above age-specific baselines in the 5-17 years, 18-49 years, 50-64 years, and >64 years age groups.
<CENTER>
View Sentinel Providers Regional Charts | View Chart Data |View Full Screen
View Full Screen </CENTER>Geographic Spread of Influenza as Assessed by State and Territorial Epidemiologists
During week 9 the following influenza activity was reported:
- <LI class=" ie7_class15 ie7_class252">Widespread activity was reported by 47 states (Alabama, Alaska, Arizona, Arkansas, California, Colorado, Connecticut, Delaware, Florida, Georgia, Hawaii, Idaho, Illinois, Indiana, Iowa, Kansas, Kentucky, Louisiana, Maine, Maryland, Michigan, Minnesota, Missouri, Montana, Nebraska, Nevada, New Hampshire, New Jersey, New York, North Carolina, North Dakota, Ohio, Oklahoma, Oregon, Pennsylvania, Rhode Island, South Carolina, South Dakota, Tennessee, Texas, Utah, Vermont, Virginia, Washington, Wisconsin, West Virginia, and Wyoming). <LI class=" ie7_class15 ie7_class252">Regional activity was reported by three states (Massachusetts, Mississippi, and New Mexico).
- The District of Columbia reported local influenza activity.
<SCRIPT type=text/javascript> var stamp = new Date() var movieurl = "/flu/weekly/smallmap/SmallFluActivity_v2.swf?c=FluMap&n=" + stamp.getTime(); var so = new SWFObject(movieurl, "Banner", "100%", "420", "7"); so.write("flashALTcontent"); so.addParam("scale", "noorder"); so.addParam("allowScriptAccess","sameDomain"); so.addParam("wmode", "transparent"); so.addParam("quality", "best"); so.addParam("salign", "r"); so.addParam("type", "application/x-shockwave-flash"); </SCRIPT>
A description of surveillance methods is available at: http://www.cdc.gov/flu/weekly/fluactivity.htm
<SCRIPT type=text/javascript> <!-- function popupnr(mylink, windowname, refocus) { var mywin, href; if (typeof(mylink) == 'string') href=""mylink; else href=mylink.href; mywin = window.open('', windowname, 'width=450,height=550,scrollbars=yes'); // if opened the window if ( mywin.closed || (! mywin.document.URL) || (mywin.document.URL.indexOf("about") == 0) ) mywin.location=href; else if (refocus) mywin.focus(); return false; } //--> </SCRIPT>
<?xml:namespace prefix = ie7 /><ie7:! class="ie7_anon ie7_class360" style="CLEAR: both; DISPLAY: block; VISIBILITY: hidden; HEIGHT: 0px; ie7-height: 0; ie7_recalc7: 1; content: '.'" ie7_anon>.</ie7:!>
- <!--
- Page last reviewed--><LI class=" ie7_class15 ie7_class84 ie7_class85 ie7_class252 ie7_class281 ie7_class282">Page last updated March 7, 2008. <LI class=" ie7_class15 ie7_class84 ie7_class252 ie7_class281 ie7_class282">Content Source: Coordinating Center for Infectious Diseases (CCID)
- National Center for Immunization and Respiratory Diseases (NCIRD)
- <LI class="email ie7_class15 ie7_class184 ie7_class185 ie7_class252">Email page <LI class="print ie7_class15 ie7_class185 ie7_class252">Print page <LI class="subscribe ie7_class15 ie7_class185 ie7_class252">Get Email Updates <!--
- Podcasts-->
- RSS :tiphat: http://www.cdc.gov/flu/weekly/<!--<li class="digg">Digg--><!--<li class="delicious">Del.icio.us-->