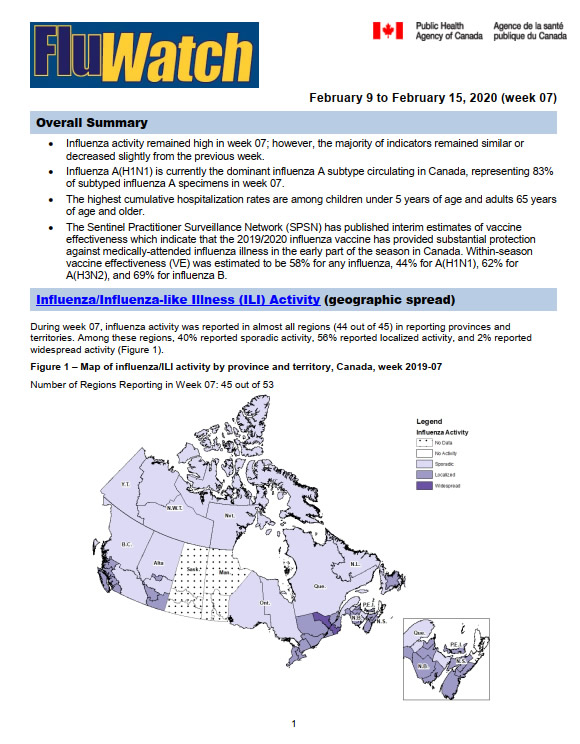
• FluTrackers.com Inc. does not provide medical advice. Information on this web site is collected from various internet resources, and the FluTrackers board of directors makes no warranty to the safety, efficacy, correctness or completeness of the information posted on this site by any author or poster. The information collated here is for instructional and/or discussion purposes only and is NOT intended to diagnose or treat any disease, illness, or other medical condition. Every individual reader or poster should seek advice from their personal physician/healthcare practitioner before considering or using any interventions that are discussed on this website. By continuing to access this website you agree to consult your personal physican before using any interventions posted on this website, and you agree to hold harmless FluTrackers.com Inc., the board of directors, the members, and all authors and posters for any effects from use of any medication, supplement, vitamin or other substance, device, intervention, etc. mentioned in posts on this website, or other internet venues referenced in posts on this website.
  • We are not asking for any donations. Do not donate to any entity who says they are raising funds for us.

Canada FluWatch Weekly Reports 2019-2020 Season Week 12

Pathfinder

Editor, Senior Moderator
[h=1]FluWatch report: November 24 to 30, 2019 (week 48)[/h]
pub-eng.jpg


Download the alternative format
(PDF format, 683 KB, 11 pages)

Organization: Public Health Agency of Canada

Date published: 2019-12-06[h=3]Related Topics[/h]
[h=2]Overall Summary[/h]
  • The flu season started in week 47 at the national level, and activity continues to increase as expected for this time of year.
  • Influenza A(H3N2) continues to be the most common influenza virus circulating in Canada for the season to date; however, approximately 40% of influenza A detections were A(H1N1) in week 48.
  • Although the majority of laboratory detections have been influenza A to date this season, the proportion of detections of influenza B (30%) is higher than average for this time of year.
[h=2]On this page[/h]
[h=2]Influenza/Influenza-like Illness Activity (geographic spread)[/h]
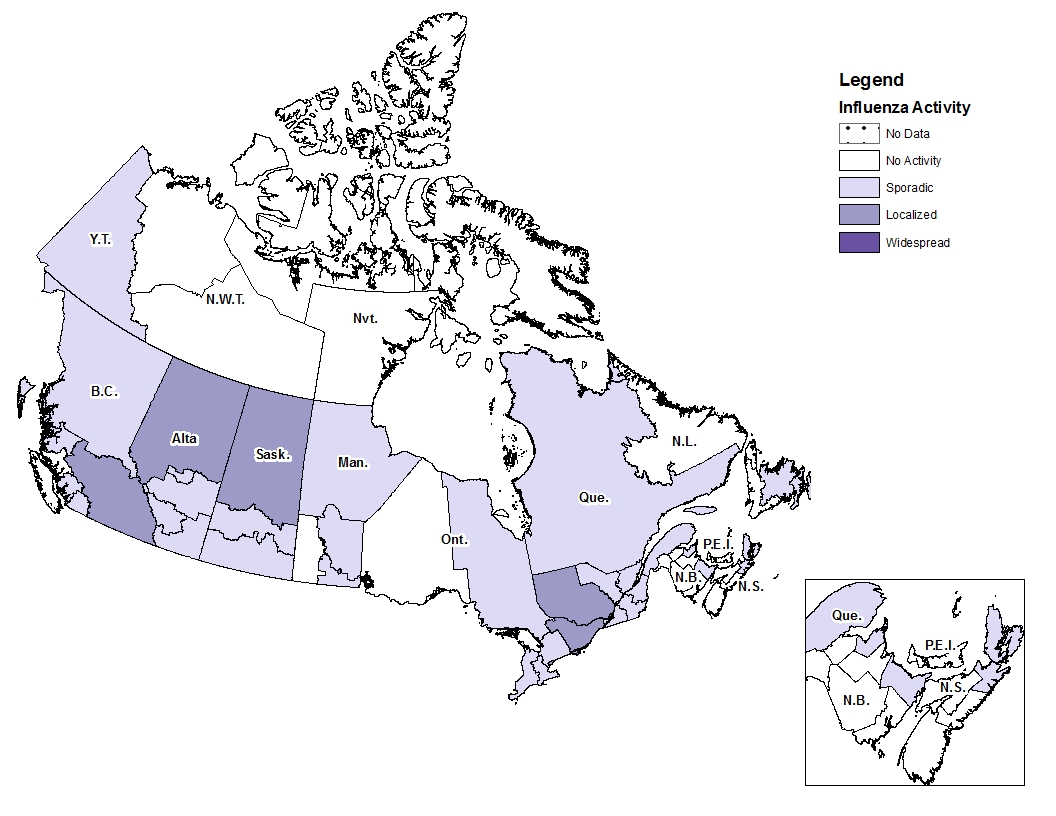
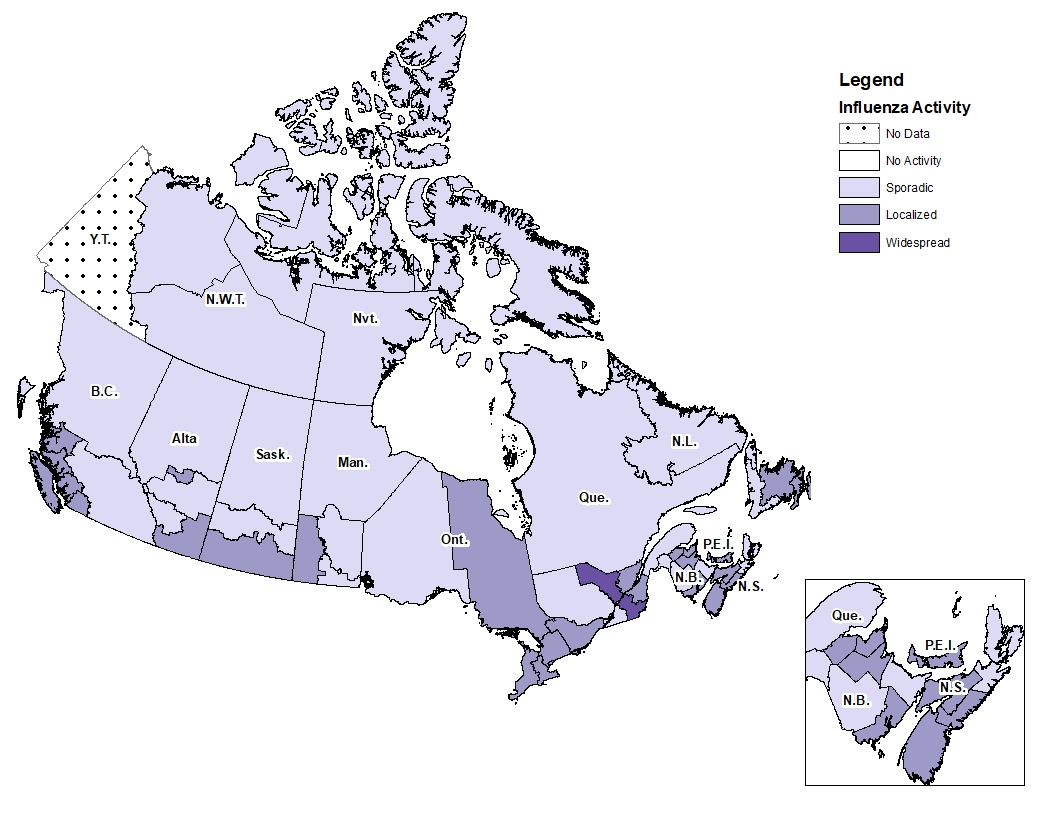
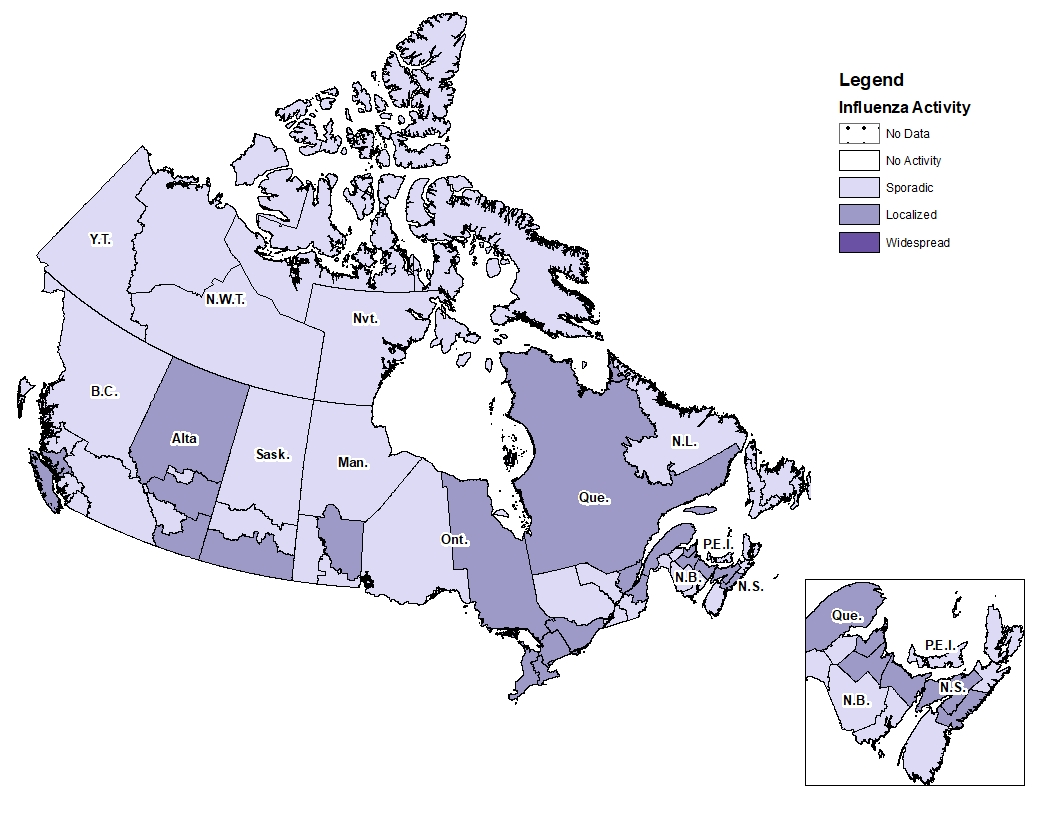
During week 48, the number of regions reporting influenza activity increased compared to the previous week (Figure 1).
  • Activity was reported across 9 provinceTs and territories.
  • Of reporting regions, 51% reported a sporadic level of activity, and 11% reported localized activity and 38% reported no activity.
Figure 1 – Map of influenza/ILI activity by province and territory, Canada, week 2019-48

Number of Regions Reporting in Week 48: 53 out of 53
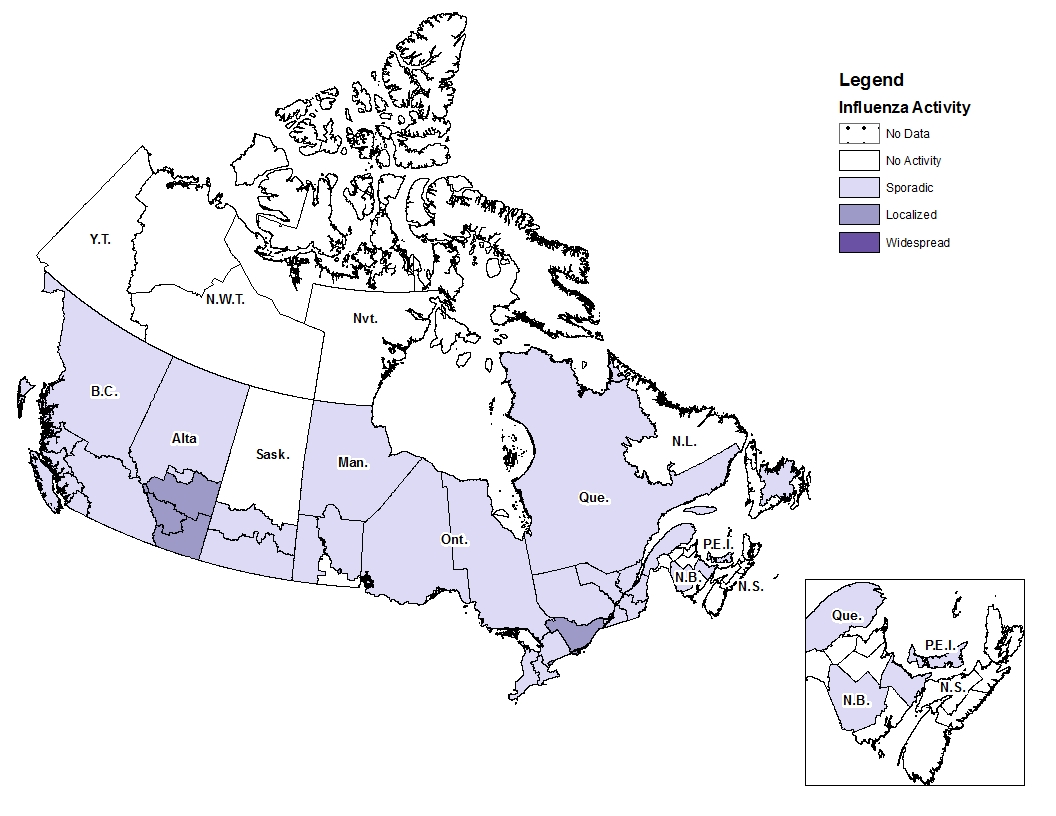
fig1-eng.jpg
Figure 1 - Text equivalent[h=2]Laboratory-Confirmed Influenza Detections[/h]
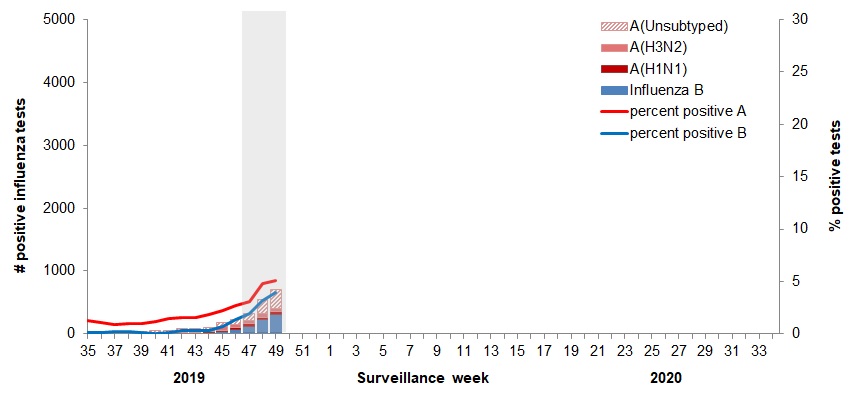
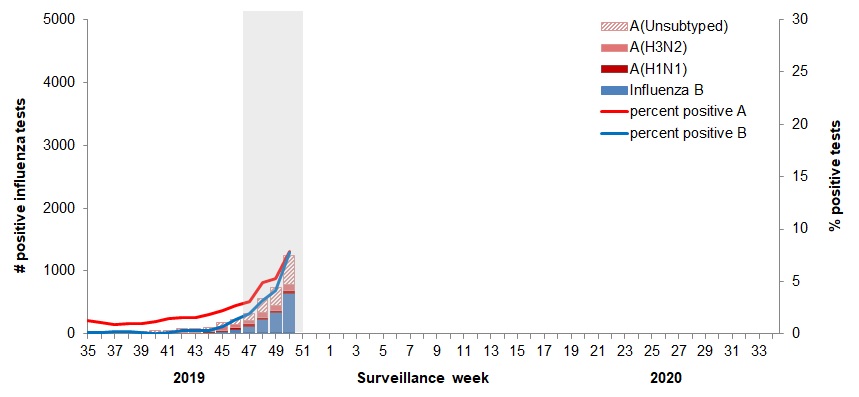
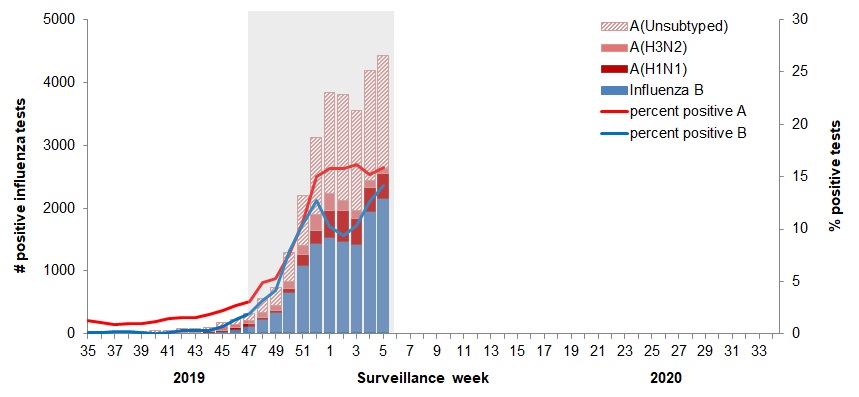
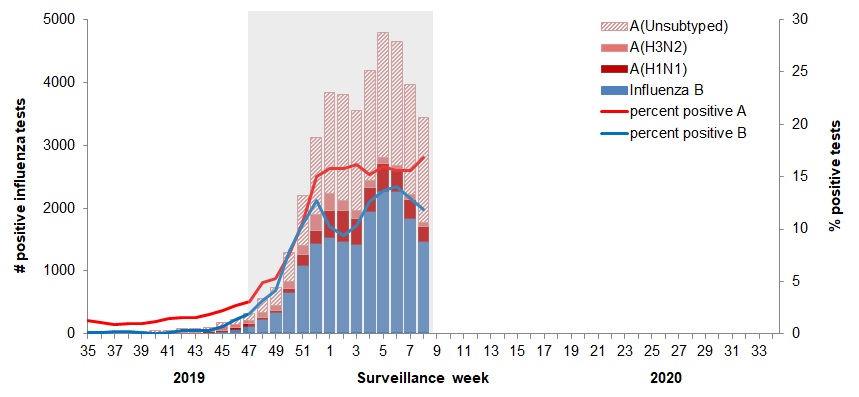
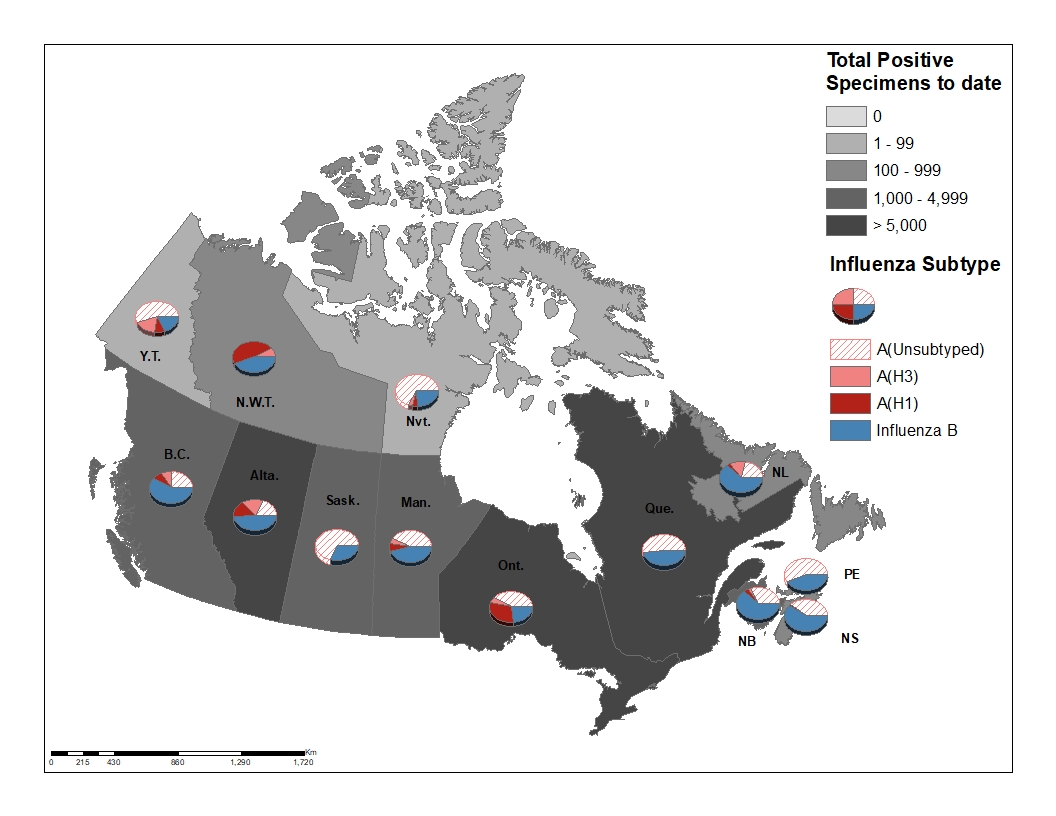
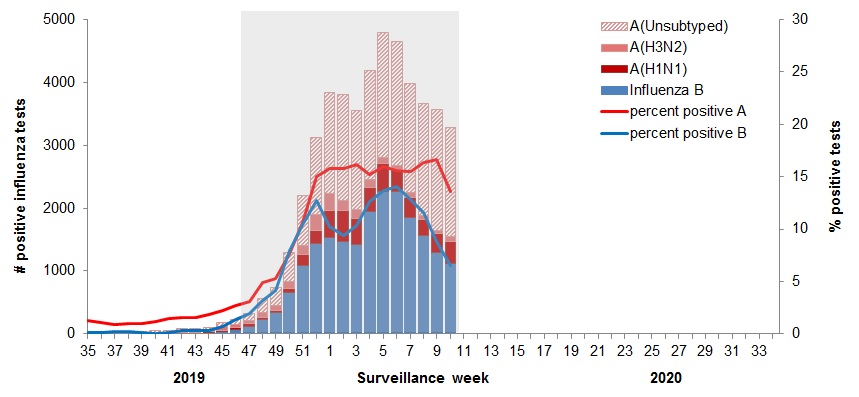
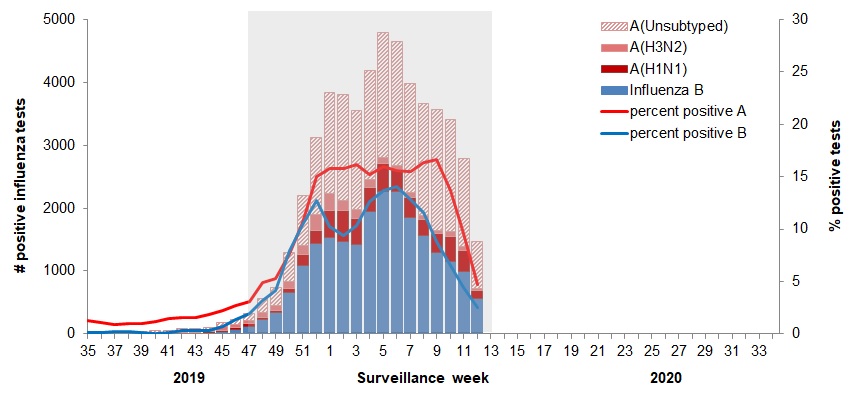
In week 48, the number of detections of influenza continued to increase. The following results were reported from sentinel laboratories across Canada (Figures 2 and 3):
  • The percentage of tests positive for influenza was above the seasonal threshold of 5%, at 8.0%. This is similar to the average (8.8%) for this time of year when compared to the past five seasons.
  • A total of 515 laboratory detections of influenza were reported, of which 60% (307) were influenza A.
  • Both the proportion of detections of influenza B in week 48 (40%) and the percentage of tests positive for influenza B (3.2%) are higher than the average for this time of year. The current level of influenza B activity is not normally seen until January or February.
  • Among subtyped influenza A detections, a mix of A(H1N1) and A(H3N2) were detected; 60% (58 out of 98) were influenza A(H3N2).
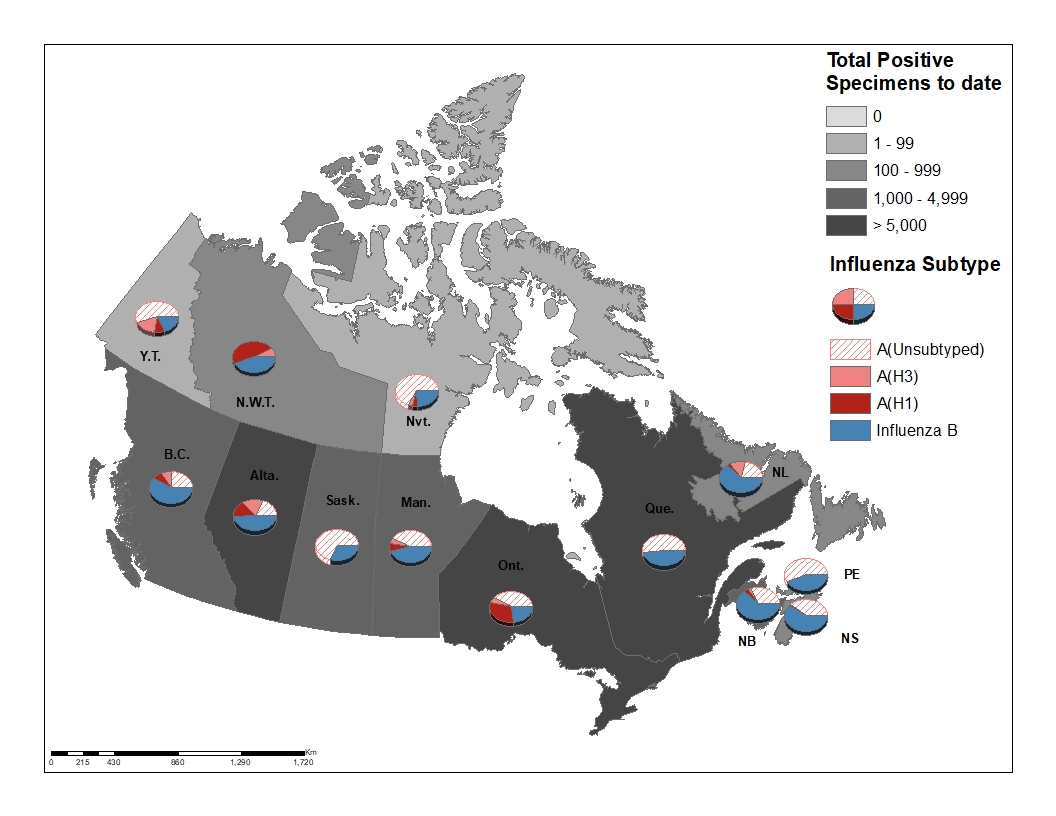
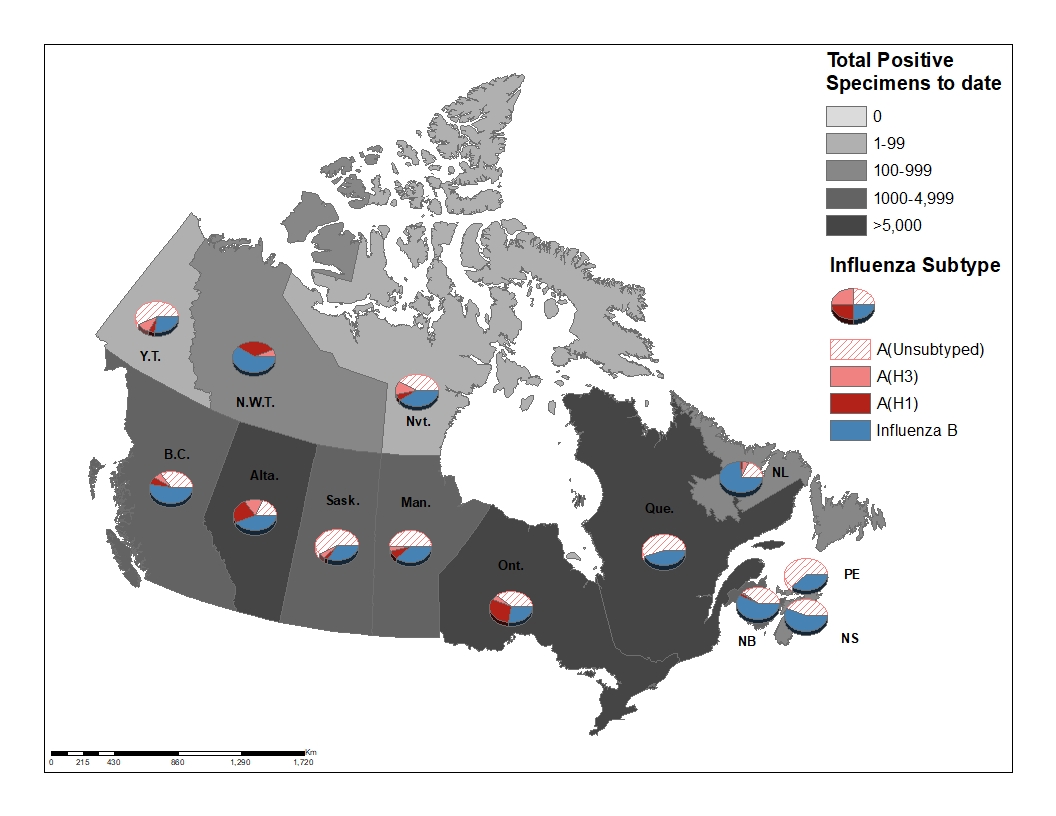
To date this season (weeks 35 to 48), 1,785 laboratory detections of influenza were reported:
  • 71% (1,266) were influenza A. The cumulative proportion of detections of influenza B to date (29%) is higher than average (10.7%). The proportion of influenza B detections is following a similar trend to the 2017-18 season when influenza A and B circulated in almost equal proportions.
  • Among subtyped influenza A detections (515), 71% were influenza A(H3N2).
Detailed information on age and type/subtype has been received for 1,457 laboratory-confirmed influenza cases (Table 1).

To date this season (weeks 35 to 48):
  • Among cases of influenza A(H3N2) (324), the largest proportion were in adults 65 years of age and older (43%).
  • Cases of influenza B (439) were primarily in younger age groups; 57% of cases were under 20 years of age and 33% between 20 and 44 years of age.
  • Among cases of influenza A(H1N1) (126), the largest proportion were in adults between 45 and 64 years of age (34%).
For more detailed weekly and cumulative influenza data, see the text descriptions for Figures 2 and 3 or the Respiratory Virus Detections in Canada Report. Figure 2 - Number of positive influenza tests and percentage of tests positive, by type, subtype and report week, Canada, weeks 2019-35 to 2019-48

Number of Laboratories Reporting in Week 48: 34 out of 34
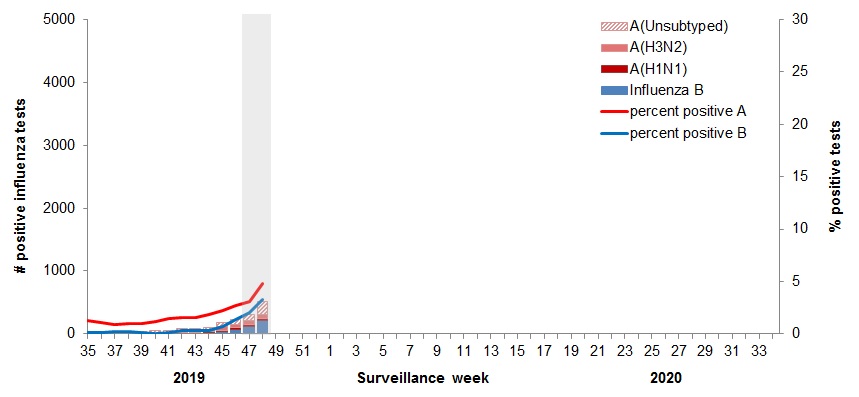
fig2-eng.jpg
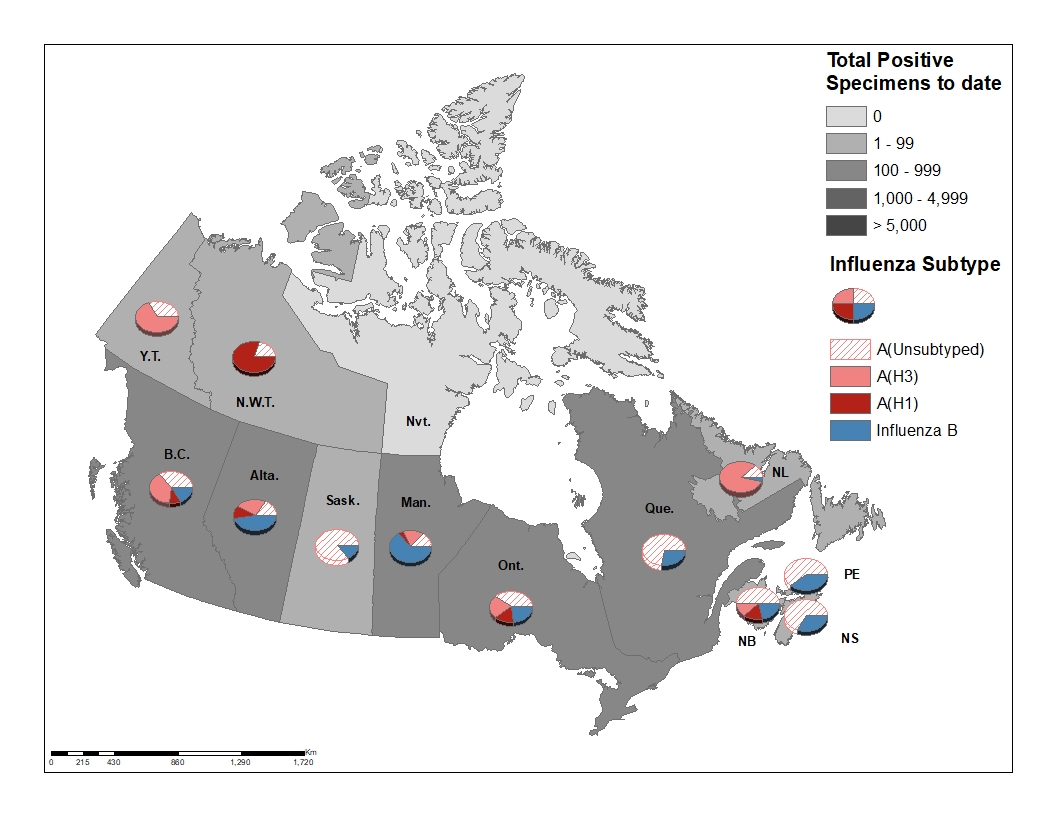
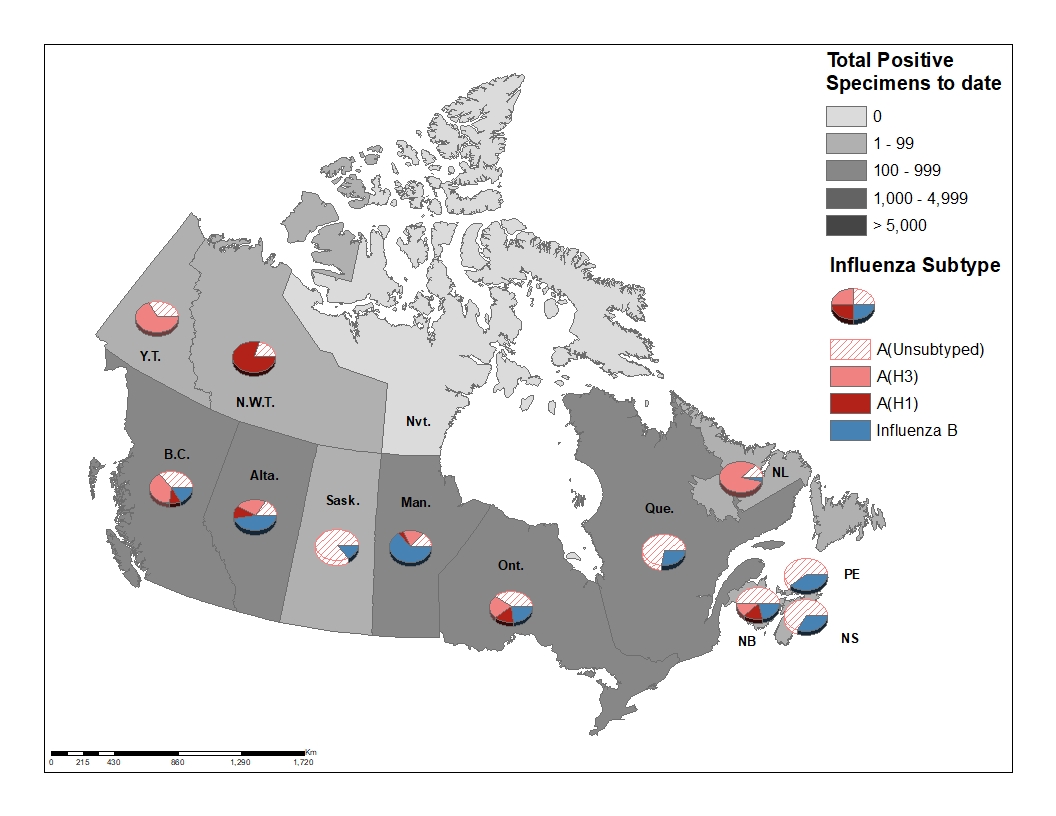
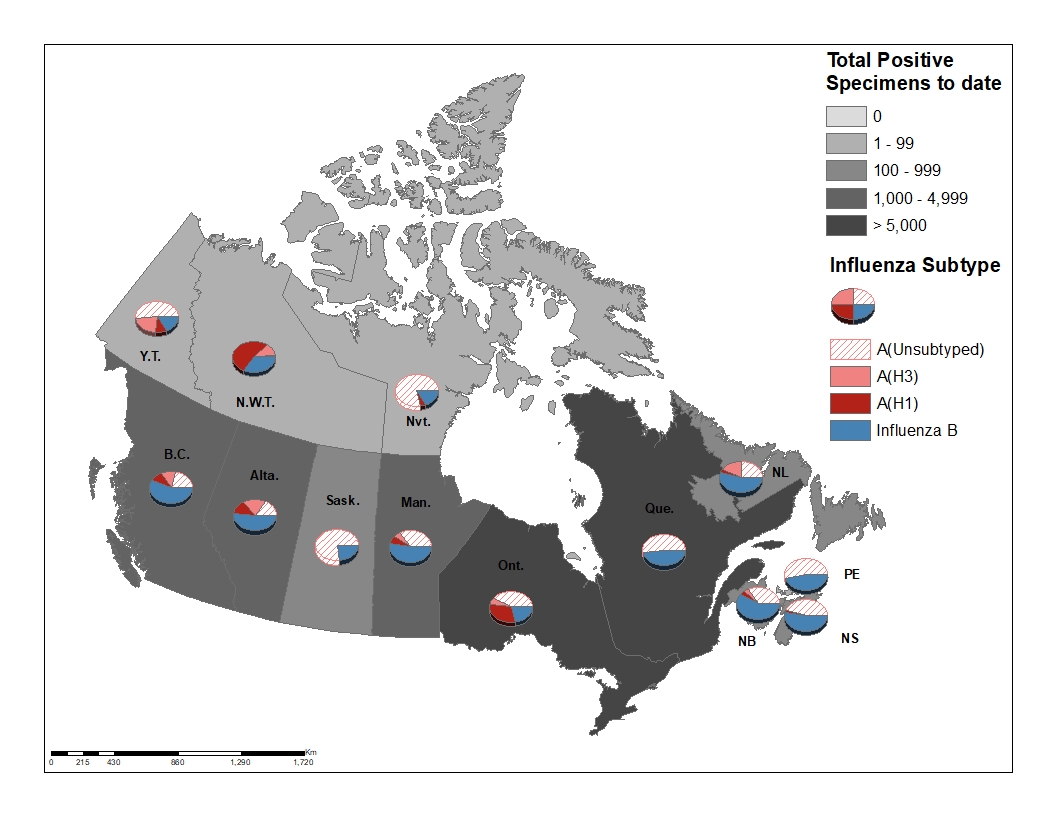
Figure 2 - Text equivalentFigure 3 – Distribution of positive influenza specimens by type/subtype and province/territory[SUP]Footnote*[/SUP], Canada, weeks 2019-35 to 2019-48
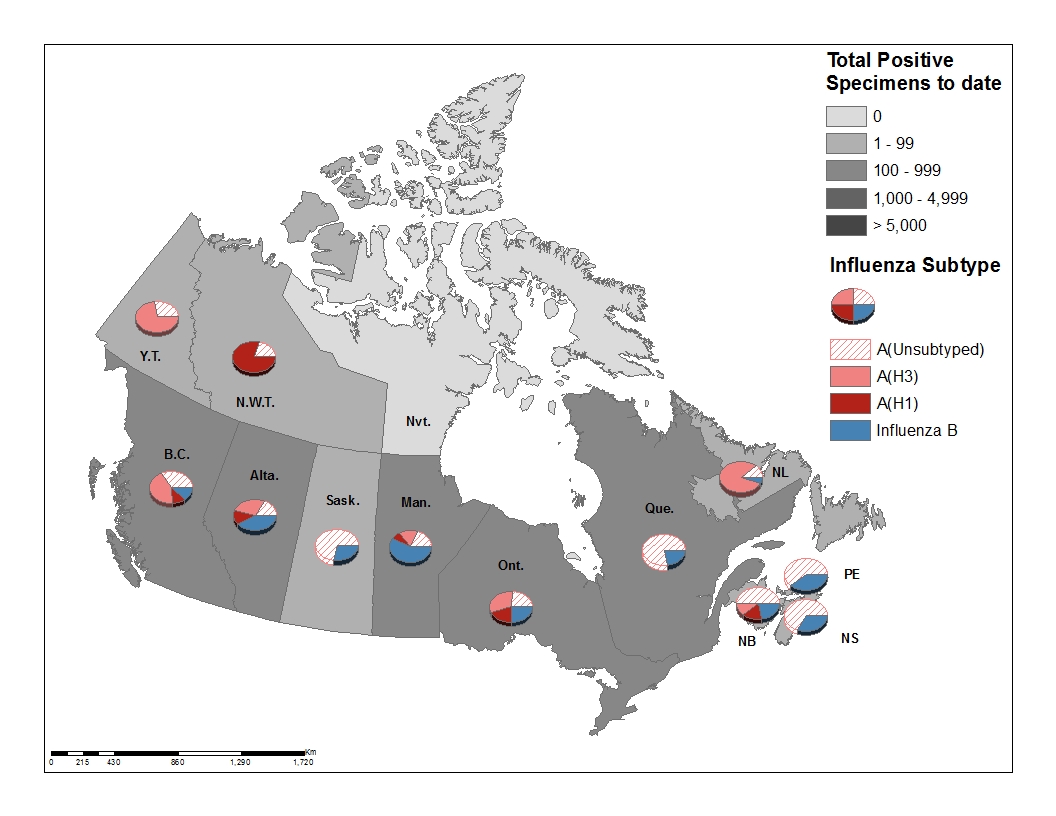
fig3-eng.jpg

Footnote * Specimens from NWT, YT, and Nvt are sent to reference laboratories in other provinces. However, data on laboratory-confirmed detections of influenza from Nunavut are not currently available

Return to footnote*referrer Figure 3 - Text equivalent
0-41302538676919914%
5-191229407318330521%
20-44183305110214432722%
45-6420443561052322716%
65+379191392212039927%
Total10181263245684391457100%

Table 1 - Cumulative numbers of positive influenza specimens by type, subtype and age group reported through case-based laboratory reporting, Canada, weeks 2019-35 to 2019-48
Age groups
(years) Cumulative (August 25, 2019 to November 30, 2019)
Influenza A B Influenza A and B
A Total A(H1N1) A(H3N2) A (Un subtyped)1 Total # %
[TD="colspan: 8"] Table 1 Footnote 1 Unsubtyped: The specimen was typed as influenza A, but no result for subtyping was available.

Table 1 Return to footnote1referrer [/TD]
[h=2]Syndromic / Influenza-like Illness Surveillance[/h] [h=3]Healthcare Professionals Sentinel Syndromic Surveillance[/h]
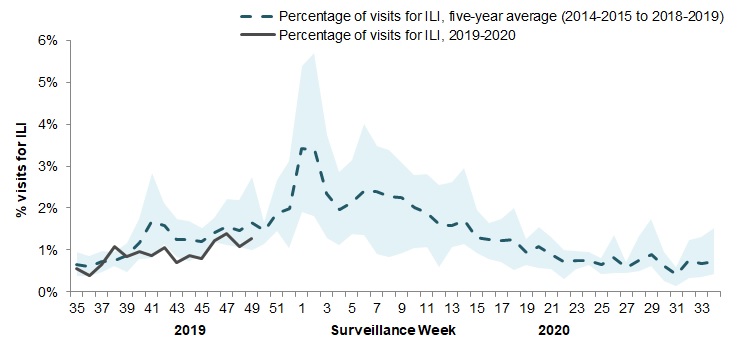
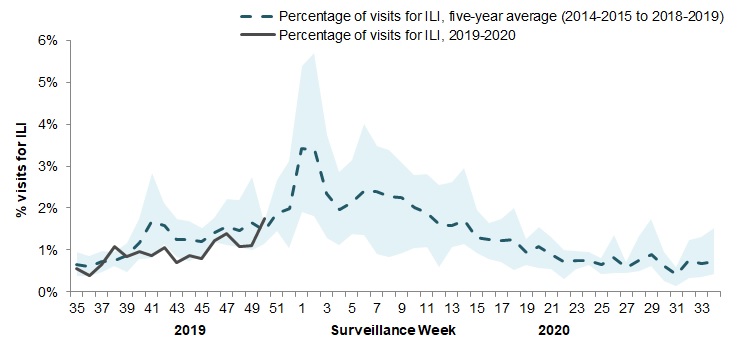
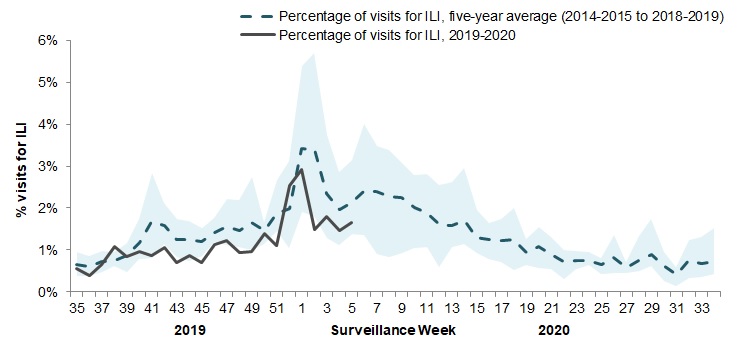
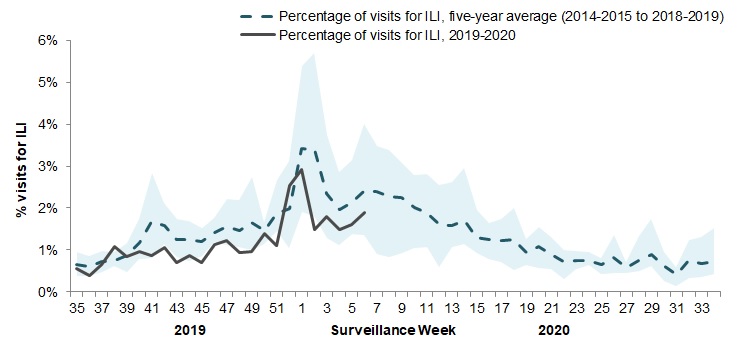
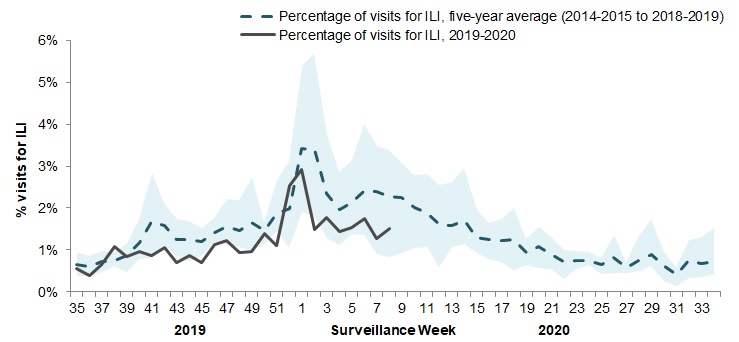
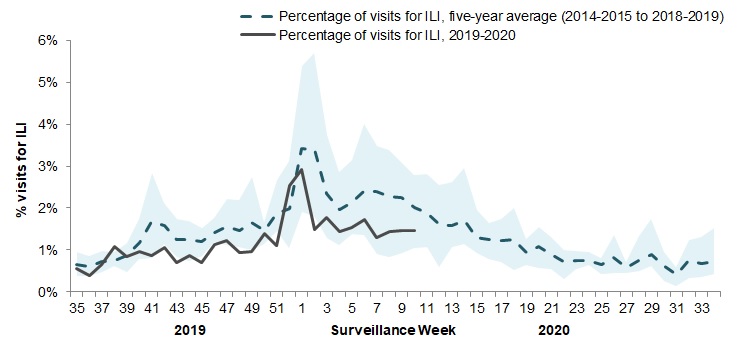
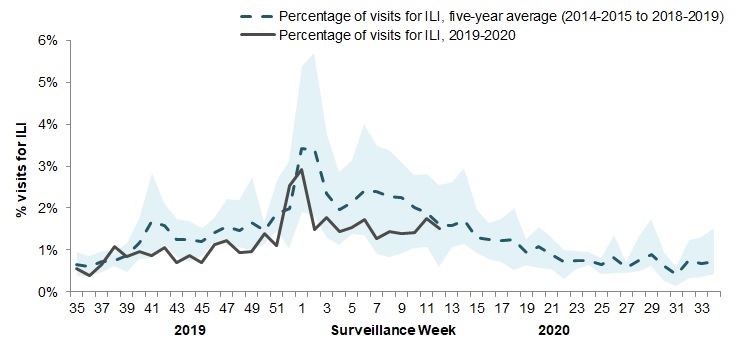
In week 48, 1.3% of visits to healthcare professionals were due to influenza-like illness (ILI) which is slightly below the average for this time of year (1.5%) (Figure 4). Figure 4 – Percentage of visits for ILI reported by sentinels by report week, Canada, weeks 2019-35 to 2019-48
Number of participants reporting in week 48: 72
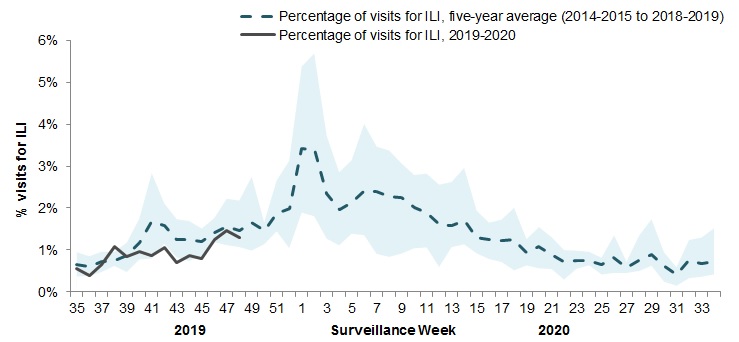
fig4-eng.jpg


The shaded area represents the maximum and minimum percentage of visits for ILI reported by week from seasons 2014-2015 to 2018-2019 Figure 4 - Text equivalent[h=2]FluWatchers[/h]
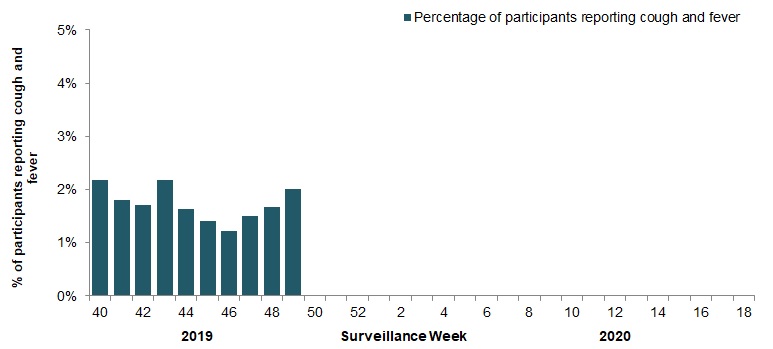
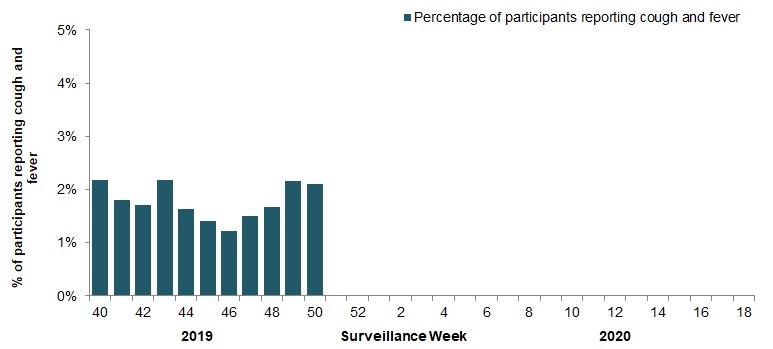
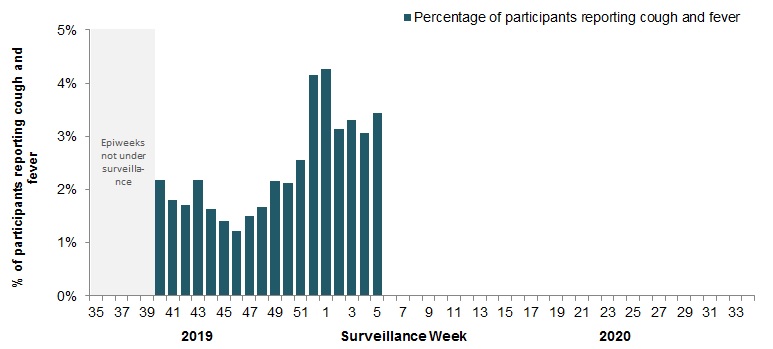
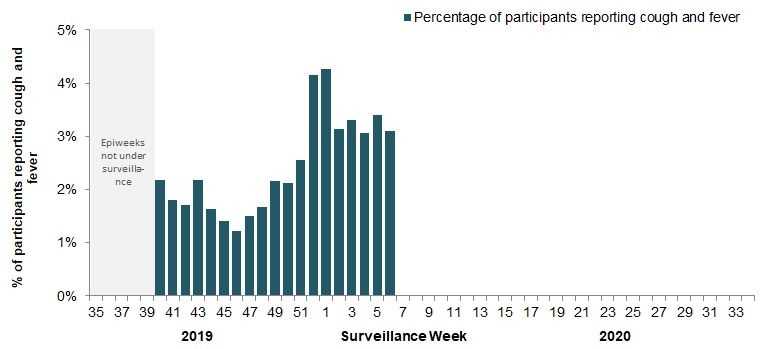
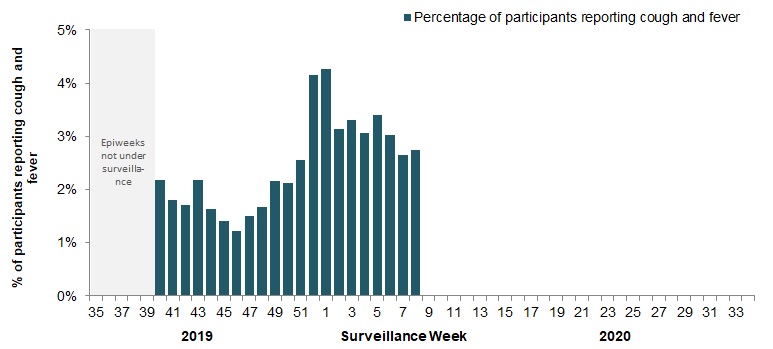
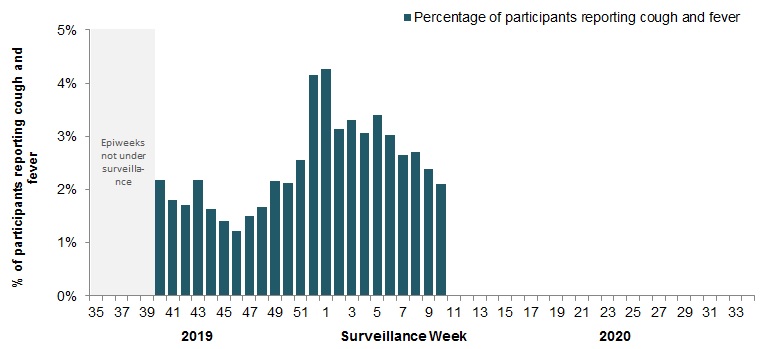
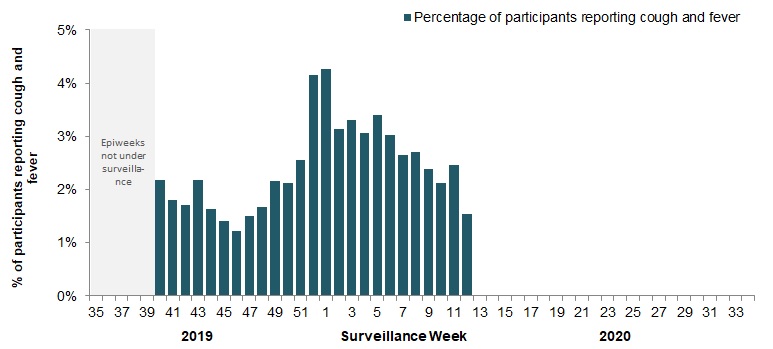
In week 48, 3,104 participants reported to FluWatchers, of which 1.6% (51) reported symptoms of cough and fever (Figure 5).

Among the 51 participants who reported cough and fever:
  • 35% consulted a healthcare professional;
  • 69% reported days missed from work or school, resulting in a combined total of 106 missed days of work or school.
  • 65% reported having been vaccinated for influenza this season.
If you are interested in becoming a FluWatcher, sign up today. Figure 5 - Percentage of participants reporting fever and cough, Canada, weeks 2019-40 to 2019-48
Number of Participants Reporting in Week 48: 3,104
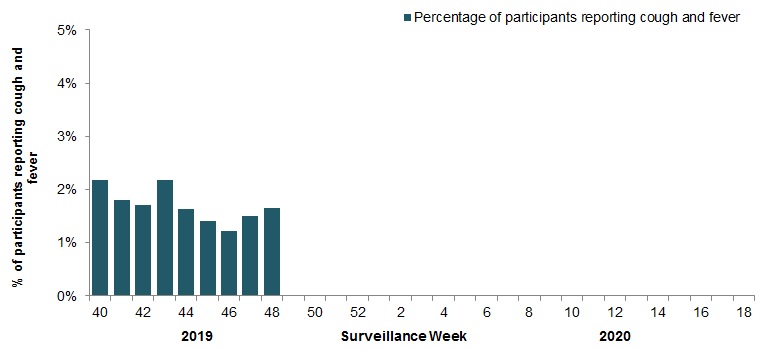
fig5-eng.jpg
Figure 5 - Text equivalent
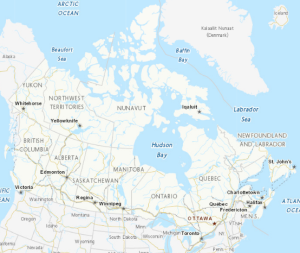
Online Figure – Geographic distribution of FluWatchers participants reporting cough and fever, Canada, week 2019-48

Click on the map to access the link
map
[h=2]Influenza Outbreak Surveillance[/h]
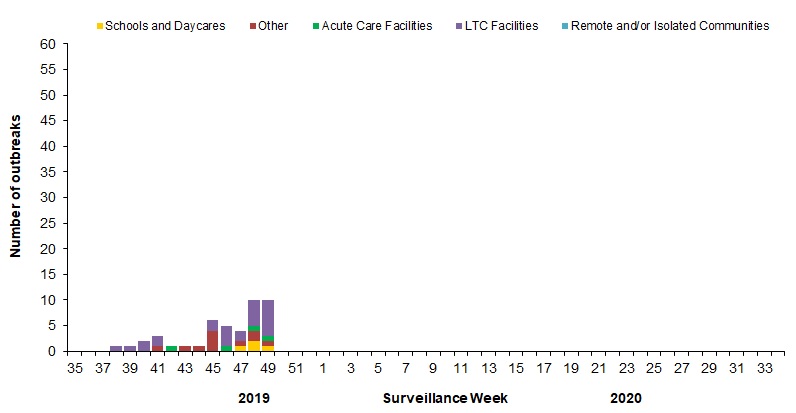
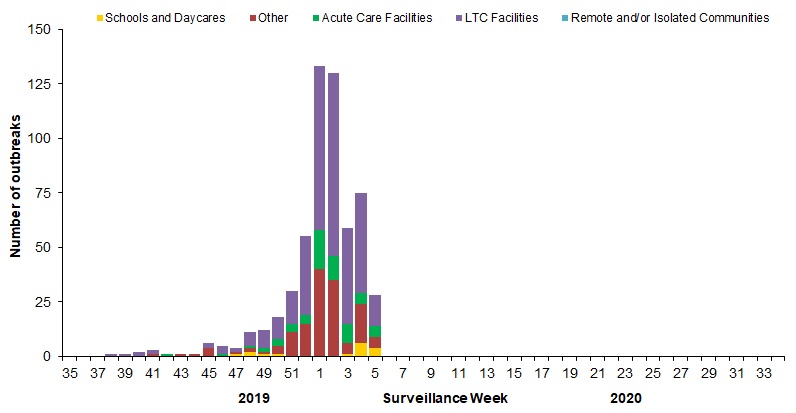
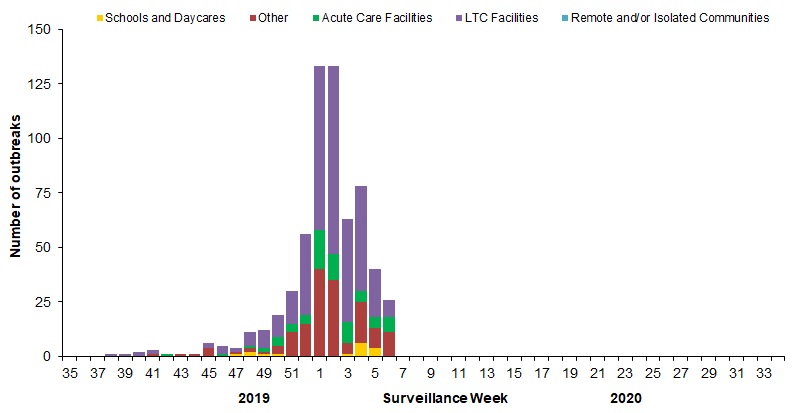
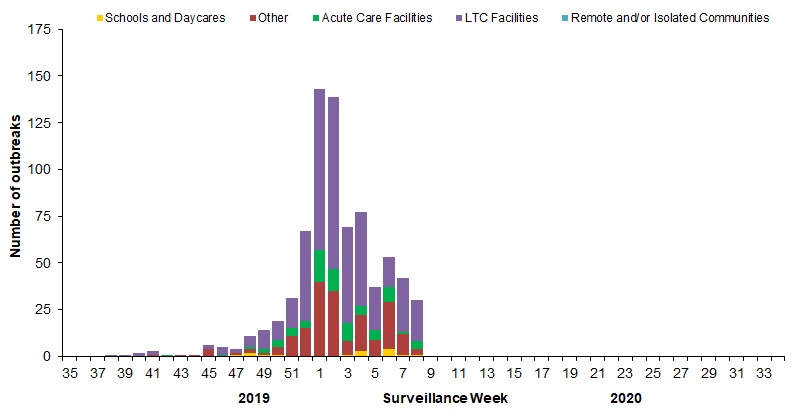
In week 48, eight new outbreaks were reported: four in long term care facilities, one in an acute care facility, one in a school/daycare and two in facilities categorized as ‘other’, which includes facilities such as private personal care homes, correctional facilities, and colleges/universities (Figure 6).

To date this season, a total of 33 laboratory-confirmed influenza outbreaks have been reported; eighteen in long-term care facilities, two in a schools/daycares, three in acute care facilities and ten in a facilities categorized as ‘other’. Of the outbreaks where influenza type was reported (31), twenty-five were due to influenza A. Among the 14 outbreaks for which the influenza A subtype was reported, all were associated with A(H3N2). One ILI outbreak in a school/daycare has also been reported. Figure 6 – Number of new outbreaks of laboratory-confirmed influenza by report week, Canada, weeks 2019-35 to 2019-48
Number of provinces and territories reporting in week 48: 13 out of 13
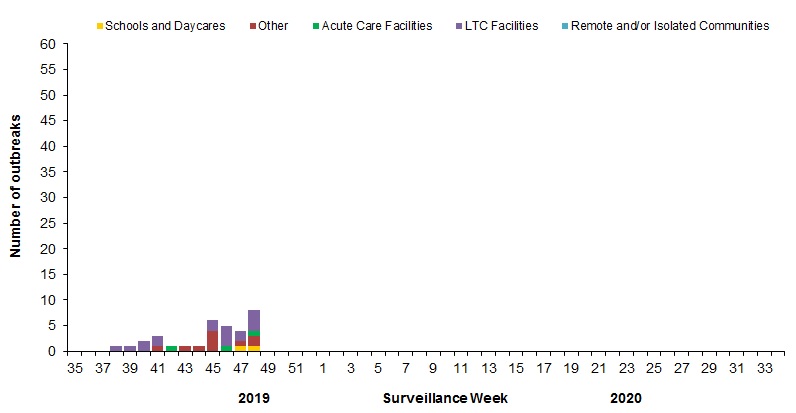
fig6-eng.jpg
Figure 6 - Text equivalent[h=2]Severe Outcomes Influenza Surveillance[/h]
Provincial/Territorial Influenza Hospitalizations and Deaths

To date this season. 152 influenza-associated hospitalizations were reported by participating provinces and territories[SUP]Footnote1[/SUP].
  • 88% of the cases were influenza A.
  • Of the cases for which subtype was reported (105), 74% were associated with influenza A(H3N2).
  • The greatest proportion of hospitalizations (47%) were among adults ≥ 65 years of age.
Nineteen ICU admissions and no deaths have been reported.

Number of provinces and territories reporting in week 48: 9 out of 9 Footnote 1 Influenza-associated hospitalizations are reported by N.L., P.E.I. N.S., N.B., Man., Alb., Y.T. and N.W.T. Only hospitalizations that require intensive medical care are reported by Sask. The cumulative rate of hospitalizations is calculated using the population by age-group in participating provinces and territories.

Footnote1referrer [h=3]Pediatric Influenza Hospitalizations and Deaths[/h]
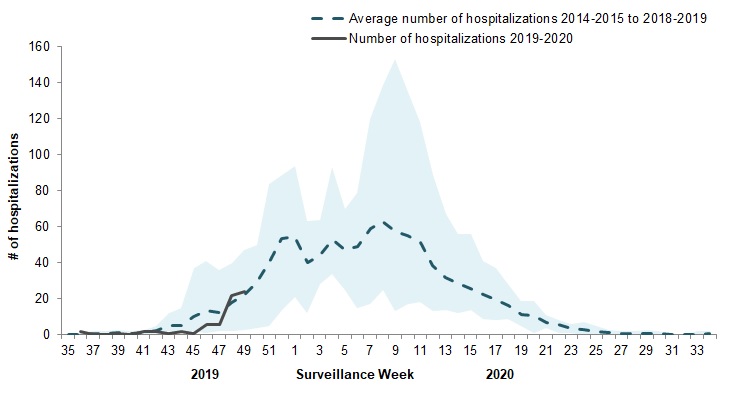
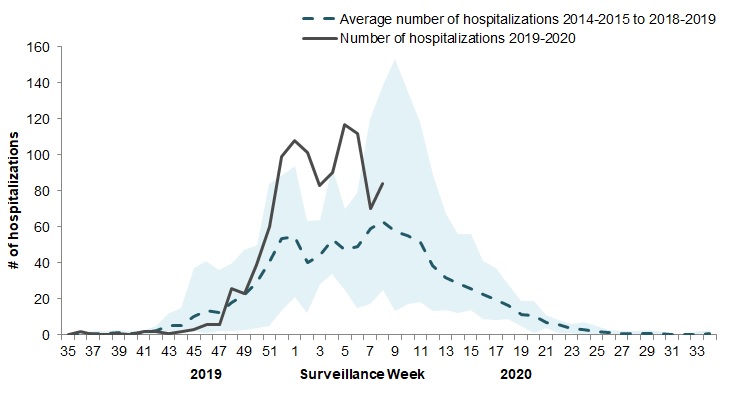
In week 48, 21 pediatric (≤16 years of age) laboratory-confirmed influenza-associated hospitalizations were reported by the Immunization Monitoring Program Active (IMPACT) network (Figure 7). This is slightly above the average (18) for week 48 over the previous five seasons.

To date this season, 43 pediatric hospitalizations have been reported by the IMPACT network; 58% (25) of cases were associated with influenza A and 42 % (18) with influenza B. Among the 10 cases for which the influenza A subtype was reported, 70% (7) were associated with A(H1N1). Figure 7 – Number of pediatric (≤16 years of age) hospitalizations reported by the IMPACT network, by week, Canada, weeks 2019-35 to 2019-48
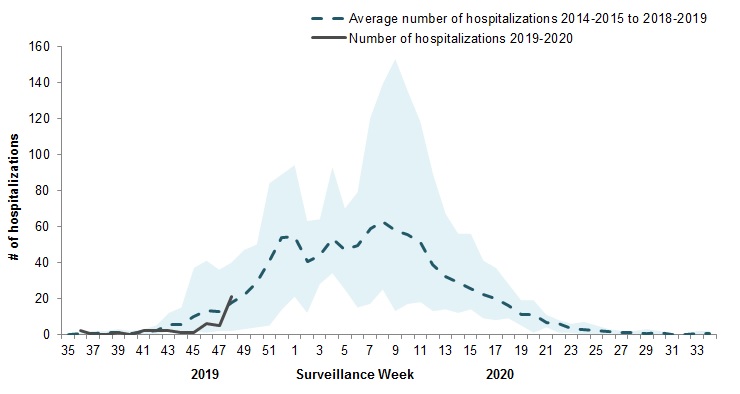
fig7-eng.jpg


The shaded area represents the maximum and minimum number of cases reported by week from seasons 2014-15 to 2018-19 Figure 7 - Text equivalent
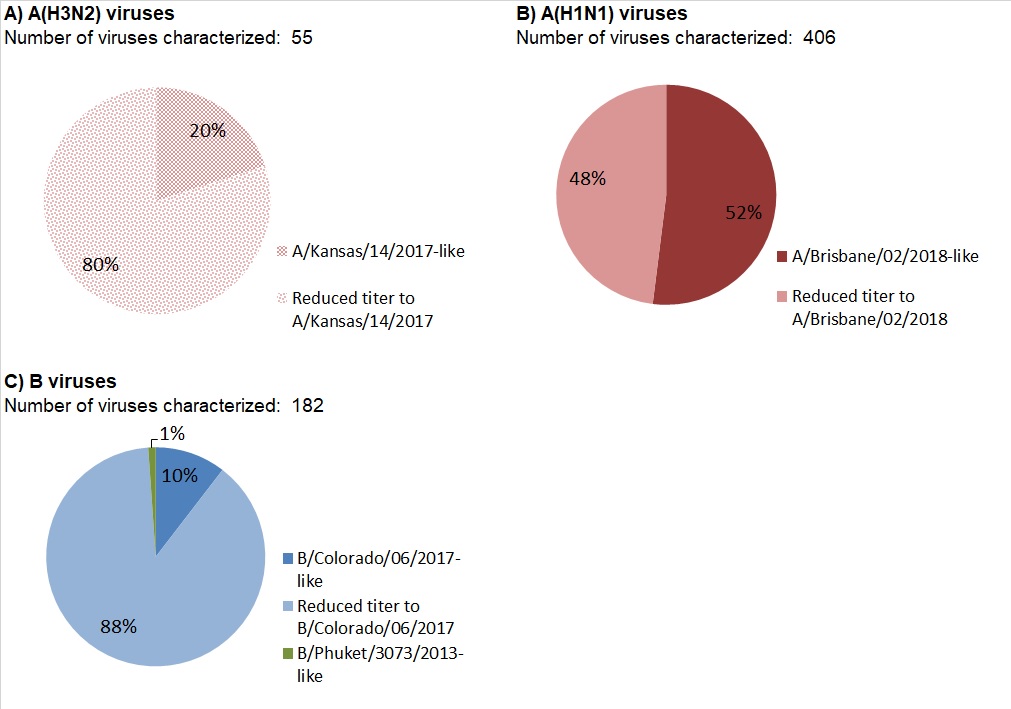
Distribution of antigenic phenotype among characterized influenza viruses, Canada, weeks 2019-35 to 2019-48 [h=3]Adult Influenza Hospitalizations and Deaths[/h]
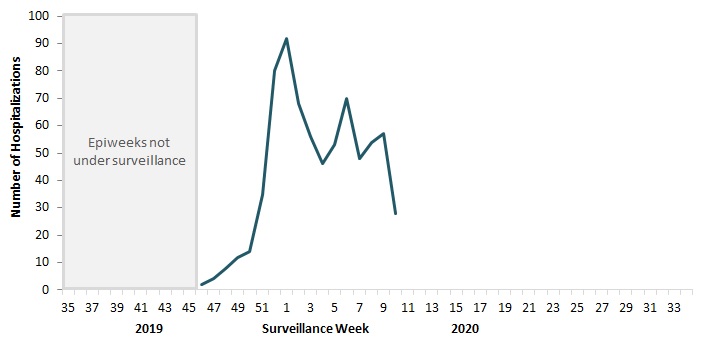
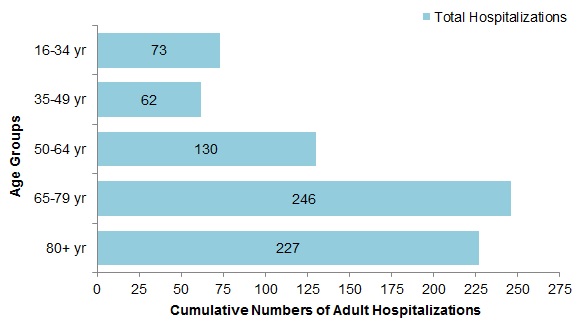
Surveillance of laboratory-confirmed influenza-associated adult (≥16 years of age) hospitalizations by the Canadian Immunization Research Network (CIRN) Serious Outcomes Surveillance (SOS) network began on November 1st for the 2019-20 season. To date this season, 14 cases have been reported. [h=2]Influenza Strain Characterizations[/h]
From September 1 to December 5, 2019, the National Microbiology Laboratory (NML) has characterized 80 influenza viruses (44 A(H3N2), 21 A(H1N1) and 15 influenza B) that were received from Canadian laboratories. [h=3]Influenza A(H3N2)[/h]
Over recent years, circulating strains of A(H3N2) have evolved, and are increasingly difficult to characterize by hemagglutination inhibition (HI) assay. Genetic characterization is established by sequencing the hemagglutinin (HA) gene of the influenza viruses to compare their genetic properties. [h=3]Antigenic Characterization:[/h]
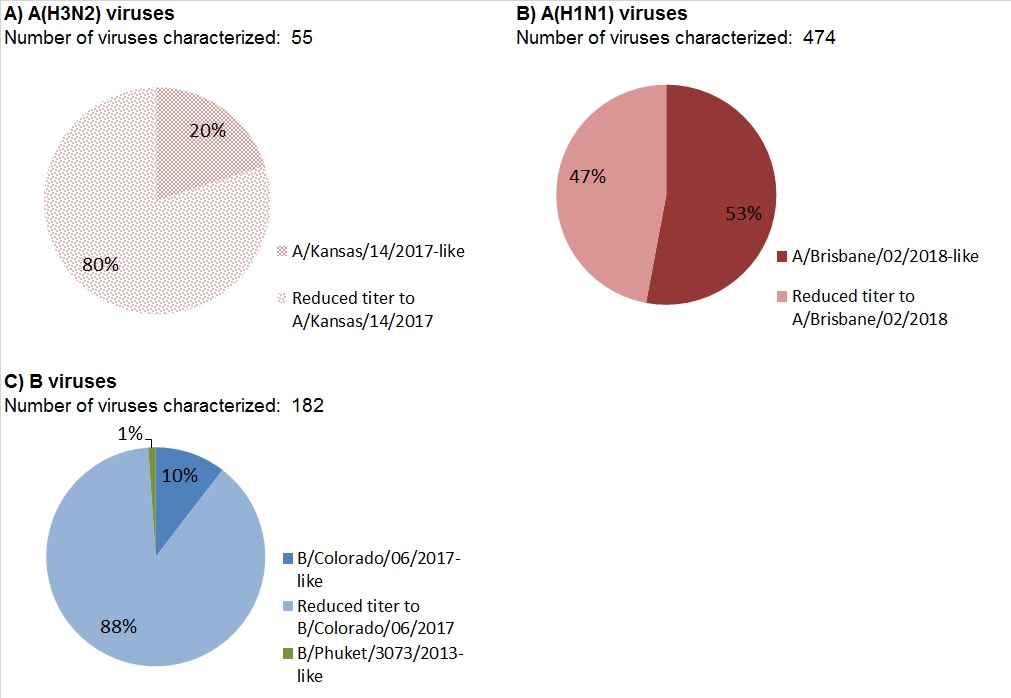
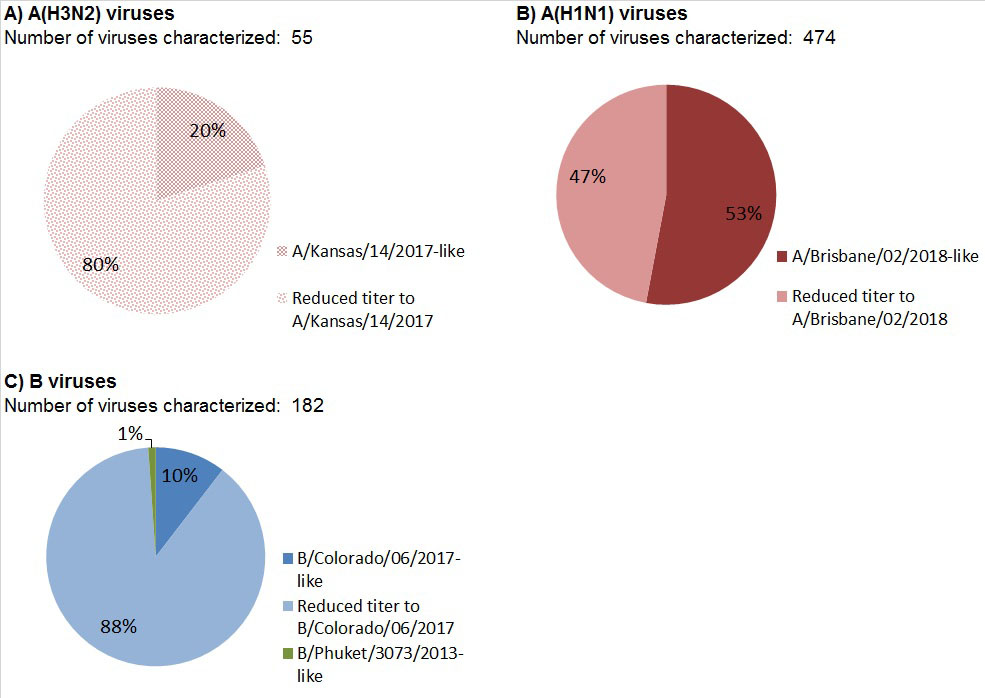
Among the 14 influenza A(H3N2) viruses antigenically characterized to date, the majority (79%) showed reduced titer by HI assay to A Kansas/14/2017 using antiserum raised against egg-propagated A Kansas/14/2017 (Figure 8a). [h=3]Genetic Characterization:[/h]
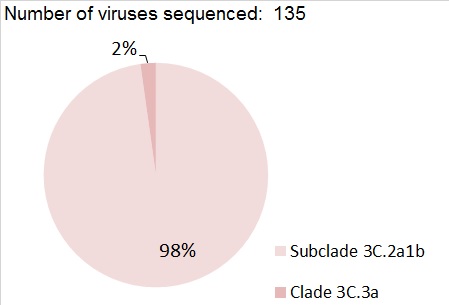
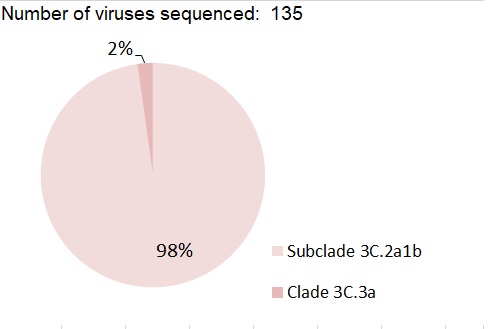
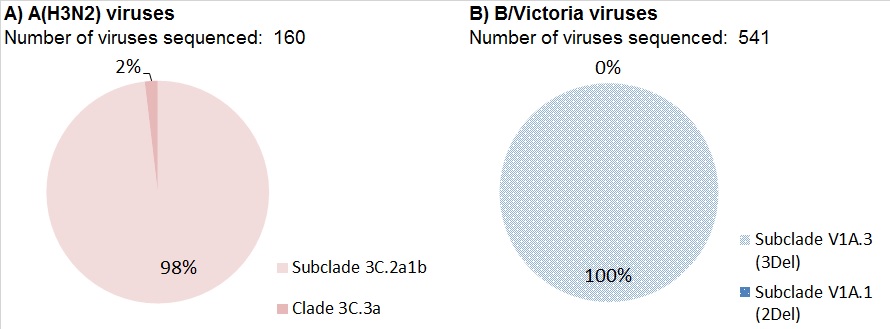
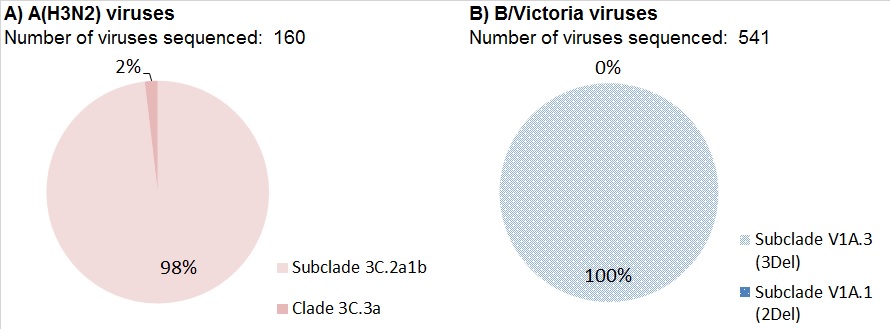
Nearly all (93%) of the 40 A(H3N2) viruses genetically characterized this season belonged to genetic group 3C.2a1b based on sequence analysis of the HA gene. Three viruses belonged to the genetic group 3C.3a (Figure 9).

Group 3C.2a1b viruses analysed represent:
  • 70% (7 out of 10) viruses that were also antigenically characterized. Sequence is pending for the other four isolates.
  • 100% (30 out of 30) viruses which did not grow to sufficient hemagglutination titer for antigenic characterization by HI assay.
A/Kansas/14/2017 belongs to genetic group 3C.3a and is the influenza A(H3N2) component of the 2019-20 Northern Hemisphere influenza vaccine. [h=3]Influenza A(H1N1)[/h]
Among the 21 A(H1N1) viruses characterized to date, all were antigenically similar to A/Brisbane/02/2018 by HI testing using antiserum raised against egg-propagated A/Brisbane/02/2018 (Figure 8b). A/Brisbane/02/2018 is the influenza A(H1N1) component of the 2019-20 Northern Hemisphere influenza vaccine. [h=3]Influenza B[/h]
Among the 15 influenza B viruses antigenically characterized this season, all belonged to the B/Victoria lineage, and the majority (60%) showed reduced titer by HI assay to B/Colorado/06/2017 using antiserum raised against cell culture-propagated B/Colorado/06/2017 (Figure 8c).

Sequence analysis showed that all of the nine viruses showing reduced titre had a three amino acid deletion (162-164) in the HA gene.

The recommended influenza B components for the 2019-20 Northern Hemisphere influenza vaccine are B/Colorado/06/2017 (Victoria lineage) and B/Phuket/3073/2013 (Yamagata lineage). B/Phuket/3073/2013 is included in the quadrivalent influenza vaccine. Figure 8 - Distribution of antigenic phenotypes among characterized influenza viruses, Canada, September 1 to December 5, 2019
fig8-eng.jpg
Figure 8 - Text equivalentFigure 9 – Distribution of genetic clades among characterized A(H3N2) influenza viruses, Canada, September 1 to December 5, 2019
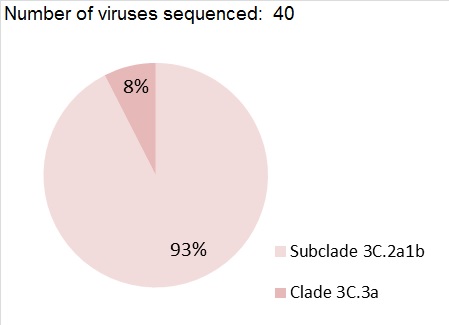
fig9-eng.jpg
Figure 9 - Text Description[h=2]Antiviral Resistance[/h]
The National Microbiology Laboratory (NML) also tests influenza viruses received from Canadian laboratories for antiviral resistance. [h=3]Oseltamivir:[/h]
75 influenza viruses (41 A(H3N2), 18 A(H1N1) and 16 B) were tested for resistance to oseltamivir
  • All influenza viruses tested were sensitive to oseltamivir.
[h=3]Zanamivir:[/h]
75 influenza viruses (41 A(H3N2), 18 A(H1N1) and 16 B) were tested for resistance to zanamivir:
  • All influenza viruses tested were sensitive to zanamivir.
[h=3]Amantadine:[/h]
High levels of resistance to amantadine persist among influenza A(H1N1) and influenza A(H3N2) viruses. All viruses tested this season were resistant.


...
https://www.canada.ca/en/public-hea...ch/2019-2020/week-48-november-24-30-2019.html
 
[h=1]FluWatch report: December 1 to 7, 2019 (week 49)[/h]
pub-eng.jpg


Download the alternative format
(PDF format, 688 KB, 11 pages)

Organization: Public Health Agency of Canada

Date published: 2019-12-13[h=3]Related Topics[/h]
[h=2]Overall Summary[/h]
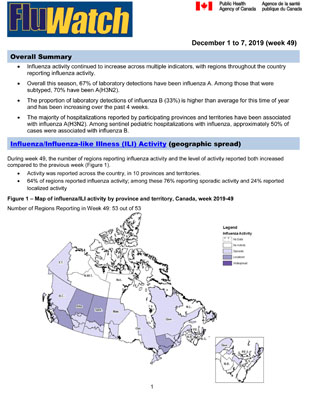
  • Influenza activity continued to increase across multiple indicators, with regions throughout the country reporting influenza activity.
  • In week 49, the majority of laboratory detections continued to be influenza A, although the proportion that were influenza B increased (44%). Among influenza A detections, 65% were A(H3N2).
  • This season, the majority of hospitalizations reported by participating provinces and territories have been associated with influenza A(H3N2). Among sentinel pediatric hospitalizations with influenza, approximately 50% of cases were associated with influenza B.
[h=2]On this page[/h]
[h=2]Influenza/Influenza-like Illness (ILI) Activity (geographic spread)[/h]
During week 49, the number of regions reporting influenza activity and the level of activity reported both increased compared to the previous week (Figure 1).
  • Activity was reported across the country, in 10 provinces and territories.
  • 64% of regions reported influenza activity; among these 76% reporting sporadic activity and 24% reported localized activity
Figure 1 – Map of influenza/ILI activity by province and territory, Canada, week 2019-49

Number of Regions Reporting in Week 49: 53 out of 53
fig1-eng.jpg
Figure 1 - Text equivalent[h=2]Laboratory-Confirmed Influenza Detections[/h]
In week 49, the number of detections of influenza continued to increase. The following results were reported from sentinel laboratories across Canada (Figures 2 and 3):
  • The percentage of tests positive for influenza was 9.1%. This is slightly below the average (13.7%) for week 49 over the past five seasons.
  • A total of 724 laboratory detections of influenza were reported, of which 56.5% (409) were influenza A. The proportion of detections that are influenza B has been increasing over the past four weeks, to 43.5% in week 49.
  • The percentage of tests positive for influenza B (4.0%) is higher than the average (1.1%) for this time of year. The current level of influenza B activity is not normally seen until January or February.
  • Among subtyped influenza A detections, a mix of A(H1N1) and A(H3N2) were detected; 65% (60 out of 93) were influenza A(H3N2).
To date this season (weeks 35 to 49), 2,494 laboratory detections of influenza were reported:
  • 67% (1,673) were influenza A. The percentage of tests positive for influenza B to date this season is following a similar trend to the 2017-18 season, when influenza A and B circulated in almost equal proportions.
  • Among subtyped influenza A detections (612), 70% were influenza A(H3N2).
Detailed information on age and type/subtype has been received for 2,104 laboratory-confirmed influenza cases (Table 1).

To date this season (weeks 35 to 49):
  • Among cases of influenza A(H3N2) (397), the largest proportion were in adults 65 years of age and older (44%).
  • Cases of influenza B (753) were primarily in younger age groups; 61% of cases were under 20 years of age and 31% between 20 and 44 years of age.
  • Among cases of influenza A(H1N1) (161), 34% of cases were in adults between 45 and 64 years of age, and 23% between 20 and 44 years of age.
For more detailed weekly and cumulative influenza data, see the text descriptions for Figures 2 and 3 or the Respiratory Virus Detections in Canada Report. Figure 2 - Number of positive influenza tests and percentage of tests positive, by type, subtype and report week, Canada, weeks 2019-35 to 2019-49

Number of Laboratories Reporting in Week 49: 36 out of 36
fig2-eng.jpg


The shaded area indicates weeks where the positivity rate was at least 5% and a minimum of 15 positive tests were observed, signalling the period of seasonal influenza activity. Figure 2 - Text equivalentFigure 3 – Distribution of positive influenza specimens by type/subtype and province/territory[SUP]Footnote*[/SUP], Canada, weeks 2019-35 to 2019-49
fig3-eng.jpg

Footnote * Specimens from NWT, YT, and Nvt are sent to reference laboratories in other provinces. However, data on laboratory-confirmed detections of influenza from Nunavut are not currently available

Return to footnote*referrer Figure 3 - Text equivalent
0-4185324610712731215%
5-1915810509833148923%
20-44241376114323647723%
45-6427255671503230414%
65+495271732952752225%
Total13511613977937532104100%

Table 1 - Cumulative numbers of positive influenza specimens by type, subtype and age group reported through case-based laboratory reporting, Canada, weeks 2019-35 to 2019-49
Age groups
(years) Cumulative (August 25, 2019 to December 7, 2019)
Influenza A B Influenza A and B
A Total A(H1N1) A(H3N2) A (Un subtyped)1 Total # %
[TD="colspan: 8"] Table 1 Footnote 1 Unsubtyped: The specimen was typed as influenza A, but no result for subtyping was available.

Table 1 Return to footnote1referrer [/TD]
[h=2]Syndromic / Influenza-like Illness Surveillance[/h] [h=3]Healthcare Professionals Sentinel Syndromic Surveillance[/h]
In week 49, 1.3% of visits to healthcare professionals were due to influenza-like illness (ILI) which is slightly below the average for this time of year (1.5%) (Figure 4). Figure 4 – Percentage of visits for ILI reported by sentinels by report week, Canada, weeks 2019-35 to 2019-49
Number of participants reporting in week 49: 81

fig4-eng.jpg


The shaded area represents the maximum and minimum percentage of visits for ILI reported by week from seasons 2014-2015 to 2018-2019 Figure 4 - Text equivalent[h=2]FluWatchers[/h]
In week 49, 3,092 participants reported to FluWatchers, of which 2.0% (62) reported symptoms of cough and fever (Figure 5).

Among the 62 participants who reported cough and fever:
  • 31% consulted a healthcare professional;
  • 79% reported days missed from work or school, resulting in a combined total of 136 missed days of work or school.
  • 68% reported having been vaccinated for influenza this season.
If you are interested in becoming a FluWatcher, sign up today. Figure 5 - Percentage of participants reporting fever and cough, Canada, weeks 2019-40 to 2019-49
Number of Participants Reporting in Week 49: 3,092

fig5-eng.jpg
Figure 5 - Text equivalent
Online Figure – Geographic distribution of FluWatchers participants reporting cough and fever, Canada, week 2019-49

Click on the map to access the link

map
[h=2]Influenza Outbreak Surveillance[/h]
In week 49, ten new laboratory-confirmed outbreaks were reported: seven in long term care facilities, one in an acute care facility, one in a school/daycare and one in a facility categorized as ‘other’, which includes facilities such as private personal care homes, correctional facilities, and colleges/universities (Figure 6). Two new ILI outbreaks in schools were reported.

To date this season, a total of 45 laboratory-confirmed influenza outbreaks have been reported; 26 in long-term care facilities, four in schools/daycares, four in acute care facilities and 11 in a facilities categorized as ‘other’. Of the outbreaks where influenza type was reported (42), 86%(36) were due to influenza A. Among the 18 outbreaks for which the influenza A subtype was reported, all were associated with A(H3N2). Three ILI outbreaks in schools/daycares have also been reported. Figure 6 – Number of new outbreaks of laboratory-confirmed influenza by report week, Canada, weeks 2019-35 to 2019-49
Number of provinces and territories reporting in week 49: 13 out of 13

fig6-eng.jpg
Figure 6 - Text equivalent[h=2]Severe Outcomes Influenza Surveillance[/h]
Provincial/Territorial Influenza Hospitalizations and Deaths

To date this season. 200 influenza-associated hospitalizations were reported by participating provinces and territories[SUP]Footnote1[/SUP].
  • 75% of the cases were influenza A.
  • Of the cases for which subtype was reported (129), 77% were associated with influenza A(H3N2).
  • The greatest proportion of hospitalizations (42%) were among adults ≥ 65 years of age.
Twenty-eight ICU admissions and one death have been reported.

Number of provinces and territories reporting in week 49: 9 out of 9 Footnote 1 Influenza-associated hospitalizations are reported by N.L., P.E.I. N.S., N.B., Man., Alb., Y.T. and N.W.T. Only hospitalizations that require intensive medical care are reported by Sask. The cumulative rate of hospitalizations is calculated using the population by age-group in participating provinces and territories.

Footnote1referrer [h=3]Pediatric Influenza Hospitalizations and Deaths[/h]
In week 49, 24 pediatric (≤16 years of age) laboratory-confirmed influenza-associated hospitalizations were reported by the Immunization Monitoring Program Active (IMPACT) network (Figure 7). This is close to the average (22) for week 49 over the previous five seasons.

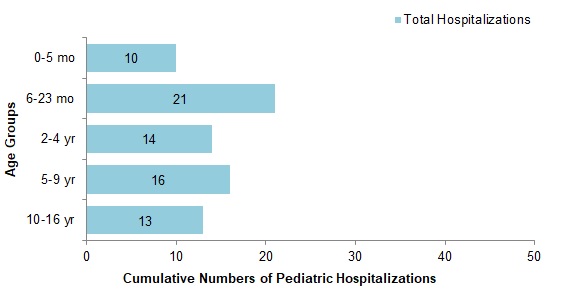
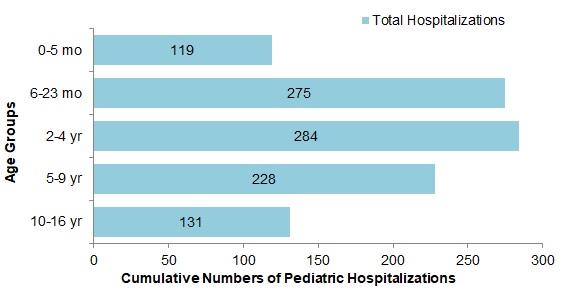
To date this season, 69 pediatric hospitalizations have been reported by the IMPACT network; 51% (35) of cases were associated with influenza A and 49 % (34) with influenza B. Among the 13 cases for which the influenza A subtype was reported, 54% (7) were associated with A(H1N1). The largest proportion of hospitalizations (61%) were among children under 5 years of age (Figure 8). Figure 7 – Number of pediatric (≤16 years of age) hospitalizations reported by the IMPACT network, by week, Canada, weeks 2019-35 to 2019-49
fig7-eng.jpg


The shaded area represents the maximum and minimum number of cases reported by week from seasons 2014-15 to 2018-19 Figure 7 - Text equivalentFigure 8 – Cumulative number of pediatric hospitalizations (≤16 years of age) with influenza by age-group reported by the IMPACT network, Canada, weeks 2019-35 to 2019-49
fig8-eng.jpg
Figure 8 - Text equivalent[h=3]Adult Influenza Hospitalizations and Deaths[/h]
Surveillance of laboratory-confirmed influenza-associated adult (≥16 years of age) hospitalizations by the Canadian Immunization Research Network (CIRN) Serious Outcomes Surveillance (SOS) network began on November 1st for the 2019-20 season. To date this season, 24 hospitalizations, no ICU admissions, and less than 5 deaths have been reported. [h=2]Influenza Strain Characterizations[/h]
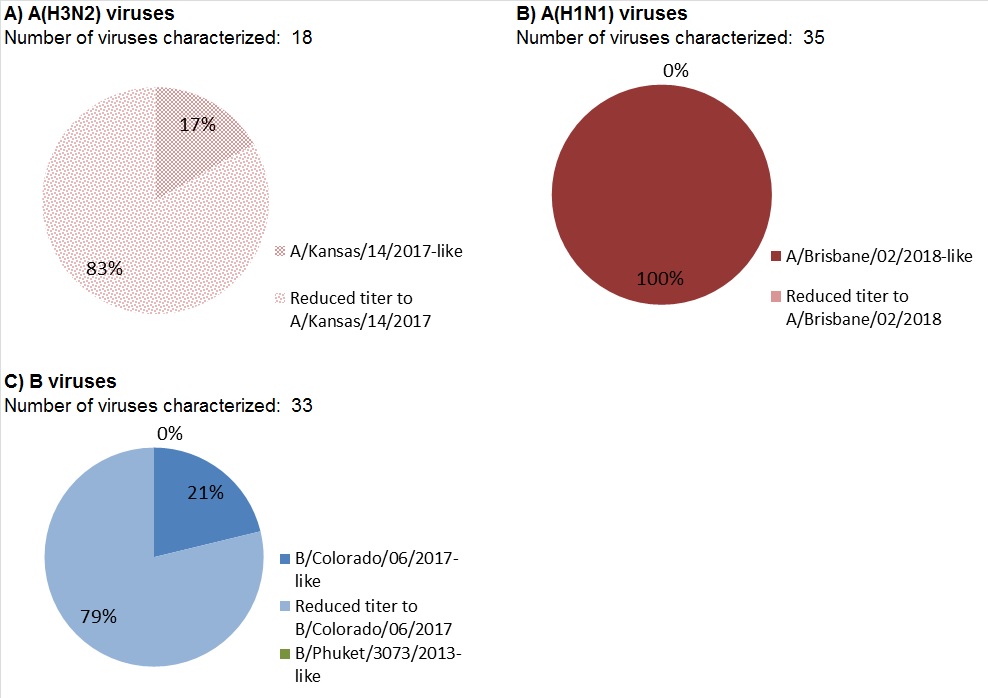
From September 1 to December 12, 2019, the National Microbiology Laboratory (NML) has characterized 133 influenza viruses (65 A(H3N2), 35 A(H1N1) and 33 influenza B) that were received from Canadian laboratories. [h=3]Influenza A(H3N2)[/h]
Over recent years, circulating strains of A(H3N2) have evolved, and are increasingly difficult to characterize by hemagglutination inhibition (HI) assay. Genetic characterization is established by sequencing the hemagglutinin (HA) gene of the influenza viruses to compare their genetic properties. [h=3]Antigenic Characterization:[/h]
Among the 18 influenza A(H3N2) viruses antigenically characterized to date, the majority (83%) showed reduced titer by HI assay to A Kansas/14/2017 using antiserum raised against egg-propagated A Kansas/14/2017 (Figure 9a). [h=3]Genetic Characterization:[/h]
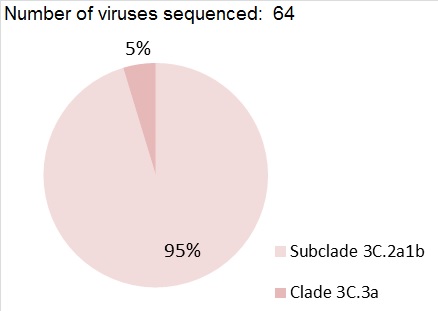
Nearly all (95%) of the 64 A(H3N2) viruses genetically characterized this season belonged to genetic group 3C.2a1b based on sequence analysis of the HA gene. Three viruses belonged to the genetic group 3C.3a (Figure 10).
Group 3C.2a1b viruses analysed represent:
  • 82% (14 out of 17) viruses that were also antigenically characterized. Sequence is pending for one isolate.
  • 100% (47 out of 47) viruses which did not grow to sufficient hemagglutination titer for antigenic characterization by HI assay.
A/Kansas/14/2017 belongs to genetic group 3C.3a and is the influenza A(H3N2) component of the 2019-20 Northern Hemisphere influenza vaccine. [h=3]Influenza A(H1N1)[/h]
Among the 35 A(H1N1) viruses characterized to date, all were antigenically similar to A/Brisbane/02/2018 by HI testing using antiserum raised against egg-propagated A/Brisbane/02/2018 (Figure 9b).
A/Brisbane/02/2018 is the influenza A(H1N1) component of the 2019-20 Northern Hemisphere influenza vaccine. [h=3]Influenza B[/h]
Among the 33 influenza B viruses antigenically characterized this season, all belonged to the B/Victoria lineage, and the majority (79%) showed reduced titer by HI assay to B/Colorado/06/2017 using antiserum raised against cell culture-propagated B/Colorado/06/2017 (Figure 9c).

Sequence analysis showed that 100% (25) of the viruses showing reduced titre had a three amino acid deletion (162-164) in the HA gene. Sequence is pending for one isolate.

The recommended influenza B components for the 2019-20 Northern Hemisphere influenza vaccine are B/Colorado/06/2017 (Victoria lineage) and B/Phuket/3073/2013 (Yamagata lineage). B/Phuket/3073/2013 is included in the quadrivalent influenza vaccine. Figure 9 – Distribution of antigenic phenotypes among characterized influenza viruses, Canada, September 1 to December 12, 2019
fig9-eng.jpg
Figure 9 - Text DescriptionFigure 10 – Distribution of genetic clades among characterized A(H3N2) influenza viruses, Canada, September 1 to December 12, 2019
fig10-eng.jpg
Figure 10 - Text Description[h=2]Antiviral Resistance[/h]
The National Microbiology Laboratory (NML) also tests influenza viruses received from Canadian laboratories for antiviral resistance. [h=3]Oseltamivir:[/h]
123 influenza viruses (63 A(H3N2), 28 A(H1N1) and 32 B) were tested for resistance to oseltamivir:
  • All influenza viruses tested were sensitive to oseltamivir.
[h=3]Zanamivir:[/h]
123 influenza viruses (63 A(H3N2), 28 A(H1N1) and 32 B) were tested for resistance to zanamivir:
  • All influenza viruses tested were sensitive to zanamivir.
[h=3]Amantadine:[/h]
High levels of resistance to amantadine persist among influenza A(H1N1) and influenza A(H3N2) viruses. All viruses tested this season were resistant.

...

https://www.canada.ca/en/public-hea...atch/2019-2020/week-49-december-1-7-2019.html
 
[h=1]FluWatch report: December 8 to 14, 2019 (week 50)[/h]
pub-eng.jpg


Download the alternative format
(PDF format, 776 KB, 11 pages)

Organization: Public Health Agency of Canada

Date published: 2019-12-20[h=3]Related Topics[/h]
[h=2]Overall Summary[/h]
  • Influenza activity continued to increase across multiple indicators, with regions throughout the country reporting increased influenza activity.
  • In week 50, the proportion of influenza B detections has increased resulting in an equal proportion of influenza A and B detections nationally. This level of influenza B activity is higher than average for this time of year and usually not seen until February or March.
  • This season, the majority of hospitalizations reported by participating provinces and territories have been associated with influenza A(H3N2). Among sentinel pediatric hospitalizations with influenza, approximately 55% of cases were associated with influenza B.
  • This is the last FluWatch report of the 2019 calendar year. The next FluWatch report will be published on January 10, 2020 and will include data for weeks 51-01. However, the Respiratory Virus Detection Report will be available on January 3, 2020 for weeks 51-52.
[h=2]On this page[/h]
[h=2]Influenza/Influenza-like Illness (ILI) Activity (geographic spread)[/h]
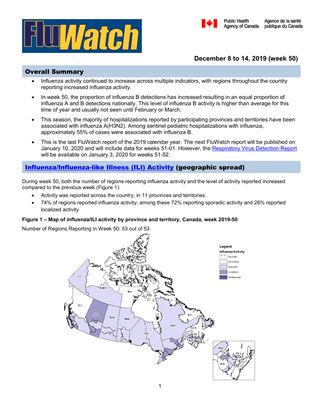
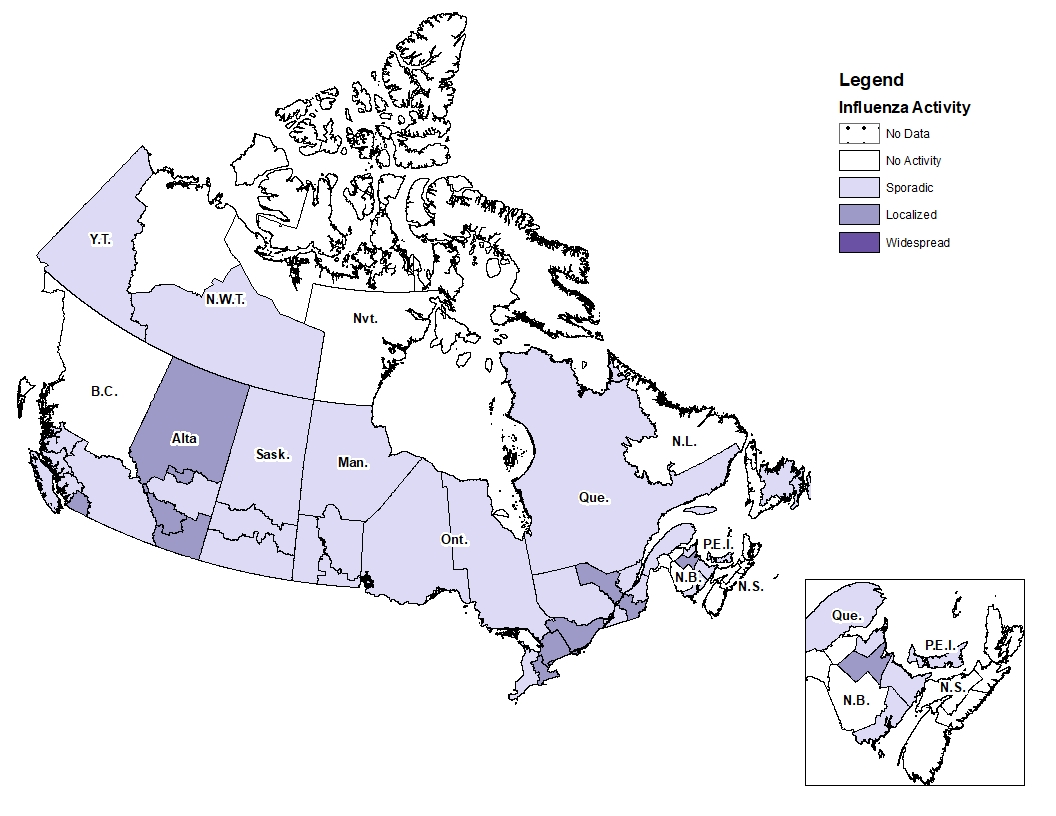
During week 50, both the number of regions reporting influenza activity and the level of activity reported increased compared to the previous week (Figure 1).
  • Activity was reported across the country, in 11 provinces and territories.
  • 74% of regions reported influenza activity; among these 72% reporting sporadic activity and 28% reported localized activity
Figure 1 – Map of influenza/ILI activity by province and territory, Canada, week 2019-50

Number of Regions Reporting in Week 50: 53 out of 53
fig1-eng.jpg
Figure 1 - Text equivalent[h=2]Laboratory-Confirmed Influenza Detections[/h]
In week 50, the number of detections of influenza continued to increase, with an equal proportion of influenza A and B detections. The following results were reported from sentinel laboratories across Canada (Figures 2 and 3):
  • The percentage of tests positive for influenza was 15.6%. This is similar to the average (15.3%) for week 50 over the past five seasons.
  • A total of 1,272 laboratory detections of influenza were reported, of which 50.2% (638) were influenza A. The proportion of detections that are influenza B has been increasing since week 44 (October 27 to November 2), to 49.8% in week 50.
  • The percentage of tests positive for influenza B (7.8%) is higher than the average (1.5%) for this time of year. The current level of influenza B activity is not normally seen until February or March.
  • Among subtyped influenza A detections, a mix of A(H1N1) and A(H3N2) were detected; 60% (87 out of 145) were influenza A(H3N2).
To date this season (weeks 35 to 50), 3,762 laboratory detections of influenza were reported:
  • 61% (2,291) were influenza A. The percentage of tests positive for influenza B to date this season is following a similar trend to the 2017-18 season, when influenza A and B circulated in almost equal proportions.
  • Among subtyped influenza A detections (790), 68% were influenza A(H3N2).
Detailed information on age and type/subtype has been received for 3,241 laboratory-confirmed influenza cases (Table 1). To date this season (weeks 35 to 50):
  • Among cases of influenza A(H3N2) (397), the largest proportion were in adults 65 years of age and older (45%).
  • Cases of influenza B (1,357) were primarily in younger age groups; 63% of cases were under 20 years of age and 30% between 20 and 44 years of age.
  • Among cases of influenza A(H1N1) (215), 35% of cases were in adults between 45 and 64 years of age, and 23% between 20 and 44 years of age.
For more detailed weekly and cumulative influenza data, see the text descriptions for Figures 2 and 3 or the Respiratory Virus Detections in Canada Report. Figure 2 - Number of positive influenza tests and percentage of tests positive, by type, subtype and report week, Canada, weeks 2019-35 to 2019-50

Number of Laboratories Reporting in Week 50: 34 out of 36
fig2-eng.jpg


The shaded area indicates weeks where the positivity rate was at least 5% and a minimum of 15 positive tests were observed, signalling the period of seasonal influenza activity. Figure 2 - Text equivalentFigure 3 – Distribution of positive influenza specimens by type/subtype and province/territory[SUP]Footnote*[/SUP], Canada, weeks 2019-35 to 2019-50
fig3-eng.jpg

Footnote * Specimens from NWT, YT, and Nvt are sent to reference laboratories in other provinces.

Return to footnote*referrer Figure 3 - Text equivalent
0-4265405916622248715%
5-19226116415163285826%
20-44344497422140274623%
45-6437676822184842413%
65+673392254095372622%
Total1884215504116513573241100%

Table 1 - Cumulative numbers of positive influenza specimens by type, subtype and age group reported through case-based laboratory reporting, Canada, weeks 2019-35 to 2019-50
Age groups
(years) Cumulative (August 25, 2019 to December 14, 2019)
Influenza A B Influenza A and B
A Total A(H1N1) A(H3N2) A (Un subtyped)1 Total # %
[TD="colspan: 8"] Table 1 Footnote 1 Unsubtyped: The specimen was typed as influenza A, but no result for subtyping was available.

Table 1 Return to footnote1referrer [/TD]
[h=2]Syndromic / Influenza-like Illness Surveillance[/h] [h=3]Healthcare Professionals Sentinel Syndromic Surveillance[/h]
In week 50, 1.8% of visits to healthcare professionals were due to influenza-like illness (ILI) which is slightly above the average for this time of year (1.5%) (Figure 4). Figure 4 – Percentage of visits for ILI reported by sentinels by report week, Canada, weeks 2019-35 to 2019-50
Number of participants reporting in week 50: 83

fig4-eng.jpg


The shaded area represents the maximum and minimum percentage of visits for ILI reported by week from seasons 2014-2015 to 2018-2019 Figure 4 - Text equivalent[h=2]FluWatchers[/h]
In week 50, 3,088 participants reported to FluWatchers, of which 2.1% (65) reported symptoms of cough and fever (Figure 5).

Among the 65 participants who reported cough and fever:
  • 28% consulted a healthcare professional;
  • 71% reported days missed from work or school, resulting in a combined total of 108 missed days of work or school.
  • 70% reported having been vaccinated for influenza this season.
If you are interested in becoming a FluWatcher, sign up today. Figure 5 - Percentage of participants reporting fever and cough, Canada, weeks 2019-40 to 2019-50
Number of Participants Reporting in Week 50: 3,088

fig5-eng.jpg
Figure 5 - Text equivalent
Online Figure – Geographic distribution of FluWatchers participants reporting cough and fever, Canada, week 2019-50

Click on the map to access the link

map
[h=2]Influenza Outbreak Surveillance[/h]
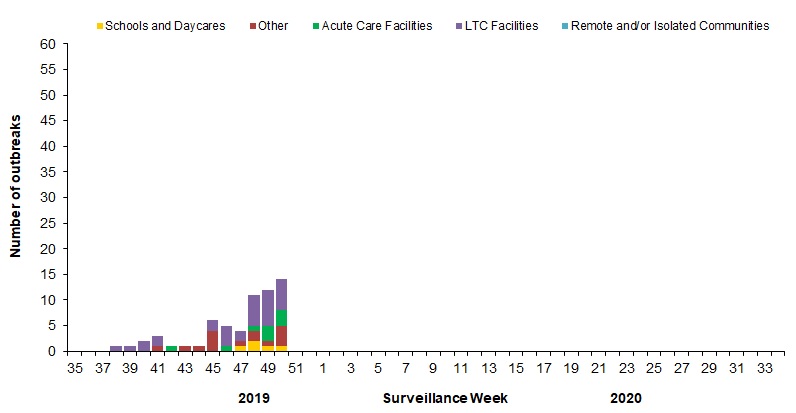
In week 50, 14 new laboratory-confirmed outbreaks were reported: six in long term care facilities, three in an acute care facility, one in a school/daycare and four in a facility categorized as 'other', which includes facilities such as private personal care homes, correctional facilities, and colleges/universities (Figure 6). One new ILI outbreak in a school was reported.

To date this season, a total of 62 laboratory-confirmed influenza outbreaks have been reported; 33 in long-term care facilities, five in schools/daycares, nine in acute care facilities and 15 in facilities categorized as 'other'. Of the outbreaks where influenza type was reported (58), 85% (49) were due to influenza A. Among the 26 outbreaks for which the influenza A subtype was reported, 25 were associated with A(H3N2) and one was associated with A(H1N1). Four ILI outbreaks in schools/daycares have also been reported. Figure 6 – Number of new outbreaks of laboratory-confirmed influenza by report week, Canada, weeks 2019-35 to 2019-50
Number of provinces and territories reporting in week 50: 13 out of 13

fig6-eng.jpg
Figure 6 - Text equivalent[h=2]Severe Outcomes Influenza Surveillance[/h]
Provincial/Territorial Influenza Hospitalizations and Deaths

To date this season, 274 influenza-associated hospitalizations were reported by participating provinces and territories[SUP]Footnote1[/SUP].
  • 69% of the cases were influenza A.
  • Of the cases for which subtype was reported (164), 76% were associated with influenza A(H3N2).
  • The greatest proportion of hospitalizations (40%) were among adults ≥ 65 years of age.
Thirty-one ICU admissions and three deaths have been reported.

Number of provinces and territories reporting in week 50: 9 out of 9 Footnote 1 Influenza-associated hospitalizations are reported by N.L., P.E.I. N.S., N.B., Man., Alb., Y.T. and N.W.T. Only hospitalizations that require intensive medical care are reported by Sask. The cumulative rate of hospitalizations is calculated using the population by age-group in participating provinces and territories.

Footnote1referrer [h=3]Pediatric Influenza Hospitalizations and Deaths[/h]
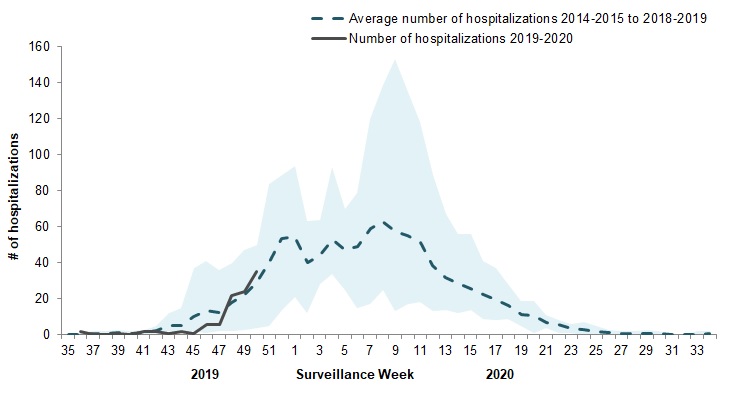
In week 50, 35 pediatric (≤16 years of age) laboratory-confirmed influenza-associated hospitalizations were reported by the Immunization Monitoring Program Active (IMPACT) network (Figure 7). This is slightly above the average (29) for week 50 over the previous five seasons.

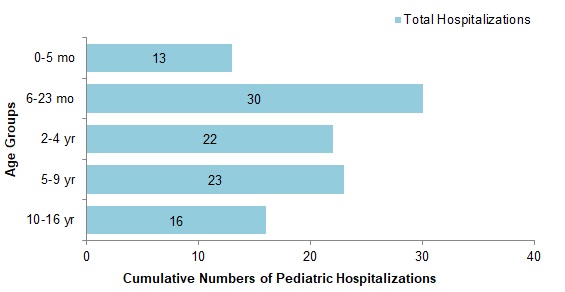
To date this season, 104 pediatric hospitalizations have been reported by the IMPACT network; 55% (57) of cases were associated with influenza B and 45 % (47) with influenza A. The largest proportion of hospitalizations (63%) were among children under 5 years of age (Figure 8). Figure 7 – Number of pediatric (≤16 years of age) hospitalizations reported by the IMPACT network, by week, Canada, weeks 2019-35 to 2019-50
fig7-eng.jpg


The shaded area represents the maximum and minimum number of cases reported by week from seasons 2014-15 to 2018-19 Figure 7 - Text equivalentFigure 8 – Cumulative number of pediatric hospitalizations (≤16 years of age) with influenza by age-group reported by the IMPACT network, Canada, weeks 2019-35 to 2019-50
fig8-eng.jpg
Figure 8 - Text equivalent[h=3]Adult Influenza Hospitalizations and Deaths[/h]
Surveillance of laboratory-confirmed influenza-associated adult (≥16 years of age) hospitalizations by the Canadian Immunization Research Network (CIRN) Serious Outcomes Surveillance (SOS) network began on November 1st for the 2019-20 season. To date this season, 38 hospitalizations and less than 5 intensive care unit admissions and deaths have been reported. The majority of hospitalizations have been due to influenza A (80%) and in adults 65 years of age and older (61%). [h=2]Influenza Strain Characterizations[/h]
From September 1 to December 19, 2019, the National Microbiology Laboratory (NML) has characterized 159 influenza viruses (78 A(H3N2), 45 A(H1N1) and 36 influenza B) that were received from Canadian laboratories. [h=3]Influenza A(H3N2)[/h]
Over recent years, circulating strains of A(H3N2) have evolved, and are increasingly difficult to characterize by hemagglutination inhibition (HI) assay. Genetic characterization is established by sequencing the hemagglutinin (HA) gene of the influenza viruses to compare their genetic properties. [h=3]Antigenic Characterization:[/h]
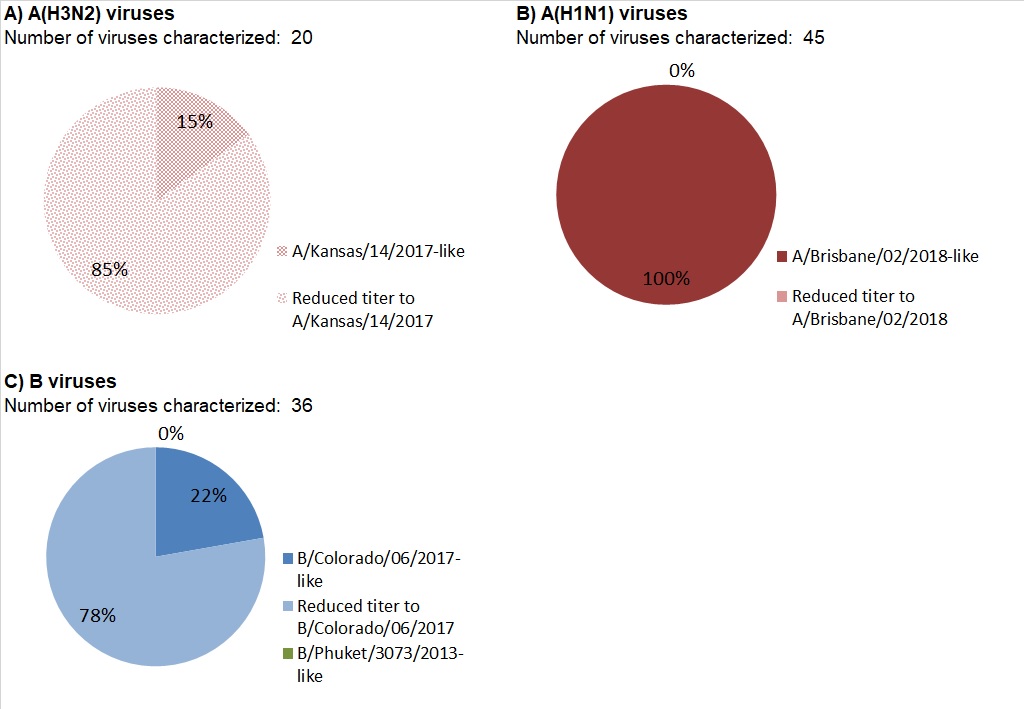
Among the 20 influenza A(H3N2) viruses antigenically characterized to date, the majority (85%) showed reduced titer by HI assay to A Kansas/14/2017 using antiserum raised against egg-propagated A Kansas/14/2017 (Figure 9a). [h=3]Genetic Characterization:[/h]
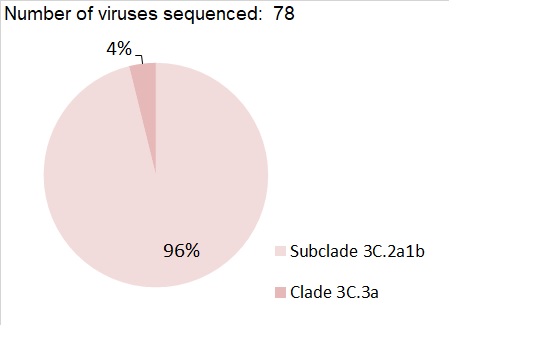
Nearly all (96%) of the 78 A(H3N2) viruses genetically characterized this season belonged to genetic group 3C.2a1b based on sequence analysis of the HA gene. Three viruses belonged to the genetic group 3C.3a (Figure 10).

Group 3C.2a1b viruses analysed represent:
  • 85% (17 out of 20) viruses that were also antigenically characterized.
  • 100% (58 out of 58) viruses which did not grow to sufficient hemagglutination titer for antigenic characterization by HI assay.
A/Kansas/14/2017 belongs to genetic group 3C.3a and is the influenza A(H3N2) component of the 2019-20 Northern Hemisphere influenza vaccine. [h=3]Influenza A(H1N1)[/h]
Among the 45 A(H1N1) viruses characterized to date, all were antigenically similar to A/Brisbane/02/2018 by HI testing using antiserum raised against egg-propagated A/Brisbane/02/2018 (Figure 9b).

A/Brisbane/02/2018 is the influenza A(H1N1) component of the 2019-20 Northern Hemisphere influenza vaccine. [h=3]Influenza B[/h]
Among the 36 influenza B viruses antigenically characterized this season, all belonged to the B/Victoria lineage, and the majority (78%) showed reduced titer by HI assay to B/Colorado/06/2017 using antiserum raised against cell culture-propagated B/Colorado/06/2017 (Figure 9c).

Sequence analysis showed that 96% (27) of the viruses showing reduced titre had a three amino acid deletion (162-164) in the HA gene. Sequence is pending for one isolate.

The recommended influenza B components for the 2019-20 Northern Hemisphere influenza vaccine are B/Colorado/06/2017 (Victoria lineage) and B/Phuket/3073/2013 (Yamagata lineage). B/Phuket/3073/2013 is included in the quadrivalent influenza vaccine. Figure 9 – Distribution of antigenic phenotypes among characterized influenza viruses, Canada, September 1 to December 19, 2019
fig9-eng.jpg
Figure 9 - Text DescriptionFigure 10 – Distribution of genetic clades among characterized A(H3N2) influenza viruses, Canada, September 1 to December 19, 2019
fig10-eng.jpg
Figure 10 - Text Description[h=2]Antiviral Resistance[/h]
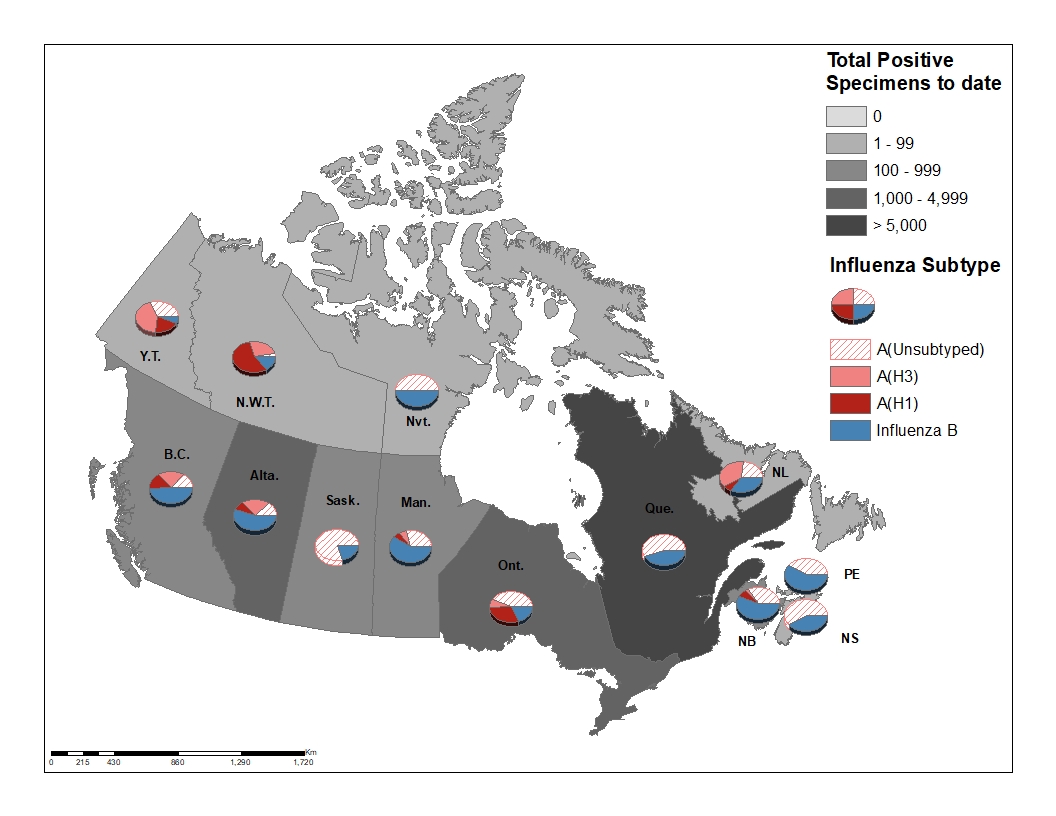
The National Microbiology Laboratory (NML) also tests influenza viruses received from Canadian laboratories for antiviral resistance. [h=3]Oseltamivir:[/h]
157 influenza viruses (74 A(H3N2), 44 A(H1N1) and 39 B) were tested for resistance to oseltamivir:
  • All influenza viruses tested were sensitive to oseltamivir.
[h=3]Zanamivir:[/h]
158 influenza viruses (75 A(H3N2), 44 A(H1N1) and 39 B) were tested for resistance to zanamivir:
  • All influenza viruses tested were sensitive to zanamivir.
[h=3]Amantadine:[/h]
High levels of resistance to amantadine persist among influenza A(H1N1) and influenza A(H3N2) viruses. All viruses tested this season were resistant.
...

https://www.canada.ca/en/public-hea...tch/2019-2020/week-50-december-8-14-2019.html
 
[h=1]FluWatch report: December 15, 2019 to January 4, 2020 (weeks 51 to 1)[/h]
pub-eng.jpg


Download the alternative format
(PDF format, 776 KB, 11 pages)

Organization: Public Health Agency of Canada

Date published: 2020-01-10[h=3]Related Topics[/h]
[h=2]Overall Summary[/h]
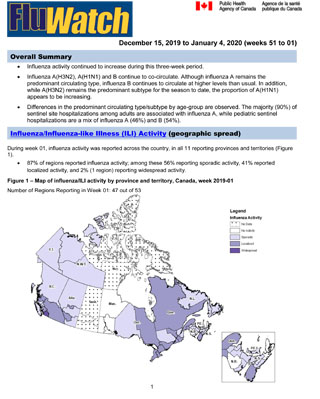
  • Influenza activity continued to increase during this three-week period.
  • Influenza A(H3N2), A(H1N1) and B continue to co-circulate. Although influenza A remains the predominant circulating type, influenza B continues to circulate at higher levels than usual. In addition, while A(H3N2) remains the predominant subtype for the season to date, the proportion of A(H1N1) appears to be increasing.
  • Differences in the predominant circulating type/subtype by age-group are observed. The majority (90%) of sentinel site hospitalizations among adults are associated with influenza A, while pediatric sentinel hospitalizations are a mix of influenza A (46%) and B (54%).
[h=2]On this page[/h]
[h=2]Influenza/Influenza-like Illness (ILI) Activity (geographic spread)[/h]
During week 01 influenza activity was reported in 11 provinces and territories (Figure 1).
  • 87% of regions reported influenza activity; among these 56% reported sporadic activity, 41% reported localized activity, and 2% (1 region) reported widespread activity.
Figure 1 – Map of influenza/ILI activity by province and territory, Canada, week 2020-01

Number of Regions Reporting in Week 01: 47 out of 53
fig1-eng.jpg
Figure 1 - Text equivalent[h=2]Laboratory-Confirmed Influenza Detections[/h]
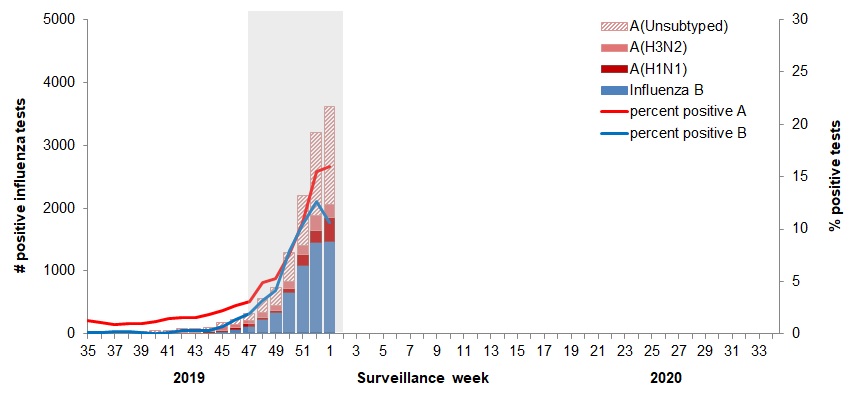
The percentage of laboratory tests positive for influenza increased in weeks 51 and 52, and decreased slightly in week 01. The proportion of influenza A detections increased over these three weeks, a change to the trend observed in weeks 44 through 50 when the proportion of detections of influenza B was increasing. The proportion of A(H1N1) among subtyped influenza A detections increased during this three-week period.

The following results were reported from sentinel laboratories across Canada (Figures 2 and 3):
  • The percentage of tests positive for influenza increased from 21% in week 51 to 28% in week 52, then decreased slightly to 27% in week 01 . This is higher than the average (23%) for week 01 over the past five seasons.
  • A total of 9,119 laboratory detections of influenza were reported during this three-week period, of which 56% (5,104) were influenza A. The proportion of detections that were influenza A decreased from 85% in week 44 to 50% in week 50, then increased in recent weeks to 60% in week 01.
  • The percentage of tests positive for influenza B (10.6% in week 01) continues to be almost 5 times greater than the average (2.6%) for this time of year.
  • Among subtyped influenza A detections, a mix of A(H1N1) and A(H3N2) continued to be detected over this three-week period. The proportion of A(H1N1) increased from 53% in week 51 to 66% in week 01.
To date this season (weeks 35 to 01), 12,547 laboratory detections of influenza were reported:
  • 57% (7,184) were influenza A. The percentage of tests positive for influenza B to date this season continues to follow a similar trend to the 2017-18 season, when influenza A and B circulated in almost equal proportions.
  • Among subtyped influenza A detections (2,159), a slight majority (53%) have been influenza A(H3N2).
Detailed information on age and type/subtype has been received for 10,404 laboratory-confirmed influenza cases (Table 1). To date this season (weeks 35 to 01):
  • Among cases of influenza A(H3N2) (1,083), the largest proportion were in adults 65 years of age and older (46%).
  • Cases of influenza B (4,397) were primarily in younger age groups; 59% of cases were under 20 years of age and 30% between 20 and 44 years of age.
  • Among cases of influenza A(H1N1) (800), nearly equal proportions of cases were in adults 20-44 years, 45-64 years, and 65 years of age and older (approximately 28% of cases were in each age-group) .
For more detailed weekly and cumulative influenza data, see the text descriptions for Figures 2 and 3 or the Respiratory Virus Detections in Canada Report. Figure 2 - Number of positive influenza tests and percentage of tests positive, by type, subtype and report week, Canada, weeks 2019-35 to 2020-01

Number of Laboratories Reporting in Week 01: 35 out of 36
fig2-eng.jpg


The shaded area indicates weeks where the positivity rate was at least 5% and a minimum of 15 positive tests were observed, signalling the period of seasonal influenza activity. Figure 2 - Text equivalentFigure 3 – Distribution of positive influenza specimens by type/subtype and province/territory[SUP]Footnote*[/SUP], Canada, weeks 2019-35 to 2020-01
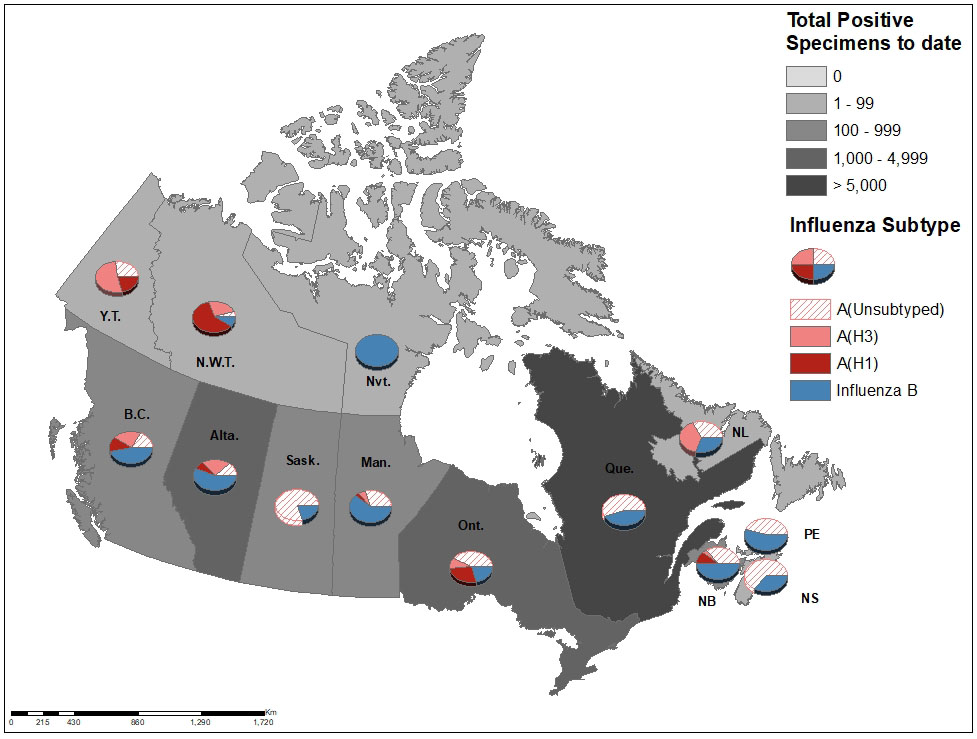
fig3-eng.jpg

Footnote * Specimens from NWT, YT, and Nvt are sent to reference laboratories in other provinces.

Return to footnote*referrer Figure 3 - Text equivalent
0-477384112577836160915%
5-19595491334131742233722%
20-4411052221727111332243723%
45-641201213170818209141014%
65+23332324961605278261125%
Total600780010834124439710404100%

Table 1 - Cumulative numbers of positive influenza specimens by type, subtype and age group reported through case-based laboratory reporting, Canada, weeks 2019-35 to 2020-01
Age groups
(years) Cumulative (August 25, 2019 to January 4, 2020)
Influenza A B Influenza A and B
A Total A(H1N1) A(H3N2) A (Un subtyped)[SUP] Table 1 Footnote1 [/SUP] Total # %
[TD="colspan: 8"] Table 1 Footnote 1 Unsubtyped: The specimen was typed as influenza A, but no result for subtyping was available.

Table 1 Return to footnote1referrer [/TD]
[h=2]Syndromic / Influenza-like Illness Surveillance[/h] [h=3]Healthcare Professionals Sentinel Syndromic Surveillance[/h]
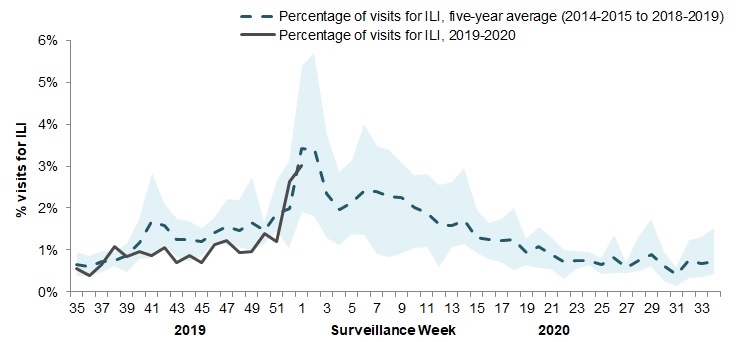
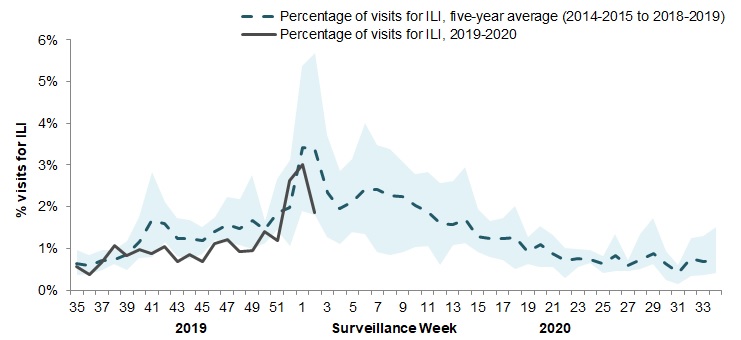
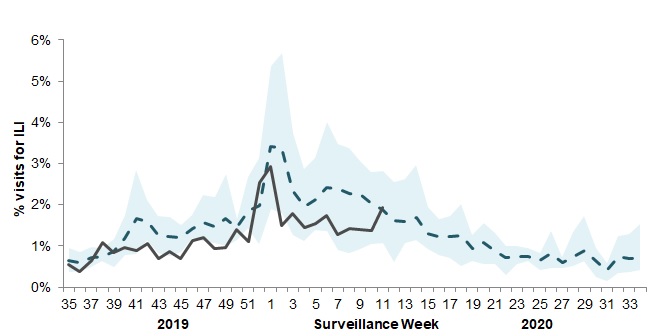
Over the three-week period of weeks 51, 52, and 01, the percentage of visits to healthcare professionals due to influenza-like illness (ILI) continued to increase to 3.0% in week 01 which is slightly below the average for this time of year (3.4%) (Figure 4). Figure 4 – Percentage of visits for ILI reported by sentinels by report week, Canada, weeks 2019-35 to 2020-01
Number of participants reporting in week 01: 75

fig4-eng.jpg


The shaded area represents the maximum and minimum percentage of visits for ILI reported by week from seasons 2014-2015 to 2018-2019 Figure 4 - Text equivalent[h=2]FluWatchers[/h]
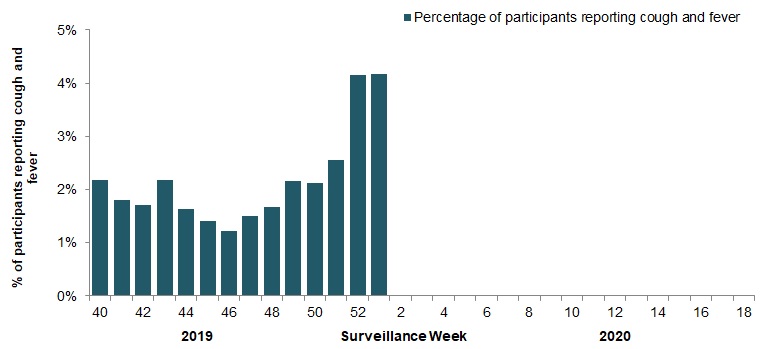
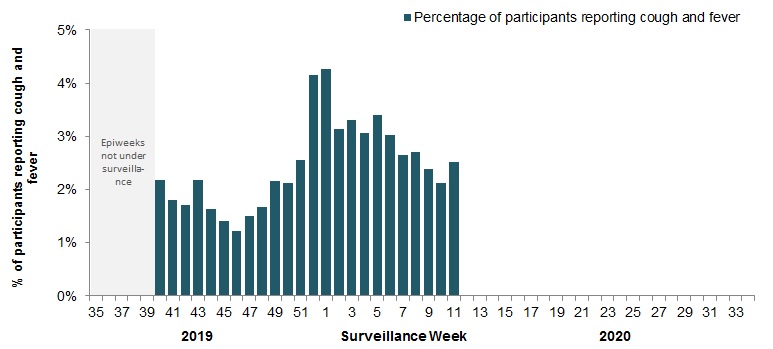
The proportion of FluWatchers participants reporting symptoms of cough and fever increased from weeks 51 to 52 and was similar in week 01. In week 01, 3, 231 participants reported to FluWatchers, of which 4.2% (135) reported symptoms of cough and fever (Figure 5).

Among the 135 participants who reported cough and fever:
  • 19% consulted a healthcare professional;
  • 75% reported days missed from work or school, resulting in a combined total of 333 missed days of work or school.
  • 71% reported having been vaccinated for influenza this season.
If you are interested in becoming a FluWatcher, sign up today. Figure 5 - Percentage of participants reporting fever and cough, Canada, weeks 2019-40 to 2020-01
Number of Participants Reporting in Week 01: 3,231

fig5-eng.jpg
Figure 5 - Text equivalent
Online Figure – Geographic distribution of FluWatchers participants reporting cough and fever, Canada, week 2020-01

Click on the map to access the link

map
[h=2]Influenza Outbreak Surveillance[/h]
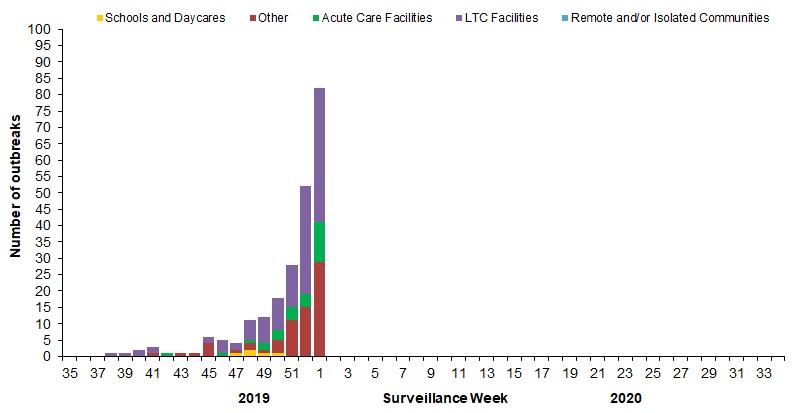
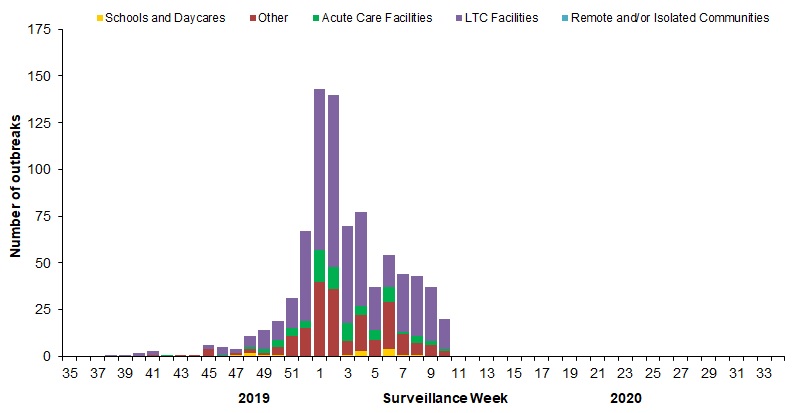
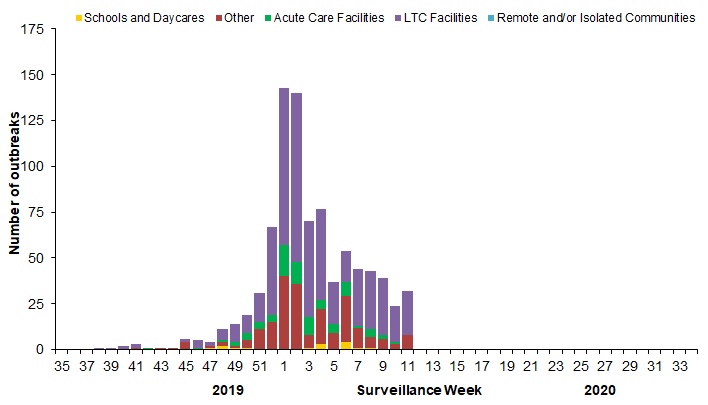
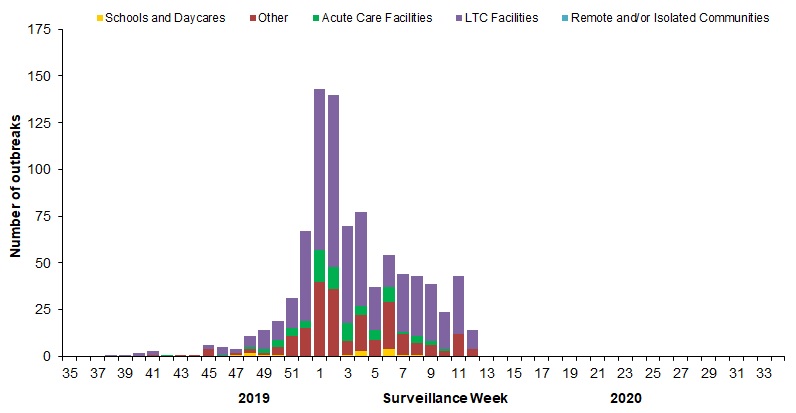
Over the three-week period of weeks 51, 52, and 01, the number of new laboratory-confirmed influenza outbreaks continued to increase. A total of 162 outbreaks were reported: 87 in long term care facilities, 20 in acute care facilities, and 55 in facilities categorized as 'other', which includes facilities such as private personal care homes, correctional facilities, and colleges/universities (Figure 6).

To date this season, a total of 228 laboratory-confirmed influenza outbreaks have been reported; 55% (125) in long-term care facilities, 31% (70) in facilities categorized as 'other', 12% (28) in acute care facilities, and 2% (5) in schools/daycares. Of the outbreaks where influenza type was reported (217), 91% (198) were due to influenza A. Among the 101 outbreaks for which the influenza A subtype was reported, 75% (76) were associated with A(H3N2). Four ILI outbreaks in schools/daycares have also been reported. Figure 6 – Number of new outbreaks of laboratory-confirmed influenza by report week, Canada, weeks 2019-35 to 2020-01
Number of provinces and territories reporting in week 01: 11 out of 13

fig6-eng.jpg
Figure 6 - Text equivalent[h=2]Severe Outcomes Influenza Surveillance[/h]
Provincial/Territorial Influenza Hospitalizations and Deaths

To date this season, 560 influenza-associated hospitalizations were reported by participating provinces and territories[SUP]Footnote†[/SUP].
  • 69% of the cases were associated with influenza A.
  • Of the cases for which subtype was reported (333), 80% were associated with influenza A(H3N2).
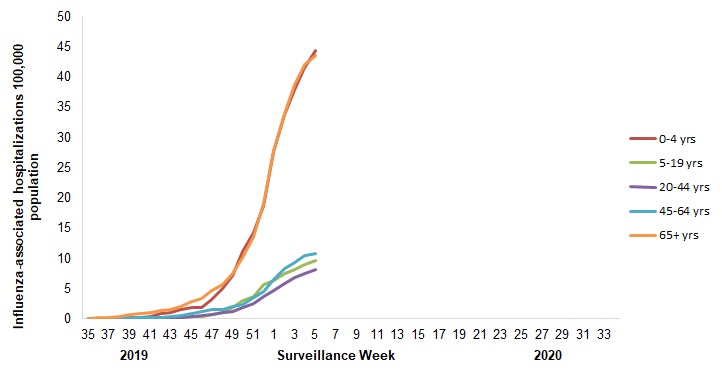
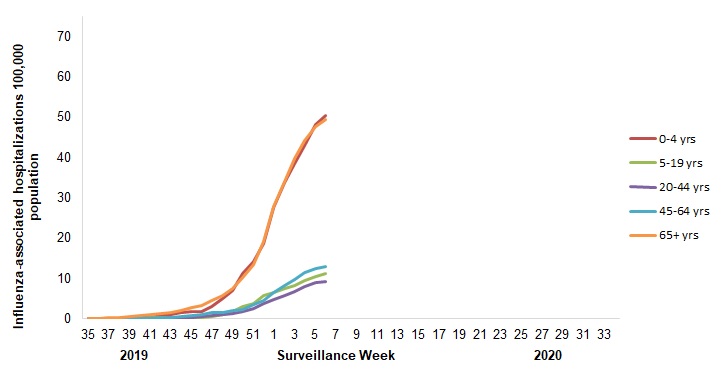
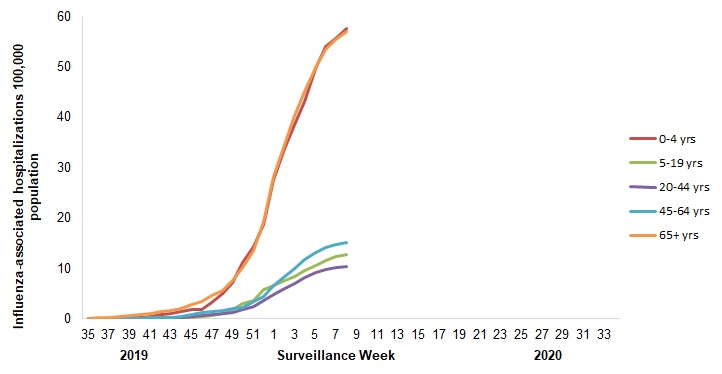
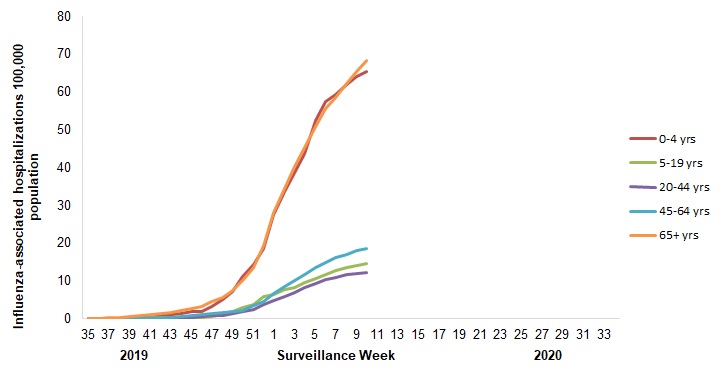
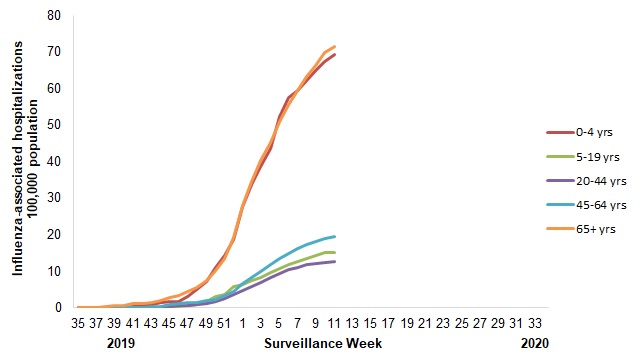
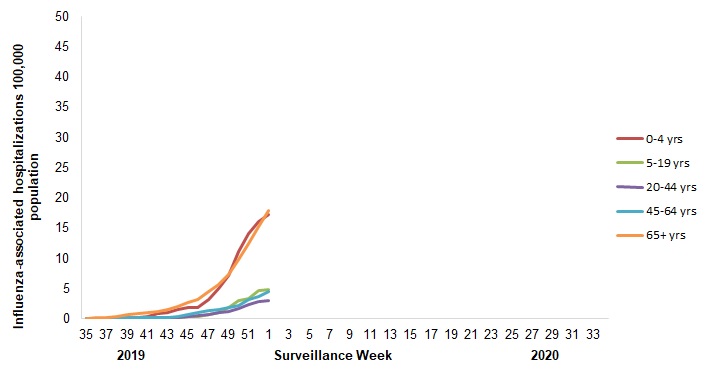
  • The highest cumulative hospitalization rates up to week 01 were among children under 5 years of age (17.2/100,000 population) and adults 65 years of age and older (17.8/100,000 population).
Sixty ICU admissions and ten deaths have been reported.
  • 62% of the ICU admissions and 80% of the deaths were associated with influenza A.
Footnote † Influenza-associated hospitalizations are reported by N.L., P.E.I. N.S., N.B., Man., Alb., Y.T. and N.W.T. Only hospitalizations that require intensive medical care are reported by Sask. The cumulative rate of hospitalizations is calculated using the population by age-group in participating provinces and territories.

Footnote†referrer Figure 7 – Cumulative rates of influenza-associated hospitalizations by age-group and surveillance week, Canada, participating provinces and territories[SUP]Footnote‡[/SUP] weeks 2019-35 to 2020-01
Number of provinces and territories reporting in week 01: 9 out of 9

fig7-eng.jpg
Footnote ‡ Influenza-associated hospitalizations are reported by N.L., P.E.I, N.S., N.B., Man., Alb., Y.T. and N.W.T. Only hospitalizations that require intensive medical care are reported by Sask. The cumulative rate of hospitalizations is calculated using the population by age-group in participating provinces and territories.

Return to footnote‡referrer Figure 7 - Text equivalent[h=3]Pediatric Influenza Hospitalizations and Deaths[/h]
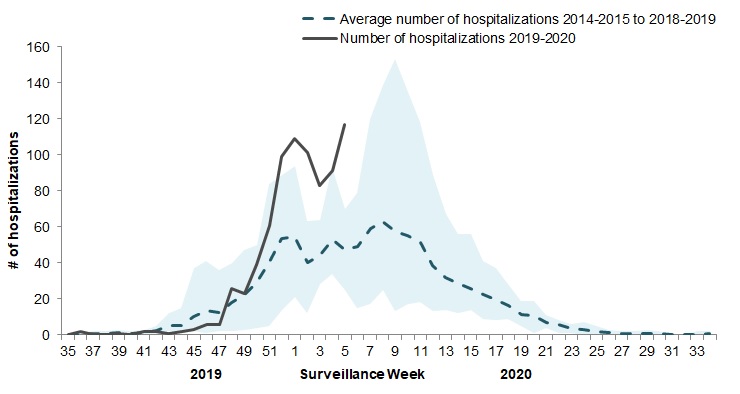
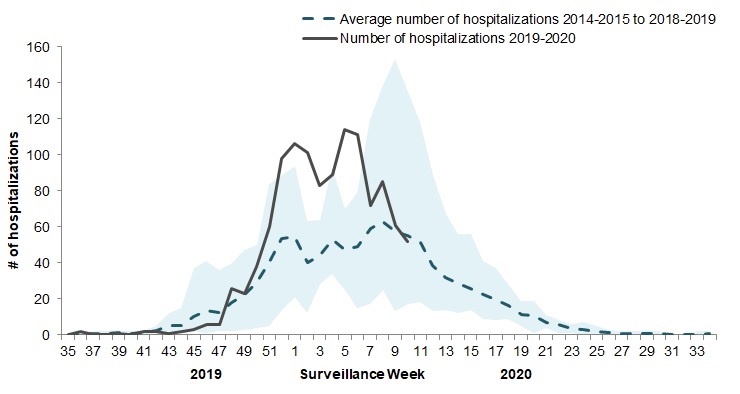
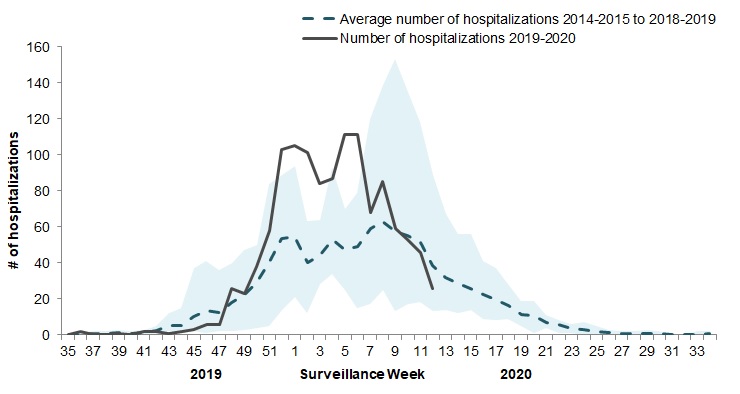
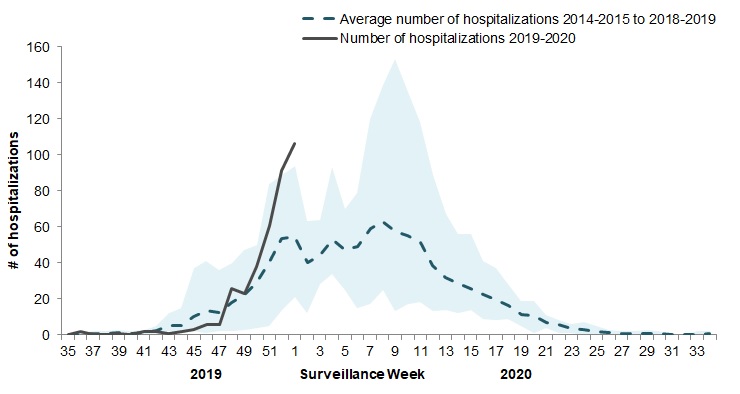
Over the three-week period of weeks 51, 52 and 01, 258 pediatric (≤16 years of age) laboratory-confirmed influenza-associated hospitalizations were reported by the Immunization Monitoring Program Active (IMPACT) network (Figure 8). The weekly number of cases in this period is above the average over the previous five seasons, and above the 5-year maximum in week 52 and week 01.

The sharp increase in the number of cases in recent weeks is likely due to the concurrent circulation of influenza A and B this season. The number of influenza A-associated pediatric hospitalizations is similar to the average for this time of year. Influenza B usually circulates later in the season, in February or March. However, this season, the number of hospitalizations with influenza B is well above average compared to previous seasons, and occurring earlier in the season.

To date this season (weeks 35 to 01) :
  • 370 pediatric hospitalizations have been reported by the IMPACT network, of which 54% (201) were associated with influenza B and 46% (169) with influenza A.
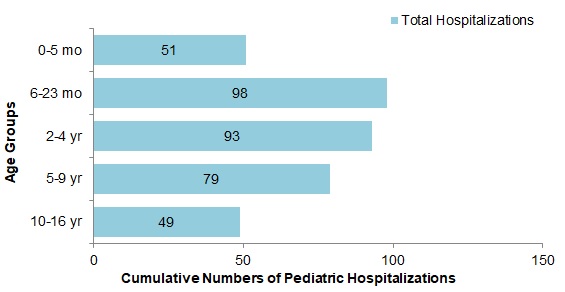
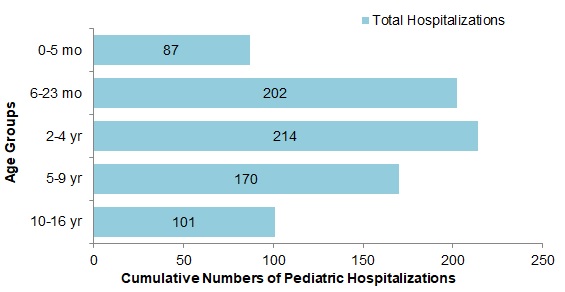
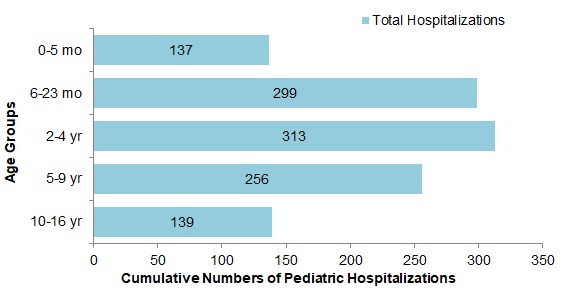
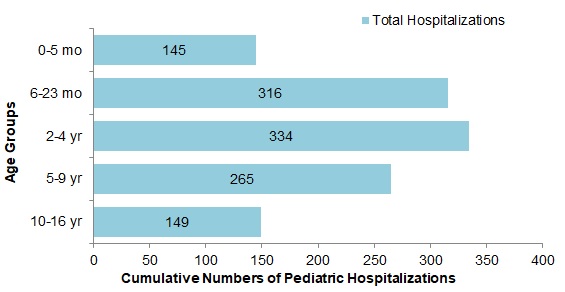
  • The largest proportion of hospitalizations (65%) were among children under 5 years of age (Figure 9). Among cases in children under 5 years of age (242), 53% of cases were associated with influenza A, compared to cases in children 5 to 16 years of age (128), in whom 68% of cases were associated with influenza B.
  • 39 ICU admissions were reported, of which 59% (23) were associated with influenza A.
  • No pediatric deaths have been reported.
Figure 8 – Number of pediatric (≤16 years of age) hospitalizations reported by the IMPACT network, by week, Canada, weeks 2019-35 to 2020-01
fig8-eng.jpg


The shaded area represents the maximum and minimum number of cases reported by week from seasons 2014-15 to 2018-19 Figure 8 - Text equivalentFigure 9 - Cumulative number of pediatric hospitalizations (≤16 years of age) with influenza by age-group reported by the IMPACT network, Canada, weeks 2019-35 to 2020-01
fig9-eng.jpg
Figure 9 - Text Description[h=3]Adult Influenza Hospitalizations and Deaths[/h]
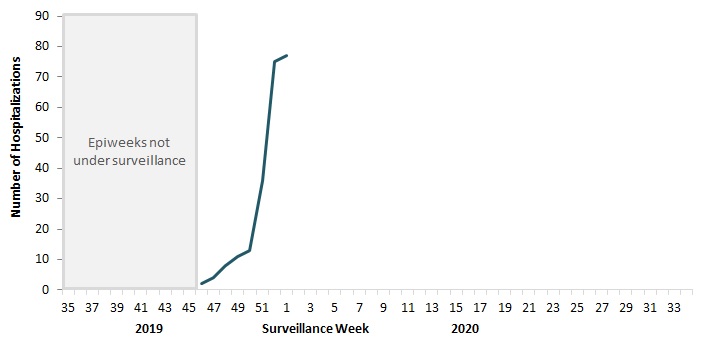
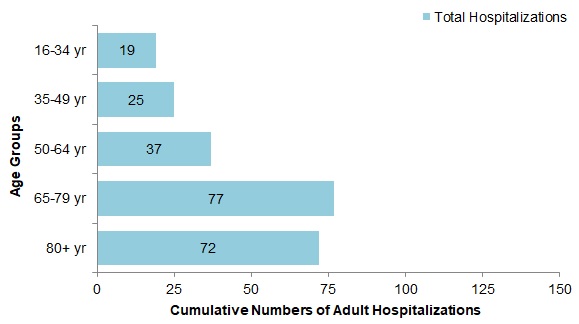
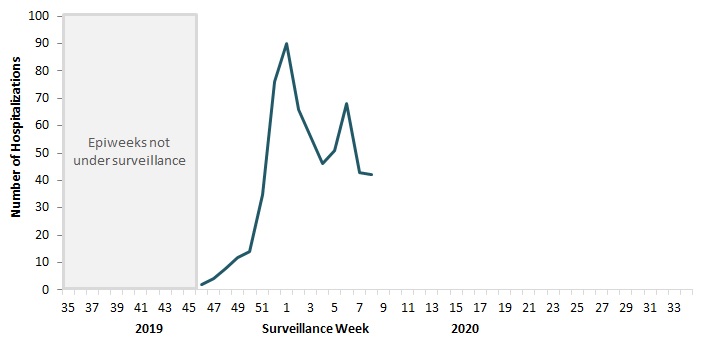
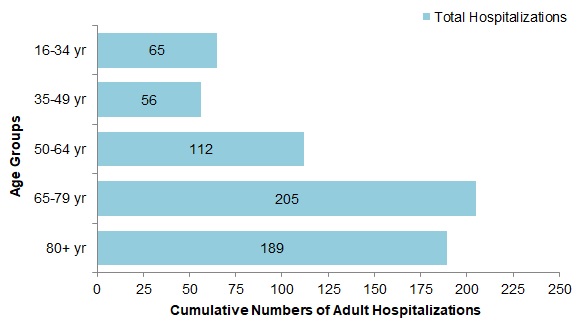
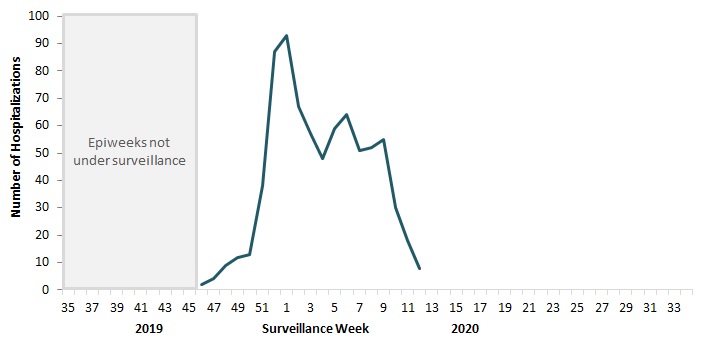
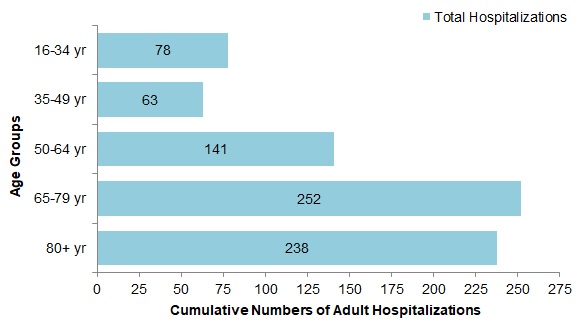
Surveillance of laboratory-confirmed influenza-associated adult (≥16 years of age) hospitalizations by the Canadian Immunization Research Network (CIRN) Serious Outcomes Surveillance (SOS) network began on November 1st for the 2019-20 season. To date this season, 230 hospitalizations, seven intensive care unit admissions, and less than five deaths have been reported (Figure 10). The majority of hospitalizations have been due to influenza A (90%), and among those subtyped (68) 87% were influenza A(H1N1). The largest proportion of hospitalizations are in adults 65-79 years of age (33%) and adults 80 years of age and older (31%) (Figure 11). Figure 10 - Number of adult hospitalizations (≥16 years of age) with influenza reported by the CIRN-SOS network, by week, Canada, weeks 2019-35 to 2020-01
fig10-eng.jpg
Figure 10 - Text DescriptionFigure 11 - Cumulative numbers of adult hospitalizations (≥16 years of age) with influenza, by age-group, reported by the CIRN-SOS network, Canada, 2019-2020
fig11-eng.jpg
Figure 11 - Text Description[h=2]Influenza Strain Characterizations[/h]
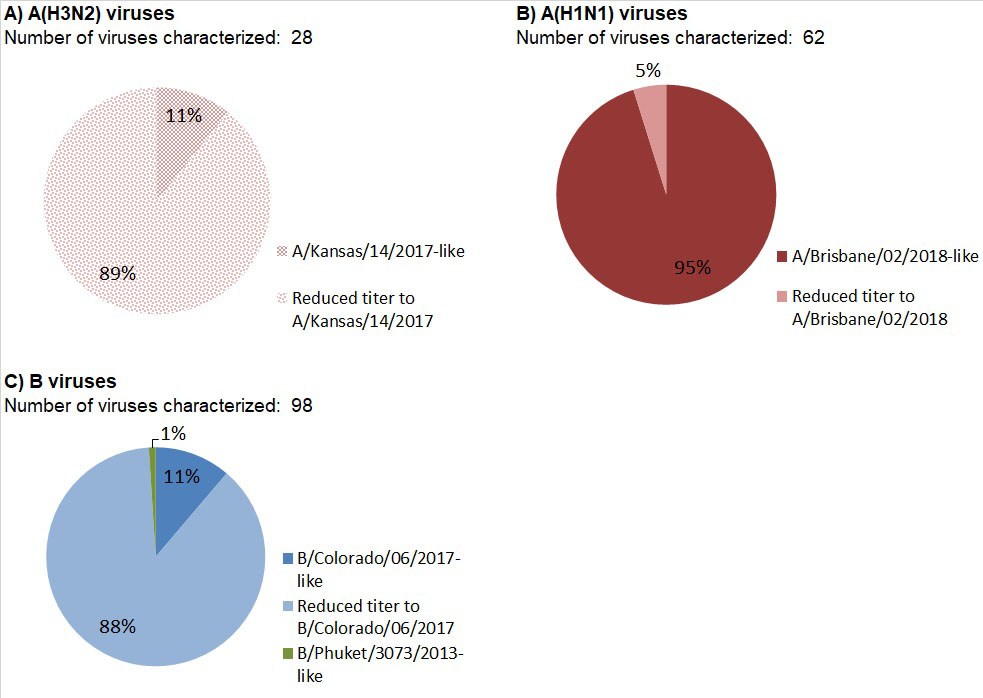
From September 1, 2019 to January 9, 2020, the National Microbiology Laboratory (NML) has characterized 287 influenza viruses (127 A(H3N2), 62 A(H1N1) and 98 influenza B) that were received from Canadian laboratories. [h=3]Influenza A(H3N2)[/h]
Over recent years, circulating strains of A(H3N2) have evolved, and are increasingly difficult to characterize by hemagglutination inhibition (HI) assay. Genetic characterization is established by sequencing the hemagglutinin (HA) gene of the influenza viruses to compare their genetic properties. [h=3]Antigenic Characterization:[/h]
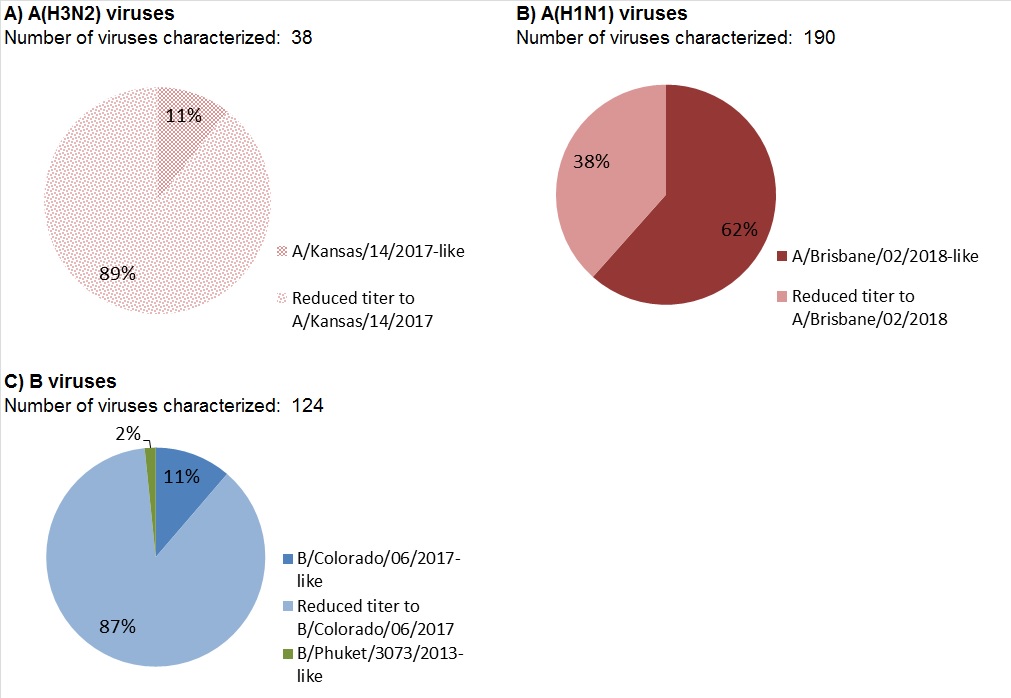
Among the 28 influenza A(H3N2) viruses antigenically characterized to date, the majority (89%) showed reduced titer by HI assay to A Kansas/14/2017 using antiserum raised against egg-propagated A Kansas/14/2017. Three viruses were characterized as A Kansas/14/2017-like (Figure 12 a). [h=3]Genetic Characterization:[/h]
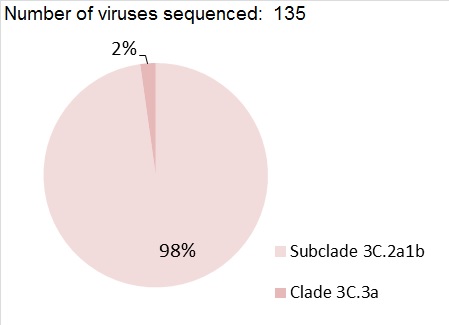
Nearly all (98%) of the 127 A(H3N2) viruses genetically characterized this season belonged to genetic group 3C.2a1b based on sequence analysis of the HA gene. Three viruses belonged to the genetic group 3C.3a (Figure 13).

Group 3C.2a1b viruses analysed represent:
  • 89% (25 out of 28) viruses that were also antigenically characterized.
  • 100% (99 out of 99) viruses which did not grow to sufficient hemagglutination titer for antigenic characterization by HI assay.
A/Kansas/14/2017 belongs to genetic group 3C.3a and is the influenza A(H3N2) component of the 2019-20 Northern Hemisphere influenza vaccine. [h=3]Influenza A(H1N1)[/h]
Among the 62 A(H1N1) viruses characterized to date, 95% were antigenically similar to A/Brisbane/02/2018 by HI testing using antiserum raised against egg-propagated A/Brisbane/02/2018 (Figure 12 b).

A/Brisbane/02/2018 is the influenza A(H1N1) component of the 2019-20 Northern Hemisphere influenza vaccine. [h=3]Influenza B[/h]
Among the 98 influenza B viruses antigenically characterized this season, the vast majority (97) belonged to the B/Victoria lineage. One virus was antigenically characterized as similar to B/Phuket/3073/2013.

The majority (89%) of B/Victoria lineage viruses showed reduced titer by HI assay to B/Colorado/06/2017 using antiserum raised against cell culture-propagated B/Colorado/06/2017 (Figure 12 c).

Sequence analysis showed that 100% (86) of the B/Victoria lineage viruses showing reduced titre to B/Colorado/06/2017 had a three amino acid deletion (162-164) in the HA gene.

The recommended influenza B components for the 2019-20 Northern Hemisphere influenza vaccine are B/Colorado/06/2017 (Victoria lineage) and B/Phuket/3073/2013 (Yamagata lineage). B/Phuket/3073/2013 is included in the quadrivalent influenza vaccine. Figure 12 – Distribution of antigenic phenotypes among characterized influenza viruses, Canada, September 1, 2019 to January 9, 2020
fig12-eng.jpg
Figure 12 - Text DescriptionFigure 13 – Distribution of genetic clades among characterized A(H3N2) influenza viruses, Canada, September 1, 2019 to January 9, 2020
fig13-eng.jpg
Figure 13 - Text Description[h=2]Antiviral Resistance[/h]
The National Microbiology Laboratory (NML) also tests influenza viruses received from Canadian laboratories for antiviral resistance. From September 1, 2019 to January 9, 2020, the following results were reported: [h=3]Oseltamivir:[/h]
188 influenza viruses (86 A(H3N2), 45 A(H1N1) and 57 B) were tested for resistance to oseltamivir:
  • All influenza viruses tested were sensitive to oseltamivir.
[h=3]Zanamivir:[/h]
187 influenza viruses ( 86 A(H3N2), 45 A(H1N1) and 56 B) were tested for resistance to zanamivir:
  • All influenza viruses tested were sensitive to zanamivir.
[h=3]Amantadine:[/h]
High levels of resistance to amantadine persist among influenza A(H1N1) and influenza A(H3N2) viruses. All viruses tested this season were resistant.


...

https://www.canada.ca/en/public-hea...eks-51-1-december-15-2019-january-4-2020.html
 
[h=1]FluWatch report: January 5 to 11, 2020 (week 02)[/h]
pub-eng.jpg


Download the alternative format
(PDF format, 737 KB, 13 pages)

Organization: Public Health Agency of Canada

Date published: 2020-01-17[h=3]Related Topics[/h]
[h=2]Overall Summary[/h]
  • Influenza activity decreased across multiple indicators this week. This suggests that Canada may have reached peak influenza activity at the national level. Elevated activity is expected to continue in the coming weeks.
  • Influenza A(H3N2), A(H1N1) and B continue to co-circulate.
  • Influenza A remains the predominant circulating type and influenza B continues to circulate at higher levels than usual.
  • A(H1N1) and A(H3N2) are circulating in almost equal proportions. For the season to date, there is a slight majority (53%) of A(H1N1), due to an increase in detections in recent weeks.
  • The highest cumulative hospitalization rates are among children under 5 years of age and adults 65 years of age and older.
[h=2]On this page[/h]
[h=2]Influenza/Influenza-like Illness (ILI) Activity (geographic spread)[/h]
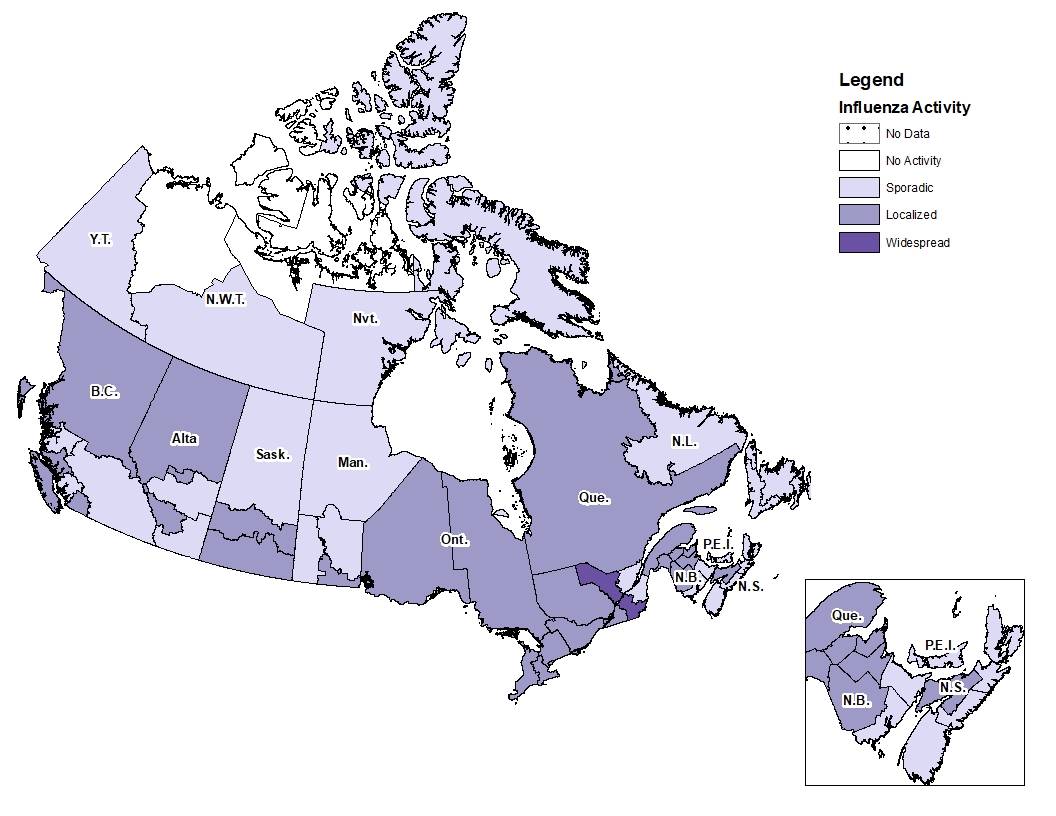
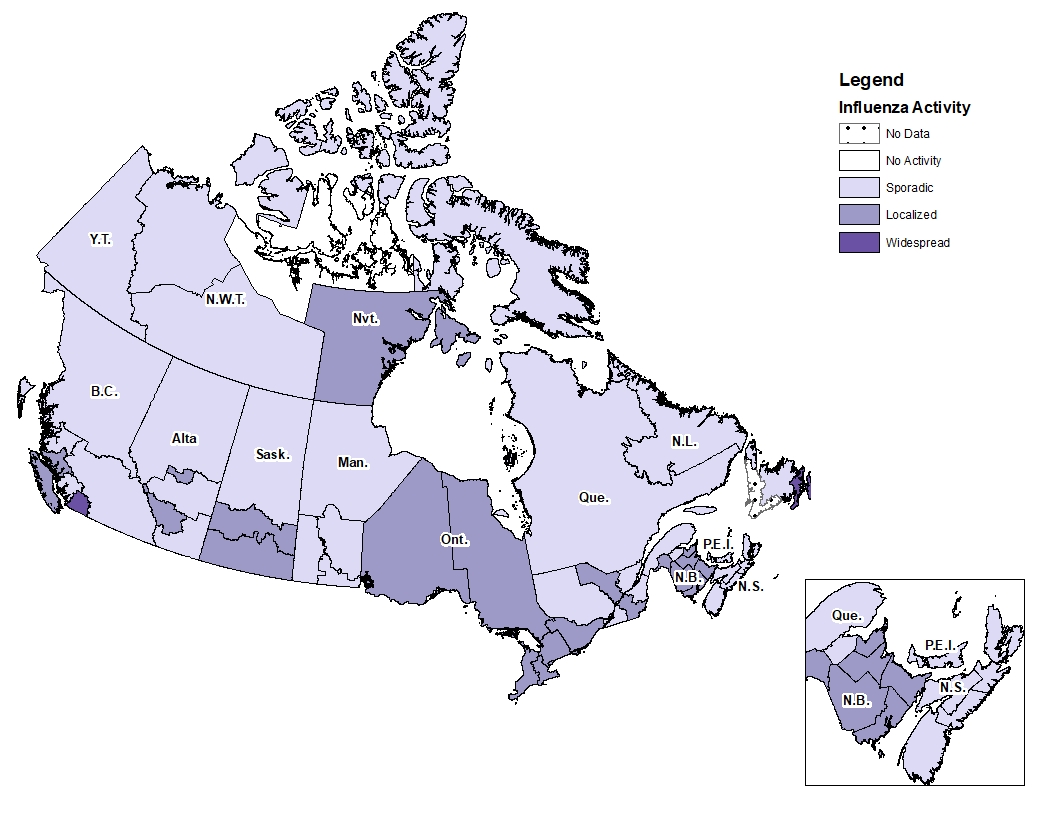
During week 02, 41 regions within 11 province/territories reported influenza activity; among these regions 44% reported sporadic activity, 46% reported localized activity, and 10% reported widespread activity (Figure 1). Figure 1 – Map of influenza/ILI activity by province and territory, Canada, week 2020-01

Number of Regions Reporting in Week 02: 45 out of 53
fig1-eng.jpg
Figure 1 - Text equivalent[h=2]Laboratory-Confirmed Influenza Detections[/h]
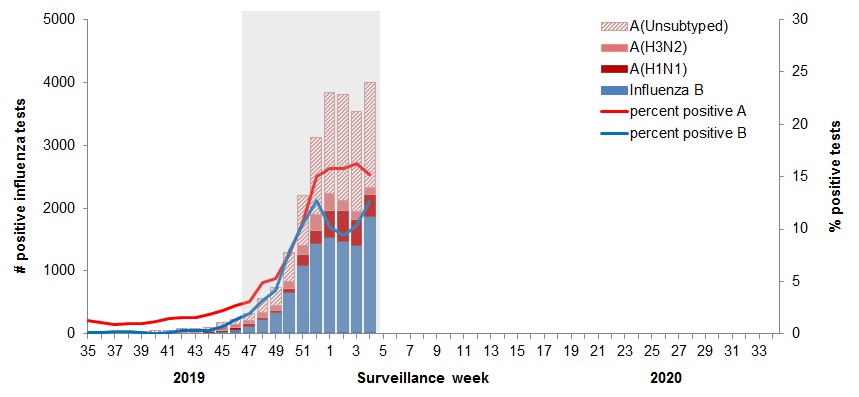
In week 02, the percentage of laboratory tests positive for influenza decreased slightly. Laboratory tests positive for influenza B declined but continue to be above average for this time of year. Among detections, the proportion that are influenza A continued to increase, and among subtyped influenza A detections, the proportion of A(H1N1) continued to increase.

The following results were reported from sentinel laboratories across Canada (Figures 2 and 3):
  • The percentage of tests positive for influenza decreased slightly from 26% in week 01 to 25% in week 02. While this is slightly higher than the average (23%) for week 02 over the past five seasons, the decline may suggest that we are near the peak of laboratory detections.
  • The percentage of tests positive for influenza A has been stable at approximately 15% since week 52.
  • The percentage of tests positive for influenza B declined for the second week in a row, from 13% in week 52 to 9% in week 02, but continues to be almost 5 times greater than the average (2.8%) for this time of year. The current level of circulation of influenza B is normally not observed until late March or early April.
  • The proportion of detections that were influenza A has increased in recent weeks, from 50% in week 51 to 63% in week 02.
  • Among subtyped influenza A detections, a mix of A(H1N1) and A(H3N2) continues to be detected. In week 02, the proportion of A(H1N1) increased from 62% in week 01 to 76%.
To date this season (weeks 35 to 02), 16,438 laboratory detections of influenza were reported:
  • 59% (9,622) were influenza A.
  • Among subtyped influenza A detections (2,932), A(H1N1) is now the predominant subtype overall this season by a slight majority (53%), due to the increase in A(H1N1) detections in recent weeks.
Detailed information on age and type/subtype has been received for 12,168 laboratory-confirmed influenza cases (Table 1). To date this season (weeks 35 to 02):
  • Among cases of influenza A(H3N2) (1,204), the largest proportion were in adults 65 years of age and older (46%).
  • Cases of influenza B (5,508) were primarily in younger age groups; 55% of cases were under 20 years of age and 33% between 20 and 44 years of age.
  • Among cases of influenza A(H1N1) (911), nearly equal proportions of cases were in adults 20-44 years, 45-64 years, and 65 years of age and older (between 26 and 28% of cases were in each age-group).
For more detailed weekly and cumulative influenza data, see the text descriptions for Figures 2 and 3 or the Respiratory Virus Detections in Canada Report. Figure 2 - Number of positive influenza tests and percentage of tests positive, by type, subtype and report week, Canada, weeks 2019-35 to 2020-02

Number of Laboratories Reporting in Week 02: 35 out of 36
fig2-eng.jpg


The shaded area indicates weeks where the positivity rate was at least 5% and a minimum of 15 positive tests were observed, signalling the period of seasonal influenza activity. Figure 2 - Text equivalentFigure 3 – Distribution of positive influenza specimens by type/subtype and province/territory[SUP]Footnote*[/SUP], Canada, weeks 2019-35 to 2020-02
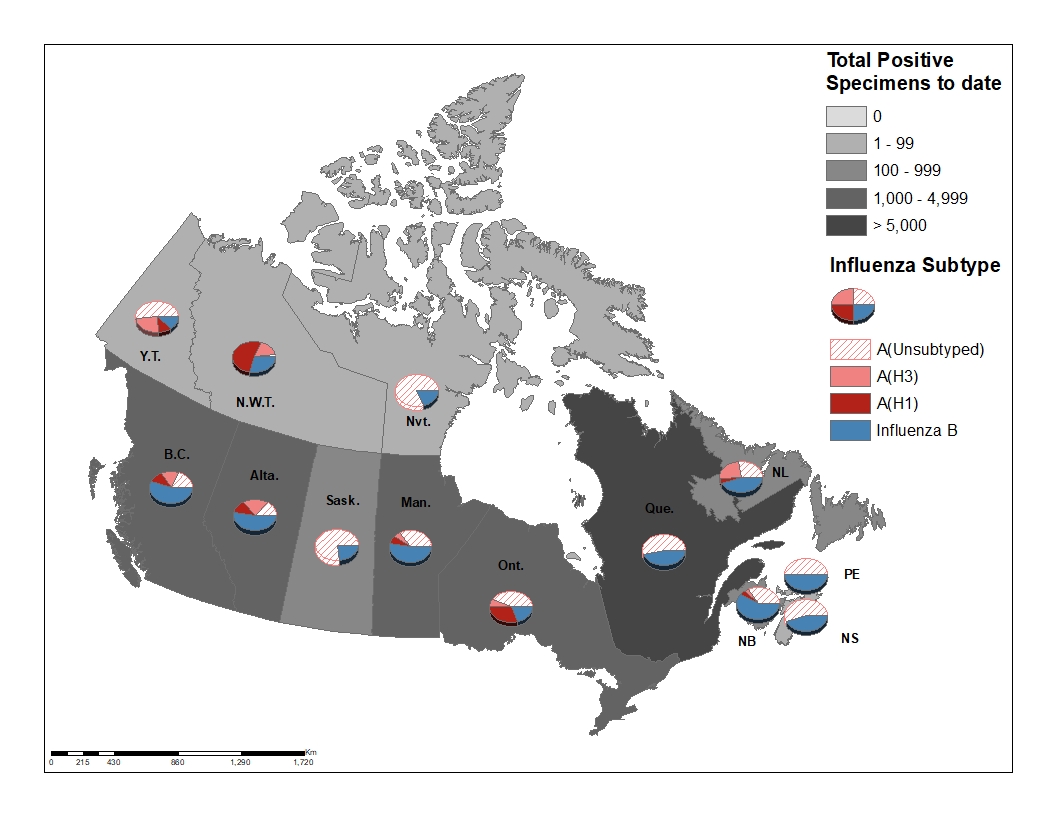
fig3-eng.jpg

Footnote * Specimens from NWT, YT, and Nvt are sent to reference laboratories in other provinces.

Return to footnote*referrer Figure 3 - Text equivalent
0-49391021247131105204417%
5-19637611464301930256721%
20-4412612551868201792305325%
45-641268239191838301156913%
65+25552545571744380293524%
Total666091112044545550812168100%

Table 1 - Cumulative numbers of positive influenza specimens by type, subtype and age group reported through case-based laboratory reporting, Canada, weeks 2020-01 to 2020-02
Age groups
(years) Cumulative (August 25, 2019 to January 11, 2020)
Influenza A B Influenza A and B
A Total A(H1N1) A(H3N2) A (Un subtyped)[SUP] Table 1 Footnote1 [/SUP] Total # %
[TD="colspan: 8"] Table 1 Footnote 1 Unsubtyped: The specimen was typed as influenza A, but no result for subtyping was available.

Table 1 Return to footnote1referrer [/TD]
[h=2]Syndromic / Influenza-like Illness Surveillance[/h] [h=3]Healthcare Professionals Sentinel Syndromic Surveillance[/h]
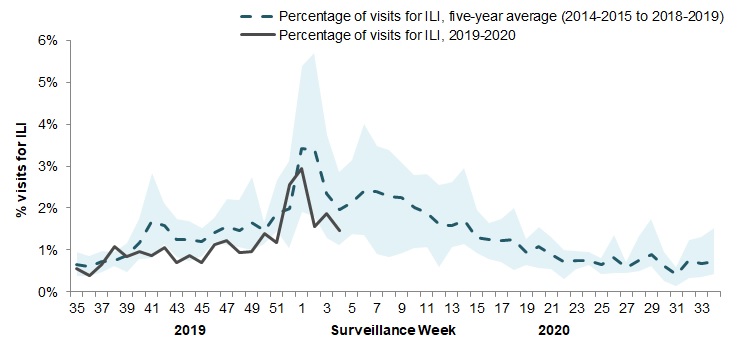
In week 02, 1.8% of visits to healthcare professionals were due to influenza-like illness (ILI) which is below the average for this time of year (Figure 4). Figure 4 – Percentage of visits for ILI reported by sentinels by report week, Canada, weeks 2019-35 to 2020-02
Number of participants reporting in week 02: 95

fig4-eng.jpg


The shaded area represents the maximum and minimum percentage of visits for ILI reported by week from seasons 2014-2015 to 2018-2019 Figure 4 - Text equivalent[h=2]FluWatchers[/h]
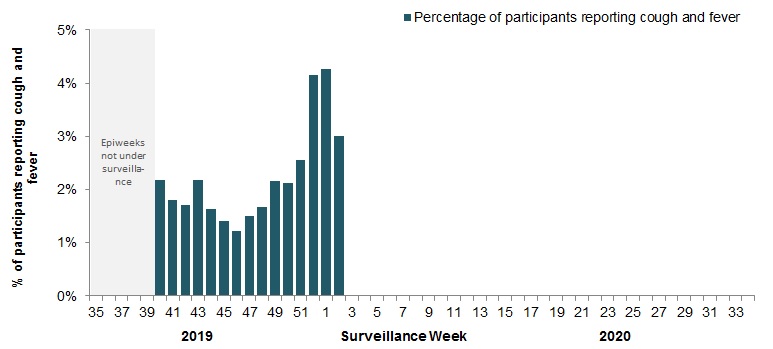
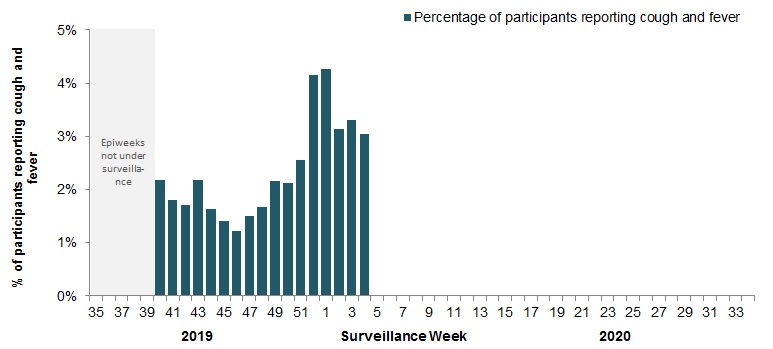
The proportion of FluWatchers participants reporting symptoms of cough and fever decreased in week 02 compared to the previous week. In week 02, 3,127 participants reported to FluWatchers, of which 3.0% (94) reported symptoms of cough and fever (Figure 5).

Among the 94 participants who reported cough and fever:
  • 27% consulted a healthcare professional;
  • 83% reported days missed from work or school, resulting in a combined total of 246 missed days of work or school.
  • 71% reported having been vaccinated for influenza this season.
If you are interested in becoming a FluWatcher, sign up today. Figure 5 - Percentage of participants reporting fever and cough, Canada, weeks 2019-40 to 2020-02
Number of Participants Reporting in Week 02: 3,127

fig5-eng.jpg
Figure 5 - Text equivalent
Online Figure – Geographic distribution of FluWatchers participants reporting cough and fever, Canada, week 2020-02

Click on the map to access the link

map
[h=2]Influenza Outbreak Surveillance[/h]
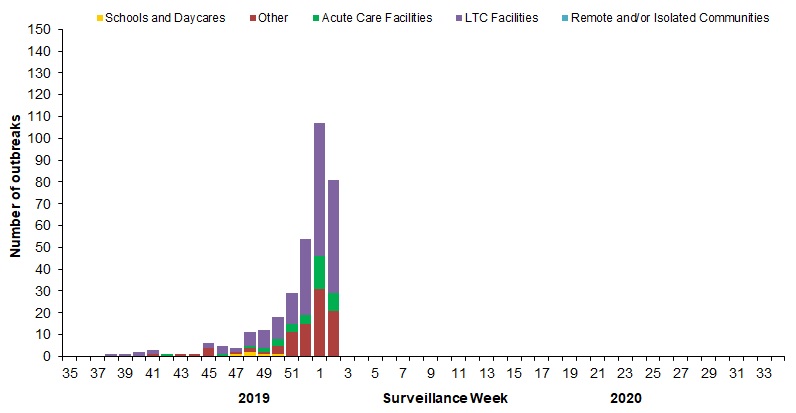
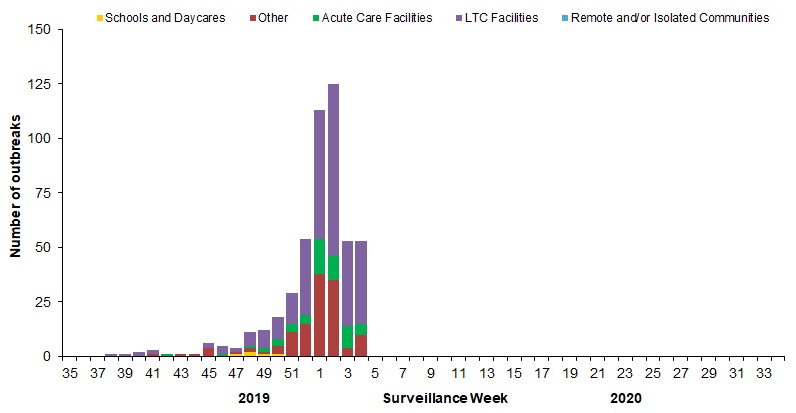
In week 02, the number of new laboratory-confirmed influenza outbreaks decreased. A total of 81 outbreaks were reported: 52 in long term care facilities, 8 in acute care facilities categorized as 'other', which includes facilities such as private personal care homes, correctional facilities, and colleges/universities (Figure 6).

To date this season, a total of 336 laboratory-confirmed influenza outbreaks have been reported; 59% (200) in long-term care facilities, 27% (92) in facilities categorized as ‘other’, 12% (39) in acute care facilities, and 2% (5) in schools/daycares. Of the outbreaks where influenza type was reported (324), 91% (295) were due to influenza A. Among the 146 outbreaks for which the influenza A subtype was reported, 62% (91) were associated with A(H3N2). Four ILI outbreaks in schools/daycares have also been reported. Figure 6 – Number of new outbreaks of laboratory-confirmed influenza by report week, Canada, weeks 2019-35 to 2020-02
Number of provinces and territories reporting in week 02: 12 out of 13

fig6-eng.jpg
Figure 6 - Text equivalent[h=2]Severe Outcomes Influenza Surveillance[/h]
Provincial/Territorial Influenza Hospitalizations and Deaths

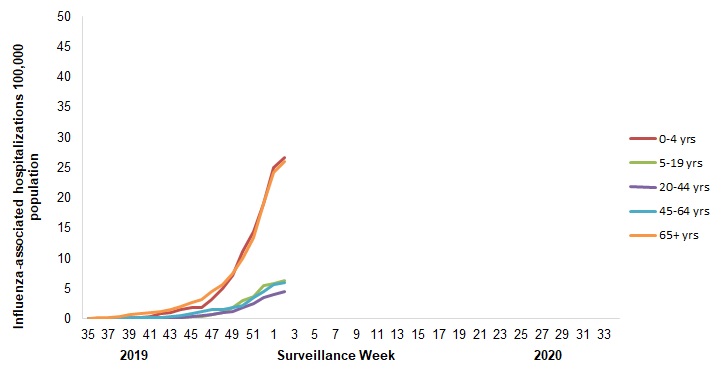
To date this season, 802 influenza-associated hospitalizations were reported by participating provinces and territories[SUP]Footnote†[/SUP].
  • 65% of the cases were associated with influenza A.
  • Of the cases for which subtype was reported (427), 78% were associated with influenza A(H3N2).
  • The highest cumulative hospitalization rates up to week 02 were among children under 5 years of age (27/100,000 population) and adults 65 years of age and older (26/100,000 population).
Eighty-one ICU admissions and thirteen deaths have been reported.
  • 57% of the ICU admissions and 77% of the deaths were associated with influenza A.
Figure 7 – Cumulative rates of influenza-associated hospitalizations by age-group and surveillance week, Canada, participating provinces and territories[SUP]Footnote1[/SUP] weeks 2019-35 to 2020-02
Number of provinces and territories reporting in week 02: 9 out of 9

fig7-eng.jpg
Footnote ‡ Influenza-associated hospitalizations are reported by Alberta, Manitoba, New Brunswick, Newfoundland and Labrador, Northwest Territories, Nova Scotia, Prince Edward Island and Yukon. Only hospitalizations that require intensive medical care are reported by Saskatchewan.

Return to footnote1referrer Figure 7 - Text equivalent[h=3]Pediatric Influenza Hospitalizations and Deaths[/h]
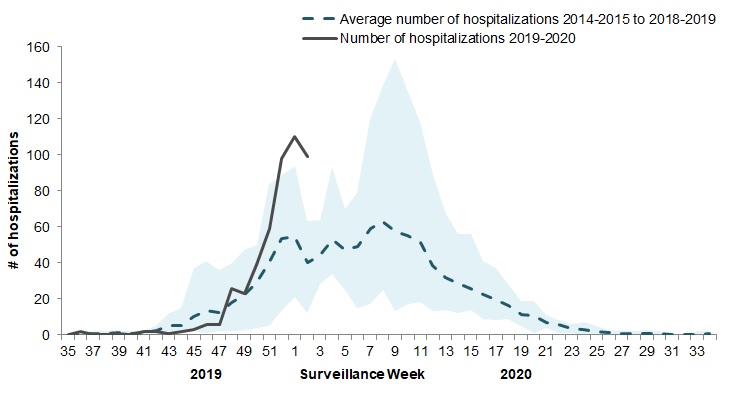
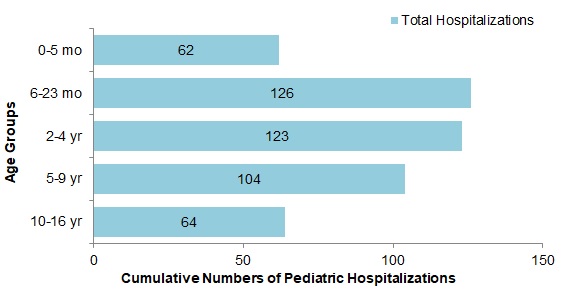
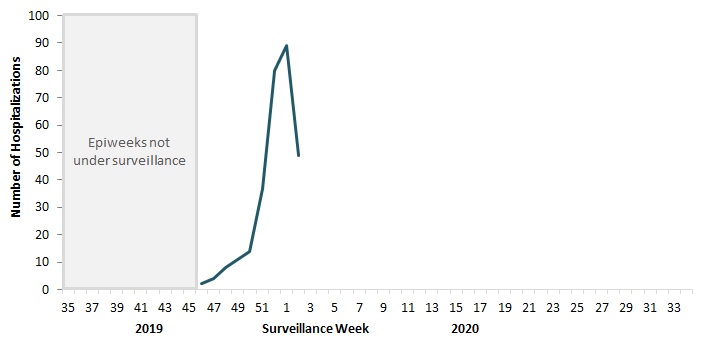
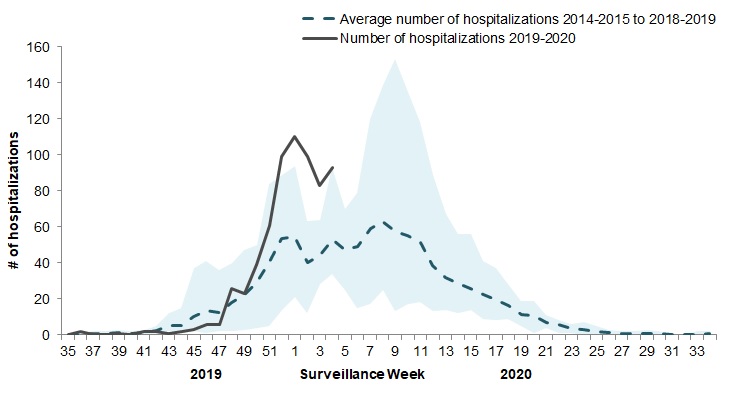
In week 02, 99 pediatric (≤16 years of age) laboratory-confirmed influenza-associated hospitalizations were reported by the Immunization Monitoring Program Active (IMPACT) network (Figure 8). The weekly number of cases in this period above the 5-year maximum in week 02.

The sharp increase in the number of cases in recent weeks is likely due to the concurrent circulation of influenza A and B this season. The number of influenza A-associated pediatric hospitalizations is similar to the average for this time of year. Influenza B usually circulates later in the season, in February or March. However, this season, the number of hospitalizations with influenza B is well above average compared to previous seasons, and occurring earlier in the season.

To date this season (weeks 35 to 02) :
  • 479 pediatric hospitalizations have been reported by the IMPACT network, of which 53% (254) were associated with influenza B and 47% (225) with influenza A.
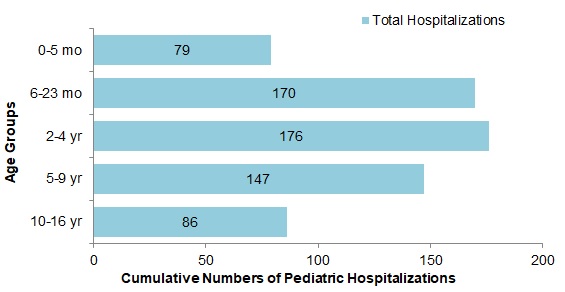
  • The largest proportion of hospitalizations (65%) were among children under 5 years of age (Figure 9).
  • Among cases in children under 5 years of age (311), 53% of cases were associated with influenza A, compared to cases in children 5 to 16 years of age (168), among whom 64% of cases were associated with influenza B.
  • 61 ICU admissions were reported, of which 52% (32) were associated with influenza A.
  • No pediatric deaths have been reported.
Figure 8 – Number of pediatric (≤16 years of age) hospitalizations reported by the IMPACT network, by week, Canada, weeks 2019-35 to 2020-02
fig8-eng.jpg


The shaded area represents the maximum and minimum number of cases reported by week from seasons 2014-15 to 2018-19 Figure 8 - Text equivalentFigure 9 - Cumulative number of pediatric hospitalizations (≤16 years of age) with influenza by age-group reported by the IMPACT network, Canada, weeks 2020-01 to 2020-02
fig9-eng.jpg
Figure 9 - Text Description[h=3]Adult Influenza Hospitalizations and Deaths[/h]
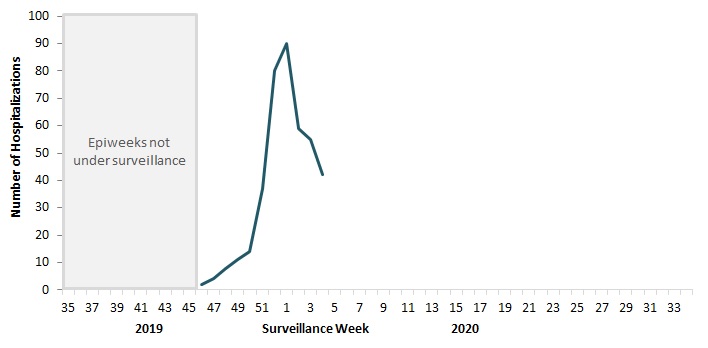
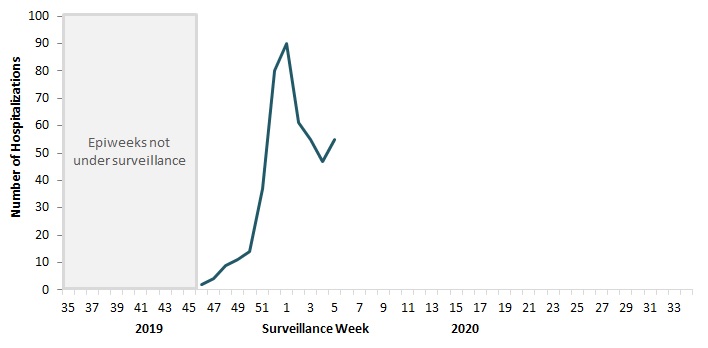
Surveillance of laboratory-confirmed influenza-associated adult (≥16 years of age) hospitalizations by the Canadian Immunization Research Network (CIRN) Serious Outcomes Surveillance (SOS) network began on November 1st for the 2019-20 season. In week 02, the number of cases decreased compared to the previous week.

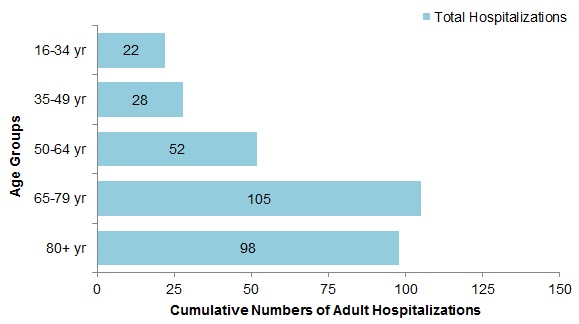
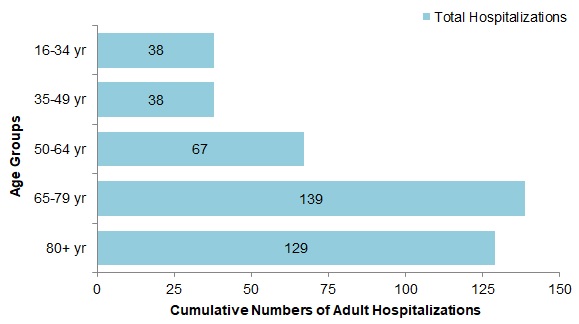
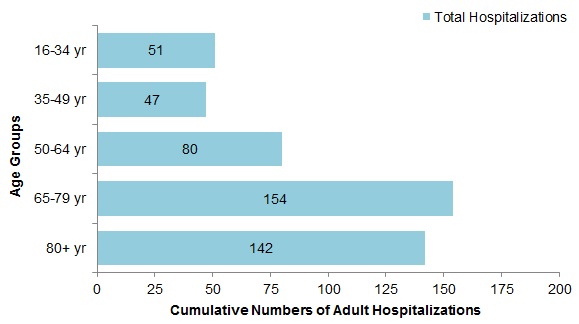
To date this season, 305 hospitalizations, 15 intensive care unit admissions, and less than five deaths have been reported (Figure 10). The majority of hospitalizations have been due to influenza A (88%), and among those subtyped (81) 89% were influenza A(H1N1). The largest proportion of hospitalizations are in adults 65-79 years of age (34%) and adults 80 years of age and older (32%) (Figure 11). Figure 10 - Number of adult hospitalizations (≥16 years of age) with influenza reported by the CIRN-SOS network, by week, Canada, weeks 2019-35 to 2020-02
fig10-eng.jpg
Figure 10 - Text DescriptionFigure 11 - Cumulative numbers of adult hospitalizations (≥16 years of age) with influenza, by age-group, reported by the CIRN-SOS network, Canada, weeks 2019-35 to 2020-02
fig11-eng.jpg
Figure 11 - Text Description[h=2]Influenza Strain Characterizations[/h]
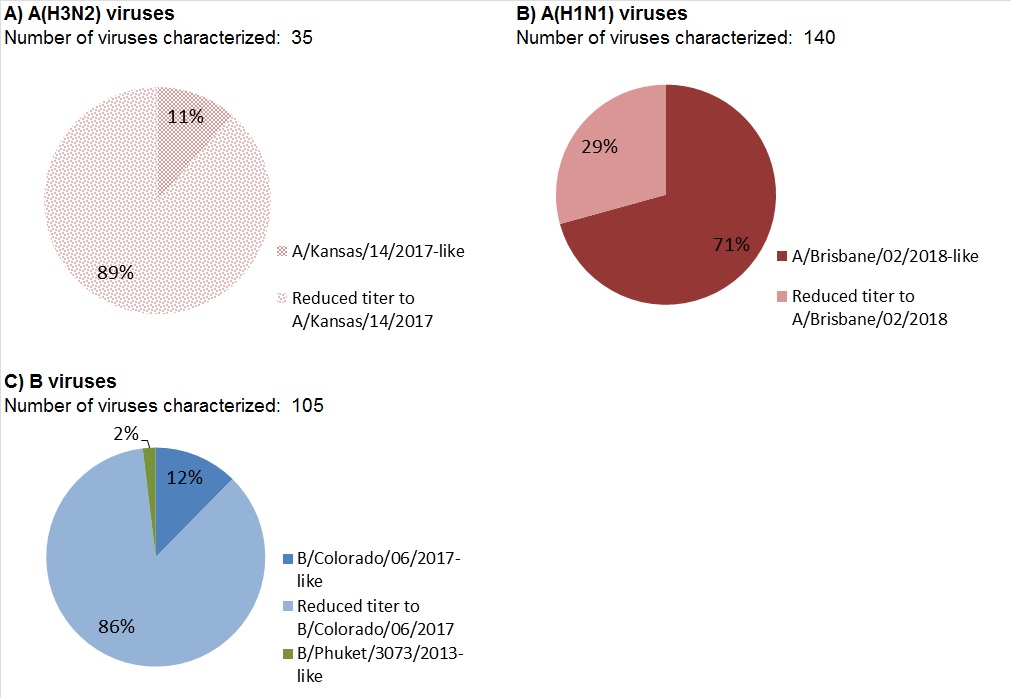
From September 1, 2019 to January 16, 2020, the National Microbiology Laboratory (NML) has characterized 384 influenza viruses (139 A(H3N2), 140 A(H1N1) and 105 influenza B) that were received from Canadian laboratories. [h=3]Influenza A(H3N2)[/h]
Over recent years, circulating strains of A(H3N2) have evolved, and are increasingly difficult to characterize by hemagglutination inhibition (HI) assay. Genetic characterization is established by sequencing the hemagglutinin (HA) gene of the influenza viruses to compare their genetic properties. [h=3]Antigenic Characterization:[/h]
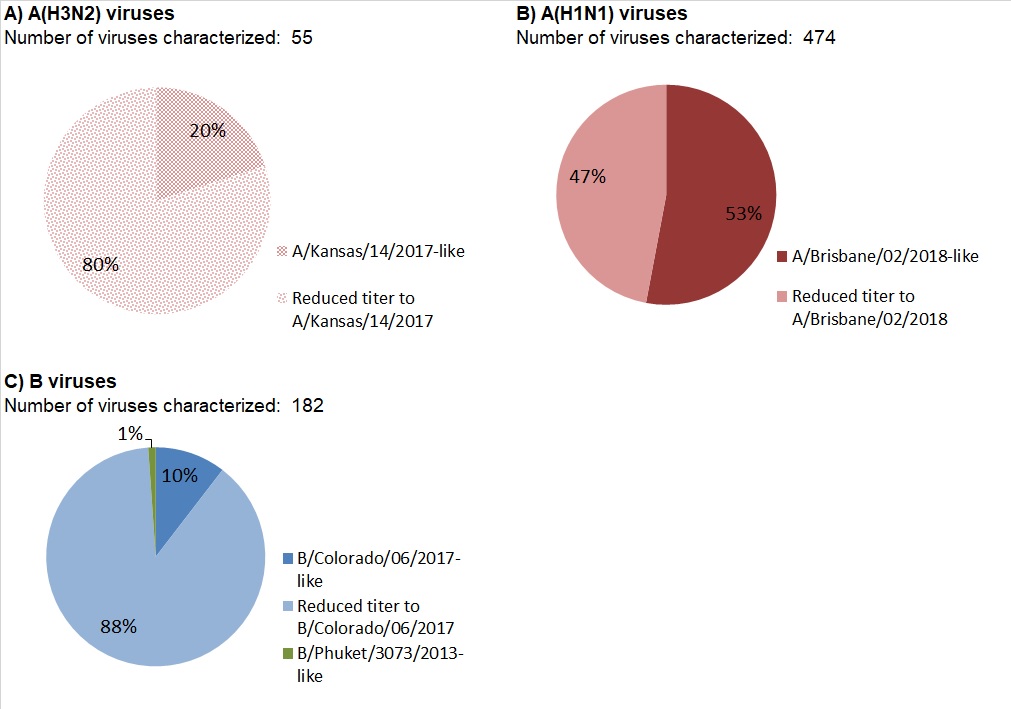
Among the 35 influenza A(H3N2) viruses antigenically characterized to date, the majority (89%) showed reduced titer by HI assay to A Kansas/14/2017 using antiserum raised against egg-propagated A Kansas/14/2017. Four viruses were characterized as A Kansas/14/2017-like (Figure 12 a). [h=3]Genetic Characterization:[/h]
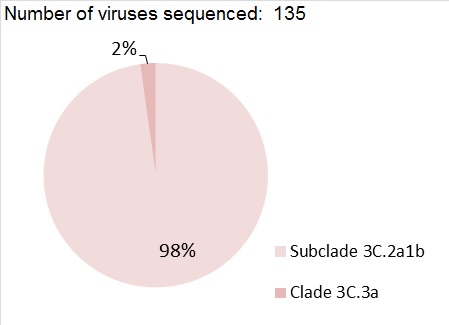
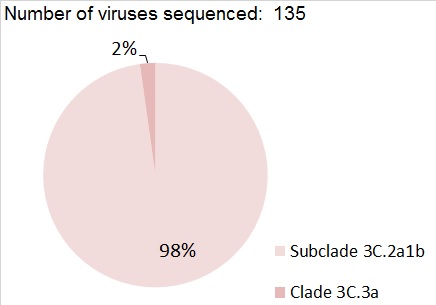
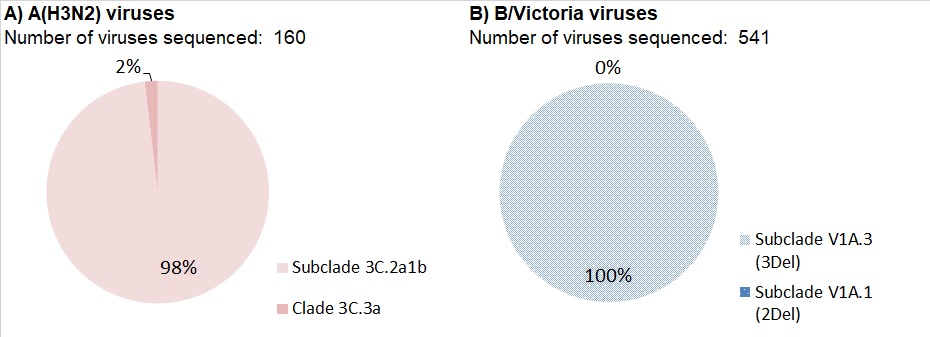
Nearly all (98%) of the 135 A(H3N2) viruses genetically characterized this season belonged to genetic group 3C.2a1b based on sequence analysis of the HA gene. Three viruses belonged to the genetic group 3C.3a (Figure 13).

Group 3C.2a1b viruses analysed represent:
  • 89% (31 out of 35) viruses that were also antigenically characterized.
  • 100% (104 out of 104) viruses which did not grow to sufficient hemagglutination titer for antigenic characterization by HI assay.
A/Kansas/14/2017 belongs to genetic group 3C.3a and is the influenza A(H3N2) component of the 2019-20 Northern Hemisphere influenza vaccine. [h=3]Influenza A(H1N1)[/h]
Among the 140 A(H1N1) viruses characterized to date, 71% were antigenically similar to A/Brisbane/02/2018 by HI testing using antiserum raised against egg-propagated A/Brisbane/02/2018 (Figure 12 b).

A/Brisbane/02/2018 is the influenza A(H1N1) component of the 2019-20 Northern Hemisphere influenza vaccine. [h=3]Influenza B[/h]
Among the 105 influenza B viruses antigenically characterized this season, the vast majority (103) belonged to the B/Victoria lineage. Two viruses were antigenically characterized as similar to B/Phuket/3073/2013 (B/Yamagata lineage)..

The majority (87%) of B/Victoria lineage viruses showed reduced titer by HI assay to B/Colorado/06/2017 using antiserum raised against cell culture-propagated B/Colorado/06/2017 (Figure 12 c).

Sequence analysis showed that 100% (87) of the 90 B/Victoria lineage viruses showing reduced titre to B/Colorado/06/2017 had a three amino acid deletion (162-164) in the HA gene.

The recommended influenza B components for the 2019-20 Northern Hemisphere influenza vaccine are B/Colorado/06/2017 (Victoria lineage) and B/Phuket/3073/2013 (Yamagata lineage). B/Phuket/3073/2013 is included in the quadrivalent influenza vaccine. Figure 12 - Distribution of antigenic phenotypes among characterized influenza viruses, Canada, September 1, 2019 to January 16, 2020
fig12-eng.jpg
Figure 12 - Text DescriptionFigure 13 - Distribution of genetic clades among characterized A(H3N2) influenza viruses, Canada, September 1, 2019 to January 16, 2020
fig13-eng.jpg
Figure 13 - Text Description[h=2]Antiviral Resistance[/h]
The National Microbiology Laboratory (NML) also tests influenza viruses received from Canadian laboratories for antiviral resistance. From September 1, 2019 to January 16, 2020, the following results were reported: [h=3]Oseltamivir:[/h]
228 influenza viruses (104 A(H3N2), 52 A(H1N1) and 72 B) were tested for resistance to oseltamivir:
  • All influenza viruses tested were sensitive to oseltamivir.
[h=3]Zanamivir:[/h]
228 influenza viruses (104 A(H3N2), 52 A(H1N1) and 72 B) were tested for resistance to zanamivir:
  • All influenza viruses tested were sensitive to zanamivir.
[h=3]Amantadine:[/h]
High levels of resistance to amantadine persist among influenza A(H1N1) and influenza A(H3N2) viruses. All viruses tested this season were resistant.


...
https://www.canada.ca/en/public-hea...atch/2019-2020/week-02-january-5-11-2020.html
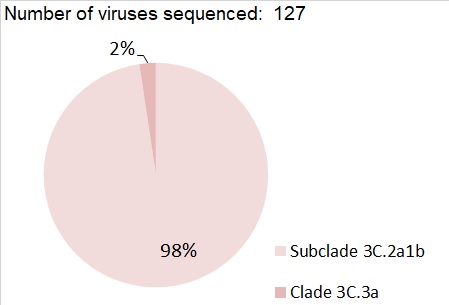
 
[h=1]FluWatch report: January 19 to 25, 2020 (week 04)[/h]
fw-w03-20.jpg


Download the alternative format
(PDF format, 737 KB, 13 pages)

Organization: Public Health Agency of Canada

Date published: 2020-01-31[h=3]Related Topics[/h]
[h=2]Overall Summary[/h]
  • Influenza activity remained high in week 04, with many indicators similar to or slightly higher than the previous week.
  • Influenza A and B continue to co-circulate. The proportion of laboratory tests positive for influenza A has been stable in recent weeks, while the proportion of tests positive for influenza B has increased over the past two weeks.
  • Influenza A(H1N1) is currently the dominant influenza A circulating in Canada, representing 75% of subtyped influenza A specimens in week 04.
  • The highest cumulative hospitalization rates are among children under 5 years of age and adults 65 years of age and older.
[h=2]On this page[/h]
[h=2]Influenza/Influenza-like Illness (ILI) Activity (geographic spread)[/h]
During week 04, influenza activity was reported in all provinces and territories and in almost all regions (51). Among these regions, 45% reported sporadic activity, 53% reported localized activity, and 2% reported widespread activity (Figure 1). Elevated influenza activity (localized and widespread activity) is being reported in many regions in provinces across the country. Sporadic influenza activity is being reported in the territories. Figure 1 – Map of influenza/ILI activity by province and territory, Canada, week 2020-04

Number of Regions Reporting in Week 04: 53 out of 53
fig1-eng.jpg
Figure 1 - Text equivalent[h=2]Laboratory-Confirmed Influenza Detections[/h]
In week 04, the percentage of laboratory tests positive for influenza increased compared to recent weeks. Influenza A and B continue to co-circulate, with an increased proportion of influenza B detections.

The following results were reported from sentinel laboratories across Canada (Figures 2 and 3):
  • Following a plateau around 26% over the previous three weeks the percentage of tests positive for influenza increased to 28% in week 04. This is slightly higher than the average (23%) for week 04 over the past five seasons, and consistent with the usual period of high influenza activity in Canada.
  • The percentage of tests positive for influenza A has remained similar over the past four weeks, and was 15% in week 04.
  • The percentage of tests positive for influenza B increased from 10% in week 03 to 13% in week 04. This continues to be three times greater than the average (3.7%) for this time of year.
  • Among subtyped influenza A detections, the proportion of A(H1N1) has been similar over the past 3 weeks, at approximately 75%.
To date this season (weeks 35 to 04), 24,448 laboratory detections of influenza were reported:
  • 59% (14,344) were influenza A.
  • Among subtyped influenza A detections (3 957), A(H1N1) is now the predominant subtype overall this season (59%), due to the increase in A(H1N1) detections in recent weeks.
Detailed information on age and type/subtype has been received for 18,766 laboratory-confirmed influenza cases (Table 1). To date this season (weeks 35 to 04):
  • Among cases of influenza A(H3N2) (1,446), the largest proportion were in adults 65 years of age and older (47%).
  • Cases of influenza B (8,470) were primarily in younger age groups; 56% of cases were under 20 years of age and 32% between 20 and 44 years of age.
  • Among cases of influenza A(H1N1) (1,531), 32% of cases were in adults 65 years of age and older, with equal proportions in adults 20-44 years and 45-64 years (25%).
For more detailed weekly and cumulative influenza data, see the text descriptions for Figures 2 and 3 or the Respiratory Virus Detections in Canada Report. Figure 2 - Number of positive influenza tests and percentage of tests positive, by type, subtype and report week, Canada, weeks 2019-35 to 2020-04

Number of Laboratories Reporting in Week 04: 36 out of 36
fig2-eng.jpg


The shaded area indicates weeks where the positivity rate was at least 5% and a minimum of 15 positive tests were observed, signalling the period of seasonal influenza activity. Figure 2 - Text equivalentFigure 3 – Distribution of positive influenza specimens by type/subtype and province/territory[SUP]Footnote*[/SUP], Canada, weeks 2019-35 to 2020-04
fig3-eng.jpg
Footnote * Specimens from NWT, YT, and Nvt are sent to reference laboratories in other provinces.

Return to footnote*referrer Figure 3 - Text equivalent
0-4156117014212491850341118%
5-19997991837152852384921%
20-44202139721614082685470625%
45-6419233922241307466238913%
65+37945036812610617441124%
Total10296156114467289847018766100%

Table 1 - Cumulative numbers of positive influenza specimens by type, subtype and age group reported through case-based laboratory reporting, Canada, weeks 2020-01 to 2020-04
Age groups
(years) Cumulative (August 25, 2019 to January 25, 2020)
Influenza A B Influenza A and B
A Total A(H1N1) A(H3N2) A (Un subtyped)[SUP] Table 1 Footnote1 [/SUP] Total # %
[TD="colspan: 8"] Table 1 Footnote 1 Unsubtyped: The specimen was typed as influenza A, but no result for subtyping was available.

Table 1 Return to footnote1referrer [/TD]
[h=2]Syndromic / Influenza-like Illness Surveillance[/h] [h=3]Healthcare Professionals Sentinel Syndromic Surveillance[/h]
In week 04, 1.5% of visits to healthcare professionals were due to influenza-like illness (ILI) which is below the average for this time of year (Figure 4). Figure 4 – Percentage of visits for ILI reported by sentinels by report week, Canada, weeks 2019-35 to 2020-04
Number of Sentinels Reporting in Week 04: 109

fig4-eng.jpg


The shaded area represents the maximum and minimum percentage of visits for ILI reported by week from seasons 2014-2015 to 2018-2019 Figure 4 - Text equivalent[h=2]FluWatchers[/h]
The proportion of FluWatchers participants reporting symptoms of cough and fever decreased slightly in week 04 compared to the previous week. In week 04, 3,190 participants reported to FluWatchers, of which 3.0% (97) reported symptoms of cough and fever (Figure 5).

Among the 97 participants who reported cough and fever:
  • 20% consulted a healthcare professional;
  • 77% reported days missed from work or school, resulting in a combined total of 256 missed days of work or school.
  • 72% reported having been vaccinated for influenza this season.
If you are interested in becoming a FluWatcher, sign up today. Figure 5 - Percentage of participants reporting fever and cough, Canada, weeks 2019-40 to 2020-04
Number of Participants Reporting in Week 04: 3,190
fig5-eng.jpg
Figure 5 - Text equivalent
Online Figure – Geographic distribution of FluWatchers participants reporting cough and fever, Canada, week 2020-04

Click on the map to access the link
map
[h=2]Influenza Outbreak Surveillance[/h]
In week 04, the number of new laboratory-confirmed influenza outbreaks was the same as the previous week. A total of 53 outbreaks were reported: 38 in long term care facilities, 5 in acute care facilities, and 10 in facilities categorized as 'other', which includes facilities such as private personal care homes, correctional facilities, and colleges/universities (Figure 6). In addition, 26 ILI outbreaks in schools/daycares were reported.

To date this season, a total of 493 laboratory-confirmed influenza outbreaks have been reported; 61% (302) in long-term care facilities, 26% (128) in facilities categorized as 'other', 12% (58) in acute care facilities, and 1% (5) in schools/daycares. Of the 464 outbreaks where influenza type was reported, 89% (413) were due to influenza A. Among the 217 outbreaks for which the influenza A subtype was reported, 55% (119) were associated with A(H3N2). To date this season, 34 ILI outbreaks in schools/daycares have also been reported. Figure 6 – Number of new outbreaks of laboratory-confirmed influenza by report week, Canada, weeks 2019-35 to 2020-04
Number of provinces and territories reporting in week 04: 13 out of 13

fig6-eng.jpg
Figure 6 - Text equivalent[h=2]Severe Outcomes Influenza Surveillance[/h]
Provincial/Territorial Influenza Hospitalizations and Deaths

To date this season, 1,115 influenza-associated hospitalizations were reported by participating provinces and territories[SUP]Footnote†[/SUP].
  • 66% of the cases were associated with influenza A.
  • Of the 568 cases for which subtype was reported, 71% were associated with influenza A(H3N2).
  • The highest cumulative hospitalization rates up to week 04 were adults 65 years of age and older (36/100,000 population) and among children under 5 years of age (36/100,000 population).
112 ICU admissions and 26 deaths have been reported.
  • 58% of the ICU admissions and 65% of the deaths were associated with influenza A.
Figure 7 – Cumulative rates of influenza-associated hospitalizations by age-group and surveillance week, Canada, participating provinces and territories[SUP]Footnote1[/SUP] weeks 2019-35 to 2020-04
Number of provinces and territories reporting in week 04: 8 out of 9

fig7-eng.jpg
Footnote ‡ Influenza-associated hospitalizations are reported by Alberta, Manitoba, New Brunswick, Newfoundland and Labrador, Northwest Territories, Nova Scotia, Prince Edward Island and Yukon. Only hospitalizations that require intensive medical care are reported by Saskatchewan.

Return to footnote1referrer Figure 7 - Text equivalent[h=3]Pediatric Influenza Hospitalizations and Deaths[/h]
In week 04, 93 pediatric (≤16 years of age) laboratory-confirmed influenza-associated hospitalizations were reported by the Immunization Monitoring Program Active (IMPACT) network (Figure 8). The weekly number of cases increased compared to the previous week which is the same as the 5-year maximum in week 04.

The elevated number of cases in recent weeks is likely due to the concurrent circulation of influenza A and B this season. The number of influenza A-associated pediatric hospitalizations is slighly above the average for this time of year. The number of hospitalizations with influenza B is well above average compared to previous seasons, and occurring earlier in the season.

To date this season (weeks 35 to 04):
  • 658 pediatric hospitalizations have been reported by the IMPACT network, of which 51% (338) were associated with influenza B and 49% (320) with influenza A.
  • The largest proportion of hospitalizations (65%) were among children under 5 years of age (Figure 9).
  • Among cases in children under 5 years of age (425), 54% were associated with influenza A, compared to cases in children 5 to 16 years of age (233), among whom 62% of cases were associated with influenza B.
  • 87 ICU admissions were reported, of which 51% (47) were associated with influenza A.
  • Less than five pediatric deaths have been reported.
Figure 8 – Number of pediatric (≤16 years of age) hospitalizations reported by the IMPACT network, by week, Canada, weeks 2019-35 to 2020-04
fig8-eng.jpg


The shaded area represents the maximum and minimum number of cases reported by week from seasons 2014-15 to 2018-19 Figure 8 - Text equivalentFigure 9 - Cumulative number of pediatric hospitalizations (≤16 years of age) with influenza by age-group reported by the IMPACT network, Canada, weeks 2020-01 to 2020-04
fig9-eng.jpg
Figure 9 - Text Description[h=3]Adult Influenza Hospitalizations and Deaths[/h]
Surveillance of laboratory-confirmed influenza-associated adult (≥16 years of age) hospitalizations by the Canadian Immunization Research Network (CIRN) Serious Outcomes Surveillance (SOS) network began on November 1st for the 2019-20 season. In week 04, the number of cases decreased for the third consecutive week.

To date this season, 411 hospitalizations, 22 intensive care unit admissions, and nine deaths have been reported (Figure 10).
  • The majority of hospitalizations have been due to influenza A (87%), and among those subtyped (98) 91% were influenza A(H1N1).
  • The largest proportion of hospitalizations are in adults 65-79 years of age (34%) and adults 80 years of age and older (31%) (Figure 11).
  • 65% of hospitalized cases reported at least one type of comorbid condition.
Figure 10 - Number of adult hospitalizations (≥16 years of age) with influenza reported by the CIRN-SOS network, by week, Canada, weeks 2019-35 to 2020-04
fig10-eng.jpg
Figure 10 - Text DescriptionFigure 11 - Cumulative numbers of adult hospitalizations (≥16 years of age) with influenza, by age-group, reported by the CIRN-SOS network, Canada, weeks 2019-35 to 2020-04
fig11-eng.jpg
Figure 11 - Text Description[h=2]Influenza Strain Characterizations[/h]
From September 1, 2019 to January 23, 2020, the National Microbiology Laboratory (NML) has characterized 456 influenza viruses (142 A(H3N2), 190 A(H1N1) and 124 influenza B) that were received from Canadian laboratories. [h=3]Influenza A(H3N2)[/h]
Over recent years, circulating strains of A(H3N2) have evolved, and are increasingly difficult to characterize by hemagglutination inhibition (HI) assay. Genetic characterization is established by sequencing the hemagglutinin (HA) gene of the influenza viruses to compare their genetic properties. [h=3]Antigenic Characterization:[/h]
Among the 38 influenza A(H3N2) viruses antigenically characterized to date, the majority (89%) showed reduced titer by HI assay to A Kansas/14/2017 using antiserum raised against egg-propagated A Kansas/14/2017. Four viruses were characterized as A Kansas/14/2017-like (Figure 12 a). [h=3]Genetic Characterization:[/h]
Nearly all (98%) of the 135 A(H3N2) viruses genetically characterized this season belonged to genetic group 3C.2a1b based on sequence analysis of the HA gene. Three viruses belonged to the genetic group 3C.3a (Figure 13).

Group 3C.2a1b viruses analysed represent:
  • 74% (28 out of 31) viruses that were also antigenically characterized.
  • 100% (104 out of 104) viruses which did not grow to sufficient hemagglutination titer for antigenic characterization by HI assay.
A/Kansas/14/2017 belongs to genetic group 3C.3a and is the influenza A(H3N2) component of the 2019-20 Northern Hemisphere influenza vaccine. [h=3]Influenza A(H1N1)[/h]
Among the 190 A(H1N1) viruses characterized to date, 62% were antigenically similar to A/Brisbane/02/2018 by HI testing using antiserum raised against egg-propagated A/Brisbane/02/2018 (Figure 12 b).

A/Brisbane/02/2018 is the influenza A(H1N1) component of the 2019-20 Northern Hemisphere influenza vaccine. [h=3]Influenza B[/h]
Among the 124 influenza B viruses antigenically characterized this season, the vast majority (122) belonged to the B/Victoria lineage. Two viruses were antigenically characterized as similar to B/Phuket/3073/2013 (B/Yamagata lineage).

The majority (89%, 108) of B/Victoria lineage viruses showed reduced titer by HI assay to B/Colorado/06/2017 using antiserum raised against cell culture-propagated B/Colorado/06/2017 (Figure 12 c).

Sequence analysis showed that 100% of the 105 B/Victoria lineage viruses showing reduced titre to B/Colorado/06/2017 had a three amino acid deletion (162-164) in the HA gene. Sequencing is pending for the remaining three viruses.

The recommended influenza B components for the 2019-20 Northern Hemisphere influenza vaccine are B/Colorado/06/2017 (Victoria lineage) and B/Phuket/3073/2013 (Yamagata lineage). B/Phuket/3073/2013 is included in the quadrivalent influenza vaccine. Figure 12 - Distribution of antigenic phenotypes among characterized influenza viruses, Canada, September 1, 2019 to January 25, 2020
fig12-eng.jpg
Figure 12 - Text DescriptionFigure 13 - Distribution of genetic clades among characterized A(H3N2) influenza viruses, Canada, September 1, 2019 to January 25, 2020
fig13-eng.jpg
Figure 13 - Text Description[h=2]Antiviral Resistance[/h]
The National Microbiology Laboratory (NML) also tests influenza viruses received from Canadian laboratories for antiviral resistance. From September 1, 2019 to January 23, 2020, the following results were reported: [h=3]Oseltamivir:[/h]
277 influenza viruses (118 A(H3N2), 72 A(H1N1) and 87 B) were tested for resistance to oseltamivir:
  • All influenza A(H3N2) and B viruses were sensitive to oseltamivir.
  • Among the A(H1N1) viruses tested, 71 (99%) were sensitive to oseltamivir and one virus was resistant to oseltamivir with the H275Y mutation in the neuraminidase gene.
[h=3]Zanamivir:[/h]
277 influenza viruses (118 A(H3N2), 72 A(H1N1) and 87 B) were tested for resistance to zanamivir:
  • All influenza viruses tested were sensitive to zanamivir.
[h=3]Amantadine:[/h]
High levels of resistance to amantadine persist among influenza A(H1N1) and influenza A(H3N2) viruses. All viruses tested this season were resistant.
...

https://www.canada.ca/en/public-hea...tch/2019-2020/week-04-january-19-25-2020.html
 
[h=1]FluWatch report: January 26 to February 1, 2020 (week 05)[/h]
pub-eng.jpg


Download the alternative format
(PDF format, 737 KB, 13 pages)

Organization: Public Health Agency of Canada

Date published: 2020-02-07[h=3]Related Topics[/h]
[h=2]Overall Summary[/h]
  • Influenza activity remained high in week 05, with almost all indicators increasing from the previous week.
  • Influenza A and B continue to co-circulate.
  • Influenza A(H1N1) is currently the dominant influenza A circulating in Canada, representing 84% of subtyped influenza A specimens in week 05.
  • The highest cumulative hospitalization rates are among children under 5 years of age and adults 65 years of age and older.
[h=2]On this page[/h]
[h=2]Influenza/Influenza-like Illness (ILI) Activity (geographic spread)[/h]
During week 05, influenza activity was reported in all provinces and territories and in almost all regions (51). Among these regions, 56% reported sporadic activity, 38% reported localized activity, and 4% reported widespread activity (Figure 1). Figure 1 – Map of influenza/ILI activity by province and territory, Canada, week 2020-05

Number of Regions Reporting in Week 05: 52 out of 53
fig1-eng.jpg
Figure 1 - Text equivalent[h=2]Laboratory-Confirmed Influenza Detections[/h]
In week 05, the percentage of laboratory tests positive for influenza continued to increase and surpassed the previous peak reported in late December. The percentage of tests positive for influenza was 30% in week 05, up from 28% in week 04. Influenza A and B continue to co-circulate; however, the recent increase in laboratory detections is mainly driven by an increase in influenza B detections.

The following results were reported from sentinel laboratories across Canada (Figures 2 and 3):
  • The percentage of tests positive for influenza B was 14% week 05. This continues to be three times greater than the average (4.2%) for this time of year.
  • The percentage of tests positive for influenza A was 16% in week 05, which is average for this time of year.
  • Among subtyped influenza A detections, influenza A(H1N1) accounted for 84% of detections, up from 75% in week 04.
To date this season (weeks 35 to 05), 29,023 laboratory detections of influenza were reported:
  • 58% (16,763) were influenza A.
  • Among subtyped influenza A detections (4,470), A(H1N1) is the predominant subtype this season (61%).
Detailed information on age and type/subtype has been received for 20,036 laboratory-confirmed influenza cases (Table 1). To date this season (weeks 35 to 05):
  • Among cases of influenza A(H3N2) (1,524), the largest proportion were in adults 65 years of age and older (47%).
  • Cases of influenza B (8,993) were primarily in younger age groups; 55% of cases were under 20 years of age and 32% between 20 and 44 years of age.
  • Among cases of influenza A(H1N1) (1,934), 31% of cases were in adults 65 years of age and older, with approximately equal proportions in adults 20-44 years and 45-64 years (~25%).
For more detailed weekly and cumulative influenza data, see the text descriptions for Figures 2 and 3 or the Respiratory Virus Detections in Canada Report. Figure 2 - Number of positive influenza tests and percentage of tests positive, by type, subtype and report week, Canada, weeks 2019-35 to 2020-05

Number of Laboratories Reporting in Week 05: 34 out of 36
fig2-eng.jpg


The shaded area indicates weeks where the positivity rate was at least 5% and a minimum of 15 positive tests were observed, signalling the period of seasonal influenza activity. Figure 2 - Text equivalentFigure 3 – Distribution of positive influenza specimens by type/subtype and province/territory[SUP]Footnote*[/SUP], Canada, weeks 2019-35 to 2020-05
fig3-eng.jpg
Footnote * Specimens from NWT, YT, and Nvt are sent to reference laboratories in other provinces.

Return to footnote*referrer Figure 3 - Text equivalent
0-4165922714912831915357418%
5-1910941261927763051414521%
20-44225450023715172876513026%
45-6420774772351365506258313%
65+39596047112644645460423%
Total11043193415247585899320036100%

Table 1 - Cumulative numbers of positive influenza specimens by type, subtype and age group reported through case-based laboratory reporting, Canada, weeks 2020-01 to 2020-05
Age groups
(years) Cumulative (August 25, 2019 to February 1, 2020)
Influenza A B Influenza A and B
A Total A(H1N1) A(H3N2) A (Un subtyped)[SUP] Table 1 Footnote1 [/SUP] Total # %
[TD="colspan: 8"] Table 1 Footnote 1 Unsubtyped: The specimen was typed as influenza A, but no result for subtyping was available.

Table 1 Return to footnote1referrer [/TD]
[h=2]Syndromic / Influenza-like Illness Surveillance[/h] [h=3]Healthcare Professionals Sentinel Syndromic Surveillance[/h]
In week 05, 1.6% of visits to healthcare professionals were due to influenza-like illness (ILI) which is below the average for this time of year (Figure 4). Figure 4 – Percentage of visits for ILI reported by sentinels by report week, Canada, weeks 2019-35 to 2020-05
Number of Sentinels Reporting in Week 05: 90

fig4-eng.jpg


The shaded area represents the maximum and minimum percentage of visits for ILI reported by week from seasons 2014-2015 to 2018-2019 Figure 4 - Text equivalent[h=2]FluWatchers[/h]
The proportion of FluWatchers participants reporting symptoms of cough and fever increased in week 05 compared to the previous week. In week 05, 3,165 participants reported to FluWatchers, of which 3.4% (109) reported symptoms of cough and fever (Figure 5).

Among the 109 participants who reported cough and fever:
  • 20% consulted a healthcare professional;
  • 74% reported days missed from work or school, resulting in a combined total of 250 missed days of work or school.
If you are interested in becoming a FluWatcher, sign up today. Figure 5 - Percentage of participants reporting fever and cough, Canada, weeks 2019-40 to 2020-05
Number of Participants Reporting in Week 05: 3,165
fig5-eng.jpg
Figure 5 - Text equivalent
Online Figure – Geographic distribution of FluWatchers participants reporting cough and fever, Canada, week 2020-05

Click on the map to access the link
map
[h=2]Influenza Outbreak Surveillance[/h]
In week 05, a total of 28 outbreaks were reported: 14 in long term care facilities, 5 in acute care facilities, 5 in facilities categorized as ‘other’, which includes facilities such as private personal care homes, correctional facilities, and colleges/universities and 4 in schools and daycares (Figure 6). In addition, 43 ILI outbreaks in schools/daycares were reported.

To date this season, a total of 576 laboratory-confirmed influenza outbreaks have been reported; 61% (352) in long-term care facilities, 25% (144) in facilities categorized as ‘other’, 11% (64) in acute care facilities, and 3% (16) in schools/daycares. Of the 544 outbreaks where influenza type was reported, 90% (487) were due to influenza A. Among the 233 outbreaks for which the influenza A subtype was reported, 55% (127) were associated with A(H3N2). To date this season, 79 ILI outbreaks in schools/daycares have also been reported. Figure 6 – Number of new outbreaks of laboratory-confirmed influenza by report week, Canada, weeks 2019-35 to 2020-05
Number of provinces and territories reporting in Week 05: 13 out of 13

fig6-eng.jpg
Figure 6 - Text equivalent[h=2]Severe Outcomes Influenza Surveillance[/h]
Provincial/Territorial Influenza Hospitalizations and Deaths

To date this season, 1,358 influenza-associated hospitalizations were reported by participating provinces and territories1.
  • 65% of the cases were associated with influenza A.
  • Of the 661 cases for which subtype was reported, 67% were associated with influenza A(H3N2).
  • The highest cumulative hospitalization rates up to week 05 were among children under 5 years of age and adults 65 years of age and older (44/100,000 population).
129 ICU admissions and 38 deaths have been reported.
  • 58% of the ICU admissions and 76% of the deaths were associated with influenza A.
Figure 7 – Cumulative rates of influenza-associated hospitalizations by age-group and surveillance week, Canada, participating provinces and territories[SUP]Footnote1[/SUP] weeks 2019-35 to 2020-05
Number of provinces and territories reporting in Week 05: 8 out of 9

fig7-eng.jpg
Footnote ‡ Influenza-associated hospitalizations are reported by Alberta, Manitoba, New Brunswick, Newfoundland and Labrador, Northwest Territories, Nova Scotia, Prince Edward Island and Yukon. Only hospitalizations that require intensive medical care are reported by Saskatchewan.

Return to footnote1referrer Figure 7 - Text equivalent[h=3]Pediatric Influenza Hospitalizations and Deaths[/h]
In week 05, 117 pediatric (≤16 years of age) laboratory-confirmed influenza-associated hospitalizations were reported by the Immunization Monitoring Program Active (IMPACT) network (Figure 8). The weekly number of cases increased compared to the previous week. The number of cases due to influenza B remains high; however, in recent weeks, a growing proportion of cases have been due to influenza A.
The elevated number of cases this season compared to previous seasons is likely due to the concurrent circulation of influenza A and B this season. The number of influenza A-associated pediatric hospitalizations is above the average for this time of year. The number of hospitalizations with influenza B is well above average compared to previous seasons, and occurring earlier in the season.
To date this season (weeks 35 to 05):
  • 774 pediatric hospitalizations have been reported by the IMPACT network, of which 50% (389) were associated with influenza B and 50% (385) with influenza A.
  • The largest proportion of hospitalizations (65%) were among children under 5 years of age (Figure 9).
  • Among cases in children under 5 years of age (503), 56% were associated with influenza A, compared to cases in children 5 to 16 years of age (271), among whom 60% of cases were associated with influenza B.
  • 114 ICU admissions were reported, of which 50% (46) were associated with influenza A.
  • Less than five pediatric deaths have been reported.
Figure 8 – Number of pediatric (≤16 years of age) hospitalizations reported by the IMPACT network, by week, Canada, weeks 2019-35 to 2020-05
fig8-eng.jpg


The shaded area represents the maximum and minimum number of cases reported by week from seasons 2014-15 to 2018-19 Figure 8 - Text equivalentFigure 9 - Cumulative number of pediatric hospitalizations (≤16 years of age) with influenza by age-group reported by the IMPACT network, Canada, weeks 2020-01 to 2020-05
fig9-eng.jpg
Figure 9 - Text Description[h=3]Adult Influenza Hospitalizations and Deaths[/h]
Surveillance of laboratory-confirmed influenza-associated adult (≥16 years of age) hospitalizations by the Canadian Immunization Research Network (CIRN) Serious Outcomes Surveillance (SOS) network began on November 1st for the 2019-20 season. In week 05, the number of cases increased slightly, interrupting a recent declining trend.

To date this season, 474 hospitalizations, 33 intensive care unit admissions, and 14 deaths have been reported (Figure 10).
  • The majority of hospitalizations have been due to influenza A (85%), and among those subtyped (112) 92% were influenza A(H1N1).
  • Among cases with influenza A, the largest proportion of hospitalizations were in adults 65-79 years of age (32%) and adults 80 years of age and older (30%). Among the 72 cases with influenza B, 38% were between 16 and 34 years of age and 39% were 65 years of age and older (Figure 11).
  • 73% of hospitalized cases reported at least one type of comorbid condition.
Figure 10 - Number of adult hospitalizations (≥16 years of age) with influenza reported by the CIRN-SOS network, by week, Canada, weeks 2019-35 to 2020-05
fig10-eng.jpg
Figure 10 - Text DescriptionFigure 11 - Cumulative numbers of adult hospitalizations (≥16 years of age) with influenza, by age-group, reported by the CIRN-SOS network, Canada, weeks 2019-35 to 2020-05
fig11-eng.jpg
Figure 11 - Text Description[h=2]Influenza Strain Characterizations[/h]
From September 1, 2019 to February 6, 2020, the National Microbiology Laboratory (NML) has characterized 555 influenza viruses (235 A(H1N1), 145 A(H3N2) and 175 influenza B) that were received from Canadian laboratories. [h=3]Influenza A(H3N2)[/h]
Over recent years, circulating strains of A(H3N2) have evolved, and are increasingly difficult to characterize by hemagglutination inhibition (HI) assay. Genetic characterization is established by sequencing the hemagglutinin (HA) gene of the influenza viruses to compare their genetic properties. [h=3]Antigenic Characterization:[/h]
Among the 41 influenza A(H3N2) viruses antigenically characterized to date, the majority (85%) showed reduced titer by HI assay to A Kansas/14/2017 using antiserum raised against egg-propagated A Kansas/14/2017. Six viruses were characterized as A Kansas/14/2017-like (Figure 12 a). [h=3]Genetic Characterization:[/h]
Nearly all (98%) of the 135 A(H3N2) viruses genetically characterized this season belonged to genetic group 3C.2a1b based on sequence analysis of the HA gene. Three viruses belonged to the genetic group 3C.3a (Figure 13).

Group 3C.2a1b viruses analysed represent:
  • 90% (28 out of 31) viruses that were also antigenically characterized.
  • 100% (104 out of 104) viruses which did not grow to sufficient hemagglutination titer for antigenic characterization by HI assay.
A/Kansas/14/2017 belongs to genetic group 3C.3a and is the influenza A(H3N2) component of the 2019-20 Northern Hemisphere influenza vaccine. [h=3]Influenza A(H1N1)[/h]
Among the 235 A(H1N1) viruses characterized to date, 62% were antigenically similar to A/Brisbane/02/2018 by HI testing using antiserum raised against egg-propagated A/Brisbane/02/2018 (Figure 12 b).

A/Brisbane/02/2018 is the influenza A(H1N1) component of the 2019-20 Northern Hemisphere influenza vaccine. [h=3]Influenza B[/h]
Among the 175 influenza B viruses antigenically characterized this season, the vast majority (173) belonged to the B/Victoria lineage. Two viruses were antigenically characterized as similar to B/Phuket/3073/2013 (B/Yamagata lineage).

The majority (91%, 157) of B/Victoria lineage viruses showed reduced titer by HI assay to B/Colorado/06/2017 using antiserum raised against cell culture-propagated B/Colorado/06/2017 (Figure 12 c).

Sequence analysis of 105 B/Victoria lineage viruses with reduced titre to B/Colorado/06/2017 showed that 100% had a three amino acid deletion (162-164) in the HA gene. Sequencing is pending for the remaining viruses.

The recommended influenza B components for the 2019-20 Northern Hemisphere influenza vaccine are B/Colorado/06/2017 (Victoria lineage) and B/Phuket/3073/2013 (Yamagata lineage). B/Phuket/3073/2013 is included in the quadrivalent influenza vaccine. Figure 12 - Distribution of antigenic phenotypes among characterized influenza viruses, Canada, September 1, 2019 to February 6, 2020
fig12-eng.jpg
Figure 12 - Text DescriptionFigure 13 - Distribution of genetic clades among characterized A(H3N2) influenza viruses, Canada, September 1, 2019 to February 6, 2020
fig13-eng.jpg
Figure 13 - Text Description[h=2]Antiviral Resistance[/h]
The National Microbiology Laboratory (NML) also tests influenza viruses received from Canadian laboratories for antiviral resistance. From September 1, 2019 to February 6, 2020, the following results were reported: [h=3]Oseltamivir:[/h]
371 influenza viruses (132 A(H3N2), 117 A(H1N1) and 122 B) were tested for resistance to oseltamivir:
  • All influenza A(H3N2) and B viruses were sensitive to oseltamivir.
  • Among the A(H1N1) viruses tested, 116 (99%) were sensitive to oseltamivir and one virus was resistant to oseltamivir with the H275Y mutation in the neuraminidase gene.
[h=3]Zanamivir:[/h]
371 influenza viruses (132 A(H3N2), 117 A(H1N1) and 122 B) were tested for resistance to zanamivir:
  • All influenza viruses tested were sensitive to zanamivir.
...
https://www.canada.ca/en/public-hea...-2020/week-05-january-26-february-1-2020.html
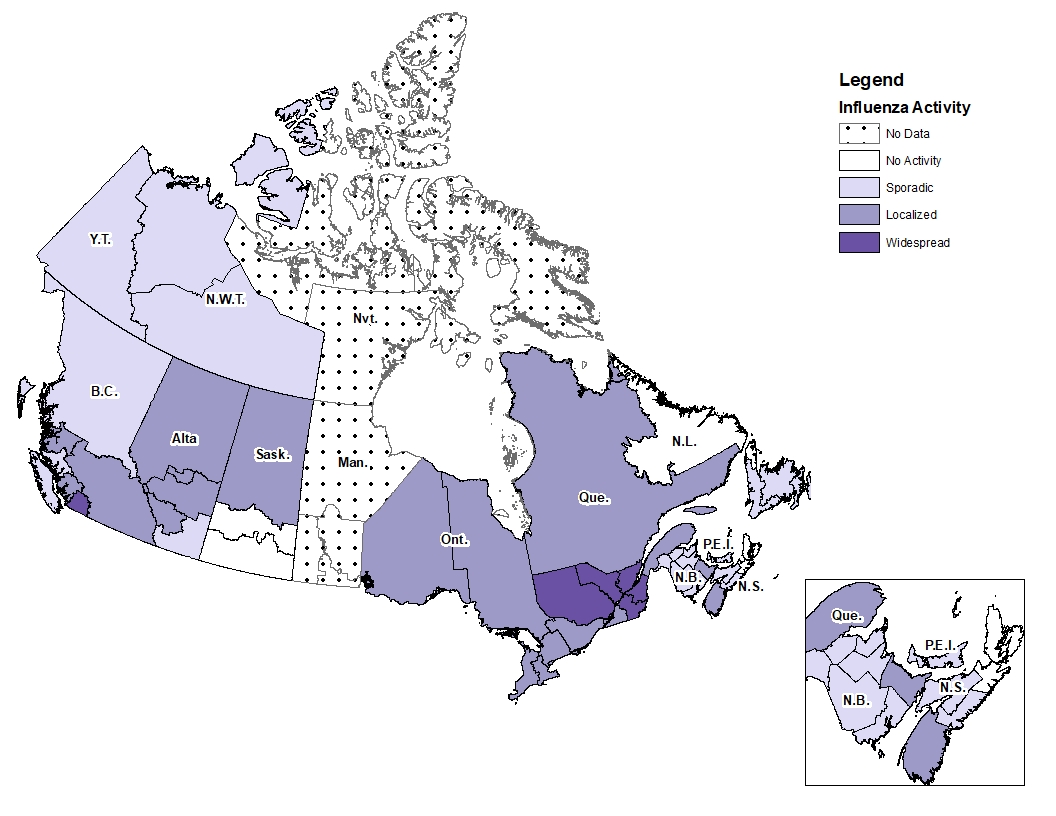
 
[h=1]FluWatch report: February 2 to 8, 2020 (week 06)[/h]
fw-w06-20.jpg


Download the alternative format
(PDF format, 1297 KB, 13 pages)

Organization: Public Health Agency of Canada

Date published: 2020-02-14[h=3]Related Topics[/h]
[h=2]Overall Summary[/h]
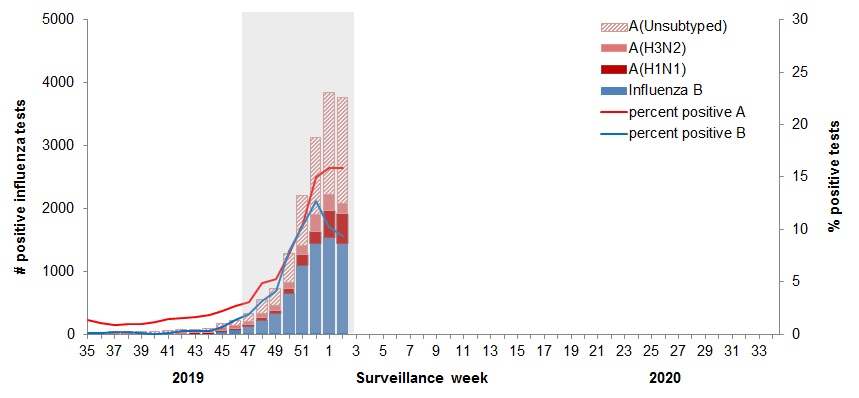
  • Influenza activity remained high in week 06; however, the majority of indicators remained similar or decreased slightly from the previous week.
  • Influenza A and B continue to co-circulate in almost equal proportions.
  • Influenza A(H1N1) is currently the dominant influenza A subtype circulating in Canada, representing 85% of subtyped influenza A specimens in week 06.
  • The highest cumulative hospitalization rates are among children under 5 years of age and adults 65 years of age and older.
[h=2]On this page[/h]
[h=2]Influenza/Influenza-like Illness (ILI) Activity (geographic spread)[/h]
During week 06, influenza activity was reported in all regions (50) in all reporting provinces and territories. Among these regions, 50% reported sporadic activity, 48% reported localized activity, and 2% reported widespread activity (Figure 1). Figure 1 – Map of influenza/ILI activity by province and territory, Canada, week 2020-06

Number of Regions Reporting in Week 06: 50 out of 53
fig1-eng.jpg
Figure 1 - Text equivalent[h=2]Laboratory-Confirmed Influenza Detections[/h]
In week 06, the percentage of laboratory tests positive for influenza was similar to the previous week at 30% and remains above the previous peak reported in late December. Influenza A and B continue to co-circulate; however, in many regions in Canada (except the Atlantic Provinces and Quebec), influenza A is circulating at higher levels than influenza B.

The following results were reported from sentinel laboratories across Canada (Figures 2 and 3):
  • The percentage of tests positive for influenza B was 14% in week 06. This continues to be three times greater than the average (4.6%) for this time of year.
  • The percentage of tests positive for influenza A was 15% in week 06, which is average for this time of year.
  • Among subtyped influenza A detections, influenza A(H1N1) accounted for 85% of detections, up from 83% in week 05.
To date this season (weeks 35 to 06), 33,615 laboratory detections of influenza were reported:
  • 57% (19,189) were influenza A.
  • Among subtyped influenza A detections (4,871), A(H1N1) is the predominant subtype this season (63%).
Detailed information on age and type/subtype has been received for 25,844 laboratory-confirmed influenza cases (Table 1). To date this season (weeks 35 to 06):
  • Among cases of influenza A(H3N2) (1,590), the largest proportion were in adults 65 years of age and older (46%).
  • Cases of influenza B (11,905) were primarily in younger age groups; 57% of cases were under 19 years of age and 31% between 20 and 44 years of age.
  • Among cases of influenza A(H1N1) (2,103), 30% of cases were in adults 65 years of age and older, with approximately equal proportions in adults 20-44 years and 45-64 years (~25%).
For more detailed weekly and cumulative influenza data, see the text descriptions for Figures 2 and 3 or the Respiratory Virus Detections in Canada Report. Figure 2 - Number of positive influenza tests and percentage of tests positive, by type, subtype and report week, Canada, weeks 2019-35 to 2020-06

Number of Laboratories Reporting in Week 06: 36 out of 36
fig2-eng.jpg


The shaded area indicates weeks where the positivity rate was at least 5% and a minimum of 15 positive tests were observed, signalling the period of seasonal influenza activity. Figure 2 - Text equivalentFigure 3 – Distribution of positive influenza specimens by type/subtype and province/territory[SUP]Footnote*[/SUP], Canada, weeks 2019-35 to 2020-06
fig3-eng.jpg
Footnote * Specimens from NWT, YT, and Nvt are sent to reference laboratories in other provinces.

Return to footnote*referrer Figure 3 - Text equivalent
0-4220725115418022648485519%
5-19146614220211224143560922%
20-44294355325021403628657125%
45-6426755172481910659333413%
65+46486407363272827547521%
Total1393921031590102461190525844100%

Table 1 - Cumulative numbers of positive influenza specimens by type, subtype and age group reported through case-based laboratory reporting, Canada, weeks 2020-01 to 2020-06
Age groups
(years) Cumulative (August 25, 2019 to February 8, 2020)
Influenza A B Influenza A and B
A Total A(H1N1) A(H3N2) A (Un subtyped)[SUP] Table 1 Footnote1 [/SUP] Total # %
[TD="colspan: 8"] Table 1 Footnote 1 Unsubtyped: The specimen was typed as influenza A, but no result for subtyping was available.

Table 1 Return to footnote1referrer [/TD]
[h=2]Syndromic / Influenza-like Illness Surveillance[/h] [h=3]Healthcare Professionals Sentinel Syndromic Surveillance[/h]
In week 06, 1.9% of visits to healthcare professionals were due to influenza-like illness (ILI) which is below the average for this time of year (Figure 4). Figure 4 – Percentage of visits for ILI reported by sentinels by report week, Canada, weeks 2019-35 to 2020-06
Number of Sentinels Reporting in Week 06: 86

fig4-eng.jpg


The shaded area represents the maximum and minimum percentage of visits for ILI reported by week from seasons 2014-2015 to 2018-2019 Figure 4 - Text equivalent[h=2]FluWatchers[/h]
The proportion of FluWatchers participants reporting symptoms of cough and fever decreased in week 06 compared to the previous week. In week 06, 3,170 participants reported to FluWatchers, of which 3.1% (98) reported symptoms of cough and fever (Figure 5).

Among the 98 participants who reported cough and fever:
  • 23% consulted a healthcare professional;
  • 83% reported days missed from work or school, resulting in a combined total of 267 missed days of work or school.
If you are interested in becoming a FluWatcher, sign up today. Figure 5 - Percentage of participants reporting fever and cough, Canada, weeks 2019-40 to 2020-06
Number of Participants Reporting in Week 06: 3,170
fig5-eng.jpg
Figure 5 - Text equivalent
Online Figure – Geographic distribution of FluWatchers participants reporting cough and fever, Canada, week 2020-06

Click on the map to access the link
map
[h=2]Influenza Outbreak Surveillance[/h]
In week 06, a total of 26 outbreaks were reported: 8 in long term care facilities, 7 in acute care facilities, 11 in facilities categorized as ‘other’, which includes facilities such as private personal care homes, correctional facilities, and colleges/universities (Figure 6). In addition, 24 ILI outbreaks in schools/daycares were reported.

ToTo date this season, a total of 626 laboratory-confirmed influenza outbreaks have been reported; 60% (376) in long-term care facilities, 26% (160) in facilities categorized as ‘other’, 12% (74) in acute care facilities, and 3% (16) in schools/daycares. Of the 593 outbreaks where influenza type was reported, 90% (531) were due to influenza A. Among the 247 outbreaks for which the influenza A subtype was reported, 53% (131) were associated with A(H3N2). To date this season, 103 ILI outbreaks in schools/daycares have also been reported. Figure 6 – Number of new outbreaks of laboratory-confirmed influenza by report week, Canada, weeks 2019-35 to 2020-06
Number of provinces and territories reporting in week 06: 12 out of 13

fig6-eng.jpg
Figure 6 - Text equivalent[h=2]Severe Outcomes Influenza Surveillance[/h]
Provincial/Territorial Influenza Hospitalizations and Deaths

To date this season, 1,553 influenza-associated hospitalizations were reported by participating provinces and territories1.
  • 65% of the cases were associated with influenza A.
  • Of the 736 cases for which subtype was reported, 63% were associated with influenza A(H3N2).
  • The highest cumulative hospitalization rates up to week 06 were among children under 5 years of age (50/100,000 population). and adults 65 years of age and older (49/100,000 population).
152 ICU admissions and 46 deaths have been reported.
  • 61% of the ICU admissions and 74% of the deaths were associated with influenza A.
Figure 7 – Cumulative rates of influenza-associated hospitalizations by age-group and surveillance week, Canada, participating provinces and territories[SUP]Footnote1[/SUP] weeks 2019-35 to 2020-06
Number of provinces and territories reporting in week 06: 9 out of 9

fig7-eng.jpg
Footnote ‡ Influenza-associated hospitalizations are reported by Alberta, Manitoba, New Brunswick, Newfoundland and Labrador, Northwest Territories, Nova Scotia, Prince Edward Island and Yukon. Only hospitalizations that require intensive medical care are reported by Saskatchewan.

Return to footnote1referrer Figure 7 - Text equivalent[h=3]Pediatric Influenza Hospitalizations and Deaths[/h]
In week 06, 111 pediatric (≤16 years of age) laboratory-confirmed influenza-associated hospitalizations were reported by the Immunization Monitoring Program Active (IMPACT) network (Figure 8). The number of cases due to influenza B remains high; however, in recent weeks, a growing proportion of cases have been due to influenza A.

The elevated number of cases this season compared to previous seasons is likely due to the concurrent circulation of influenza A and B. The number of influenza A-associated pediatric hospitalizations is above the average for this time of year which is expected when A(H1N1) is the predominant circulating virus. The number of hospitalizations with influenza B remains well above average compared to previous seasons.

To date this season (weeks 35 to 06):
  • 883 pediatric hospitalizations have been reported by the IMPACT network, of which 51% (449) were associated with influenza A and 49% (434) with influenza B.
  • The largest proportion of hospitalizations (65%) were among children under 5 years of age (Figure 9).
  • Among cases in children under 5 years of age (578), 56% were associated with influenza A, compared to cases in children 5 to 16 years of age (305), among whom 60% were associated with influenza B.
  • 127 ICU admissions were reported, of which 53% were associated with influenza A.
  • Less than five pediatric deaths have been reported.
Figure 8 – Number of pediatric (≤16 years of age) hospitalizations reported by the IMPACT network, by week, Canada, weeks 2019-35 to 2020-06
fig8-eng.jpg


The shaded area represents the maximum and minimum number of cases reported by week from seasons 2014-15 to 2018-19 Figure 8 - Text equivalentFigure 9 - Cumulative number of pediatric hospitalizations (≤16 years of age) with influenza by age-group reported by the IMPACT network, Canada, weeks 2020-01 to 2020-06
fig9-eng.jpg
Figure 9 - Text Description[h=3]Adult Influenza Hospitalizations and Deaths[/h]
Surveillance of laboratory-confirmed influenza-associated adult (≥16 years of age) hospitalizations by the Canadian Immunization Research Network (CIRN) Serious Outcomes Surveillance (SOS) network began on November 1[SUP]st[/SUP] for the 2019-20 season.

To date this season, 533 hospitalizations, 49 intensive care unit admissions, and 25 deaths have been reported (Figure 10).
  • The majority of hospitalizations have been due to influenza A (83%), and among those subtyped (148) 92% were influenza A(H1N1).
  • Among cases with influenza A, the largest proportion of hospitalizations were in adults 65-79 years of age (34%) and adults 80 years of age and older (32%). Among the 88 cases with influenza B, 34% were between 16 and 34 years of age (Figure 11).
  • 86% of hospitalized cases reported at least one type of comorbid condition.
Figure 10 - Number of adult hospitalizations (≥16 years of age) with influenza reported by the CIRN-SOS network, by week, Canada, weeks 2019-35 to 2020-06
fig10-eng.jpg
Figure 10 - Text DescriptionFigure 11 - Cumulative numbers of adult hospitalizations (≥16 years of age) with influenza, by age-group, reported by the CIRN-SOS network, Canada, weeks 2019-35 to 2020-06
fig11-eng.jpg
Figure 11 - Text Description[h=2]Influenza Strain Characterizations[/h]
From September 1, 2019 to February 6, 2020, the National Microbiology Laboratory (NML) has characterized 555 influenza viruses (235 A(H1N1), 145 A(H3N2) and 175 influenza B) that were received from Canadian laboratories. [h=3]Influenza A(H3N2)[/h]
Over recent years, circulating strains of A(H3N2) have evolved, and are increasingly difficult to characterize by hemagglutination inhibition (HI) assay. Genetic characterization is established by sequencing the hemagglutinin (HA) gene of the influenza viruses to compare their genetic properties. [h=3]Antigenic Characterization:[/h]
Among the 41 influenza A(H3N2) viruses antigenically characterized to date, the majority (85%) showed reduced titer by HI assay to A Kansas/14/2017 using antiserum raised against egg-propagated A Kansas/14/2017. Six viruses were characterized as A Kansas/14/2017-like (Figure 12 a). [h=3]Genetic Characterization:[/h]
Nearly all (98%) of the 135 A(H3N2) viruses genetically characterized this season belonged to genetic group 3C.2a1b based on sequence analysis of the HA gene. Three viruses belonged to the genetic group 3C.3a (Figure 13).

Group 3C.2a1b viruses analysed represent:
  • 90% (28 out of 31) viruses that were also antigenically characterized.
  • 100% (104 out of 104) viruses which did not grow to sufficient hemagglutination titer for antigenic characterization by HI assay.
A/Kansas/14/2017 belongs to genetic group 3C.3a and is the influenza A(H3N2) component of the 2019-20 Northern Hemisphere influenza vaccine. [h=3]Influenza A(H1N1)[/h]
Among the 235 A(H1N1) viruses characterized to date, 62% were antigenically similar to A/Brisbane/02/2018 by HI testing using antiserum raised against egg-propagated A/Brisbane/02/2018 (Figure 12 b).

A/Brisbane/02/2018 is the influenza A(H1N1) component of the 2019-20 Northern Hemisphere influenza vaccine. [h=3]Influenza B[/h]
Among the 175 influenza B viruses antigenically characterized this season, the vast majority (173) belonged to the B/Victoria lineage. Two viruses were antigenically characterized as similar to B/Phuket/3073/2013 (B/Yamagata lineage).

The majority (91%, 157) of B/Victoria lineage viruses showed reduced titer by HI assay to B/Colorado/06/2017 using antiserum raised against cell culture-propagated B/Colorado/06/2017 (Figure 12 c).

Sequence analysis of 105 B/Victoria lineage viruses with reduced titre to B/Colorado/06/2017 showed that 100% had a three amino acid deletion (162-164) in the HA gene. Sequencing is pending for the remaining viruses.

The recommended influenza B components for the 2019-20 Northern Hemisphere influenza vaccine are B/Colorado/06/2017 (Victoria lineage) and B/Phuket/3073/2013 (Yamagata lineage). B/Phuket/3073/2013 is included in the quadrivalent influenza vaccine. Figure 12 - Distribution of antigenic phenotypes among characterized influenza viruses, Canada, September 1, 2019 to February 6, 2020
fig12-eng.jpg
Figure 12 - Text DescriptionFigure 13 - Distribution of genetic clades among characterized A(H3N2) influenza viruses, Canada, September 1, 2019 to February 6, 2020
fig13-eng.jpg
Figure 13 - Text Description[h=2]Antiviral Resistance[/h]
The National Microbiology Laboratory (NML) also tests influenza viruses received from Canadian laboratories for antiviral resistance. From September 1, 2019 to February 6, 2020, the following results were reported: [h=3]Oseltamivir:[/h]
371 influenza viruses (132 A(H3N2), 117 A(H1N1) and 122 B) were tested for resistance to oseltamivir:
  • All influenza A(H3N2) and B viruses were sensitive to oseltamivir.
  • Among the A(H1N1) viruses tested, 116 (99%) were sensitive to oseltamivir and one virus was resistant to oseltamivir with the H275Y mutation in the neuraminidase gene.
[h=3]Zanamivir:[/h]
371 influenza viruses (132 A(H3N2), 117 A(H1N1) and 122 B) were tested for resistance to zanamivir:
  • All influenza viruses tested were sensitive to zanamivir.
[h=3]Amantadine:[/h]
High levels of resistance to amantadine persist among influenza A(H1N1) and influenza A(H3N2) viruses. All viruses tested this season were resistant.

...
https://www.canada.ca/en/public-hea...atch/2019-2020/week-06-february-2-8-2020.html
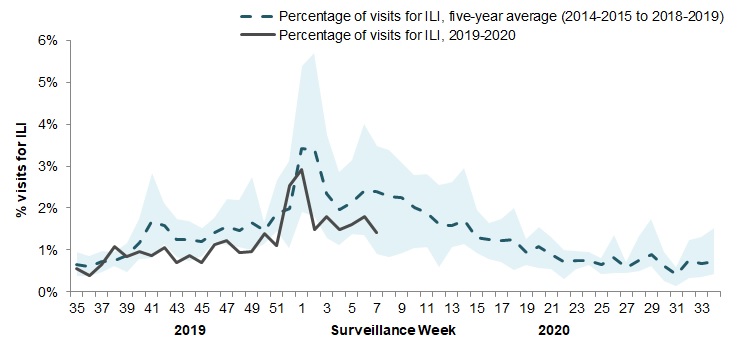
 
[h=1]FluWatch report: February 9 to 15, 2020 (week 07)[/h]
fw-w07-20.jpg


Download the alternative format
(PDF format, 737 KB, 13 pages)

Organization: Public Health Agency of Canada

Date published: 2020-02-21[h=3]Related Topics[/h]
[h=2]Overall Summary[/h]
  • Influenza activity remained high in week 07; however, the majority of indicators remained similar or decreased slightly from the previous week.
  • Influenza A(H1N1) is currently the dominant influenza A subtype circulating in Canada, representing 83% of subtyped influenza A specimens in week 07.
  • The highest cumulative hospitalization rates are among children under 5 years of age and adults 65 years of age and older.
  • The Sentinel Practitioner Surveillance Network (SPSN) has published interim estimates of vaccine effectiveness which indicate that the 2019/2020 influenza vaccine has provided substantial protection against medically-attended influenza illness in the early part of the season in Canada. Within-season vaccine effectiveness (VE) was estimated to be 58% for any influenza, 44% for A(H1N1), 62% for A(H3N2), and 69% for influenza B.
[h=2]On this page[/h]
[h=2]Influenza/Influenza-like Illness (ILI) Activity (geographic spread)[/h]
During week 07, influenza activity was reported in almost all regions (44 out of 45) in reporting provinces and territories. Among these regions, 40% reported sporadic activity, 56% reported localized activity, and 2% reported widespread activity (Figure 1). Figure 1 – Map of influenza/ILI activity by province and territory, Canada, week 2020-07

Number of Regions Reporting in Week 07: 45 out of 53
fig1-eng.jpg
Figure 1 - Text equivalent[h=2]Laboratory-Confirmed Influenza Detections[/h]
In week 07, the percentage of laboratory tests positive for influenza was similar to the previous two weeks at 29% and remains similar to the peak percentages reported since late December. Influenza A and B continue to co-circulate.

The following results were reported from sentinel laboratories across Canada (Figures 2 and 3):
  • The percentage of tests positive for influenza B was 13% in week 07. This continues to be more than two times the average (5.3%) for this time of year.
  • The percentage of tests positive for influenza A was 16% in week 07, which is similar to the previous six weeks, and below average for this time of year.
  • Among subtyped influenza A detections, influenza A(H1N1) accounted for 83% of detections, a similar proportion to the previous two weeks.
To date this season (weeks 35 to 07), 38,671 laboratory detections of influenza were reported
  • 57% (22,035) were influenza A.
  • Among subtyped influenza A detections (5,279), A(H1N1) is the predominant subtype this season (64%).
Detailed information on age and type/subtype has been received for 30,142 laboratory-confirmed influenza cases (Table 1). To date this season (weeks 35 to 07):
  • Among cases of influenza A(H3N2) (1,662), the largest proportion was in adults 65 years of age and older (46%).
  • Cases of influenza B (13,795) were primarily in younger age groups; 57% of cases were under 19 years of age and 30% between 20 and 44 years of age.
  • Among cases of influenza A(H1N1) (2,414), 30% of cases were in adults 65 years of age and older, with approximately equal proportions in adults 20-44 years and 45-64 years (~25%).
For more detailed weekly and cumulative influenza data, see the text descriptions for Figures 2 and 3 or the Respiratory Virus Detections in Canada Report. Figure 2 - Number of positive influenza tests and percentage of tests positive, by type, subtype and report week, Canada, weeks 2019-35 to 2020-07

Number of Laboratories Reporting in Week 07: 35 out of 36
fig2-eng.jpg


The shaded area indicates weeks where the positivity rate was at least 5% and a minimum of 15 positive tests were observed, signalling the period of seasonal influenza activity. Figure 2 - Text equivalentFigure 3 – Distribution of positive influenza specimens by type/subtype and province/territory[SUP]Footnote*[/SUP], Canada, weeks 2019-35 to 2020-07
fig3-eng.jpg
Footnote * Specimens from NWT, YT, and Nvt are sent to reference laboratories in other provinces.

Return to footnote*referrer Figure 3 - Text equivalent
0-4264528716221963118576319%
5-19184316821514604804664722%
20-44345162426325644157760825%
45-6431646082522304764392813%
65+52447277703747952619621%
Total1634724141662122711379530142100%

Table 1 - Cumulative numbers of positive influenza specimens by type, subtype and age group reported through case-based laboratory reporting, Canada, weeks 2019-35 to 2020-07
Age groups
(years) Cumulative (August 25, 2019 to February 15, 2020)
Influenza A B Influenza A and B
A Total A(H1N1) A(H3N2) A (Un subtyped)[SUP] Table 1 Footnote1 [/SUP] Total # %
[TD="colspan: 8"] Table 1 Footnote 1 Unsubtyped: The specimen was typed as influenza A, but no result for subtyping was available.

Table 1 Return to footnote1referrer [/TD]
[h=2]Syndromic / Influenza-like Illness Surveillance[/h] [h=3]Healthcare Professionals Sentinel Syndromic Surveillance[/h]
In week 07, 1.4% of visits to healthcare professionals were due to influenza-like illness (ILI) which is below the average for this time of year (Figure 4). Figure 4 – Percentage of visits for ILI reported by sentinels by report week, Canada, weeks 2019-35 to 2020-07
Number of Sentinels Reporting in Week 07: 90

fig4-eng.jpg


The shaded area represents the maximum and minimum percentage of visits for ILI reported by week from seasons 2014-2015 to 2018-2019 Figure 4 - Text equivalent[h=2]FluWatchers[/h]
The proportion of FluWatchers participants reporting symptoms of cough and fever decreased in week 07 compared to the previous week. In week 07, 3,044 participants reported to FluWatchers, of which 2.6% (79) reported symptoms of cough and fever (Figure 5).

Among the 79 participants who reported cough and fever:
  • 22% consulted a healthcare professional;
  • 66% reported days missed from work or school, resulting in a combined total of 187 missed days of work or school.
If you are interested in becoming a FluWatcher, sign up today. Figure 5 - Percentage of participants reporting fever and cough, Canada, weeks 2019-40 to 2020-07
Number of Participants Reporting in Week 07: 3,044
fig5-eng.jpg
Figure 5 - Text equivalent
Online Figure – Geographic distribution of FluWatchers participants reporting cough and fever, Canada, week 2020-07

Click on the map to access the link
map
[h=2]Influenza Outbreak Surveillance[/h]
In week 07, a total of 31 outbreaks were reported: 20 in long term care facilities, 10 in facilities categorized as ‘other', which includes facilities such as private personal care homes, correctional facilities, and colleges/universities, and one in a school/daycare (Figure 6). In addition, 7 ILI outbreaks in schools/daycares were reported.

To date this season, a total of 702 laboratory-confirmed influenza outbreaks have been reported; 61% (430) in long-term care facilities, 26% (185) in facilities categorized as ‘other’, 11% (74) in acute care facilities, and 2% (13) in schools/daycares. Of the 668 outbreaks where influenza type was reported, 88% (588) were due to influenza A. Among the 264 outbreaks for which the influenza A subtype was reported, 52% (136) were associated with A(H3N2). To date this season, 119 ILI outbreaks in schools/daycares have also been reported. Figure 6 – Number of new outbreaks of laboratory-confirmed influenza by report week, Canada, weeks 2019-35 to 2020-07
Number of provinces and territories reporting in week 07: 11 out of 13

fig6-eng.jpg
Figure 6 - Text equivalent[h=2]Severe Outcomes Influenza Surveillance[/h]
Provincial/Territorial Influenza Hospitalizations and Deaths

To date this season, 1,687 influenza-associated hospitalizations were reported by participating provinces and territories1.
  • 65% of the cases were associated with influenza A.
  • Of the 786 cases for which subtype was reported, 61% were associated with influenza A(H3N2).
  • The highest cumulative hospitalization rates up to week 07 were among children under 5 years of age and adults 65 years of age and older (54/100,000 population).
189 ICU admissions and 64 deaths have been reported.
  • 65% of the ICU admissions and 72% of the deaths were associated with influenza A.
Figure 7 – Cumulative rates of influenza-associated hospitalizations by age-group and surveillance week, Canada, participating provinces and territories[SUP]Footnote1[/SUP] weeks 2019-35 to 2020-07
Number of provinces and territories reporting in week 07: 8 out of 9

fig7-eng.jpg
Footnote ‡ Influenza-associated hospitalizations are reported by Alberta, Manitoba, New Brunswick, Newfoundland and Labrador, Northwest Territories, Nova Scotia, Prince Edward Island and Yukon. Only hospitalizations that require intensive medical care are reported by Saskatchewan.

Return to footnote1referrer Figure 7 - Text equivalent[h=3]Pediatric Influenza Hospitalizations and Deaths[/h]
In week 07, 69 pediatric (≤16 years of age) laboratory-confirmed influenza-associated hospitalizations were reported by the Immunization Monitoring Program Active (IMPACT) network (Figure 8). The number of cases due to influenza B remains high; however, in recent weeks, a growing proportion of cases have been due to influenza A.

The elevated number of cases this season compared to previous seasons is likely due to the concurrent circulation of influenza A and B. The number of influenza A-associated pediatric hospitalizations is above the average for this time of year which is expected when A(H1N1) is the predominant circulating virus. The number of hospitalizations with influenza B remains well above average compared to previous seasons.

To date this season (weeks 35 to 07):
  • 951 pediatric hospitalizations have been reported by the IMPACT network, of which 51% (483) were associated with influenza A and 49% (468) with influenza B.
  • The largest proportion of hospitalizations (65%) were among children under 5 years of age (Figure 9).
  • 140 ICU admissions were reported, of which 52% were associated with influenza A.
  • Less than five pediatric deaths have been reported.
Figure 8 – Number of pediatric (≤16 years of age) hospitalizations reported by the IMPACT network, by week, Canada, weeks 2019-35 to 2020-07
fig8-eng.jpg


The shaded area represents the maximum and minimum number of cases reported by week from seasons 2014-15 to 2018-19 Figure 8 - Text equivalentFigure 9 - Cumulative number of pediatric hospitalizations (≤16 years of age) with influenza by age-group reported by the IMPACT network, Canada, weeks 2019-35 to 2020-07
fig9-eng.jpg
Figure 9 - Text Description[h=3]Adult Influenza Hospitalizations and Deaths[/h]
Surveillance of laboratory-confirmed influenza-associated adult (≥16 years of age) hospitalizations by the Canadian Immunization Research Network (CIRN) Serious Outcomes Surveillance (SOS) network began on November 1[SUP]st[/SUP] for the 2019-20 season.

To date this season, 581 hospitalizations, 53 intensive care unit admissions, and 25 deaths have been reported (Figure 10).
  • The majority of hospitalizations have been due to influenza A (82%), and among those subtyped (162) 91% were influenza A(H1N1).
  • Among the 476 cases with influenza A, the largest proportion of hospitalizations were in adults 65-79 years of age (35%) and adults 80 years of age and older (32%). Among the 103 cases with influenza B, 33% were between 16 and 34 years of age (Figure 11).
  • 87% of hospitalized cases reported at least one type of comorbid condition.
Figure 10 - Number of adult hospitalizations (≥16 years of age) with influenza reported by the CIRN-SOS network, by week, Canada, weeks 2019-35 to 2020-07
fig10-eng.jpg
Figure 10 - Text DescriptionFigure 11 - Cumulative numbers of adult hospitalizations (≥16 years of age) with influenza, by age-group, reported by the CIRN-SOS network, Canada, weeks 2019-35 to 2020-07
fig11-eng.jpg
Figure 11 - Text Description[h=2]Influenza Strain Characterizations[/h]
From September 1, 2019 to February 20, 2020, the National Microbiology Laboratory (NML) has characterized 692 influenza viruses (355 A(H1N1), 155 A(H3N2) and 182 influenza B) that were received from Canadian laboratories. [h=3]Influenza A(H3N2)[/h]
Over recent years, circulating strains of A(H3N2) have evolved, and are increasingly difficult to characterize by hemagglutination inhibition (HI) assay. Genetic characterization is established by sequencing the hemagglutinin (HA) gene of the influenza viruses to compare their genetic properties. [h=3]Antigenic Characterization:[/h]
Among the 51 influenza A(H3N2) viruses antigenically characterized to date, the majority (80%) showed reduced titer by HI assay to A Kansas/14/2017 using antiserum raised against egg-propagated A Kansas/14/2017. Ten viruses were characterized as A Kansas/14/2017-like (Figure 12 a). [h=3]Genetic Characterization:[/h]
Nearly all (98%) of the 135 A(H3N2) viruses genetically characterized this season belonged to genetic group 3C.2a1b based on sequence analysis of the HA gene. Three viruses belonged to the genetic group 3C.3a (Figure 13).

Group 3C.2a1b viruses analysed represent:
  • 90% (28 out of 31) viruses that were also antigenically characterized.
  • 100% (104 out of 104) viruses which did not grow to sufficient hemagglutination titer for antigenic characterization by HI assay.
A/Kansas/14/2017 belongs to genetic group 3C.3a and is the influenza A(H3N2) component of the 2019-20 Northern Hemisphere influenza vaccine. [h=3]Influenza A(H1N1)[/h]
Among the 355 A(H1N1) viruses characterized to date, 57% were antigenically similar to A/Brisbane/02/2018 by HI testing using antiserum raised against egg-propagated A/Brisbane/02/2018 (Figure 12 b).

A/Brisbane/02/2018 is the influenza A(H1N1)component of the 2019-20 Northern Hemisphere influenza vaccine. [h=3]Influenza B[/h]
Among the 182 influenza B viruses antigenically characterized this season, the vast majority (180) belonged to the B/Victoria lineage. Two viruses were antigenically characterized as similar to B/Phuket/3073/2013 (B/Yamagata lineage).

The majority (89%, 161) of B/Victoria lineage viruses showed reduced titer by HI assay to B/Colorado/06/2017 using antiserum raised against cell culture-propagated B/Colorado/06/2017 (Figure 12c).

Sequence analysis of 150 B/Victoria lineage viruses with reduced titre to B/Colorado/06/2017 showed that 100% had a three amino acid deletion (162-164) in the HA gene. Sequencing is pending for the remaining viruses.

The recommended influenza B components for the 2019-20 Northern Hemisphere influenza vaccine are B/Colorado/06/2017 (Victoria lineage) and B/Phuket/3073/2013 (Yamagata lineage). B/Phuket/3073/2013 is included in the quadrivalent influenza vaccine. Figure 12 - Distribution of antigenic phenotypes among characterized influenza viruses, Canada, September 1, 2019 to February 20, 2020
fig12-eng.jpg
Figure 12 - Text DescriptionFigure 13 - Distribution of genetic clades among characterized A(H3N2) influenza viruses, Canada, September 1, 2019 to February 20, 2020
fig13-eng.jpg
Figure 13 - Text Description[h=2]Antiviral Resistance[/h]
The National Microbiology Laboratory (NML) also tests influenza viruses received from Canadian laboratories for antiviral resistance. From September 1, 2019 to February 20, 2020, the following results were reported: [h=3]Oseltamivir:[/h]
486 influenza viruses (140 A(H3N2), 164 A(H1N1) and 182 B) were tested for resistance to oseltamivir:
  • All influenza A(H3N2) and B viruses were sensitive to oseltamivir.
  • Among the A(H1N1) viruses tested, 163 (99%) were sensitive to oseltamivir and one virus was resistant to oseltamivir with the H275Y mutation in the neuraminidase gene.
[h=3]Zanamivir:[/h]
486 influenza viruses (140 A(H3N2), 164 A(H1N1) and 182 B) were tested for resistance to zanamivir:
  • All influenza viruses tested were sensitive to zanamivir.
[h=3]Amantadine:[/h]
High levels of resistance to amantadine persist among influenza A(H1N1) and influenza A(H3N2) viruses. All viruses tested this season were resistant. [h=2]Vaccine Monitoring[/h]
Vaccine monitoring refers to activities related to the monitoring of influenza vaccine coverage and effectiveness. [h=3]Vaccine Effectiveness[/h]
The Canadian Sentinel Practitioner Surveillance Network (SPSN) provides estimates of the effectiveness of the seasonal influenza vaccine in preventing medically-attended illness due to laboratory-confirmed influenza among Canadians.

Based on data collected between November 1, 2019 and February 1, 2020, vaccine effectiveness (VE) was estimated to be 58% for any influenza, 44% for A(H1N1), 62% for A(H3N2), and 69% for influenza B. Substantial protection was observed among children 1 to 19 years of age against both influenza A and B. A good level of protection was also observed among working age adults (20-64 yrs) across all influenza types (Table 2). VE among adults 65 years and older, although imprecise due to small numbers, was lower at 18% (95% CI -59 to 58). The SPSN interim estimates are published and available online.

More information on the network and past VE findings can be viewed on the SPSN website.

Updated influenza vaccine effectiveness estimates will be published at the end of the 2019/2020 influenza season. At that time, sufficient data will likely be available to estimate VE by age-group, including adults 65 years and older with greater precision, as well as for influenza A subtypes.
58 (47, 66)280874 (59, 84)55 (41, 66)
49 (34, 60)212870 (44, 84)45 (25, 59)
44 (26, 58)1948
62 (37, 77)1561
69 (57, 77)208077 (59, 87)68 (51, 79)

Table 2 – Vaccine effectiveness estimates against medically-attended influenza illness, SPSN, November 1, 2019, to February 1, 2020
All ages 1-19 years 20-64 years
VE(%) (CI)[SUP] Table 2 - Footnote* [/SUP] N VE(%) (CI)[SUP] Table 2 - Footnote* [/SUP] VE(%) (CI)[SUP] Table 2 - Footnote* [/SUP]
All Influenza
Influenza A
Influenza A(H1N1)
Influenza A(H3N2)
Influenza B
[TD="colspan: 5"]CI: 95% confidence interval Footnote * adjusted for age group, province, specimen collection interval and calendar time

Return to table 2 footnote*referrer [/TD]
[h=3]Vaccine Coverage[/h]
Influenza vaccine coverage estimates for the 2019-20 season are anticipated to be available in February or March 2020.

...

https://www.canada.ca/en/public-hea...tch/2019-2020/week-07-february-9-15-2020.html
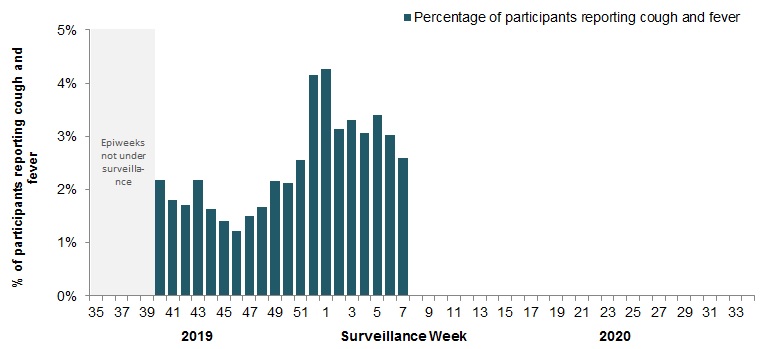
 
[h=1]FluWatch report: February 16 to 22, 2020 (week 08)[/h]
fw-w08-20-eng.jpg


Download the alternative format
(PDF format, 1.46 MB, 14 pages)

Organization: Public Health Agency of Canada

Date published: 2020-02-28[h=3]Related Topics[/h]
[h=2]Overall Summary[/h]
  • Influenza activity remained high in week 08; the majority of indicators remained similar or increased slightly from the previous week.
  • Influenza A(H1N1) is currently the dominant influenza A subtype circulating in Canada, representing 78% of subtyped influenza A specimens in week 08.
  • The highest cumulative hospitalization rates are among children under 5 years of age and adults 65 years of age and older.
  • The Sentinel Practitioner Surveillance Network (SPSN) has published interim estimates of vaccine effectiveness which indicate that the 2019/2020 influenza vaccine has provided substantial protection against medically-attended influenza illness in the early part of the season in Canada. Within-season vaccine effectiveness (VE) was estimated to be 58% for any influenza, 44% for influenza A(H1N1), 62% for influenza A(H3N2), and 69% for influenza B.
[h=2]On this page[/h]
[h=2]Influenza/Influenza-like Illness (ILI) Activity (geographic spread)[/h]
During week 08, influenza activity was reported in all regions in all reporting provinces and territories. Among these regions, 55% reported sporadic activity, 43% reported localized activity, and 2% reported widespread activity (Figure 1). Figure 1 – Map of influenza/ILI activity by province and territory, Canada, week 2020-08

Number of Regions Reporting in Week 08: 53 out of 53
fig1-eng.jpg
Figure 1 - Text equivalent[h=2]Laboratory-Confirmed Influenza Detections[/h]
In week 08, the percentage of laboratory tests positive for influenza was similar to the previous three weeks at 29% and remains similar to the peak percentages reported since late December. Influenza A and B continue to co-circulate.

The following results were reported from sentinel laboratories across Canada (Figures 2 and 3):
  • The percentage of tests positive for influenza B was 12% in week 08. This continues to be two times the average (5.6%) for this time of year.
  • The percentage of tests positive for influenza A was 17% in week 08, which is similar to the previous six weeks, and below average for this time of year.
  • Among subtyped influenza A detections, influenza A(H1N1) accounted for 78% of detections, a slight decrease in proportion to the previous two weeks.
To date this season (weeks 35 to 08), 42,291 laboratory detections of influenza were reported
  • 57% (24,139) were influenza A.
  • Among subtyped influenza A detections (5,610), A(H1N1) is the predominant subtype this season (65%).
Detailed information on age and type/subtype has been received for 32,801 laboratory-confirmed influenza cases (Table 1). To date this season (weeks 35 to 08):
  • Among cases of influenza A(H3N2) (1,735), the largest proportion was in adults 65 years of age and older (46%).
  • Cases of influenza B (14,856) were primarily in younger age groups; 57% of cases were under 19 years of age and 30% between 20 and 44 years of age.
  • Among cases of influenza A(H1N1) (2,609), 30% of cases were in adults 65 years of age and older, with approximately equal proportions in adults 20-44 years and 45-64 years (~25%).
For more detailed weekly and cumulative influenza data, see the text descriptions for Figures 2 and 3 or the Respiratory Virus Detections in Canada Report. Figure 2 - Number of positive influenza tests and percentage of tests positive, by type, subtype and report week, Canada, weeks 2019-35 to 2020-08

Number of Laboratories Reporting in Week 08: 34 out of 36
fig2-eng.jpg


The shaded area indicates weeks where the positivity rate was at least 5% and a minimum of 15 positive tests were observed, signalling the period of seasonal influenza activity. Figure 2 - Text equivalentFigure 3 – Distribution of positive influenza specimens by type/subtype and province/territory[SUP]Footnote*[/SUP], Canada, weeks 2019-35 to 2020-08
fig3-eng.jpg
Footnote * Specimens from NWT, YT, and Nvt are sent to reference laboratories in other provinces.

Return to footnote*referrer Figure 3 - Text equivalent
0-4290130517224243423632419%
5-19200418622415945108711222%
20-44379766328028544443824025%
45-6435086662582584833434113%
65+573578980141451049678421%
Total1794526091735136011485632801100%

Table 1 - Cumulative numbers of positive influenza specimens by type, subtype and age group reported through case-based laboratory reporting, Canada, weeks 2019-35 to 2020-08
Age groups
(years) Cumulative (August 25, 2019 to February 22, 2020)
Influenza A B Influenza A and B
A Total A(H1N1) A(H3N2) A (Un subtyped)[SUP] Table 1 Footnote1 [/SUP] Total # %
[TD="colspan: 8"] Table 1 Footnote 1 Unsubtyped: The specimen was typed as influenza A, but no result for subtyping was available.

Table 1 Return to footnote1referrer [/TD]
[h=2]Syndromic / Influenza-like Illness Surveillance[/h] [h=3]Healthcare Professionals Sentinel Syndromic Surveillance[/h]
In week 08, 1.5% of visits to healthcare professionals were due to influenza-like illness (ILI) which is below the average for this time of year (Figure 4). Figure 4 – Percentage of visits for ILI reported by sentinels by report week, Canada, weeks 2019-35 to 2020-08
Number of Sentinels Reporting in Week 08: 79

fig4-eng.jpg


The shaded area represents the maximum and minimum percentage of visits for ILI reported by week from seasons 2014-2015 to 2018-2019 Figure 4 - Text equivalent[h=2]FluWatchers[/h]
The proportion of FluWatchers participants reporting symptoms of cough and fever increased in week 08 compared to the previous week. In week 08, 3,131 participants reported to FluWatchers, of which 2.8% (86) reported symptoms of cough and fever (Figure 5).

Among the 86 participants who reported cough and fever:
  • 20% consulted a healthcare professional;
  • 78% reported days missed from work or school, resulting in a combined total of 215 missed days of work or school.
If you are interested in becoming a FluWatcher, sign up today. Figure 5 - Percentage of participants reporting fever and cough, Canada, weeks 2019-40 to 2020-08
Number of Participants Reporting in Week 08: 3,131
fig5-eng.jpg
Figure 5 - Text equivalent
Online Figure – Geographic distribution of FluWatchers participants reporting cough and fever, Canada, week 2020-08

Click on the map to access the link
map
[h=2]Influenza Outbreak Surveillance[/h]
In week 08, a total of 30 outbreaks were reported: 22 in long term care facilities, three in facilities categorized as ‘other’, which includes facilities such as private personal care homes, correctional facilities, and colleges/universities, four in acute care facilities and one in a school/daycare (Figure 6). In addition, 19 ILI outbreaks were reported: 17 in schools/daycares and 2 in facilities categorized as ‘other’ .

To date this season, a total of 757 laboratory-confirmed influenza outbreaks have been reported; 62% (473) in long-term care facilities, 25% (190) in facilities categorized as ‘other’, 10% (79) in acute care facilities, and 2% (15) in schools/daycares. Of the 720 outbreaks where influenza type was reported, 88% (632) were due to influenza A. Among the 272 outbreaks for which the influenza A subtype was reported, 50% were associated with A(H3N2) and 50% were associated with A(H1N1). To date this season, 140 ILI outbreaks have also been reported; 98%(137) in schools/daycares and 2%(3) in facilities categorized as ‘other’. Figure 6 – Number of new outbreaks of laboratory-confirmed influenza by report week, Canada, weeks 2019-35 to 2020-08
Number of provinces and territories reporting in week 08: 13 out of 13

fig6-eng.jpg
Figure 6 - Text equivalent[h=2]Severe Outcomes Influenza Surveillance[/h]
Provincial/Territorial Influenza Hospitalizations and Deaths

To date this season, 1,795 influenza-associated hospitalizations were reported by participating provinces and territories1.
  • 66% of the cases were associated with influenza A.
  • Of the 826 cases for which subtype was reported, 60% were associated with influenza A(H3N2).
  • The highest cumulative hospitalization rates up to week 08 were among children under 5 years of age and adults 65 years of age and older (57/100,000 population).
211 ICU admissions and 74 deaths have been reported.
  • 65% of the ICU admissions and 69% of the deaths were associated with influenza A.
Figure 7 – Cumulative rates of influenza-associated hospitalizations by age-group and surveillance week, Canada, participating provinces and territories[SUP]Footnote1[/SUP] weeks 2019-35 to 2020-08
Number of provinces and territories reporting in week 08: 9 out of 9

fig7-eng.jpg
Footnote ‡ Influenza-associated hospitalizations are reported by Alberta, Manitoba, New Brunswick, Newfoundland and Labrador, Northwest Territories, Nova Scotia, Prince Edward Island and Yukon. Only hospitalizations that require intensive medical care are reported by Saskatchewan.

Return to footnote1referrer Figure 7 - Text equivalent[h=3]Pediatric Influenza Hospitalizations and Deaths[/h]
In week 08, 84 pediatric (≤16 years of age) laboratory-confirmed influenza-associated hospitalizations were reported by the Immunization Monitoring Program Active (IMPACT) network (Figure 8). The number of cases due to influenza B remains high; however, in recent weeks, a growing proportion of cases have been due to influenza A.
The elevated number of cases this season compared to previous seasons is likely due to the concurrent circulation of influenza A and B. The number of influenza A-associated pediatric hospitalizations is above the average for this time of year which is expected when A(H1N1) is the predominant circulating virus. The number of hospitalizations with influenza B remains well above average compared to previous seasons.
To date this season (weeks 35 to 08):
  • 1037 pediatric hospitalizations have been reported by the IMPACT network, of which 51% (531) were associated with influenza A and 49% (506) with influenza B.
  • The largest proportion of hospitalizations (65%) were among children under 5 years of age (Figure 9).
  • 155 ICU admissions were reported, of which 52% were associated with influenza A.
  • Less than five pediatric deaths have been reported.
Figure 8 – Number of pediatric (≤16 years of age) hospitalizations reported by the IMPACT network, by week, Canada, weeks 2019-35 to 2020-08
fig8-eng.jpg


The shaded area represents the maximum and minimum number of cases reported by week from seasons 2014-15 to 2018-19 Figure 8 - Text equivalentFigure 9 - Cumulative number of pediatric hospitalizations (≤16 years of age) with influenza by age-group reported by the IMPACT network, Canada, weeks 2019-35 to 2020-08
fig9-eng.jpg
Figure 9 - Text Description[h=3]Adult Influenza Hospitalizations and Deaths[/h]
Surveillance of laboratory-confirmed influenza-associated adult (≥16 years of age) hospitalizations by the Canadian Immunization Research Network (CIRN) Serious Outcomes Surveillance (SOS) network began on November 1st for the 2019-20 season.

To date this season, 627 hospitalizations, 60 intensive care unit admissions, and 28 deaths have been reported (Figure 10).
  • The majority of hospitalizations have been due to influenza A (82%), and among those subtyped (162) 91% were influenza A(H1N1).
  • Among the 511 cases with influenza A, the largest proportion of hospitalizations were in adults 65-79 years of age (35%) and adults 80 years of age and older (31%). Among the 114 cases with influenza B, 31% were between 16 and 34 years of age (Figure 11).
  • 89% of hospitalized cases reported at least one type of comorbid condition.
Figure 10 - Number of adult hospitalizations (≥16 years of age) with influenza reported by the CIRN-SOS network, by week, Canada, weeks 2019-45 to 2020-08
fig10-eng.jpg
Figure 10 - Text DescriptionFigure 11 - Cumulative numbers of adult hospitalizations (≥16 years of age) with influenza, by age-group, reported by the CIRN-SOS network, Canada, weeks 2019-45 to 2020-08
fig11-eng.jpg
Figure 11 - Text Description[h=2]Influenza Strain Characterizations[/h]
From September 1, 2019 to February 27, 2020, the National Microbiology Laboratory (NML) has characterized 1157 influenza viruses (406 A(H1N1), 159 A(H3N2) and 433 influenza B) that were received from Canadian laboratories.

Influenza A(H3N2)

Over recent years, circulating strains of A(H3N2) have evolved, and are increasingly difficult to characterize by hemagglutination inhibition (HI) assay. Genetic characterization is established by sequencing the hemagglutinin (HA) gene of the influenza viruses to compare their genetic properties.

Antigenic Characterization:

Among the 55 influenza A(H3N2) viruses antigenically characterized to date, the majority (80%) showed reduced titer by HI assay to A Kansas/14/2017 using antiserum raised against egg-propagated A Kansas/14/2017. Eleven viruses were characterized as A Kansas/14/2017-like (Figure 12a). [h=3]Genetic Characterization:[/h]
Nearly all (98%) of the 135 A(H3N2) viruses genetically characterized this season belonged to genetic group 3C.2a1b based on sequence analysis of the HA gene. Three viruses belonged to the genetic group 3C.3a (Figure 13).

Group 3C.2a1b viruses analysed represent:
  • 90% (28 out of 31) viruses that were also antigenically characterized.
  • 100% (104 out of 104) viruses which did not grow to sufficient hemagglutination titer for antigenic characterization by HI assay.
A/Kansas/14/2017 belongs to genetic group 3C.3a and is the influenza A(H3N2) component of the 2019-20 Northern Hemisphere influenza vaccine. [h=3]Influenza A(H1N1)[/h]
Among the 406 A(H1N1) viruses characterized to date, 52% were antigenically similar to A/Brisbane/02/2018 by HI testing using antiserum raised against egg-propagated A/Brisbane/02/2018 (Figure 12 b).

A/Brisbane/02/2018 is the influenza A(H1N1)component of the 2019-20 Northern Hemisphere influenza vaccine. [h=3]Influenza B[/h]
Antigenic Characterization:

Among the 182 influenza B viruses antigenically characterized this season, the vast majority (180) belonged to the B/Victoria lineage. Two viruses were antigenically characterized as similar to B/Phuket/3073/2013 (B/Yamagata lineage).

The majority (89%, 161) of B/Victoria lineage viruses showed reduced titer by HI assay to B/Colorado/06/2017 using antiserum raised against cell culture-propagated B/Colorado/06/2017 (Figure 12c).

Sequence analysis of 150 B/Victoria lineage viruses with reduced titre to B/Colorado/06/2017 showed that 100% had a three amino acid deletion (162-164) in the HA gene and belong to the genetic subclade V1A-3Del. Sequencing is pending for the remaining viruses.

Genetic Characterization:

Genetic characterization was also performed on 251 B/Victoria lineage viruses. All of these viruses had a three amino acid deletion (162-164) in the HA gene and belong to the genetic subclade V1A-3Del. Viruses belonging to genetic subclade V1A-3Del are antigenically distinct from the vaccine strain B/Colorado/06/2017, which belongs to genetic subclade V1A.1.

The recommended influenza B components for the 2019-20 Northern Hemisphere influenza vaccine are B/Colorado/06/2017 (Victoria lineage) and B/Phuket/3073/2013 (Yamagata lineage). B/Phuket/3073/2013 is included in the quadrivalent influenza vaccine. The vaccine strain B/Colorado/06/2017 belongs to genetic subclade V1A.1. Figure 12 - Distribution of antigenic phenotypes among characterized influenza viruses, Canada, September 1, 2019 to February 27, 2020
fig12-eng.jpg
Figure 12 - Text DescriptionFigure 13 - Distribution of genetic clades among characterized A(H3N2) influenza viruses, Canada, September 1, 2019 to February 27, 2020
fig13-eng.jpg
Figure 13 - Text Description[h=2]Antiviral Resistance[/h]
The National Microbiology Laboratory (NML) also tests influenza viruses received from Canadian laboratories for antiviral resistance. From September 1, 2019 to February 27, 2020, the following results were reported: [h=3]Oseltamivir:[/h]
554 influenza viruses (148 A(H3N2), 192 A(H1N1) and 214 B) were tested for resistance to oseltamivir:
  • All influenza A(H3N2) and B viruses were sensitive to oseltamivir.
  • Among the A(H1N1) viruses tested, 191 (99%) were sensitive to oseltamivir and one virus was resistant to oseltamivir with the H275Y mutation in the neuraminidase gene.
[h=3]Zanamivir:[/h]
553 influenza viruses (147 A(H3N2), 192 A(H1N1) and 214 B) were tested for resistance to zanamivir:
  • All influenza viruses tested were sensitive to zanamivir.
[h=3]Amantadine:[/h]
High levels of resistance to amantadine persist among influenza A(H1N1) and influenza A(H3N2) viruses. All viruses tested this season were resistant.

...

https://www.canada.ca/en/public-hea...ch/2019-2020/week-08-february-16-22-2020.html
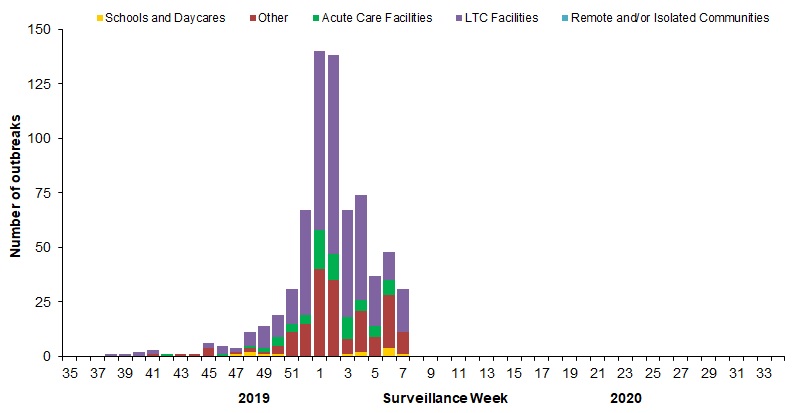
 
[h=1]FluWatch report: March 1 to 7, 2020 (week 10)[/h]
week10-en-cover.jpg


Download the alternative format
(PDF format, 765 KB, 14 pages)

Organization: Public Health Agency of Canada

Date published: 2020-03-13[h=3]Related Topics[/h]
[h=5]Overall Summary[/h]
  • Influenza activity remained elevated in week 10; however, several indicators of influenza activity continued to decrease compared to the previous week.
  • In week 10, two thirds of influenza detections were influenza A, and among those subtyped, A(H1N1) continues to be the dominant subtype circulating in Canada.
  • The highest cumulative hospitalization rates are among children under 5 years of age and adults 65 years of age and older. Hospitalizations among adults are predominantly due to influenza A, while those among children are due to a mix of influenza A and B.
[h=2]On this page[/h]
[h=2]Influenza/Influenza-like Illness (ILI) Activity (geographic spread)[/h]
During week 10, influenza activity was reported in all regions in all reporting provinces and territories (52 of 53). Among these regions, 52% reported sporadic activity, 46% reported localized activity, and 2% reported widespread activity (Figure 1). Figure 1 - Map of influenza/ILI activity by province and territory, Canada, week 2020-10

Number of Regions Reporting in week 10: 52 out of 53
fig1-eng.jpg
Figure 1 - Text equivalent[h=2]Laboratory-Confirmed Influenza Detections[/h]
In week 10, the percentage of laboratory tests positive for influenza decreased for the second week in a row, to 20%. Both influenza A and B circulation decreased in week 10.

The following results were reported from sentinel laboratories across Canada (Figures 2 and 3):
  • The percentage of tests positive for influenza A was 14% in week 10, which is a decrease compared to plateau over the previous eight weeks.
  • Among subtyped influenza A detections, influenza A(H1N1) accounted for 83% of detections, which is similar to the previous week.
  • Following the high levels of influenza B circulation earlier this year, the percentage of tests positive for influenza B in week 10 is at the average for this time of year at 6%.
To date this season (weeks 35 to 10), all influenza types and subtypes have circulated. Among the 49,501 laboratory detections of influenza reported:
  • 58% (28,871) were influenza A.
  • Among subtyped influenza A detections (6,576), A(H1N1) is the predominant subtype this season (67%).
Detailed information on age and type/subtype has been received for 37,972 laboratory-confirmed influenza cases (Table 1). To date this season (weeks 35 to 10):
  • Cases of influenza A(H1N1) (3,164) were primarily in adults; 25% 20-44 years, 26% 45-64 years and 29% 65 years of age and older.
  • Among cases of influenza A(H3N2) (1,934), the largest proportion of cases was in adults 65 years of age and older (46%).
  • Cases of influenza B (16,591) were primarily in younger age groups; 57% under 19 years of age and 30% between 20 and 44 years of age.
For more detailed weekly and cumulative influenza data, see the text descriptions for Figures 2 and 3 or the Respiratory Virus Detections in Canada Report. Figure 2 - Number of positive influenza tests and percentage of tests positive, by type, subtype and report week, Canada, weeks 2019-35 to 2020-10
Number of Laboratories Reporting in Week 10: 35 out of 36

fig2-eng.jpg


The shaded area indicates weeks where the positivity rate was at least 5% and a minimum of 15 positive tests were observed, signalling the period of seasonal influenza activity. Figure 2 - Text equivalentFigure 3 - Distribution of positive influenza specimens by type/subtype and province/territory, Canada, weeks 2019-35 to 2020-10
fig3-eng.jpg
Figure 3 - Text equivalent
0-4349637819729213851734719%
5-19243424324619455619805321%
20-44448079931033714909938925%
45-6442328282873117966519814%
65+673991689449291246798521%
Total2138131641934162831659137972100%

Table 1 - Cumulative number of positive influenza specimens by type, subtype and age group reported through case-based laboratory reporting, Canada, weeks 2019-35 to 2020-10
Age groups (years) Cumulative (August 25, 2019 to March 7, 2020)
Influenza A B Influenza A and B
A Total A(H1N1) A(H3N2) A (Un subtyped) [SUP] Table 1 Footnote1 [/SUP] Total # %
[TD="colspan: 8"] Table 1 Footnote 1 Unsubtyped: The specimen was typed as influenza A, but no result for subtyping was available.

Table 1 Return to footnote1referrer [/TD]
[h=2]Syndromic / Influenza-like Illness Surveillance[/h] [h=3]Healthcare Professionals Sentinel Syndromic Surveillance[/h]
In week 10, 1.5% of visits to healthcare professionals were due to influenza-like illness (ILI) which is the same as the previous week and remains below the average for this time of year (Figure 4). Figure 4 – Percentage of visits for ILI reported by sentinels by report week, Canada, weeks 2019-35 to 2020-10
Number of Sentinels Reporting in week 10: 82

fig4-eng.jpg


The shaded area represents the maximum and minimum percentage of visits for ILI reported by week from seasons 2014-2015 to 2018-2019 Figure 4 - Text equivalent[h=2]FluWatchers[/h]
The proportion of FluWatchers participants reporting symptoms of cough and fever decreased in week 10 compared to the previous week. In week 10, 3,174 participants reported to FluWatchers, of which 2.1% (67) reported symptoms of cough and fever (Figure 5).

Among the 67 participants who reported cough and fever:
  • 21% consulted a healthcare professional;
  • 73% reported days missed from work or school, resulting in a combined total of 164 missed days of work or school.
If you are interested in becoming a FluWatcher, sign up today. Figure 5 - Percentage of FluWatchers participants reporting cough and fever, Canada, weeks 2019-40 to 2020-10
Number of participants reporting in week 10: 3,174
fig5-eng.jpg
Figure 5 - Text equivalent
Online Figure - Geographic distribution of FluWatchers participants reporting cough and fever, Canada, week 2020-10

Click on the map to access the link
map
[h=2]Influenza Outbreak Surveillance[/h]
In week 10, a total of 20 outbreaks were reported: 16 in long term care facilities, three in facilities categorized as 'other', which includes facilities such as private personal care homes, correctional facilities, and colleges/universities, and one in an acute care facility (Figure 6). In addition, 16 ILI outbreaks were reported, 15 in schools/daycares and one in a facility categorized as ‘other’.

To date this season, a total of 832 laboratory-confirmed influenza outbreaks have been reported; 64% (532) in long-term care facilities, 24% (203) in facilities categorized as ‘other’, 10% (82) in acute care facilities, and 2% (15) in schools/daycares. Of the 786 outbreaks where influenza type was reported, 88% (690) were due to influenza A. Among the 290 outbreaks for which the influenza A subtype was reported, 52% were associated with A(H1N1) and 48% with A(H3N2). To date this season, 162 ILI outbreaks have also been reported; 98% (158) in schools/daycares and 2% (4) in facilities categorized as ‘other’. Figure 6 - Number of new outbreaks of laboratory-confirmed influenza by report week, Canada, weeks 2019-35 to 2020-10
Number of provinces and territories reporting in week 10: 12 out of 13

fig6-eng.jpg
Figure 6 - Text equivalent[h=2]Severe Outcomes Influenza Surveillance[/h]
Provincial/Territorial Influenza Hospitalizations and Deaths

To date this season, 2,136 influenza-associated hospitalizations were reported by participating provinces and territories [SUP]Footnote1[/SUP].
  • 67% of the cases were associated with influenza A.
  • Of the 949 cases for which subtype was reported, 56% were associated with influenza A(H3N2).
  • The highest cumulative hospitalization rates up to week 10 were among adults 65 years of age and older (68/100,000 population) and children under 5 years of age (65/100,000 population).
265 ICU admissions and 85 deaths have been reported.
  • 68% of the ICU admissions and 68% of the deaths were associated with influenza A.
Figure 7 - Cumulative rates of influenza-associated hospitalization by age group and epidemiological week, Canada, participating provinces and territories [SUP]Footnote1[/SUP] weeks 2019-35 to 2020-10
Number of provinces and territories reporting in week 10: 8 out of 9

fig7-eng.jpg
Footnote ‡ Influenza-associated hospitalizations are reported by Alberta, Manitoba, New Brunswick, Newfoundland and Labrador, Northwest Territories, Nova Scotia, Prince Edward Island and Yukon. Only hospitalizations that require intensive medical care are reported by Saskatchewan.

Return to footnote1referrer Figure 7 - Text equivalent[h=3]Pediatric Influenza Hospitalizations and Deaths[/h]
In week 10, 52 pediatric (≤16 years of age) laboratory-confirmed influenza-associated hospitalizations were reported by the Immunization Monitoring Program Active (IMPACT) network (Figure 8). After high numbers of cases reported since late-December, the weekly number of cases has been approximately equal to the 5-year average over the past two weeks. An approximately equal proportion of cases of influenza A and B continues to be observed.

A greater number of total pediatric hospitalizations with influenza have been reported this season compared to the same period during the past 9 seasons. The elevated number of cases this season compared to previous seasons is likely due to the concurrent circulation of influenza A and B in the early part of the influenza season, as well as an above average number of hospitalizations with influenza B. In addition, the number of influenza A-associated pediatric hospitalizations is above the average for this time of year, which is expected when A(H1N1) is the predominant circulating virus.

To date this season (weeks 35 to 10):
  • 1,144 pediatric hospitalizations have been reported by the IMPACT network, of which 52% (591) were associated with influenza A and 48% (553) with influenza B.
  • The largest proportion of hospitalizations (65%) were among children under 5 years of age (Figure 9).
  • 174 ICU admissions were reported, of which 56% were associated with influenza A, and 64% were among children under 5 years of age.
  • Less than five pediatric deaths have been reported.
Figure 8 - Number of pediatric (≤16 years of age) hospitalizations reported by the IMPACT network, by week, Canada, weeks 2019-35 to 2020-10
fig8-eng.jpg


The shaded area represents the maximum and minimum number of cases reported by week from seasons 2014-15 to 2018-19 Figure 8 - Text equivalentFigure 9 - Cumulative number of pediatric hospitalizations (≤16 years of age) with influenza by age-group reported by the IMPACT network, Canada, weeks 2019-35 to 2020-10
fig9-eng.jpg
Figure 9 - Text Description[h=3]Adult Influenza Hospitalizations and Deaths[/h]
Surveillance of laboratory-confirmed influenza-associated adult (≥16 years of age) hospitalizations by the Canadian Immunization Research Network (CIRN) Serious Outcomes Surveillance (SOS) network began on November 1st for the 2019-20 season. In week 10, the number of cases declined compared to the previous week.

To date this season, 738 hospitalizations, 74 intensive care unit admissions, and 35 deaths have been reported (Figure 10).
  • The majority of hospitalizations have been due to influenza A (80%), and among those subtyped (166) 92% were influenza A(H1N1).
  • Among the 592 cases with influenza A, the largest proportion of hospitalizations were in adults 65 years of age and older (67%). Among the 143 cases with influenza B, 52% were in adults 65 years of age and older, and 28% of cases were between 16 and 34 years of age (Figure 11).
  • 87% of hospitalized cases reported at least one type of comorbid condition.
Figure 10 - Number of adult hospitalizations (≥16 years of age) with influenza reported by the CIRN-SOS network, by week, Canada, weeks 2019-45 to 2020-10
fig10-eng.jpg
Figure 10 - Text DescriptionFigure 11 - Cumulative numbers of adult hospitalizations (≥16 years of age) with influenza by age-group reported by the CIRN-SOS network, Canada, weeks 2019-45 to 2020-10
fig11-eng.jpg
Figure 11 - Text Description[h=2]Influenza Strain Characterizations[/h]
From September 1, 2019 to March 12, 2020, the National Microbiology Laboratory (NML) has characterized 1,224 influenza viruses (474 A(H1N1), 177 A(H3N2) and 573 influenza B) that were received from Canadian laboratories.

Influenza A(H3N2)

Over recent years, circulating strains of A(H3N2) have evolved, and are increasingly difficult to characterize by hemagglutination inhibition (HI) assay. Genetic characterization is established by sequencing the hemagglutinin (HA) gene of the influenza viruses to compare their genetic properties.

Antigenic Characterization:

Among the 55 influenza A(H3N2) viruses antigenically characterized to date, the majority (80%) showed reduced titer by HI assay to A Kansas/14/2017 using antiserum raised against egg-propagated A Kansas/14/2017. Eleven viruses were characterized as A Kansas/14/2017-like (Figure 12a). [h=3]Genetic Characterization:[/h]
Nearly all (98%) of the 160 A(H3N2) viruses genetically characterized this season belonged to genetic group 3C.2a1b based on sequence analysis of the HA gene. Three viruses belonged to the genetic group 3C.3a (Figure 13).

Group 3C.2a1b viruses analysed represent:
  • 92% (35 out of 38) viruses that were also antigenically characterized.
  • 100% (122 out of 122) viruses which did not grow to sufficient hemagglutination titer for antigenic characterization by HI assay.
A/Kansas/14/2017 belongs to genetic group 3C.3a and is the influenza A(H3N2) component of the 2019-20 Northern Hemisphere influenza vaccine. [h=3]Influenza A(H1N1)[/h]
Among the 474 A(H1N1) viruses characterized to date, 53% were antigenically similar to A/Brisbane/02/2018 by HI testing using antiserum raised against egg-propagated A/Brisbane/02/2018 (Figure 12 b).

A/Brisbane/02/2018 is the influenza A(H1N1) component of the 2019-20 Northern Hemisphere influenza vaccine. [h=3]Influenza B[/h]
Antigenic Characterization:

Among the 182 influenza B viruses antigenically characterized this season, the vast majority (180) belonged to the B/Victoria lineage. Two viruses were antigenically characterized as similar to B/Phuket/3073/2013 (B/Yamagata lineage).

The majority (89%, 161) of B/Victoria lineage viruses showed reduced titer by HI assay to B/Colorado/06/2017 using antiserum raised against cell culture-propagated B/Colorado/06/2017 (Figure 12c).

Sequence analysis of 150 B/Victoria lineage viruses with reduced titre to B/Colorado/06/2017 showed that 100% had a three amino acid deletion (162-164) in the HA gene and belong to the genetic subclade V1A.3 (3Del). Sequencing is pending for the remaining viruses.

Genetic Characterization:

Genetic characterization was also performed on 391 B/Victoria lineage viruses. All of these viruses had a three amino acid deletion (162-164) in the HA gene and belong to the genetic subclade V1A.3 (3Del).

To date, 100% (541) of influenza B/Victoria viruses genetically characterized belong to the genetic subclade V1A.3 (3Del) (Fig 13b). Viruses in this genetic subclade are antigenically distinct from the vaccine strain B/Colorado/06/2017, which belongs to genetic subclade V1A.1 (2Del).

The recommended influenza B components for the 2019-20 Northern Hemisphere influenza vaccine are B/Colorado/06/2017 (Victoria lineage) and B/Phuket/3073/2013 (Yamagata lineage). B/Phuket/3073/2013 is included in the quadrivalent influenza vaccine. The vaccine strain B/Colorado/06/2017 belongs to genetic subclade V1A.1. Figure 12 - Distribution of antigenic phenotypes among characterized influenza viruses, Canada, September 1, 2019 to March 12, 2020
fig12-eng.jpg
Figure 12 - Text DescriptionFigure 13 - Distribution of genetic clades among characterized influenza viruses, Canada, September 1, 2019 to March 12, 2020
fig13-eng.jpg
Figure 13 - Text Description[h=2]Antiviral Resistance[/h]
The National Microbiology Laboratory (NML) also tests influenza viruses received from Canadian laboratories for antiviral resistance. From September 1, 2019 to March 12, 2020, the following results were reported: [h=3]Oseltamivir:[/h]
669 influenza viruses (155 A(H3N2), 251 A(H1N1) and 263 B) were tested for resistance to oseltamivir:
  • All influenza A(H3N2) and B viruses were sensitive to oseltamivir.
  • Among the A(H1N1) viruses tested, 250 (99.6%) were sensitive to oseltamivir and one virus was resistant to oseltamivir with the H275Y mutation in the neuraminidase gene.
[h=3]Zanamivir:[/h]
669 influenza viruses (155 A(H3N2), 251 A(H1N1) and 263 B) were tested for resistance to zanamivir:
  • All influenza viruses tested were sensitive to zanamivir.
[h=3]Amantadine:[/h]
High levels of resistance to amantadine persist among influenza A(H1N1) and influenza A(H3N2) viruses. All viruses tested this season were resistant.

...

https://www.canada.ca/en/public-hea...luwatch/2019-2020/week-10-march-1-7-2020.html
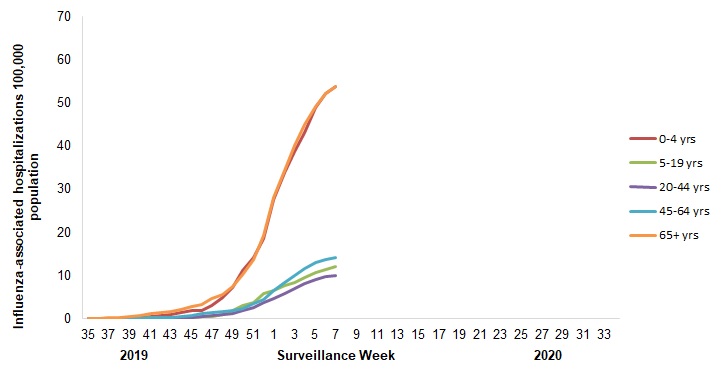
 
FluWatch report: March 8 to 14, 2020 (week 11)

pub-eng.jpg


Download the alternative format
(PDF format, 1.3 MB, 14 pages)

Organization: Public Health Agency of Canada

Date published: 2020-03-20
Related Topics
Overall Summary
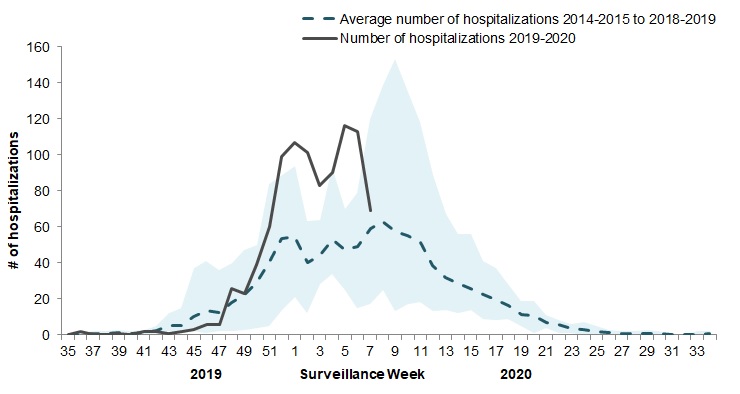
  • Influenza activity continues to be reported in all regions in Canada; however, almost all indicators of influenza activity continued to decrease compared to the previous week.
  • Influenza-like illness activity reported by sentinel practitioners and FluWatchers increased this week. Given the evolving Canadian situation with COVID-19, we will continue to monitor this trend in the coming weeks.
  • In week 11, two thirds of influenza detections were influenza A, and among those subtyped, A(H1N1) continues to be the dominant subtype circulating in Canada.
  • The highest cumulative hospitalization rates are among children under 5 years of age and adults 65 years of age and older. Hospitalizations among adults are predominantly due to influenza A, while those among children are due to a mix of influenza A and B.
On this page
Influenza/Influenza-like Illness (ILI) Activity (geographic spread)


During week 11, influenza activity was reported in all regions in all reporting provinces and territories (53 of 53). Among these regions, 57% reported sporadic activity, 40% reported localized activity, and 4% reported widespread activity (Figure 1).
Figure 1 - Map of influenza/ILI activity by province and territory, Canada, week 2020-11

Number of Regions Reporting in week 11: 53 out of 53

fig1-eng.jpg

Figure 1 - Text equivalentLaboratory-Confirmed Influenza Detections


In week 11, the percentage of laboratory tests positive for influenza decreased for the third week in a row, to 14%. Both influenza A and B circulation decreased in week 11. Testing for influenza and other respiratory viruses is influenced by the current COVID-19 pandemic. Changes in laboratory testing practices in the coming weeks may affect the comparability of data to previous weeks or previous seasons.

The following results were reported from sentinel laboratories across Canada (Figures 2 and 3):
  • The percentage of tests positive for influenza A was 10% in week 11, which is contines to decrease compared to plateau seen across weeks 52 to 9.
  • 69% of detections were influenza A.
  • Among subtyped influenza A detections, influenza A(H1N1) accounted for 86% of detections, which is slightly higher compared to the previous week.
  • Following the high levels of influenza B circulation earlier this year, the percentage of tests positive for influenza B in week 11 was 4%, which is below the average for this time of year (7%).
To date this season (weeks 35 to 11), all influenza types and subtypes have circulated. Among the 52,526 laboratory detections of influenza reported:
  • 59% (30,951) were influenza A.
  • Among subtyped influenza A detections (6,975), A(H1N1) is the predominant subtype this season (68%).
Detailed information on age and type/subtype has been received for 40,101 laboratory-confirmed influenza cases (Table 1). To date this season (weeks 35 to 11):
  • Cases of influenza A(H1N1) (3,512) were primarily in adults; 26% 20-44 years, 26% 45-64 years and 28% 65 years of age and older.
  • Among cases of influenza A(H3N2) (1,993), the largest proportion of cases was in adults 65 years of age and older (46%).
  • Cases of influenza B (17,214) were primarily in younger age groups; 23% under 5 years of age, 34% 5-19 years and 30% between 20 and 44 years of age.
For more detailed weekly and cumulative influenza data, see the text descriptions for Figures 2 and 3 or the Respiratory Virus Detections in Canada Report.
Figure 2 - Number of positive influenza tests and percentage of tests positive, by type, subtype and report week, Canada, weeks 2019-35 to 2020-11

Number of Laboratories Reporting in Week 11: 33 out of 36

fig2-eng.jpg


The shaded area indicates weeks where the positivity rate was at least 5% and a minimum of 15 positive tests were observed, signalling the period of seasonal influenza activity.
Figure 2 - Text equivalentFigure 3 - Distribution of positive influenza specimens by type/subtype and province/territory, Canada, weeks 2019-35 to 2020-11
fig3-eng.jpg
Figure 3 - Text equivalent
0-4368341420530643962764519%
5-19259427825120655781837521%
20-44485890732336285123998125%
45-64461992129734011031565014%
65+713399291752241317845021%
Total2288735121993173821721440101100%

[TD="colspan: 8"]Table 1 Footnote 1Unsubtyped: The specimen was typed as influenza A, but no result for subtyping was available.

Table 1 Return to footnote1referrer [/TD]
Syndromic / Influenza-like Illness Surveillance

Healthcare Professionals Sentinel Syndromic Surveillance


In week 11, 1.9% of visits to healthcare professionals were due to influenza-like illness (ILI) which is an increase from the previous week and around average for this time of year (Figure 4). Given the evolving Canadian situation with COVID-19, we will continue to monitor this trend in the coming weeks.
Figure 4 – Percentage of visits for ILI reported by sentinels by report week, Canada, weeks 2019-35 to 2020-11

Number of Sentinels Reporting in week 11: 68

fig4-eng.jpg


The shaded area represents the maximum and minimum percentage of visits for ILI reported by week from seasons 2014-2015 to 2018-2019
Figure 4 - Text equivalentFluWatchers


The proportion of FluWatchers participants reporting symptoms of cough and fever increased in week 11 compared to the previous week. Given the evolving Canadian situation with COVID-19, we will continue to monitor this trend in the coming weeks.
In week 11, 3,096 participants reported to FluWatchers, of which 2.5% (78) reported symptoms of cough and fever (Figure 5).
Among the 78 participants who reported cough and fever:
  • 26% consulted a healthcare professional, a similar proportion to recent weeks;
  • 74% reported days missed from work or school, a similar proportion to the previous week, resulting in a combined total of 203 missed days of work or school.
If you are interested in becoming a FluWatcher, sign up today.
Figure 5 - Percentage of FluWatchers participants reporting cough and fever, Canada, weeks 2019-40 to 2020-11

Number of participants reporting in week 11: 3,096
fig5-eng.jpg
Figure 5 - Text equivalent
Online Figure - Geographic distribution of FluWatchers participants reporting cough and fever, Canada, week 2020-11

Click on the map to access the link
Influenza Outbreak Surveillance


In week 11, a total of 32 outbreaks were reported: 24 in long term care facilities and eight in facilities categorized as ‘other’, which includes facilities such as private personal care homes, correctional facilities, and colleges/universities (Figure 6). In addition, 13 ILI outbreaks were reported in schools/daycares.

To date this season, a total of 871 laboratory-confirmed influenza outbreaks have been reported; 65% (563) in long-term care facilities, 24% (211) in facilities categorized as ‘other’, 9% (82) in acute care facilities, and 2% (15) in schools/daycares. Of the 825 outbreaks where influenza type was reported, 88% (724) were due to influenza A. Among the 297 outbreaks for which the influenza A subtype was reported, 52% were associated with A(H1N1) and 48% with A(H3N2). To date this season, 175 ILI outbreaks have also been reported; 98% (171) in schools/daycares and 2% (4) in facilities categorized as ‘other’.
Figure 6 - Number of new outbreaks of laboratory-confirmed influenza by report week, Canada, weeks 2019-35 to 2020-11

Number of provinces and territories reporting in week 11: 13 out of 13

fig6-eng.jpg

Figure 6 - Text equivalentSevere Outcomes Influenza Surveillance


Provincial/Territorial Influenza Hospitalizations and Deaths

To date this season, 2,232 influenza-associated hospitalizations were reported by participating provinces and territories [SUP]Footnote1[/SUP].
  • 68% of the cases were associated with influenza A.
  • Of the 978 cases for which subtype was reported, 55% were associated with influenza A(H3N2).
  • The highest cumulative hospitalization rates up to week 11 were among adults 65 years of age and older (71/100,000 population) and children under 5 years of age (69/100,000 population).
273 ICU admissions and 97 deaths have been reported.
  • 68% of the ICU admissions and 71% of the deaths were associated with influenza A.
Figure 7 - Cumulative rates of influenza-associated hospitalization by age group and epidemiological week, Canada, participating provinces and territories [SUP]Footnote1[/SUP] weeks 2019-35 to 2020-11

Number of provinces and territories reporting in week 11: 9 out of 9

fig7-eng.jpg

Footnote ‡Influenza-associated hospitalizations are reported by Alberta, Manitoba, New Brunswick, Newfoundland and Labrador, Northwest Territories, Nova Scotia, Prince Edward Island and Yukon. Only hospitalizations that require intensive medical care are reported by Saskatchewan.

Return to footnote1referrer
Figure 7 - Text equivalentPediatric Influenza Hospitalizations and Deaths


In week 11, 45 pediatric (≤16 years of age) laboratory-confirmed influenza-associated hospitalizations were reported by the Immunization Monitoring Program Active (IMPACT) network (Figure 8). After high numbers of cases reported since late-December, the weekly number of cases has been approximately equal to the 5-year average over the past two weeks. An approximately equal proportion of cases of influenza A and B continues to be observed.

To date this season (weeks 35 to 11):
  • 1,184 pediatric hospitalizations have been reported by the IMPACT network, of which 52% (614) were associated with influenza A and 48% (570) with influenza B.
  • The largest proportion of hospitalizations (66%) were among children under 5 years of age (Figure 9).
  • 183 ICU admissions were reported, of which 57% were associated with influenza A, and 61% were among children under 5 years of age.
  • Less than five pediatric deaths have been reported.
Figure 8 - Number of pediatric (≤16 years of age) hospitalizations reported by the IMPACT network, by week, Canada, weeks 2019-35 to 2020-11

fig8-eng.jpg


The shaded area represents the maximum and minimum number of cases reported by week from seasons 2014-15 to 2018-19
Figure 8 - Text equivalentFigure 9 - Cumulative number of pediatric hospitalizations (≤16 years of age) with influenza by age-group reported by the IMPACT network, Canada, weeks 2019-35 to 2020-11
fig9-eng.jpg

Figure 9 - Text DescriptionAdult Influenza Hospitalizations and Deaths


Surveillance of laboratory-confirmed influenza-associated adult (≥16 years of age) hospitalizations by the Canadian Immunization Research Network (CIRN) Serious Outcomes Surveillance (SOS) network began on November 1st for the 2019-20 season. In week 11, the number of cases declined sharplyfor the second week in a row.

To date this season, 757 hospitalizations, 81 intensive care unit admissions, and 41 deaths have been reported (Figure 10).
  • The majority of hospitalizations have been due to influenza A (80%), and among those subtyped (166) 92% were influenza A(H1N1).
  • Among the 603 cases with influenza A, the largest proportion of hospitalizations were in adults 65 years of age and older (67%). Among the 151 cases with influenza B, 53% were in adults 65 years of age and older, and 28% of cases were between 16 and 34 years of age (Figure 11).
  • 89% of hospitalized cases reported at least one type of comorbid condition.
Figure 10 - Number of adult hospitalizations (≥16 years of age) with influenza reported by the CIRN-SOS network, by week, Canada, weeks 2019-45 to 2020-11
fig10-eng.jpg

Figure 10 - Text DescriptionFigure 11 - Cumulative numbers of adult hospitalizations (≥16 years of age) with influenza by age-group reported by the CIRN-SOS network, Canada, weeks 2019-45 to 2020-11
fig11-eng.jpg

Figure 11 - Text DescriptionInfluenza Strain Characterizations


From September 1, 2019 to March 19, 2020, the National Microbiology Laboratory (NML) has characterized 1,224 influenza viruses (474 A(H1N1), 177 A(H3N2) and 573 influenza B) that were received from Canadian laboratories.

Influenza A(H3N2)

Over recent years, circulating strains of A(H3N2) have evolved, and are increasingly difficult to characterize by hemagglutination inhibition (HI) assay. Genetic characterization is established by sequencing the hemagglutinin (HA) gene of the influenza viruses to compare their genetic properties.

Antigenic Characterization:

Among the 55 influenza A(H3N2) viruses antigenically characterized to date, the majority (80%) showed reduced titer by HI assay to A Kansas/14/2017 using antiserum raised against egg-propagated A Kansas/14/2017. Eleven viruses were characterized as A Kansas/14/2017-like (Figure 12a).
Genetic Characterization:


Nearly all (98%) of the 160 A(H3N2) viruses genetically characterized this season belonged to genetic group 3C.2a1b based on sequence analysis of the HA gene. Three viruses belonged to the genetic group 3C.3a (Figure 13).

Group 3C.2a1b viruses analysed represent:
  • 92% (35 out of 38) viruses that were also antigenically characterized.
  • 100% (122 out of 122) viruses which did not grow to sufficient hemagglutination titer for antigenic characterization by HI assay.
A/Kansas/14/2017 belongs to genetic group 3C.3a and is the influenza A(H3N2) component of the 2019-20 Northern Hemisphere influenza vaccine.
Influenza A(H1N1)


Among the 474 A(H1N1) viruses characterized to date, 53% were antigenically similar to A/Brisbane/02/2018 by HI testing using antiserum raised against egg-propagated A/Brisbane/02/2018 (Figure 12 b).

A/Brisbane/02/2018 is the influenza A(H1N1) component of the 2019-20 Northern Hemisphere influenza vaccine.
Influenza B


Antigenic Characterization:

Among the 182 influenza B viruses antigenically characterized this season, the vast majority (180) belonged to the B/Victoria lineage. Two viruses were antigenically characterized as similar to B/Phuket/3073/2013 (B/Yamagata lineage).

The majority (89%, 161) of B/Victoria lineage viruses showed reduced titer by HI assay to B/Colorado/06/2017 using antiserum raised against cell culture-propagated B/Colorado/06/2017 (Figure 12c).

Sequence analysis of 150 B/Victoria lineage viruses with reduced titre to B/Colorado/06/2017 showed that 100% had a three amino acid deletion (162-164) in the HA gene and belong to the genetic subclade V1A.3 (3Del). Sequencing is pending for the remaining viruses.

Genetic Characterization:

Genetic characterization was also performed on 391 B/Victoria lineage viruses. All of these viruses had a three amino acid deletion (162-164) in the HA gene and belong to the genetic subclade V1A.3 (3Del).

To date, 100% (541) of influenza B/Victoria viruses genetically characterized belong to the genetic subclade V1A.3 (3Del) (Fig 13b). Viruses in this genetic subclade are antigenically distinct from the vaccine strain B/Colorado/06/2017, which belongs to genetic subclade V1A.1 (2Del).

The recommended influenza B components for the 2019-20 Northern Hemisphere influenza vaccine are B/Colorado/06/2017 (Victoria lineage) and B/Phuket/3073/2013 (Yamagata lineage). B/Phuket/3073/2013 is included in the quadrivalent influenza vaccine. The vaccine strain B/Colorado/06/2017 belongs to genetic subclade V1A.1.
Figure 12 - Distribution of antigenic phenotypes among characterized influenza viruses, Canada, September 1, 2019 to March 19, 2020
fig12-eng.jpg

Figure 12 - Text DescriptionFigure 13 - Distribution of genetic clades among characterized influenza viruses, Canada, September 1, 2019 to March 19, 2020
fig13-eng.jpg

Figure 13 - Text DescriptionAntiviral Resistance


The National Microbiology Laboratory (NML) also tests influenza viruses received from Canadian laboratories for antiviral resistance. From September 1, 2019 to March 12, 2020, the following results were reported:
Oseltamivir:


669 influenza viruses (155 A(H3N2), 251 A(H1N1) and 263 B) were tested for resistance to oseltamivir:
  • All influenza A(H3N2) and B viruses were sensitive to oseltamivir.
  • Among the A(H1N1) viruses tested, 250 (99.6%) were sensitive to oseltamivir and one virus was resistant to oseltamivir with the H275Y mutation in the neuraminidase gene.
Zanamivir:


669 influenza viruses (155 A(H3N2), 251 A(H1N1) and 263 B) were tested for resistance to zanamivir:
  • All influenza viruses tested were sensitive to zanamivir.
Amantadine:


High levels of resistance to amantadine persist among influenza A(H1N1) and influenza A(H3N2) viruses. All viruses tested this season were resistant.
...

https://www.canada.ca/en/public-heal...8-14-2020.html
 
FluWatch report: March 15 to 21, 2020 (week 12)

week12-en-cover.jpg


Download the alternative format
(PDF format, 1.3 MB, 14 pages)

Organization: Public Health Agency of Canada

Date published: 2020-03-27
Related Topics
Overall Summary
  • Influenza activity continues to be reported in all regions in Canada; however, all indicators of influenza activity decreased compared to the previous week.
  • A sharp decrease was observed in laboratory detections of influenza, as well as hospitalizations due to influenza in both the adult and pediatric populations.
  • Laboratory detections and syndromic indicators may be influenced by the COVID-19 pandemic. These data should be interpreted with caution.
  • In week 12, two thirds of influenza detections were influenza A, and among those subtyped, A(H1N1) continues to be the dominant subtype circulating in Canada.
  • The highest cumulative hospitalization rates are among children under 5 years of age and adults 65 years of age and older. Hospitalizations among adults are predominantly due to influenza A, while those among children are due to a mix of influenza A and B.
On this page
Influenza/Influenza-like Illness (ILI) Activity (geographic spread)


During week 12, influenza activity was reported in all regions in all reporting provinces and territories (53 of 53). Among these regions, 64% reported sporadic activity and 36% reported localized activity (Figure 1).
Figure 1 - Map of influenza/ILI activity by province and territory, Canada, week 2020-12

Number of Regions Reporting in week 12: 53 out of 53

fig1-eng.jpg

Figure 1 - Text equivalentLaboratory-Confirmed Influenza Detections


In week 12, the percentage of laboratory tests positive for influenza continued to decrease sharply to 7%. Testing for influenza and other respiratory viruses may be influenced by the current COVID-19 pandemic. Changes in laboratory testing practices in the coming weeks may affect the comparability of data to previous weeks or previous seasons. In weeks 10-12, influenza circulation has decreased significantly more rapidly than is usually observed at this time of year.

The following results were reported from sentinel laboratories across Canada (Figures 2 and 3):
  • The percentage of tests positive for influenza A was 4.7% in week 12, which contines to decrease precipitously afterthe plateau seen across weeks 52 to 9.
  • 65% of detections were influenza A.
  • Among subtyped influenza A detections, influenza A(H1N1) accounted for 84% of detections, which is similar to the past four weeks.
  • Following the high levels of influenza B circulation earlier this year, the percentage of tests positive for influenza B in week 12 was 2.6%, which is below the average for this time of year (7%).
To date this season (weeks 35 to 12), all influenza types and subtypes have circulated. Among the 54,155 laboratory detections of influenza reported:
  • 59% (31,995) were influenza A.
  • Among subtyped influenza A detections (7,177), A(H1N1) is the predominant subtype this season (68%).
Detailed information on age and type/subtype has been received for 41,981 laboratory-confirmed influenza cases (Table 1). To date this season (weeks 35 to 12):
  • Cases of influenza A(H1N1) (3,676) were primarily in adults; 26% 20-44 years, 26% 45-64 years and 28% 65 years of age and older.
  • Among cases of influenza A(H3N2) (2,028), the largest proportion of cases was in adults 65 years of age and older (46%).
  • Cases of influenza B (17,912) were primarily in younger age groups; 22% under 5 years of age, 33% 5-19 years and 31% between 20 and 44 years of age.
For more detailed weekly and cumulative influenza data, see the text descriptions for Figures 2 and 3 or the Respiratory Virus Detections in Canada Report.
Figure 2 - Number of positive influenza tests and percentage of tests positive, by type, subtype and report week, Canada, weeks 2019-35 to 2020-12

Number of Laboratories Reporting in Week 12: 33 out of 36

fig2-eng.jpg


The shaded area indicates weeks where the positivity rate was at least 5% and a minimum of 15 positive tests were observed, signalling the period of seasonal influenza activity.
Figure 2 - Text equivalentFigure 3 - Distribution of positive influenza specimens by type/subtype and province/territory, Canada, weeks 2019-35 to 2020-12
fig3-eng.jpg
Figure 3 - Text equivalent
0-4378143421031374010779119%
5-19272929325721795966869521%
20-445184953328390354591064325%
45-64494595830036871114605914%
65+7430103893354591363879321%
Total2406936762028183651791241981100%

[TD="colspan: 8"]Table 1 Footnote 1Unsubtyped: The specimen was typed as influenza A, but no result for subtyping was available.

Table 1 Return to footnote1referrer [/TD]
Syndromic / Influenza-like Illness Surveillance

Healthcare Professionals Sentinel Syndromic Surveillance


In week 12, 1.5% of visits to healthcare professionals were due to influenza-like illness (ILI) which is a slight decrease from the previous week and around average for this time of year (Figure 4). This trend should be interpreted with caution as there was a sharp decrease in the number of sentinels reporting this week. Given the evolving Canadian situation with COVID-19, we will continue to monitor this indicator closely.
Figure 4 – Percentage of visits for ILI reported by sentinels by report week, Canada, weeks 2019-35 to 2020-12

Number of Sentinels Reporting in week 12: 53

fig4-eng.jpg


The shaded area represents the maximum and minimum percentage of visits for ILI reported by week from seasons 2014-2015 to 2018-2019
Figure 4 - Text equivalentFluWatchers


The proportion of FluWatchers participants reporting symptoms of cough and fever decreased in week 12 compared to the previous week.

In week 12, 3,113 participants reported to FluWatchers, of which 1.5% (48) reported symptoms of cough and fever (Figure 5).

Among the 48 participants who reported cough and fever:
  • 38% consulted a healthcare professional, a larger proportion than in recent weeks;
  • 75% reported days missed from work or school, a similar proportion to the previous week, resulting in a combined total of 134 missed days of work or school.
If you are interested in becoming a FluWatcher, sign up today.
Figure 5 - Percentage of FluWatchers participants reporting cough and fever, Canada, weeks 2019-40 to 2020-12

Number of participants reporting in week 12: 3,096
fig5-eng.jpg
Figure 5 - Text equivalent
Online Figure - Geographic distribution of FluWatchers participants reporting cough and fever, Canada, week 2020-12

Click on the map to access the link
Influenza Outbreak Surveillance


In week 12, a total of 14 outbreaks were reported: 10 in long term care facilities and four in facilities s categorized as ‘other', which includes facilities such as private personal care homes, correctional facilities, and colleges/universities (Figure 6).

To date this season, a total of 895 laboratory-confirmed influenza outbreaks have been reported; 65% (579) in long-term care facilities, 25% (219) in facilities categorized as ‘other’, 9% (82) in acute care facilities, and 2% (15) in schools/daycares. Of the 847 outbreaks where influenza type was reported, 88% (743) were due to influenza A. Among the 304 outbreaks for which the influenza A subtype was reported, 53% were associated with A(H1N1) and 47% with A(H3N2). To date this season, 175 ILI outbreaks have also been reported; 98% (171) in schools/daycares and 2% (4) in facilities categorized as ‘other’.
Figure 6 - Number of new outbreaks of laboratory-confirmed influenza by report week, Canada, weeks 2019-35 to 2020-12

Number of provinces and territories reporting in week 12: 13 out of 13

fig6-eng.jpg

Figure 6 - Text equivalentSevere Outcomes Influenza Surveillance


Provincial/Territorial Influenza Hospitalizations and Deaths

To date this season, 2,324 influenza-associated hospitalizations were reported by participating provinces and territories [SUP]Footnote1[/SUP].
  • 69% of the cases were associated with influenza A.
  • Of the 1,036 cases for which subtype was reported, 52% were associated with influenza A(H3N2).
  • The highest cumulative hospitalization rates up to week 12 were among adults 65 years of age and older (75/100,000 population) and children under 5 years of age (71/100,000 population).
283 ICU admissions and 102 deaths have been reported.
  • 69% of the ICU admissions and 72% of the deaths were associated with influenza A.
Figure 7 - Cumulative rates of influenza-associated hospitalization by age group and epidemiological week, Canada, participating provinces and territories [SUP]Footnote1[/SUP] weeks 2019-35 to 2020-12

Number of provinces and territories reporting in week 12: 9 out of 9

fig7-eng.jpg

Footnote ‡Influenza-associated hospitalizations are reported by Alberta, Manitoba, New Brunswick, Newfoundland and Labrador, Northwest Territories, Nova Scotia, Prince Edward Island and Yukon. Only hospitalizations that require intensive medical care are reported by Saskatchewan.

Return to footnote1referrer
Figure 7 - Text equivalentPediatric Influenza Hospitalizations and Deaths


In week 12, 26 pediatric (≤16 years of age) laboratory-confirmed influenza-associated hospitalizations were reported by the Immunization Monitoring Program Active (IMPACT) network (Figure 8). Since the beginning of March, the weekly number of reported cases have dropped below the 5-year weekly average.

To date this season (weeks 35 to 12):
  • 1,209 pediatric hospitalizations have been reported by the IMPACT network, of which 57% (625) were associated with influenza A and 48% (584) with influenza B.
  • The largest proportion of hospitalizations (66%) were among children under 5 years of age (Figure 9).
  • 195 ICU admissions were reported, of which 57% were associated with influenza A, and 68% were among children under 5 years of age.
  • Less than five pediatric deaths have been reported.
Figure 8 - Number of pediatric (≤16 years of age) hospitalizations reported by the IMPACT network, by week, Canada, weeks 2019-35 to 2020-12

fig8-eng.jpg


The shaded area represents the maximum and minimum number of cases reported by week from seasons 2014-15 to 2018-19
Figure 8 - Text equivalentFigure 9 - Cumulative number of pediatric hospitalizations (≤16 years of age) with influenza by age-group reported by the IMPACT network, Canada, weeks 2019-35 to 2020-12
fig9-eng.jpg

Figure 9 - Text DescriptionAdult Influenza Hospitalizations and Deaths


Surveillance of laboratory-confirmed influenza-associated adult (≥16 years of age) hospitalizations by the Canadian Immunization Research Network (CIRN) Serious Outcomes Surveillance (SOS) network began on November 1st for the 2019-20 season. In week 12, the number of cases declined sharply for the third week in a row.

To date this season, 772 hospitalizations, 84 intensive care unit admissions, and 41 deaths have been (Figure 10).
  • The majority of hospitalizations have been due to influenza A (80%), and among those subtyped (166) 92% were influenza A(H1N1).
  • Among the 616 cases with influenza A, the largest proportion of hospitalizations were in adults 65 years of age and older (66%). Among the 153 cases with influenza B, 52% were in adults 65 years of age and older, and 28% of cases were between 16 and 34 years of age (Figure 11).
  • 89% of hospitalized cases reported at least one type of comorbid condition.
Figure 10 - Number of adult hospitalizations (≥16 years of age) with influenza reported by the CIRN-SOS network, by week, Canada, weeks 2019-45 to 2020-12
fig10-eng.jpg

Figure 10 - Text DescriptionFigure 11 - Cumulative numbers of adult hospitalizations (≥16 years of age) with influenza by age-group reported by the CIRN-SOS network, Canada, weeks 2019-45 to 2020-12
fig11-eng.jpg

Figure 11 - Text DescriptionInfluenza Strain Characterizations


From September 1, 2019 to March 19, 2020, the National Microbiology Laboratory (NML) has characterized 1,224 influenza viruses (474 A(H1N1), 177 A(H3N2) and 573 influenza B) that were received from Canadian laboratories.

Influenza A(H3N2)

Over recent years, circulating strains of A(H3N2) have evolved, and are increasingly difficult to characterize by hemagglutination inhibition (HI) assay. Genetic characterization is established by sequencing the hemagglutinin (HA) gene of the influenza viruses to compare their genetic properties.

Antigenic Characterization:

Among the 55 influenza A(H3N2) viruses antigenically characterized to date, the majority (80%) showed reduced titer by HI assay to A Kansas/14/2017 using antiserum raised against egg-propagated A Kansas/14/2017. Eleven viruses were characterized as A Kansas/14/2017-like (Figure 12a).
Genetic Characterization:


Nearly all (98%) of the 160 A(H3N2) viruses genetically characterized this season belonged to genetic group 3C.2a1b based on sequence analysis of the HA gene. Three viruses belonged to the genetic group 3C.3a (Figure 13).

Group 3C.2a1b viruses analysed represent:
  • 92% (35 out of 38) viruses that were also antigenically characterized.
  • 100% (122 out of 122) viruses which did not grow to sufficient hemagglutination titer for antigenic characterization by HI assay.
A/Kansas/14/2017 belongs to genetic group 3C.3a and is the influenza A(H3N2) component of the 2019-20 Northern Hemisphere influenza vaccine.
Influenza A(H1N1)


Among the 474 A(H1N1) viruses characterized to date, 53% were antigenically similar to A/Brisbane/02/2018 by HI testing using antiserum raised against egg-propagated A/Brisbane/02/2018 (Figure 12 b).

A/Brisbane/02/2018 is the influenza A(H1N1) component of the 2019-20 Northern Hemisphere influenza vaccine.
Influenza B


Antigenic Characterization:

Among the 182 influenza B viruses antigenically characterized this season, the vast majority (180) belonged to the B/Victoria lineage. Two viruses were antigenically characterized as similar to B/Phuket/3073/2013 (B/Yamagata lineage).

The majority (89%, 161) of B/Victoria lineage viruses showed reduced titer by HI assay to B/Colorado/06/2017 using antiserum raised against cell culture-propagated B/Colorado/06/2017 (Figure 12c).

Sequence analysis of 150 B/Victoria lineage viruses with reduced titre to B/Colorado/06/2017 showed that 100% had a three amino acid deletion (162-164) in the HA gene and belong to the genetic subclade V1A.3 (3Del). Sequencing is pending for the remaining viruses.

Genetic Characterization:

Genetic characterization was also performed on 391 B/Victoria lineage viruses. All of these viruses had a three amino acid deletion (162-164) in the HA gene and belong to the genetic subclade V1A.3 (3Del).

To date, 100% (541) of influenza B/Victoria viruses genetically characterized belong to the genetic subclade V1A.3 (3Del) (Fig 13b). Viruses in this genetic subclade are antigenically distinct from the vaccine strain B/Colorado/06/2017, which belongs to genetic subclade V1A.1 (2Del).

The recommended influenza B components for the 2019-20 Northern Hemisphere influenza vaccine are B/Colorado/06/2017 (Victoria lineage) and B/Phuket/3073/2013 (Yamagata lineage). B/Phuket/3073/2013 is included in the quadrivalent influenza vaccine. The vaccine strain B/Colorado/06/2017 belongs to genetic subclade V1A.1.
Figure 12 - Distribution of antigenic phenotypes among characterized influenza viruses, Canada, September 1, 2019 to March 19, 2020
fig12-eng.jpg

Figure 12 - Text DescriptionFigure 13 - Distribution of genetic clades among characterized influenza viruses, Canada, September 1, 2019 to March 19, 2020
fig13-eng.jpg

Figure 13 - Text DescriptionAntiviral Resistance


The National Microbiology Laboratory (NML) also tests influenza viruses received from Canadian laboratories for antiviral resistance. From September 1, 2019 to March 12, 2020, the following results were reported:
Oseltamivir:


669 influenza viruses (155 A(H3N2), 251 A(H1N1) and 263 B) were tested for resistance to oseltamivir:
  • All influenza A(H3N2) and B viruses were sensitive to oseltamivir.
  • Among the A(H1N1) viruses tested, 250 (99.6%) were sensitive to oseltamivir and one virus was resistant to oseltamivir with the H275Y mutation in the neuraminidase gene.
Zanamivir:


669 influenza viruses (155 A(H3N2), 251 A(H1N1) and 263 B) were tested for resistance to zanamivir:
  • All influenza viruses tested were sensitive to zanamivir.
Amantadine:


High levels of resistance to amantadine persist among influenza A(H1N1) and influenza A(H3N2) viruses. All viruses tested this season were resistant.

...
https://www.canada.ca/en/public-heal...5-21-2020.html
 
Back
Top