Pathfinder
Editor, Senior Moderator
FluWatch report: May 5 to May 11, 2019 (Week 19)
[FONT="]
Download the alternative format
(PDF format, 1.17 MB, 10 pages)
Organization: Public Health Agency of Canada
Date published: 2019-05-17
Related Topics[/FONT]
[FONT="]Overall Summary[/FONT]
[FONT="]Influenza/Influenza-like Illness Activity (geographic spread)
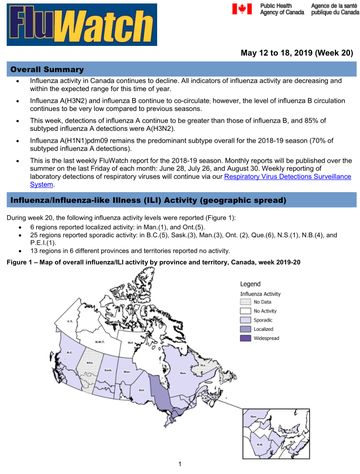
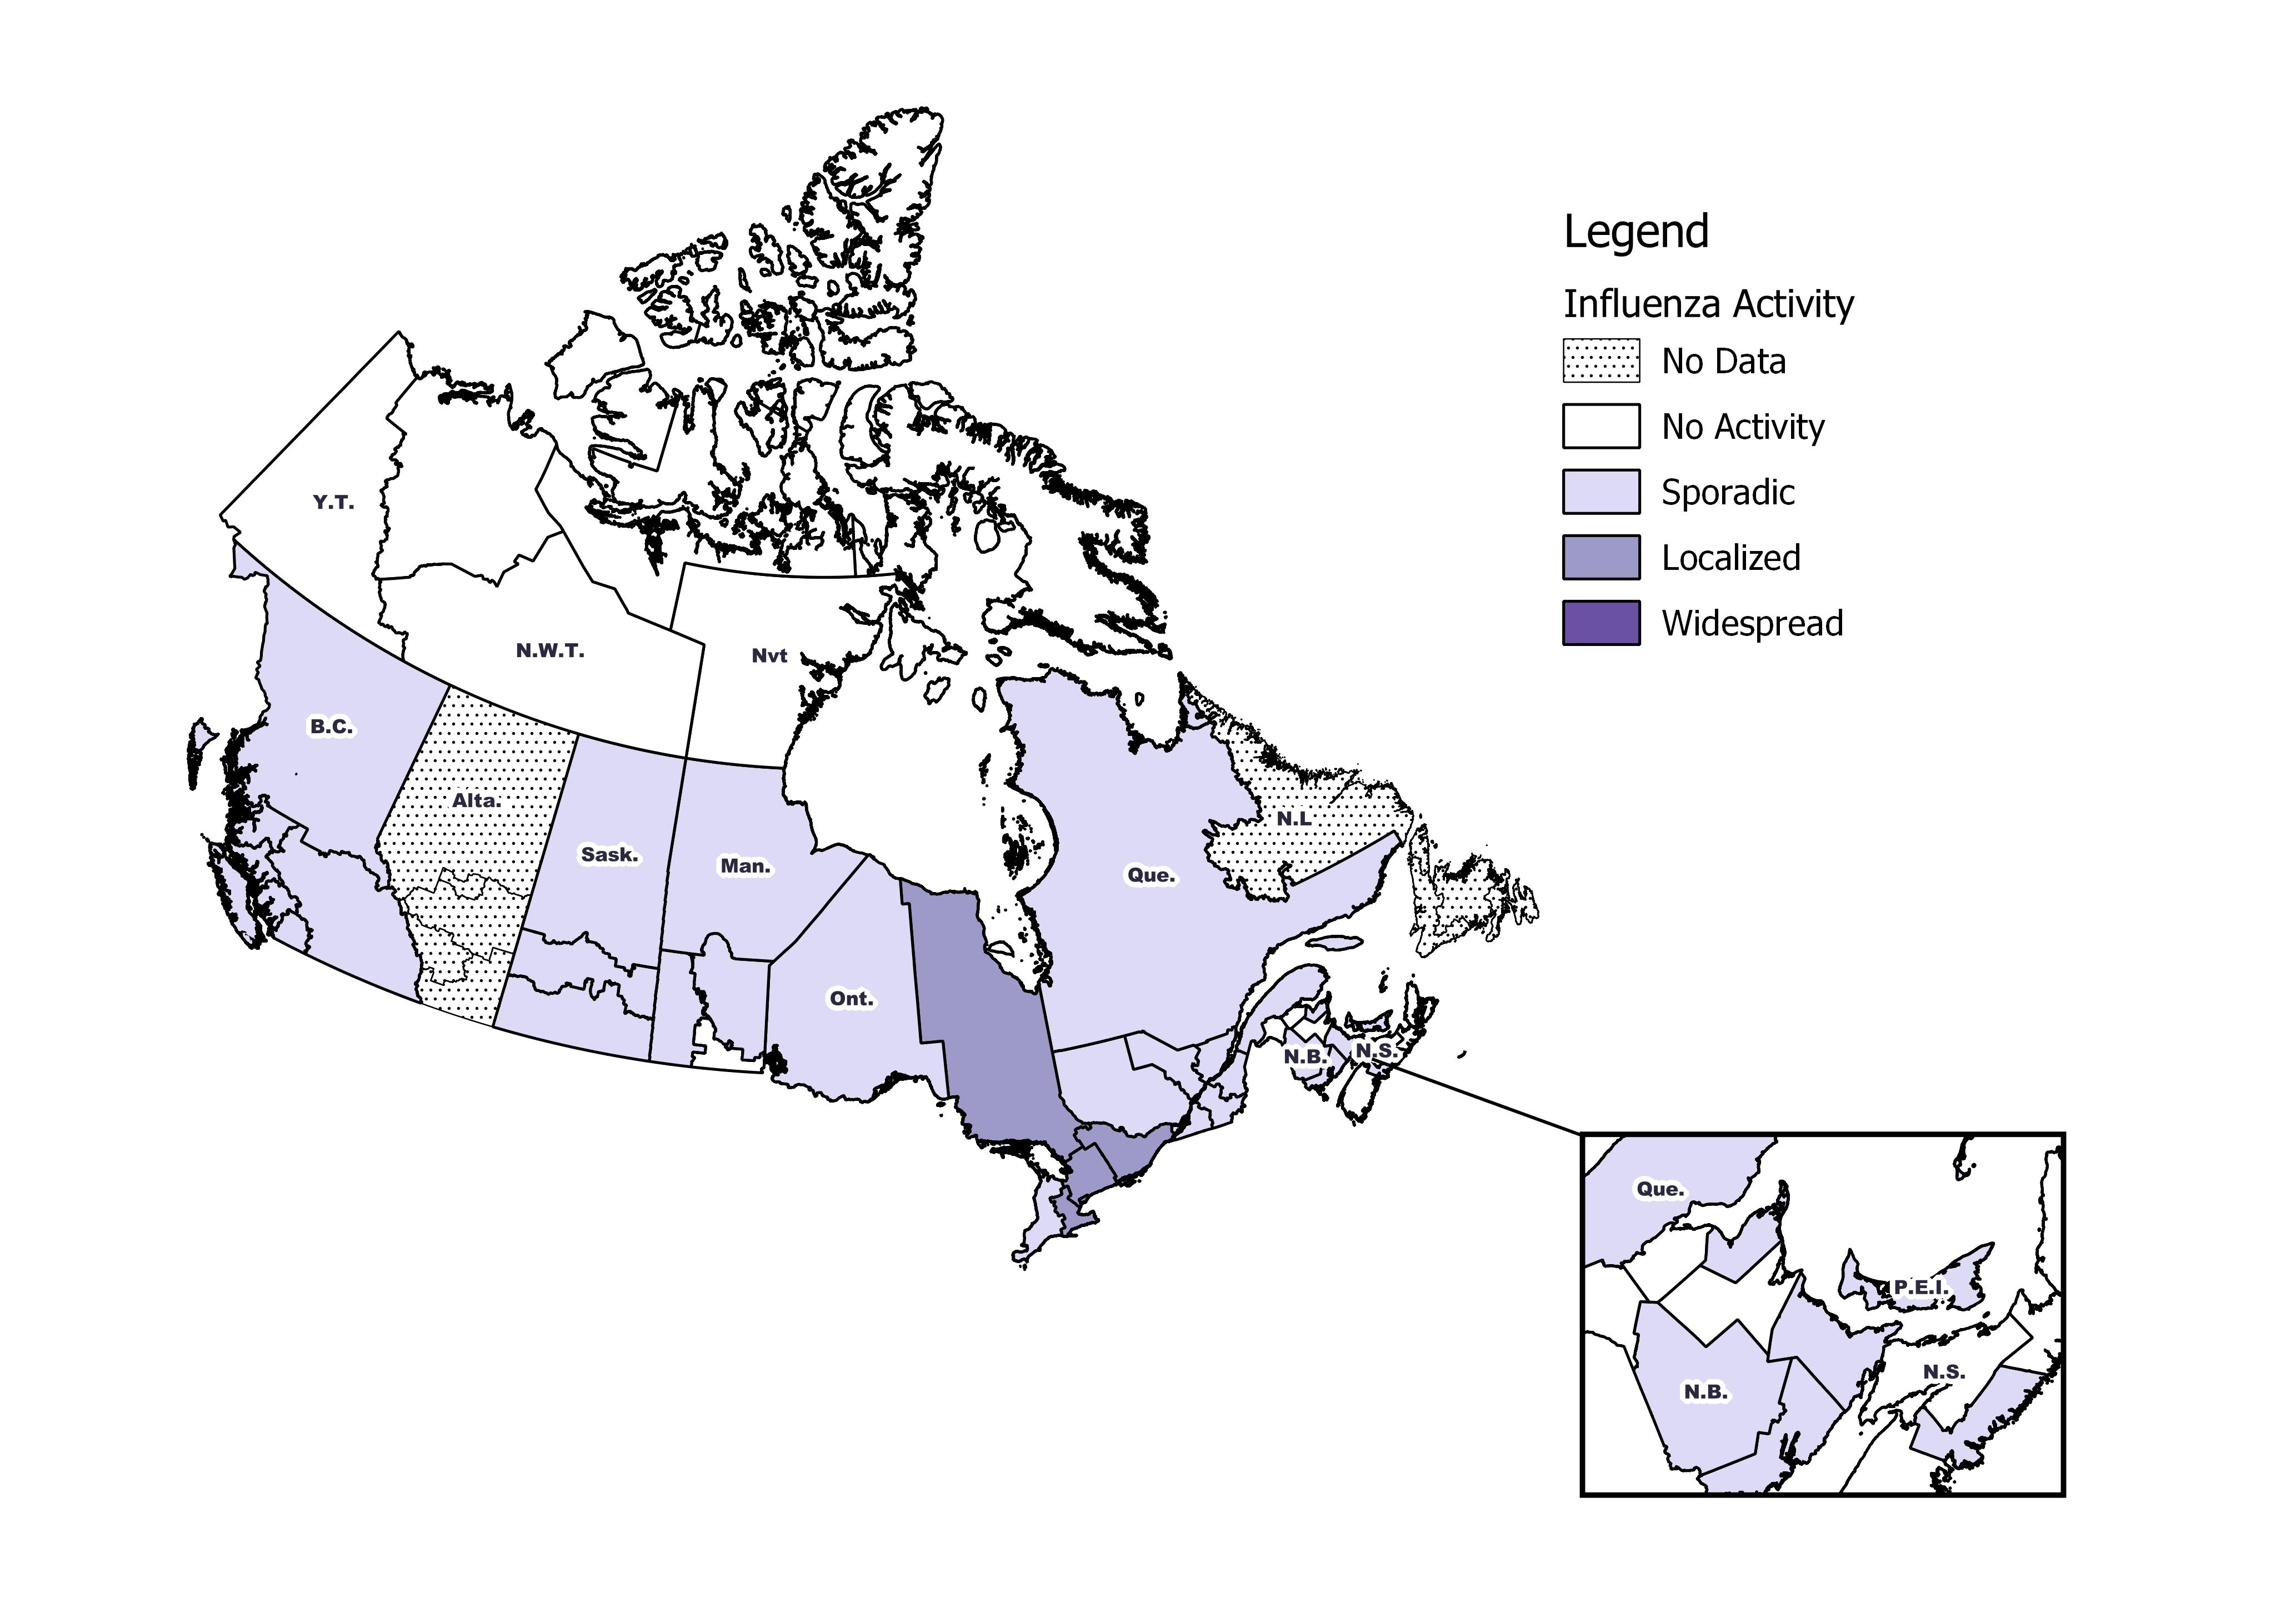
During week 19, the following influenza activity levels were reported (Figure 1):[/FONT]
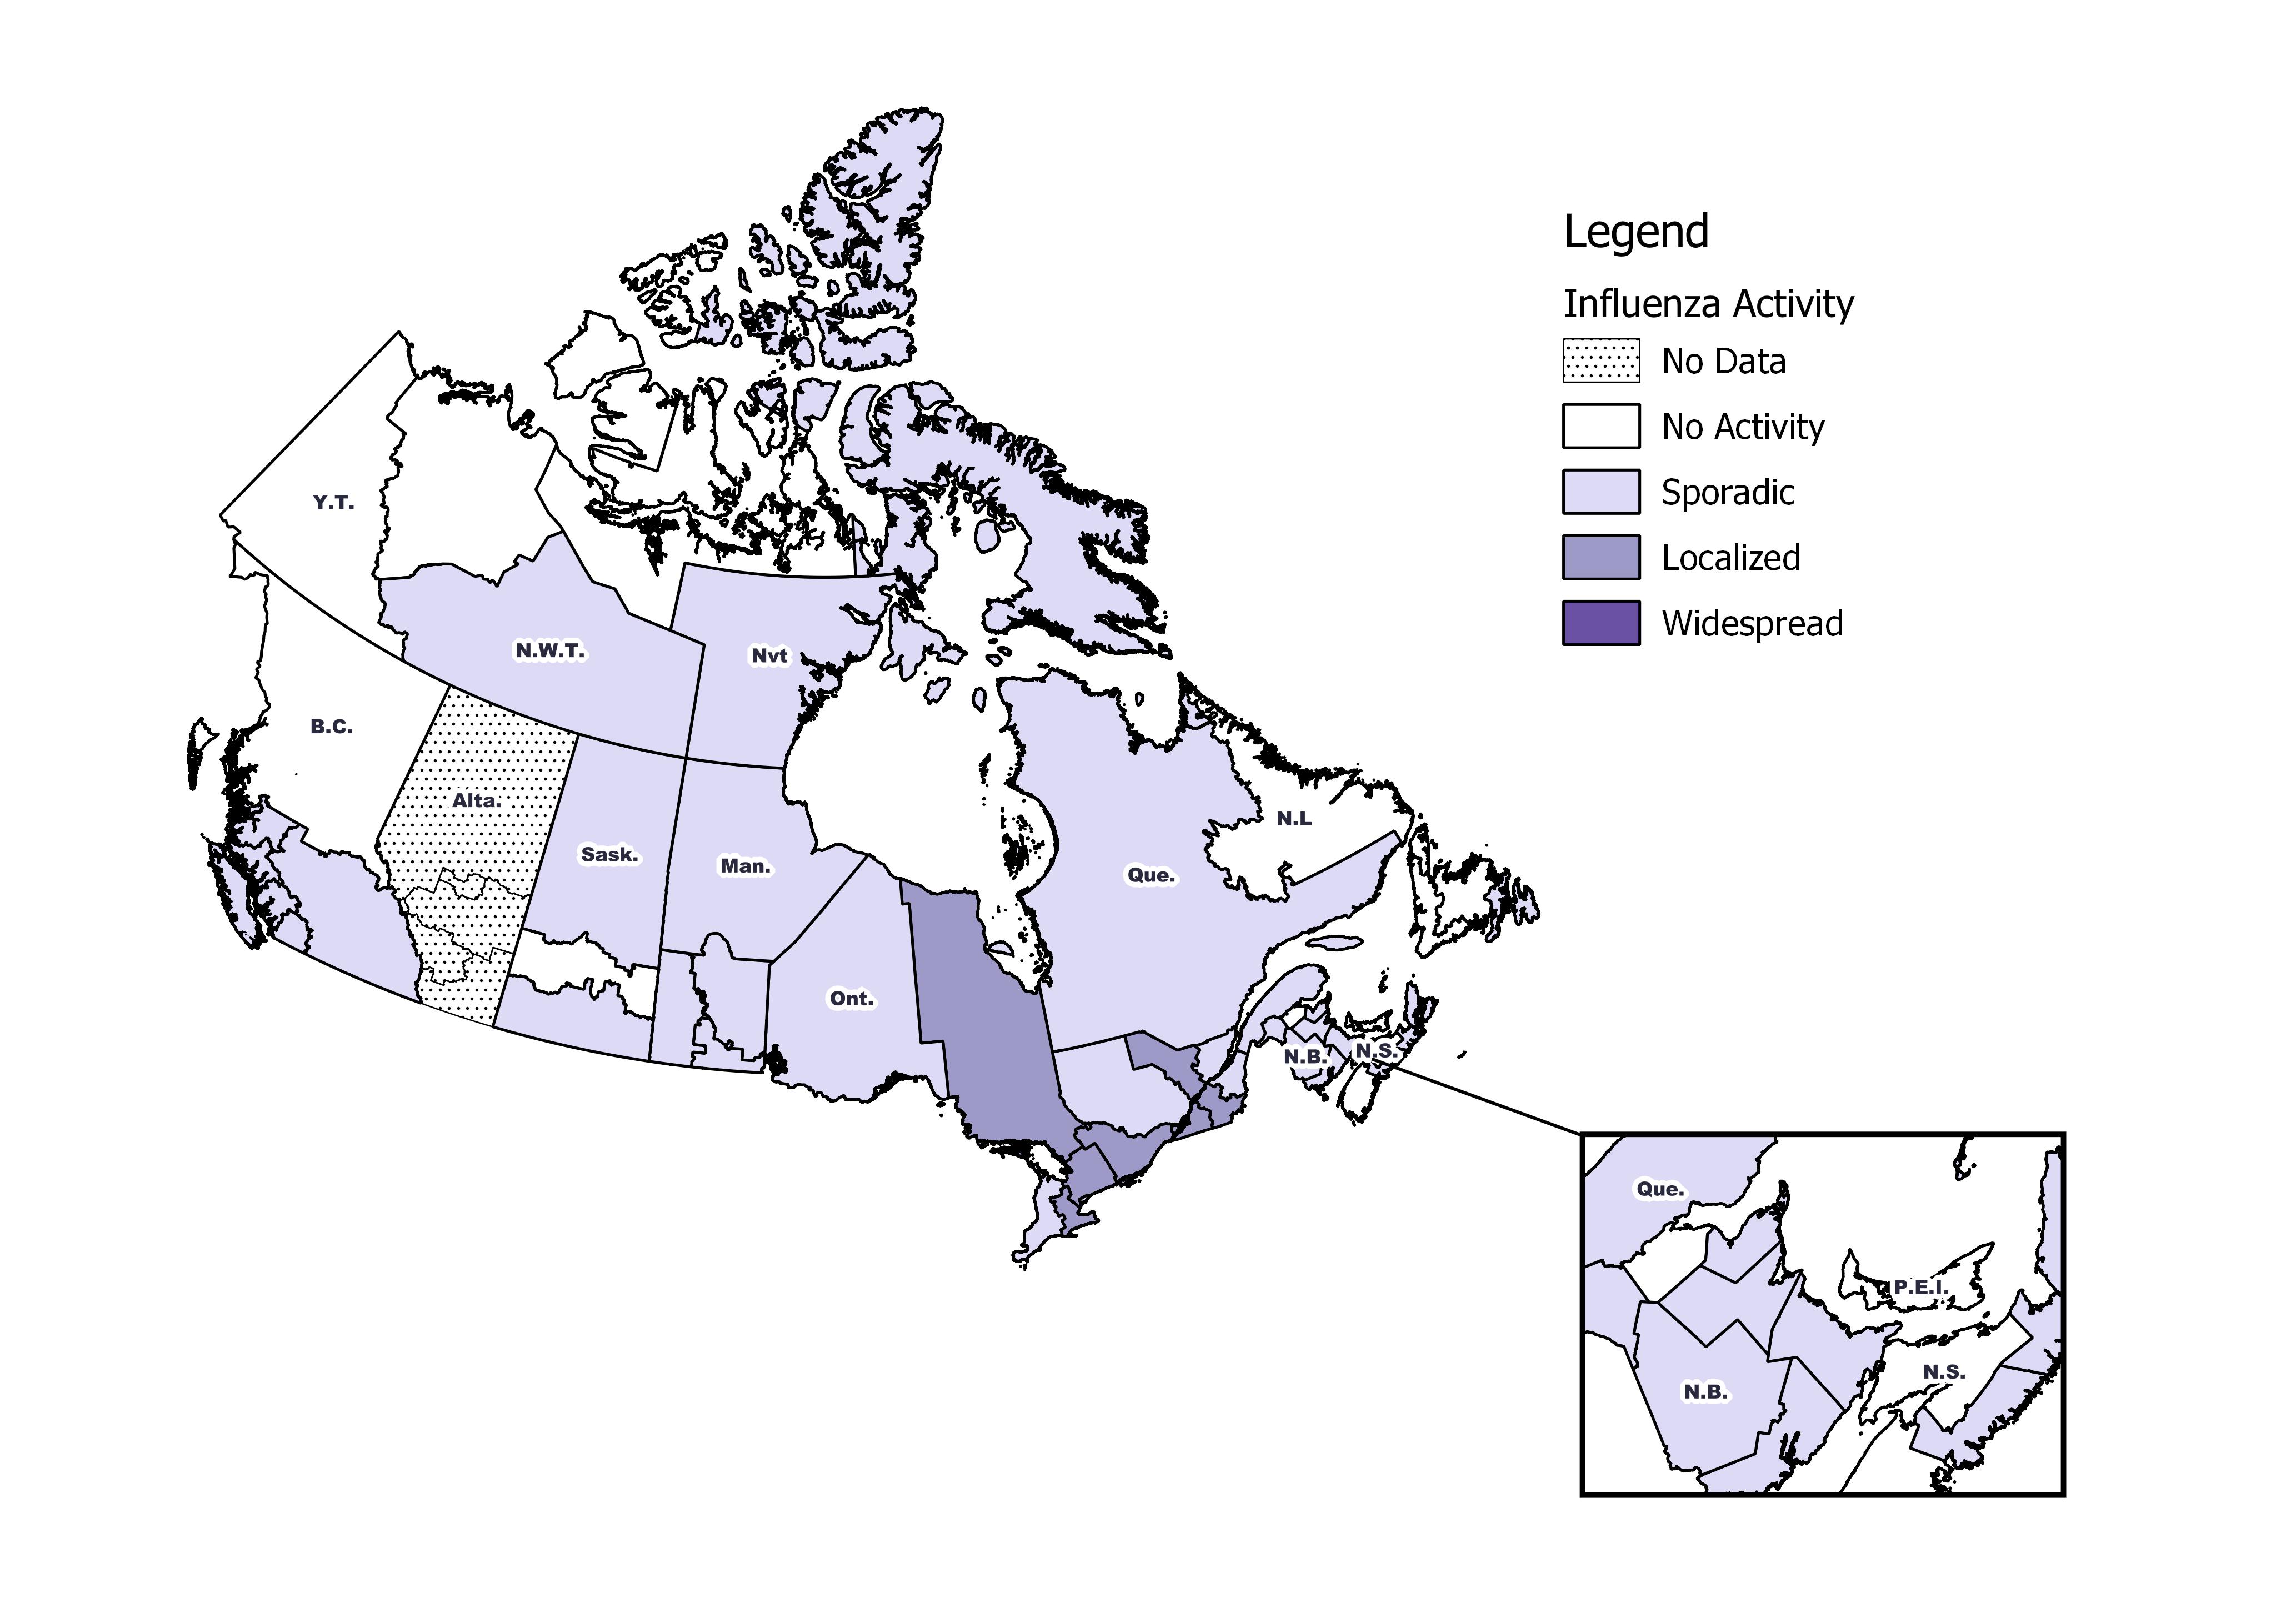 Figure 1 - Text equivalentLaboratory-Confirmed Influenza Detections
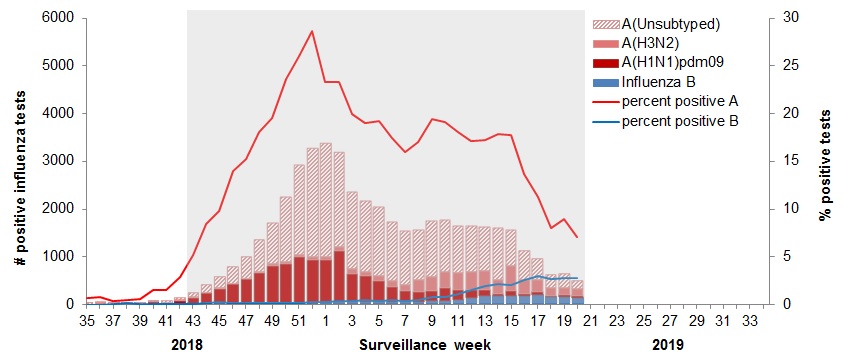
In week 19, the following results were reported from sentinel laboratories across (Figures 2 and 3):[/FONT]
Figure 2 ? Number of positive influenza tests and percentage of tests positive, by type, subtype and report week, Canada, weeks 2018-35 to 2019-19
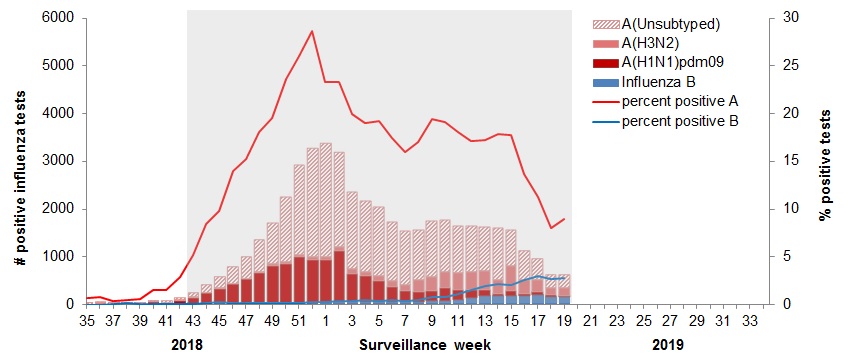 The shaded area indicates weeks where the positivity rate was at least 5% and a minimum of 15 positive tests were observed, signalling the period of seasonal influenza activity.
Data for week 14 excludes subtyping results from one jurisdiction due to batch reporting of subtype information. The results for week 14 should be interpreted with caution.
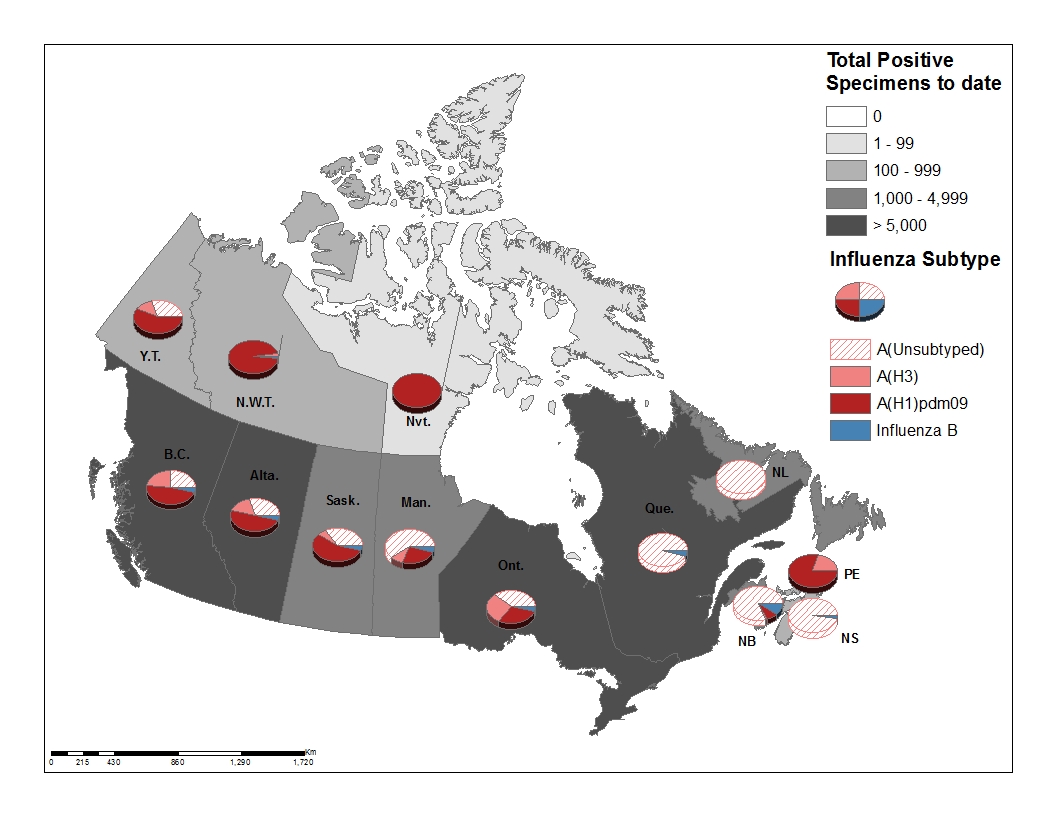
Figure 2 - Text equivalentFigure 3 ? Cumulative numbers of positive influenza specimens by type/subtype and province/territory, Canada, weeks 2018-35 to 2019-19
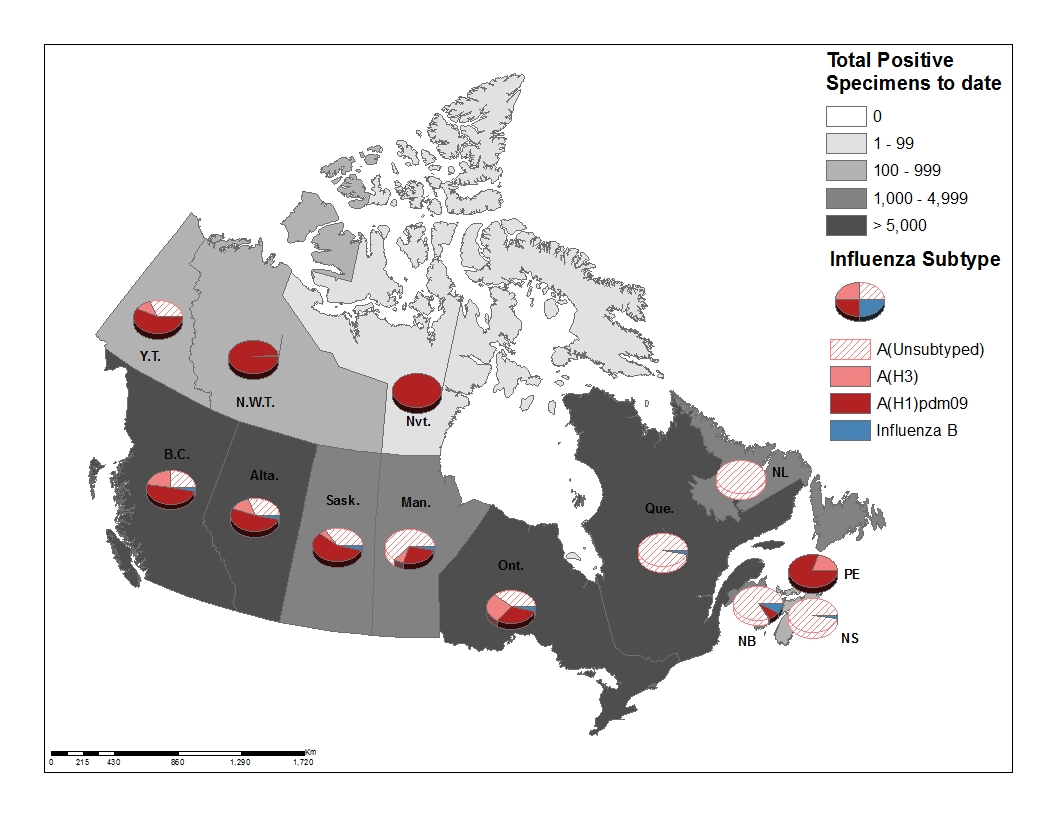 Figure 3 - Text equivalent[/FONT] [TABLE="class: table table-striped table-bordered table-hover table-condensed, width: 1140"]
[TR]
[/TR]
[TR]
[/TR]
[TR]
[/TR]
[TR="bgcolor: #F5F5F5"]
[TD][FONT="]0-4[/FONT][/TD]
[TD][FONT="]6707[/FONT][/TD]
[TD][FONT="]1689[/FONT][/TD]
[TD][FONT="]248[/FONT][/TD]
[TD][FONT="]4770[/FONT][/TD]
[TD][FONT="]286[/FONT][/TD]
[TD][FONT="]6993[/FONT][/TD]
[TD][FONT="]18%[/FONT][/TD]
[/TR]
[TR]
[TD][FONT="]5-19[/FONT][/TD]
[TD][FONT="]5127[/FONT][/TD]
[TD][FONT="]1389[/FONT][/TD]
[TD][FONT="]471[/FONT][/TD]
[TD][FONT="]3267[/FONT][/TD]
[TD][FONT="]482[/FONT][/TD]
[TD][FONT="]5609[/FONT][/TD]
[TD][FONT="]15%[/FONT][/TD]
[/TR]
[TR="bgcolor: #F5F5F5"]
[TD][FONT="]20-44[/FONT][/TD]
[TD][FONT="]6847[/FONT][/TD]
[TD][FONT="]2012[/FONT][/TD]
[TD][FONT="]596[/FONT][/TD]
[TD][FONT="]4239[/FONT][/TD]
[TD][FONT="]308[/FONT][/TD]
[TD][FONT="]7155[/FONT][/TD]
[TD][FONT="]19%[/FONT][/TD]
[/TR]
[TR]
[TD][FONT="]45-64[/FONT][/TD]
[TD][FONT="]6964[/FONT][/TD]
[TD][FONT="]1963[/FONT][/TD]
[TD][FONT="]632[/FONT][/TD]
[TD][FONT="]4369[/FONT][/TD]
[TD][FONT="]115[/FONT][/TD]
[TD][FONT="]7079[/FONT][/TD]
[TD][FONT="]19%[/FONT][/TD]
[/TR]
[TR="bgcolor: #F5F5F5"]
[TD][FONT="]65+[/FONT][/TD]
[TD][FONT="]10761[/FONT][/TD]
[TD][FONT="]1480[/FONT][/TD]
[TD][FONT="]2667[/FONT][/TD]
[TD][FONT="]6614[/FONT][/TD]
[TD][FONT="]247[/FONT][/TD]
[TD][FONT="]11008[/FONT][/TD]
[TD][FONT="]29%[/FONT][/TD]
[/TR]
[TR]
[TD][FONT="]Total[/FONT][/TD]
[TD][FONT="]36406[/FONT][/TD]
[TD][FONT="]8533[/FONT][/TD]
[TD][FONT="]4614[/FONT][/TD]
[TD][FONT="]23259[/FONT][/TD]
[TD][FONT="]1438[/FONT][/TD]
[TD][FONT="]37844[/FONT][/TD]
[TD][FONT="]100%[/FONT][/TD]
[/TR]
[TR]
[TD="colspan: 8"][FONT="]Table 1 ? Note 1UnS: unsubtyped: The specimen was typed as influenza A, but no result for subtyping was available.
Return to Table 1 ? Note1 referrer.[/FONT][/TD]
[/TR]
[/TABLE]
[FONT="]Syndromic / Influenza-like Illness Surveillance
Healthcare Professionals Sentinel Syndromic Surveillance
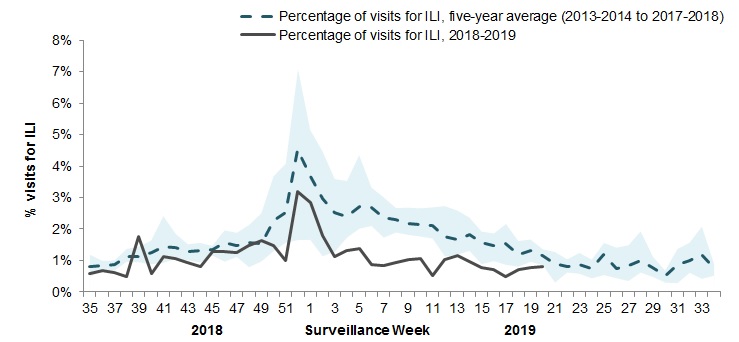
In week 19, 0.8% of visits to healthcare professionals were due to influenza-like illness (ILI) (Figure 4).
Figure 4 ? Percentage of visits for ILI reported by sentinels by report week, Canada, weeks 2018-35 to 2019-19
Number of Sentinels Reporting in Week 19: 72
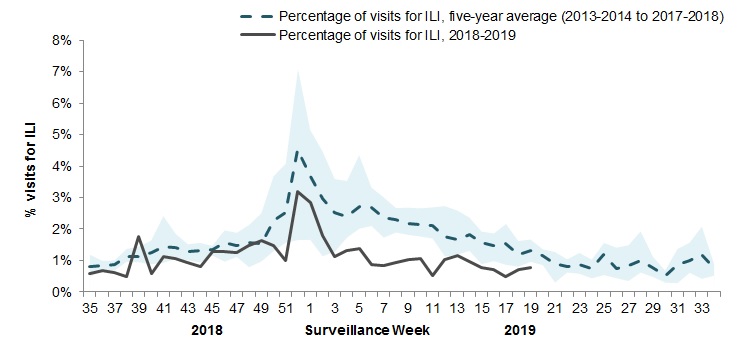 The shaded area represents the maximum and minimum percentage of visits for ILI reported by week from seasons 2013-2014 to 2017-2018
Figure 4 - Text equivalentParticipatory Syndromic Surveillance
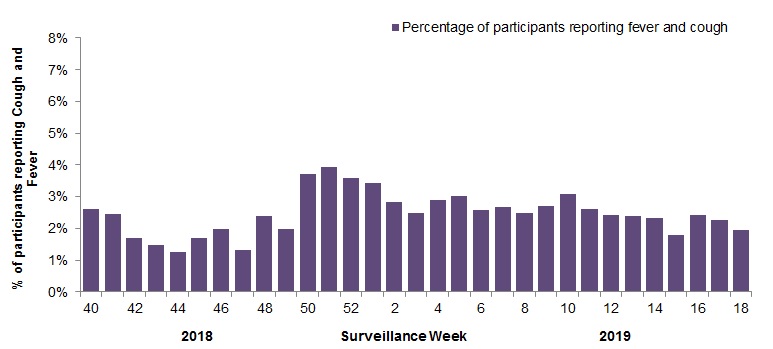
FluWatchers surveillance has ended for the 2018-19 influenza season. On average 2,097 participants reported to FluWatchers each week, resulting in 64,672 questionnaires completed this season. The proportion of participants reporting fever and cough peaked in week 51 at 3.9% (Figure 5). Approximately 63% of FluWatchers participants reported being vaccinated for influenza in the 2018-19 season.
Figure 5 - Percentage of participants reporting cough and fever, Canada, weeks 2018-40 to 2019-18
Number of Participants Reporting in Week 18: 1,951
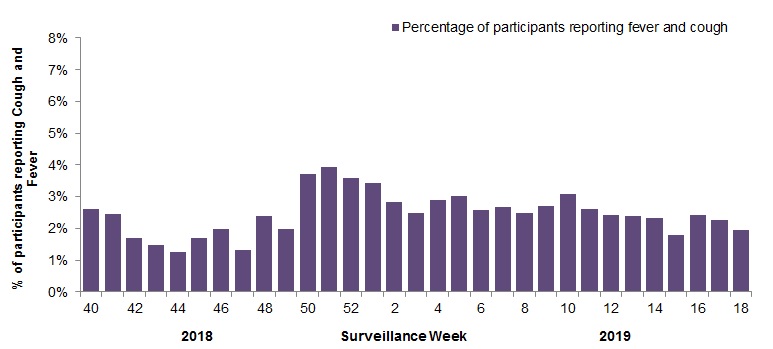
Figure 5 - Text equivalentInfluenza Outbreak Surveillance
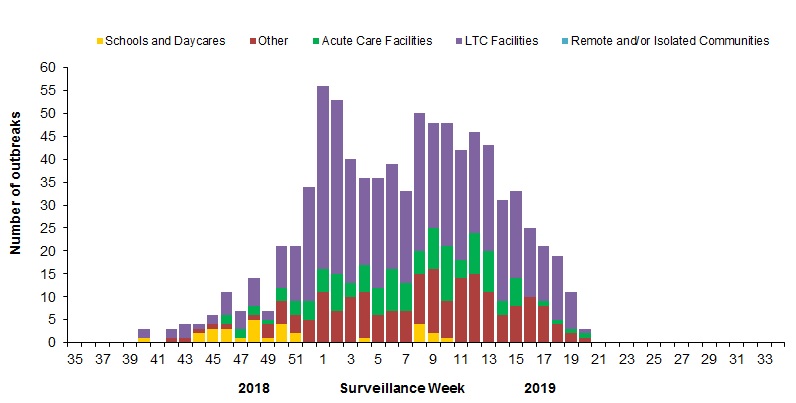
In week 19, 11 new laboratory-confirmed influenza outbreaks were reported: long-term care facilities (LTCF) (8) acute care facilities (1) and other settings (2). Four new ILI outbreaks were reported in LTCF. Among the outbreaks with available information (11), 10 were associated with influenza A (of which 2 were associated with A(H3N2)), and one outbreak was associated with influenza B.
To date this season, 838 laboratory-confirmed influenza outbreaks have been reported (Figure 6):[/FONT]
Figure 6 ? Number of new outbreaks of laboratory-confirmed influenza by report week, Canada, weeks 2018-35 to 2019-19
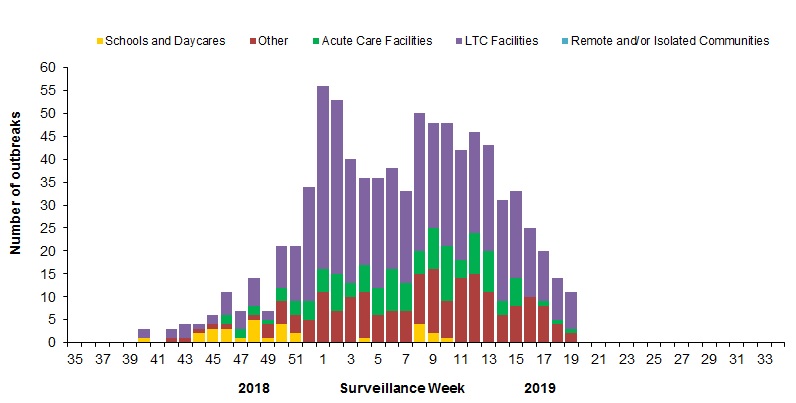 Figure 6 - Text equivalentSevere Outcomes Influenza Surveillance
Provincial/Territorial Influenza Hospitalizations and Deaths
To date this season, 3,092 influenza-associated hospitalizations have been reported by participating provinces and territoriesFootnote1. Note that data from one participating jurisdiction has not been available since surveillance week 13, so these figures are an underestimate of cases for this season.
Hospitalizations (Table 2):[/FONT]
[TR]
[/TR]
[TR]
[/TR]
[TR="bgcolor: #F5F5F5"]
[TD][FONT="]0-4[/FONT][/TD]
[TD][FONT="]394[/FONT][/TD]
[TD][FONT="]23[/FONT][/TD]
[TD][FONT="]87.61[/FONT][/TD]
[/TR]
[TR]
[TD][FONT="]5-19[/FONT][/TD]
[TD][FONT="]235[/FONT][/TD]
[TD][FONT="]20[/FONT][/TD]
[TD][FONT="]18.38[/FONT][/TD]
[/TR]
[TR="bgcolor: #F5F5F5"]
[TD][FONT="]20-44[/FONT][/TD]
[TD][FONT="]354[/FONT][/TD]
[TD][FONT="]10[/FONT][/TD]
[TD][FONT="]12.79[/FONT][/TD]
[/TR]
[TR]
[TD][FONT="]45-64[/FONT][/TD]
[TD][FONT="]776[/FONT][/TD]
[TD][FONT="]7[/FONT][/TD]
[TD][FONT="]35.98[/FONT][/TD]
[/TR]
[TR="bgcolor: #F5F5F5"]
[TD][FONT="]65+[/FONT][/TD]
[TD][FONT="]1259[/FONT][/TD]
[TD][FONT="]14[/FONT][/TD]
[TD][FONT="]104.63[/FONT][/TD]
[/TR]
[TR]
[TD][FONT="]Total[/FONT][/TD]
[TD][FONT="]3018[/FONT][/TD]
[TD][FONT="]74[/FONT][/TD]
[TD] [/TD]
[/TR]
[TR="bgcolor: #F5F5F5"]
[TD][FONT="]%[/FONT][/TD]
[TD][FONT="]97.6%[/FONT][/TD]
[TD][FONT="]2.4%[/FONT][/TD]
[TD] [/TD]
[/TR]
[TR]
[TD="colspan: 8"][FONT="]Table 2 ? Note 1Influenza-associated hospitalizations are reported by N.L., P.E.I, N.S., N.B., Man., Alb., Y.T. and N.W.T. Only hospitalizations that require intensive medical care are reported by Sask. The cumulative rate of hospitalizations is calculated using the population by age-group in participating provinces and territories.
Return to Table 2 ? Note1[/FONT][/TD]
[/TR]
[/TABLE]
[FONT="]Pediatric Influenza Hospitalizations and Deaths
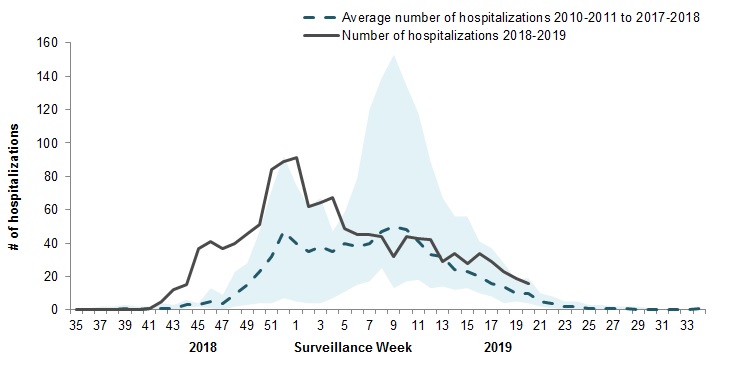
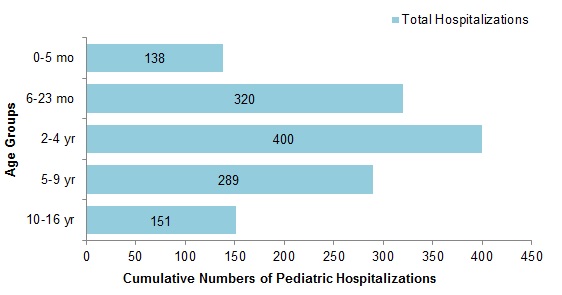
To date this season, 1,280 pediatric hospitalizations have been reported (Figure 7 & 8):[/FONT]
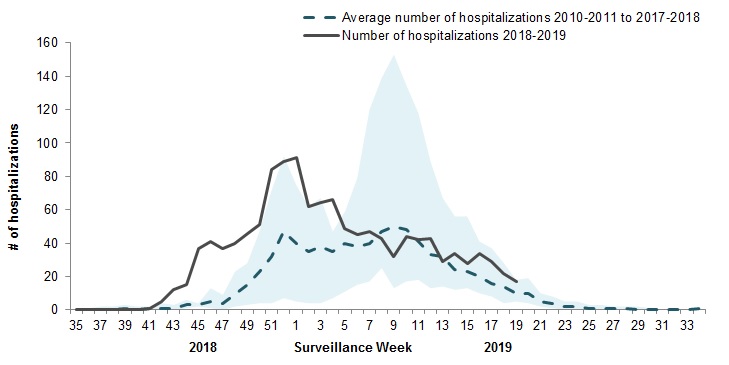 The shaded area represents the maximum and minimum number of cases reported by week from seasons 2010-11 to 2017-18
Figure 7 - Text equivalentFigure 8 - Cumulative numbers of pediatric hospitalizations (≤16 years of age) with influenza by age-group reported by the IMPACT network, Canada, weeks 2018-35 to 2019-19
 Figure 8 - Text equivalentAdult Influenza Hospitalizations and Deaths
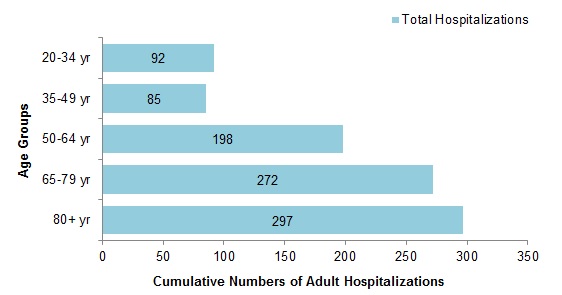
Surveillance of laboratory-confirmed influenza-associated adult (≥16 years of age) hospitalizations by the Canadian Immunization Research Network (CIRN) Serious Outcomes Surveillance (SOS) network began on November 1st for the 2018-19 season.
To date this season, 942 hospitalizations, 115 ICU admissions and 54 deaths have been reported (Figure 9):[/FONT]
 Figure 9 - Text equivalentInfluenza Strain Characterizations
From September 1, 2018 to 16 May, 2019, the National Microbiology Laboratory (NML) has characterized 2 170 influenza viruses (440 A(H3N2), 1,594 A(H1N1) and 136 B) that were received from Canadian laboratories.
Genetic Characterization of Influenza A(H3N2):
191 influenza A(H3N2) viruses did not grow to sufficient hemagglutination titer for antigenic characterization by hemagglutination inhibition (HI) assay. Therefore, NML has performed genetic characterization to determine the genetic group identity of these viruses.
Sequence analysis of the HA gene of the viruses showed that:[/FONT]
Antigenic Characterization:
Influenza A (H3N2):[/FONT]
Influenza B viruses can be divided into two antigenically distinct lineages represented by B/Yamagata/16/88 and B/Victoria/2/87 viruses. The recommended influenza B components for the 2018-19 Northern Hemisphere influenza vaccine are B/Colorado/06/2017 (Victoria lineage) and B/Phuket/3073/2013 (Yamagata lineage).[/FONT]
[FONT="]
Download the alternative format
(PDF format, 1.17 MB, 10 pages)
Organization: Public Health Agency of Canada
Date published: 2019-05-17
Related Topics[/FONT]
- [FONT="]Flu (influenza)[/FONT]
- [FONT="]Influenza surveillance[/FONT]
[FONT="]Overall Summary[/FONT]
- [FONT="]Influenza activity continues to decline overall.[/FONT]
- [FONT="]Influenza A(H3N2) was the predominant subtype this week (83% of subtyped influenza A detections); however, influenza A(H1N1)pdm09 remains the predominant subtype to date this season (71% of subtyped influenza A detections).[/FONT]
- [FONT="]Detections of influenza A continue to be greater than those of influenza B. There is currently very little influenza B circulation compared to previous seasons.[/FONT]
- [FONT="]Influenza/ILI Activity (geographic spread)[/FONT]
- [FONT="]Laboratory Confirmed Influenza Detections[/FONT]
- [FONT="]Syndromic/Influenza-like Illness Surveillance[/FONT]
- [FONT="]Participatory Syndromic Surveillance[/FONT]
- [FONT="]Influenza Outbreak Surveillance[/FONT]
- [FONT="]Severe Outcomes Influenza Surveillance[/FONT]
- [FONT="]Influenza Strain Characterizations[/FONT]
- [FONT="]Antiviral Resistance[/FONT]
- [FONT="]Vaccine Monitoring[/FONT]
- [FONT="]Provincial and International Influenza Reports[/FONT]
[FONT="]Influenza/Influenza-like Illness Activity (geographic spread)
During week 19, the following influenza activity levels were reported (Figure 1):[/FONT]
- [FONT="]7 regions reported localized activity: in Ont.(4), Que.(3).[/FONT]
- [FONT="]29 regions reported sporadic activity: in B.C.(4), Sask.(2), Man.(5), Ont. (3), Que.(3), N.S.(2), N.B.(6), N.L.(1), Nvt. (2) and N.W.T.(1)[/FONT]
- [FONT="]12 regions in 9 different provinces and territories reported no activity.[/FONT]
In week 19, the following results were reported from sentinel laboratories across (Figures 2 and 3):[/FONT]
- [FONT="]The percentage of tests positive for influenza increased slightly from 11% to 12% in week 19.[/FONT]
- [FONT="]A total of 592 laboratory detections of influenza were reported, of which 76% were influenza A.[/FONT]
- [FONT="]Influenza A(H3N2) accounted for 83% of subtyped influenza A detections.[/FONT]
- [FONT="]96% have been influenza A.[/FONT]
- [FONT="]Among the 15,938 influenza A viruses subtyped, 71% have been A(H1N1)pdm09.[/FONT]
- [FONT="]Influenza B often circulates later in the season in Canada (Feb-Apr). Fewer influenza B detections have been reported this season compared to recent seasons at this time of year. The percentage of tests positive for influenza B in week 19 was similar to the previous week.[/FONT]
- [FONT="]83% of all influenza A(H1N1)pdm09 detections have been reported in individuals younger than 65 years of age.[/FONT]
- [FONT="]58% of all influenza A(H3N2) detections have been reported in adults 65 years of age and older.[/FONT]
Figure 2 ? Number of positive influenza tests and percentage of tests positive, by type, subtype and report week, Canada, weeks 2018-35 to 2019-19
Data for week 14 excludes subtyping results from one jurisdiction due to batch reporting of subtype information. The results for week 14 should be interpreted with caution.
Figure 2 - Text equivalentFigure 3 ? Cumulative numbers of positive influenza specimens by type/subtype and province/territory, Canada, weeks 2018-35 to 2019-19
[TR]
[/TR]
[TR]
[/TR]
[TR]
[/TR]
[TR="bgcolor: #F5F5F5"]
[TD][FONT="]0-4[/FONT][/TD]
[TD][FONT="]6707[/FONT][/TD]
[TD][FONT="]1689[/FONT][/TD]
[TD][FONT="]248[/FONT][/TD]
[TD][FONT="]4770[/FONT][/TD]
[TD][FONT="]286[/FONT][/TD]
[TD][FONT="]6993[/FONT][/TD]
[TD][FONT="]18%[/FONT][/TD]
[/TR]
[TR]
[TD][FONT="]5-19[/FONT][/TD]
[TD][FONT="]5127[/FONT][/TD]
[TD][FONT="]1389[/FONT][/TD]
[TD][FONT="]471[/FONT][/TD]
[TD][FONT="]3267[/FONT][/TD]
[TD][FONT="]482[/FONT][/TD]
[TD][FONT="]5609[/FONT][/TD]
[TD][FONT="]15%[/FONT][/TD]
[/TR]
[TR="bgcolor: #F5F5F5"]
[TD][FONT="]20-44[/FONT][/TD]
[TD][FONT="]6847[/FONT][/TD]
[TD][FONT="]2012[/FONT][/TD]
[TD][FONT="]596[/FONT][/TD]
[TD][FONT="]4239[/FONT][/TD]
[TD][FONT="]308[/FONT][/TD]
[TD][FONT="]7155[/FONT][/TD]
[TD][FONT="]19%[/FONT][/TD]
[/TR]
[TR]
[TD][FONT="]45-64[/FONT][/TD]
[TD][FONT="]6964[/FONT][/TD]
[TD][FONT="]1963[/FONT][/TD]
[TD][FONT="]632[/FONT][/TD]
[TD][FONT="]4369[/FONT][/TD]
[TD][FONT="]115[/FONT][/TD]
[TD][FONT="]7079[/FONT][/TD]
[TD][FONT="]19%[/FONT][/TD]
[/TR]
[TR="bgcolor: #F5F5F5"]
[TD][FONT="]65+[/FONT][/TD]
[TD][FONT="]10761[/FONT][/TD]
[TD][FONT="]1480[/FONT][/TD]
[TD][FONT="]2667[/FONT][/TD]
[TD][FONT="]6614[/FONT][/TD]
[TD][FONT="]247[/FONT][/TD]
[TD][FONT="]11008[/FONT][/TD]
[TD][FONT="]29%[/FONT][/TD]
[/TR]
[TR]
[TD][FONT="]Total[/FONT][/TD]
[TD][FONT="]36406[/FONT][/TD]
[TD][FONT="]8533[/FONT][/TD]
[TD][FONT="]4614[/FONT][/TD]
[TD][FONT="]23259[/FONT][/TD]
[TD][FONT="]1438[/FONT][/TD]
[TD][FONT="]37844[/FONT][/TD]
[TD][FONT="]100%[/FONT][/TD]
[/TR]
[TR]
[TD="colspan: 8"][FONT="]Table 1 ? Note 1UnS: unsubtyped: The specimen was typed as influenza A, but no result for subtyping was available.
Return to Table 1 ? Note1 referrer.[/FONT][/TD]
[/TR]
[/TABLE]
[FONT="]Syndromic / Influenza-like Illness Surveillance
Healthcare Professionals Sentinel Syndromic Surveillance
In week 19, 0.8% of visits to healthcare professionals were due to influenza-like illness (ILI) (Figure 4).
Figure 4 ? Percentage of visits for ILI reported by sentinels by report week, Canada, weeks 2018-35 to 2019-19
Number of Sentinels Reporting in Week 19: 72
Figure 4 - Text equivalentParticipatory Syndromic Surveillance
FluWatchers surveillance has ended for the 2018-19 influenza season. On average 2,097 participants reported to FluWatchers each week, resulting in 64,672 questionnaires completed this season. The proportion of participants reporting fever and cough peaked in week 51 at 3.9% (Figure 5). Approximately 63% of FluWatchers participants reported being vaccinated for influenza in the 2018-19 season.
Figure 5 - Percentage of participants reporting cough and fever, Canada, weeks 2018-40 to 2019-18
Number of Participants Reporting in Week 18: 1,951
Figure 5 - Text equivalentInfluenza Outbreak Surveillance
In week 19, 11 new laboratory-confirmed influenza outbreaks were reported: long-term care facilities (LTCF) (8) acute care facilities (1) and other settings (2). Four new ILI outbreaks were reported in LTCF. Among the outbreaks with available information (11), 10 were associated with influenza A (of which 2 were associated with A(H3N2)), and one outbreak was associated with influenza B.
To date this season, 838 laboratory-confirmed influenza outbreaks have been reported (Figure 6):[/FONT]
- [FONT="]496 (59%) outbreaks were in LTCF, 30 were in schools and daycares, 120 in acute care facilities, and 192 were in other settings.[/FONT]
- [FONT="]Among the 752 outbreaks for which the influenza type was available, 98% (734) were associated with influenza A.[/FONT]
- [FONT="]Among the 323 outbreaks for which the influenza A subtype was available, 59% (192) were associated with influenza A(H3N2);[/FONT]
Figure 6 ? Number of new outbreaks of laboratory-confirmed influenza by report week, Canada, weeks 2018-35 to 2019-19
Provincial/Territorial Influenza Hospitalizations and Deaths
To date this season, 3,092 influenza-associated hospitalizations have been reported by participating provinces and territoriesFootnote1. Note that data from one participating jurisdiction has not been available since surveillance week 13, so these figures are an underestimate of cases for this season.
Hospitalizations (Table 2):[/FONT]
- [FONT="]97.6% (3,018) were associated with influenza A[/FONT]
- [FONT="]Among the 1,704 cases for which the influenza subtype was available, 1,414 (83%) were associated with A(H1N1)pdm09.[/FONT]
- [FONT="]The highest estimated rate of hospitalization is among adults over 65 years of age.[/FONT]
- [FONT="]To date this season 555 ICU admissions and 182 deaths have been reported.[/FONT]
- [FONT="]41% (227) of reported ICU admissions were in adults aged 45-64 years.[/FONT]
- [FONT="]All but eight ICU admissions were associated with influenza A.[/FONT]
- [FONT="]All but one of the deaths were associated with influenza A.[/FONT]
[TR]
[/TR]
[TR]
[/TR]
[TR="bgcolor: #F5F5F5"]
[TD][FONT="]0-4[/FONT][/TD]
[TD][FONT="]394[/FONT][/TD]
[TD][FONT="]23[/FONT][/TD]
[TD][FONT="]87.61[/FONT][/TD]
[/TR]
[TR]
[TD][FONT="]5-19[/FONT][/TD]
[TD][FONT="]235[/FONT][/TD]
[TD][FONT="]20[/FONT][/TD]
[TD][FONT="]18.38[/FONT][/TD]
[/TR]
[TR="bgcolor: #F5F5F5"]
[TD][FONT="]20-44[/FONT][/TD]
[TD][FONT="]354[/FONT][/TD]
[TD][FONT="]10[/FONT][/TD]
[TD][FONT="]12.79[/FONT][/TD]
[/TR]
[TR]
[TD][FONT="]45-64[/FONT][/TD]
[TD][FONT="]776[/FONT][/TD]
[TD][FONT="]7[/FONT][/TD]
[TD][FONT="]35.98[/FONT][/TD]
[/TR]
[TR="bgcolor: #F5F5F5"]
[TD][FONT="]65+[/FONT][/TD]
[TD][FONT="]1259[/FONT][/TD]
[TD][FONT="]14[/FONT][/TD]
[TD][FONT="]104.63[/FONT][/TD]
[/TR]
[TR]
[TD][FONT="]Total[/FONT][/TD]
[TD][FONT="]3018[/FONT][/TD]
[TD][FONT="]74[/FONT][/TD]
[TD] [/TD]
[/TR]
[TR="bgcolor: #F5F5F5"]
[TD][FONT="]%[/FONT][/TD]
[TD][FONT="]97.6%[/FONT][/TD]
[TD][FONT="]2.4%[/FONT][/TD]
[TD] [/TD]
[/TR]
[TR]
[TD="colspan: 8"][FONT="]Table 2 ? Note 1Influenza-associated hospitalizations are reported by N.L., P.E.I, N.S., N.B., Man., Alb., Y.T. and N.W.T. Only hospitalizations that require intensive medical care are reported by Sask. The cumulative rate of hospitalizations is calculated using the population by age-group in participating provinces and territories.
Return to Table 2 ? Note1[/FONT][/TD]
[/TR]
[/TABLE]
[FONT="]Pediatric Influenza Hospitalizations and Deaths
To date this season, 1,280 pediatric hospitalizations have been reported (Figure 7 & 8):[/FONT]
- [FONT="]66% of cases were in children under 5 years of age.[/FONT]
- [FONT="]93% (1,192) of cases have been associated with influenza A.[/FONT]
- [FONT="]Among the 375 cases for which the influenza subtype was available, 305 (81%) were associated with A(H1N1)pdm09.[/FONT]
- [FONT="]58% (142) of ICU admissions were in children under 5 years of age.[/FONT]
- [FONT="]All but 13 (95%) of the ICU admissions have been associated with influenza A; 84% of the 105 cases for which the influenza A subtype was available were associated with A(H1N1)pdm09.[/FONT]
- [FONT="]80% (8) of deaths occurred in children 2 to 4 years of age.[/FONT]
- [FONT="]All deaths have been associated with influenza A.[/FONT]
Figure 7 - Text equivalentFigure 8 - Cumulative numbers of pediatric hospitalizations (≤16 years of age) with influenza by age-group reported by the IMPACT network, Canada, weeks 2018-35 to 2019-19
Surveillance of laboratory-confirmed influenza-associated adult (≥16 years of age) hospitalizations by the Canadian Immunization Research Network (CIRN) Serious Outcomes Surveillance (SOS) network began on November 1st for the 2018-19 season.
To date this season, 942 hospitalizations, 115 ICU admissions and 54 deaths have been reported (Figure 9):[/FONT]
- [FONT="]873 (93%) hospitalizations were associated with influenza A.[/FONT]
- [FONT="]A greater proportion of hospitalizations have been reported among adults ≥65 years of age (60%) compared to adults <65 years of age (40%).[/FONT]
- [FONT="]Among the 204 cases for which the influenza subtype was available, 107 (52%) were associated with A(H1N1)pdm09.[/FONT]
- [FONT="]86% of hospitalized cases reported more than one type of comorbid condition.[/FONT]
- [FONT="]The most commonly reported comorbidity was endocrine disorders, which were reported in 87% of hospitalized cases.[/FONT]
From September 1, 2018 to 16 May, 2019, the National Microbiology Laboratory (NML) has characterized 2 170 influenza viruses (440 A(H3N2), 1,594 A(H1N1) and 136 B) that were received from Canadian laboratories.
Genetic Characterization of Influenza A(H3N2):
191 influenza A(H3N2) viruses did not grow to sufficient hemagglutination titer for antigenic characterization by hemagglutination inhibition (HI) assay. Therefore, NML has performed genetic characterization to determine the genetic group identity of these viruses.
Sequence analysis of the HA gene of the viruses showed that:[/FONT]
- [FONT="]20 viruses belonged to genetic group 3C.2a.[/FONT]
- [FONT="]168 viruses belonged to subclade 3C.2a1.[/FONT]
- [FONT="]Four viruses belonged to 3C.3a.[/FONT]
- [FONT="]One isolate could not be sequenced.[/FONT]
Antigenic Characterization:
Influenza A (H3N2):[/FONT]
- [FONT="]148 influenza A(H3N2) viruses were antigenically characterized as A/Singapore/INFIMH-16-0019/2016-like by HI testing using antiserum raised against egg-propagated A/Singapore/INFIMH-16-0019/2016.[/FONT]
- [FONT="]99 viruses showed reduced titer with ferret antisera raised against egg-propagated A/Singapore/INFIMH-16-0019/2016.[/FONT]
- [FONT="]A/Singapore/INFIMH-16-0019/2016-like virus is the influenza A(H3N2) component of the 2018-19 Northern Hemisphere influenza vaccine.[/FONT]
- [FONT="]101 influenza A(H3N2) viruses characterized belonged to genetic group 3C.2a1. 20 viruses belonged to genetic group 3C.2a and 116 to 3C.3a. Sequencing is pending for the remaining isolates.[/FONT]
- [FONT="]1,551 A(H1N1) viruses characterized were antigenically similar to A/Michigan/45/2015, which is the influenza A(H1N1) component of the 2018-19 Northern Hemisphere influenza vaccine.[/FONT]
- [FONT="]43 viruses showed reduced titer with ferret antisera raised against cell culture-propagated A/Michigan/45/2015[/FONT]
Influenza B viruses can be divided into two antigenically distinct lineages represented by B/Yamagata/16/88 and B/Victoria/2/87 viruses. The recommended influenza B components for the 2018-19 Northern Hemisphere influenza vaccine are B/Colorado/06/2017 (Victoria lineage) and B/Phuket/3073/2013 (Yamagata lineage).[/FONT]
- [FONT="]25 influenza B viruses were characterized as B/Colorado/06/2017, which belong to the Victoria lineage and are included as an influenza B component of the 2018-19 Northern Hemisphere influenza vaccine.[/FONT]
- [FONT="]88 viruses showed reduced titer with ferret antisera raised against cell culture-propagated B/Colorado/06/2017. Sequence analysis showed that 87 viruses that showed reduced titer had a three amino acid deletion (162-164) in the HA gene.[/FONT]
- [FONT="]23 influenza B viruses were characterized as B/Phuket/3073/2013-like, which belongs to the Yamagata lineage and is included as an influenza B component of the 2018-19 Northern Hemisphere quadrivalent influenza vaccine.[/FONT]
- [FONT="]...[/FONT]