Pathfinder
Editor, Senior Moderator
[h=1]FluWatch report: May 1 to May 21, 2016 (weeks 18-20)[/h] [h=2]Overall Summary[/h]
 Download the alternative format
(PDF format, 876 KB, 9 pages)
Organization: Public Health Agency of Canada
Date published: 2016-05-27
[h=2]Related Topics[/h]
Are you a primary health care practitioner (General Practitioner, Nurse Practitioner or Registered Nurse) interested in becoming a FluWatch sentinel for the 2015-16 influenza season? Contact us at FluWatch@phac-aspc.gc.ca
[h=2]On this page[/h]
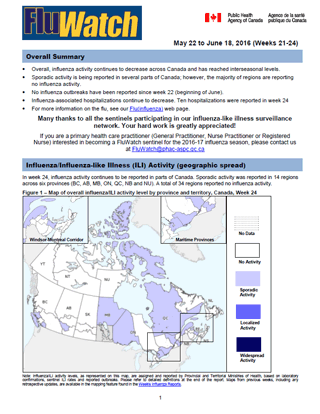
[h=3]Figure 1. Map of overall influenza/ILI activity level by province and territory, Canada, week 20[/h]

Note: Influenza/ILI activity levels, as represented on this map, are assigned and reported by Provincial and Territorial Ministries of Health, based on laboratory confirmations, sentinel ILI rates and reported outbreaks. Please refer to detailed definitions at the end of the report. Maps from previous weeks, including any retrospective updates, are available in the mapping feature found in the Weekly Influenza Reports.
Figure 1 - Text Description [h=2]Laboratory Confirmed Influenza Detections[/h] In weeks 18-20, the percentage of tests positive for influenza continued to decrease [from 17% in week 17.0 to 9.4% in week 20], driven by the decline in influenza A. Compared to the previous five seasons, the percent positive (9.4%) reported in week 20 was above the five year average for that week and exceeded the expected levels (confidence interval 5.0-9.2%). With the late start to the 2015-16 influenza season, these elevated levels are not unexpected.
[h=3]Figure 2. Number of positive influenza tests and percentage of tests positive, by type, subtype and report week, Canada, 2015-16[/h]
 Figure 2 - Text Description Nationally in weeks 18-20, there were 1,555 positive influenza tests reported. Influenza B continues to account for an increasing proportion of influenza detections accounting for 80% of detections in weeks 18-20. Laboratory detections of influenza in the provinces of Ontario and Quebec accounted for 78% of all detections for week 20. To date, 73% of influenza detections have been influenza A and among those subtyped, the vast majority have been influenza A(H1N1) [91% (11,003/12,103)].
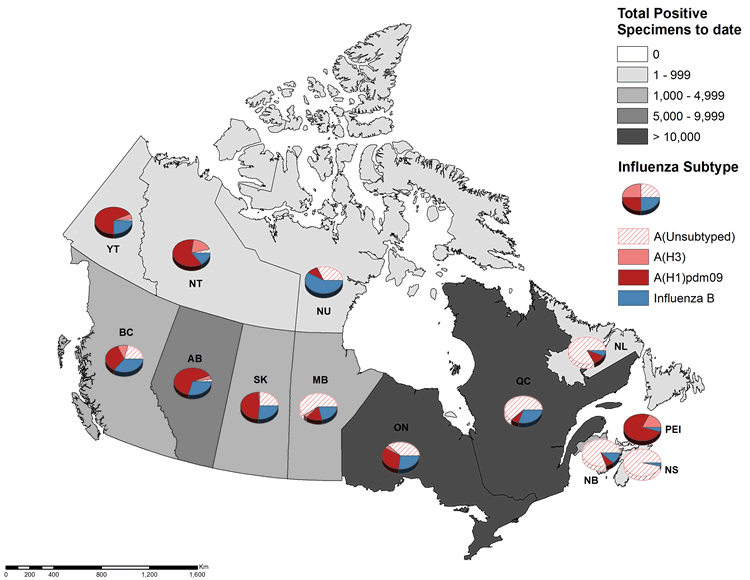
[h=3]Figure 3. Cumulative numbers of positive influenza specimens by type/subtype and province, Canada, 2015-16[/h]
 Note: Specimens from NT, YT, and NU are sent to reference laboratories in other provinces. Cumulative data includes updates to previous weeks.
Figure 3 - Text Description In weeks 18-20, the number of laboratory detections decreased across all age groups, most notably among individuals under the age of 5 years. In week 20, Influenza B detections accounted for 85% of all detections (table 1).
To date this season, detailed information on age and type/subtype has been received for 33,165 cases. Children and teenagers (0-19) accounted for 47% of influenza B cases and approximately one third of all influenza cases. Children and teenagers (0-19), young adults (20-44) and middle-aged adults (45-64) accounted for approximately an equal proportion of influenza A(H1N1) cases (26-29%).
[TABLE="class: table-responsive table table-condensed table-striped table-hover table-bordered, width: 1140, height: 0"]
Table 1. Weekly and cumulative numbers of positive influenza specimens by type, subtype and age-group reported through case-based laboratory reportingTable 1 - Footnote1, Canada, 2015-16 [TR="class: bg-primary, bgcolor: #2572B4"]
Age groups (years) Weeks 18-20 (May. 1, 2016 to May. 21, 2016) Cumulative (August 30, 2015 to May 21, 2016) [/TR]
[TR="class: bg-primary, bgcolor: #2572B4"]
Influenza A B Influenza A B Influenza A and B [/TR]
[TR="class: bg-primary, bgcolor: #2572B4"]
A Total A(H1) pdm09 A(H3) A UnSTable 1 - Footnote3 Total A Total A(H1) pdm09 A(H3) A UnSTable 1 - Footnote3 Total # % [/TR]
[TR]
[TD="class: wb-fnote small wb-init wb-fnote-inited, colspan: 13"] Table 1 - Footnote 1 Table 1 includes specimens for which demographic information was reported. These represent a subset of all positive influenza cases reported.
Return to Table 1 - Footnote1referrer
Table 1 - Footnote 2 Percentage of tests positive for sub-types of influenza A are a percentage of all influenza A detections.
Return to Table 1 - Footnote2referrer
Table 1 - Footnote 3 Unsubtyped: The specimen was typed as influenza A, but no result for subtyping was available.
Return to Table 1 - Footnote3referrer
Table 1 - Footnote x Suppressed to prevent residual disclosure.
Return to Table 1 - Footnotexreferrer
[/TD]
[/TR]
[TR="bgcolor: #F5F5F5"]
<5 [TD="class: text-right"]24[/TD]
[TD="class: text-right"]<5[/TD]
[TD="class: text-right"]Table 1 - Footnotex[/TD]
[TD="class: text-right"]20[/TD]
[TD="class: text-right"]252[/TD]
[TD="class: text-right"]4036[/TD]
[TD="class: text-right"]1225[/TD]
[TD="class: text-right"]75[/TD]
[TD="class: text-right"]2736[/TD]
[TD="class: text-right"]1701[/TD]
[TD="class: text-right"]6229[/TD]
[TD="class: text-right"]19%[/TD]
[/TR]
[TR]
5-19 [TD="class: text-right"]11[/TD]
[TD="class: text-right"]<5[/TD]
[TD="class: text-right"]Table 1 - Footnotex[/TD]
[TD="class: text-right"]10[/TD]
[TD="class: text-right"]261[/TD]
[TD="class: text-right"]2081[/TD]
[TD="class: text-right"]700[/TD]
[TD="class: text-right"]101[/TD]
[TD="class: text-right"]1280[/TD]
[TD="class: text-right"]2649[/TD]
[TD="class: text-right"]5058[/TD]
[TD="class: text-right"]15%[/TD]
[/TR]
[TR="bgcolor: #F5F5F5"]
20-44 [TD="class: text-right"]26[/TD]
[TD="class: text-right"]<5[/TD]
[TD="class: text-right"]<5[/TD]
[TD="class: text-right"]21[/TD]
[TD="class: text-right"]154[/TD]
[TD="class: text-right"]4764[/TD]
[TD="class: text-right"]1713[/TD]
[TD="class: text-right"]163[/TD]
[TD="class: text-right"]2888[/TD]
[TD="class: text-right"]2168[/TD]
[TD="class: text-right"]7981[/TD]
[TD="class: text-right"]24%[/TD]
[/TR]
[TR]
45-64 [TD="class: text-right"]52[/TD]
[TD="class: text-right"]9[/TD]
[TD="class: text-right"]6[/TD]
[TD="class: text-right"]37[/TD]
[TD="class: text-right"]95[/TD]
[TD="class: text-right"]5382[/TD]
[TD="class: text-right"]1792[/TD]
[TD="class: text-right"]199[/TD]
[TD="class: text-right"]3391[/TD]
[TD="class: text-right"]1088[/TD]
[TD="class: text-right"]7476[/TD]
[TD="class: text-right"]23%[/TD]
[/TR]
[TR="bgcolor: #F5F5F5"]
65+ [TD="class: text-right"]57[/TD]
[TD="class: text-right"]7[/TD]
[TD="class: text-right"]15[/TD]
[TD="class: text-right"]35[/TD]
[TD="class: text-right"]178[/TD]
[TD="class: text-right"]4453[/TD]
[TD="class: text-right"]1225[/TD]
[TD="class: text-right"]440[/TD]
[TD="class: text-right"]2788[/TD]
[TD="class: text-right"]1563[/TD]
[TD="class: text-right"]6421[/TD]
[TD="class: text-right"]19%[/TD]
[/TR]
[TR]
Total [TD="class: text-right"]170[/TD]
[TD="class: text-right"]23[/TD]
[TD="class: text-right"]24[/TD]
[TD="class: text-right"]123[/TD]
[TD="class: text-right"]940[/TD]
[TD="class: text-right"]20716[/TD]
[TD="class: text-right"]6655[/TD]
[TD="class: text-right"]978[/TD]
[TD="class: text-right"]13083[/TD]
[TD="class: text-right"]9169[/TD]
[TD="class: text-right"]33165[/TD]
[TD="class: text-right"]100%[/TD]
[/TR]
[TR="bgcolor: #F5F5F5"]
PercentageTable 1 - Footnote2 [TD="class: text-right"]15%[/TD]
[TD="class: text-right"]14%[/TD]
[TD="class: text-right"]14%[/TD]
[TD="class: text-right"]72%[/TD]
[TD="class: text-right"]85%[/TD]
[TD="class: text-right"]62%[/TD]
[TD="class: text-right"]32%[/TD]
[TD="class: text-right"]5%[/TD]
[TD="class: text-right"]63%[/TD]
[TD="class: text-right"]28%[/TD]
[TD="class: text-right"] [/TD]
[TD="class: text-right"] [/TD]
[/TR]
[/TABLE]
For data on other respiratory virus detections see the Respiratory Virus Detections in Canada Report on the Public Health Agency of Canada website.
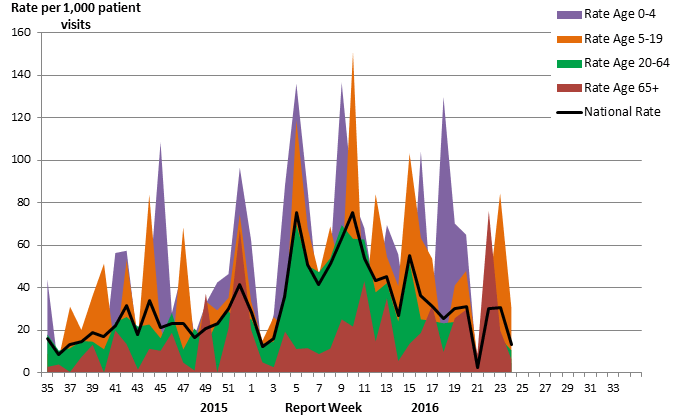
[h=2]Influenza-like Illness Consultation Rate[/h] The national ILI consultation rate remained constant from previous weeks from 31.1 per 1,000 patient visits in week 17, to 31.1 per 1,000 patient visits in week 20. The highest ILI consultation rate was found in the 0-4 years age group (65.0 per 1,000) and the lowest was found in the 20-64 years age group (23.4 per 1,000) (Figure 4).
[h=3]Figure 4. Influenza-like-illness (ILI) consultation rates by age group and week, Canada, 2015-16[/h]
 Delays in the reporting of data may cause data to change retrospectively. In BC, AB, and SK, data are compiled by a provincial sentinel surveillance program for reporting to FluWatch. Not all sentinel physicians report every week.
Figure 4 - Text Description [h=2]Pharmacy Surveillance[/h] In the period of weeks 18-20, the proportion of prescriptions for antivirals decreased by 73% compared to week 17. The antiviral prescriptions per 100,000 total prescriptions in week 20 was 6.0; this rate is lower than the five year historical average for week 20. The proportion of prescriptions for antivirals remains highest among children. In week 20, the proportion reported among children was 11.3 per 100,000 total prescriptions.
[h=3]Figure 5. Proportion of prescription sales for influenza antivirals by age group and week, Canada, 2015-16[/h]
 Note: Pharmacy sales data are provided to the Public Health Agency of Canada by Rx Canada Inc. and sourced from major retail drug chains representing over 3,000 stores nationwide (excluding Nunavut) in 85% of Health Regions. Data provided include the number of new antiviral prescriptions (for Tamiflu[oseltamivir] and Relenza [zanamivir]) and the total number of new prescriptions dispensed by Province/Territory and age group.
* The average weekly proportion includes data from April 2011 to March 2015.
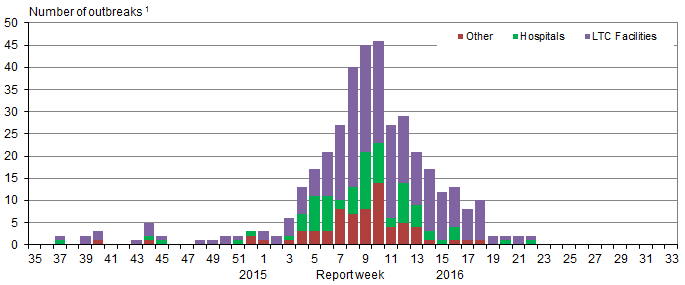
Figure 5 - Text Description [h=2]Influenza Outbreak Surveillance[/h] In weeks 18-20, fourteen new laboratory confirmed influenza outbreaks were reported: twelve in long-term care facilities (LTCF), one in a hospital and and one in an institution or community setting. Of the outbreaks with known strains or subtypes, six outbreaks were due to influenza B, one was due to A(H3N2) and three were due to influenza A(unsubtyped).
To date this season, 423 outbreaks have been reported. At week 20 in the 2014-15 season, 1,724 outbreaks were reported and in the 2013-14 season, 260 outbreaks were reported.
[h=3]Figure 6. Overall number of new laboratory-confirmed influenza outbreaksFigure 5 - Footnote1 by report week, Canada, 2015-2016[/h]
 Figure 6 - Footnote 1 All provinces and territories except NU report influenza outbreaks in long-term care facilities. All provinces and territories with the exception of NU and QC report outbreaks in hospitals. Outbreaks of influenza or influenza-like-illness in other facilities are reported to FluWatch but reporting varies between jurisdictions. Outbreak definitions are included at the end of the report.
Return to Figure 5 - Footnote1referrer
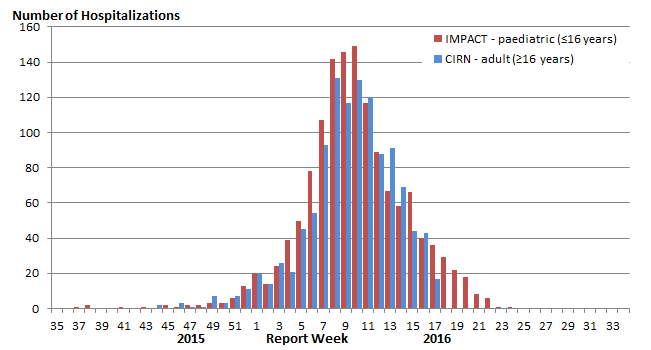
Figure 6 - Text Description [h=2]Sentinel Pediatric Hospital Influenza Surveillance[/h] [h=3]Paediatric Influenza Hospitalizations and Deaths[/h] In weeks 18-20, 66 laboratory-confirmed influenza-associated pediatric (≤16 years of age) hospitalizations were reported by the Immunization Monitoring Program Active (IMPACT) network (Figure 7). An equal proportion of hospitalizations were reported in children 6-23 months, 2-4 years and 5-9 years, accounting for 26%, 23% and 26% of the hospitalizations respectively. Similar to the trend of increased laboratory detections of influenza B, 88% of pediatric hospitalizations reported in weeks 18-20 were due to influenza B.
To date this season, 1,337 hospitalizations have been reported by the IMPACT network: 893 hospitalized cases (67%) were due to influenza A and 444 cases (33%) were due to influenza B. This season?s count of pediatric hospitalizations is nearly double that reported up to week 20 in the 2014-15 season (n=697). The current year total number of cases also exceeds the total number of cases reported in the past five seasons.
A total of 205 intensive care unit (ICU) admissions have been reported. Children aged 2 to 4 and 5 to 9 years accounted for 29% and 26% of ICU admissions respectively . A total of 131 ICU cases (64%) reported at least one underlying condition or comorbidity. Eight influenza-associated deaths have been reported.
[TABLE="class: table table-condensed table-striped table-hover table-bordered, width: 1140"]
Table 2 - Cumulative numbers of peadiatric hospitalizations (≤16 years of age) with influenza reported by the IMPACT network, Canada, 2015-16 [TR="class: bg-primary, bgcolor: #2572B4"]
Age Groups Cumulative (30 Aug. 2015 to 21 May 2016) [/TR]
[TR="class: bg-primary, bgcolor: #2572B4"]
Influenza A Influenza B Influenza A and B (#(%)) [/TR]
[TR="class: bg-primary, bgcolor: #2572B4"]
A Total A(H1) pdm09 A(H3) A (UnS) B Total [/TR]
[TR]
[TD="class: wb-fnote small wb-init wb-fnote-inited, colspan: 7"] Table 2 - Footnote x Suppressed to prevent residual disclosure.
Return to Table 2 - Footnotexreferrer
[/TD]
[/TR]
[TR="bgcolor: #F5F5F5"]
0-5m [TD="class: text-right"]122[/TD]
[TD="class: text-right"]32[/TD]
[TD="class: text-right"]<5[/TD]
[TD="class: text-right"]Table 2 - Footnotex[/TD]
[TD="class: text-right"]40[/TD]
[TD="class: text-right"]162 (12%)[/TD]
[/TR]
[TR]
6-23m [TD="class: text-right"]275[/TD]
[TD="class: text-right"]76[/TD]
[TD="class: text-right"]7[/TD]
[TD="class: text-right"]192[/TD]
[TD="class: text-right"]92[/TD]
[TD="class: text-right"]367 (27%)[/TD]
[/TR]
[TR="bgcolor: #F5F5F5"]
2-4y [TD="class: text-right"]257[/TD]
[TD="class: text-right"]82[/TD]
[TD="class: text-right"]<5[/TD]
[TD="class: text-right"]Table 2 - Footnotex[/TD]
[TD="class: text-right"]114[/TD]
[TD="class: text-right"]371 (28%)[/TD]
[/TR]
[TR]
5-9y [TD="class: text-right"]181[/TD]
[TD="class: text-right"]46[/TD]
[TD="class: text-right"]<5[/TD]
[TD="class: text-right"]Table 2 - Footnotex[/TD]
[TD="class: text-right"]142[/TD]
[TD="class: text-right"]323 (24%)[/TD]
[/TR]
[TR="bgcolor: #F5F5F5"]
10-16y [TD="class: text-right"]58[/TD]
[TD="class: text-right"]18[/TD]
[TD="class: text-right"]<5[/TD]
[TD="class: text-right"]Table 2 - Footnotex[/TD]
[TD="class: text-right"]56[/TD]
[TD="class: text-right"]114 (9%)[/TD]
[/TR]
[TR]
Total [TD="class: text-right"]893[/TD]
[TD="class: text-right"]254[/TD]
[TD="class: text-right"]21[/TD]
[TD="class: text-right"]618[/TD]
[TD="class: text-right"]444[/TD]
[TD="class: text-right"]1337 (100%)[/TD]
[/TR]
[/TABLE]
[h=4]Figure 7. Number of cases of influenza reported by sentinel hospital networks, by week, Canada, 2015-16, paediatric and adult hospitalizations (≤16 years of age, IMPACT; ≥16 years of age, CIRN-SOS)[/h]
 Not included in Table 2 and Figure 7 are two IMPACT cases that were due to co-infections of influenza A and B.
Figure 7 - Text Description [h=3]Adult Influenza Hospitalizations and Deaths[/h] Surveillance for the 2015-2016 influenza season ended on April 30th, 2016.
To date this season, 1,153 hospitalizations have been reported by CIRN-SOS (Table 3). The majority of hospitalized cases were due to influenza A (81%) and the largest reported proportion was among adults ≥65 years of age (50%). One hundred and ninety-one intensive care unit (ICU) admissions have been reported of which 132 cases reported at least one underlying condition or comorbidity. A total of 55 deaths have been reported this season with the majority of deaths reported in adults ≥65 years of age (62%).
[TABLE="class: table table-condensed table-striped table-hover table-bordered, width: 1140"]
Table 3 - Cumulative numbers of adult hospitalizations (≥16 years of age) with influenza reported by the CIRN-SOS network, Canada, 2015-16 [TR="class: bg-primary, bgcolor: #2572B4"]
Age groups (years) Cumulative (1 Nov. 2015 to 21 May 2016) [/TR]
[TR="class: bg-primary, bgcolor: #2572B4"]
Influenza A B Influenza A and B [/TR]
[TR="class: bg-primary, bgcolor: #2572B4"]
A Total A(H1) pdm09 A(H3) A(UnS) Total # (%) [/TR]
[TR]
[TD="class: wb-fnote small wb-init wb-fnote-inited, colspan: 7"] Table 3 - Footnote x Suppressed to prevent residual disclosure.
Return to Table 3 - Footnotexreferrer
[/TD]
[/TR]
[TR="bgcolor: #F5F5F5"]
16-20 [TD="class: text-right"]Table 3 - Footnotex[/TD]
[TD="class: text-right"]<5[/TD]
[TD="class: text-right"]0[/TD]
[TD="class: text-right"]<5[/TD]
[TD="class: text-right"]<5[/TD]
[TD="class: text-right"]Table 3 - Footnotex[/TD]
[/TR]
[TR]
20-44 [TD="class: text-right"]144[/TD]
[TD="class: text-right"]50[/TD]
[TD="class: text-right"]<5[/TD]
[TD="class: text-right"]Table 3 - Footnotex[/TD]
[TD="class: text-right"]46[/TD]
[TD="class: text-right"]190(16%)[/TD]
[/TR]
[TR="bgcolor: #F5F5F5"]
45-64 [TD="class: text-right"]331[/TD]
[TD="class: text-right"]105[/TD]
[TD="class: text-right"]<5[/TD]
[TD="class: text-right"]Table 3 - Footnotex[/TD]
[TD="class: text-right"]46[/TD]
[TD="class: text-right"]377(33%)[/TD]
[/TR]
[TR]
65+ [TD="class: text-right"]452[/TD]
[TD="class: text-right"]125[/TD]
[TD="class: text-right"]24[/TD]
[TD="class: text-right"]303[/TD]
[TD="class: text-right"]123[/TD]
[TD="class: text-right"]575 (50%)[/TD]
[/TR]
[TR="bgcolor: #F5F5F5"]
Unknown [TD="class: text-right"]<5[/TD]
[TD="class: text-right"]Table 3 - Footnotex[/TD]
[TD="class: text-right"]0[/TD]
[TD="class: text-right"]<5[/TD]
[TD="class: text-right"]<5[/TD]
[TD="class: text-right"]<5 (x%)[/TD]
[/TR]
[TR]
Total [TD="class: text-right"]934[/TD]
[TD="class: text-right"]285[/TD]
[TD="class: text-right"]28[/TD]
[TD="class: text-right"]621[/TD]
[TD="class: text-right"]219[/TD]
[TD="class: text-right"]1153[/TD]
[/TR]
[TR="bgcolor: #F5F5F5"]
% [TD="class: text-right"]81%[/TD]
[TD="class: text-right"]31%[/TD]
[TD="class: text-right"]3%[/TD]
[TD="class: text-right"]66%[/TD]
[TD="class: text-right"]19%[/TD]
[TD="class: text-right"]100%[/TD]
[/TR]
[/TABLE]
[h=4]Figure 8. Percentage of hospitalizations, ICU admissions and deaths with influenza reported by age-group (≥16 year of age), Canada 2015-16[/h]
 Note: The number of hospitalizations reported through CIRN-SOS and IMPACT represents a subset of all influenza-associated adult and paediatric hospitalizations in Canada. Delays in the reporting of data may cause data to change retrospectively.
x - Suppressed to prevent residual disclosure.
Figure 8 - Text Description [h=2]Provincial/Territorial Influenza Hospitalizations and Deaths[/h]
Provincial/Territorial Influenza Hospitalizations and Deaths
In week 20, 37 hospitalizations were reported by participating provinces and territoriesootnote*. Influenza B accounted for the greatest proportion of hospitalizations, accounting for 65% of hospitalizations reported in week 20. The largest proportion of cases reported was in adults 65+ years of age (49%). Among hospitalizations for influenza B, children (0-19 years) represented 41% of cases.
Since the start of the 2015-16 season, 5,169 laboratory-confirmed influenza-associated hospitalizations have been reported. A total of 4,054 hospitalizations (78%) were due to influenza A and 1115 (22%) were due to influenza B. Of the 529 ICU admissions reported, 271 (51%) were due to influenza A(H1N1). A total of 255 deaths have been reported; all but 36 were associated with influenza A.
Overall this season, hospitalizations have been reported more frequently among adults ≥65 years of age. The largest proportion of ICU admissions was reported in adults 45-64years of age and the highest proportion of fatal cases was reported in adults ≥65 years of age (figure 9). Pediatric (0-19 years) and young to middle-aged adults (20-44 years) accounted for 29% of all hospitalizations and 5% of all deaths reported to date this season. Similar to findings from the IMPACT network, there have been more pediatric hospitalizations reported to date compared to the year-end totals in each of the previous four influenza seasons.
[h=3]Figure 9. Percentage of hospitalizations, ICU admissions and deaths with influenza reported by age-group, Canada 2015-16[/h]
 Figure 9 - Text Description Footnote * Note: Influenza-associated hospitalizations are not reported to PHAC by the following Provinces and Territory: BC, NU, and QC. Only hospitalizations that require intensive medical care are reported by SK. ICU admissions are not distinguished among hospital admissions reported from ON. Data may also include cases reported by the IMPACT networks. The number of new influenza-associated hospitalizations and deaths reported for the current week may include cases from ON that occurred in previous weeks, as a result of retrospective updates to the cumulative total. It is important to note that the hospitalization or death does not have to be attributable to influenza, a positive laboratory test is sufficient for reporting.
Return to footnote*referrer
Footnote * Includes three hospitalizations for which age is unknown.
Return to footnote1referrer
See additional data on Reported Influenza Hospitalizations and Deaths in Canada: 2011-12 to 2015-16 on the Public Health Agency of Canada website.
[h=2]Influenza Strain Characterizations[/h] During the 2015-16 influenza season, the National Microbiology Laboratory (NML) has characterized 2,678 influenza viruses [217 A(H3N2), 1,367 A(H1N1) and 1094 influenza B].
Influenza A (H3N2):When tested by hemagglutination inhibition (HI) assays, 64 A(H3N2) viruses were antigenically characterized as A/Switzerland/9715293/2013-like using antiserum raised against cell-propagated A/Switzerland/9715293/2013.
Sequence analysis was done on 153 A(H3N2) viruses. All viruses belonged to a genetic group for which most viruses were antigenically related to A/Switzerland/9715293/2013. A/Switzerland/9715293/2013 is the A(H3N2) component of the 2015-16 Northern Hemisphere's vaccine.
Influenza A (H1N1): All of the 1,367 A(H1N1) viruses characterized were antigenically similar to A/California/7/2009, the A(H1N1) component of the 2015-16 influenza vaccine.
Influenza B: A total of 232 influenza B viruses characterized were antigenically similar to the vaccine strain B/Phuket/3073/2013. A total of 862 influenza B viruses were characterized as B/Brisbane/60/2008-like, one of the influenza B components of the 2015-16 Northern Hemisphere quadrivalent influenza vaccine.
The recommended components for the 2015-2016 Northern Hemisphere trivalent influenza vaccine included: an A/California/7/2009(H1N1)pdm09-like virus, an A/Switzerland/9715293/2013(H3N2)-like virus, and a B/Phuket/3073/2013 -like virus (Yamagata lineage). For quadrivalent vaccines, the addition of a B/Brisbane/60/2008-like virus (Victoria lineage) is recommended.
The NML receives a proportion of the influenza positive specimens from provincial laboratories for strain characterization and antiviral resistance testing. Characterization data reflect the results of haemagglutination inhibition testing compared to the reference influenza strains recommended by WHO.
.../
http://healthycanadians.gc.ca/publi...16-18-20-surveillance-influenza/index-eng.php
- In weeks 18-20, all influenza indicators declined from the previous weeks.
- Elevated influenza B activity persisted in many regions across Canada: influenza B accounted for the majority of influenza detections in weeks 18-20. Additionally, the majority of outbreaks reported this week were due to Influenza B.
- This increase in influenza B is expected as influenza B often shows up later in the flu season.
- Hospitalizations, ICU admissions and deaths among the pediatric population, while declining, continue to remain above expected levels based on the past several influenza seasons.
- For more information on the flu, see our Flu(influenza) web page.
(PDF format, 876 KB, 9 pages)
Organization: Public Health Agency of Canada
Date published: 2016-05-27
[h=2]Related Topics[/h]
Are you a primary health care practitioner (General Practitioner, Nurse Practitioner or Registered Nurse) interested in becoming a FluWatch sentinel for the 2015-16 influenza season? Contact us at FluWatch@phac-aspc.gc.ca
[h=2]On this page[/h]
- Influenza/ILI Activity (geographic spread)
- Laboratory Confirmed Influenza Detections
- Influenza-like Illness Consultation Rate
- Pharmacy Surveillance
- Influenza Outbreak Surveillance
- Sentinel Pediatric Hospital Influenza Surveillance
- Provincial/Territorial Influenza Hospitalizations and Deaths
- Influenza Strain Characterizations
- Antiviral Resistance
- International Influenza Reports
- FluWatch definitions for the 2015-2016 season
[h=3]Figure 1. Map of overall influenza/ILI activity level by province and territory, Canada, week 20[/h]
Note: Influenza/ILI activity levels, as represented on this map, are assigned and reported by Provincial and Territorial Ministries of Health, based on laboratory confirmations, sentinel ILI rates and reported outbreaks. Please refer to detailed definitions at the end of the report. Maps from previous weeks, including any retrospective updates, are available in the mapping feature found in the Weekly Influenza Reports.
Figure 1 - Text Description [h=2]Laboratory Confirmed Influenza Detections[/h] In weeks 18-20, the percentage of tests positive for influenza continued to decrease [from 17% in week 17.0 to 9.4% in week 20], driven by the decline in influenza A. Compared to the previous five seasons, the percent positive (9.4%) reported in week 20 was above the five year average for that week and exceeded the expected levels (confidence interval 5.0-9.2%). With the late start to the 2015-16 influenza season, these elevated levels are not unexpected.
[h=3]Figure 2. Number of positive influenza tests and percentage of tests positive, by type, subtype and report week, Canada, 2015-16[/h]
[h=3]Figure 3. Cumulative numbers of positive influenza specimens by type/subtype and province, Canada, 2015-16[/h]
Figure 3 - Text Description In weeks 18-20, the number of laboratory detections decreased across all age groups, most notably among individuals under the age of 5 years. In week 20, Influenza B detections accounted for 85% of all detections (table 1).
To date this season, detailed information on age and type/subtype has been received for 33,165 cases. Children and teenagers (0-19) accounted for 47% of influenza B cases and approximately one third of all influenza cases. Children and teenagers (0-19), young adults (20-44) and middle-aged adults (45-64) accounted for approximately an equal proportion of influenza A(H1N1) cases (26-29%).
[TABLE="class: table-responsive table table-condensed table-striped table-hover table-bordered, width: 1140, height: 0"]
Table 1. Weekly and cumulative numbers of positive influenza specimens by type, subtype and age-group reported through case-based laboratory reportingTable 1 - Footnote1, Canada, 2015-16 [TR="class: bg-primary, bgcolor: #2572B4"]
Age groups (years) Weeks 18-20 (May. 1, 2016 to May. 21, 2016) Cumulative (August 30, 2015 to May 21, 2016) [/TR]
[TR="class: bg-primary, bgcolor: #2572B4"]
Influenza A B Influenza A B Influenza A and B [/TR]
[TR="class: bg-primary, bgcolor: #2572B4"]
A Total A(H1) pdm09 A(H3) A UnSTable 1 - Footnote3 Total A Total A(H1) pdm09 A(H3) A UnSTable 1 - Footnote3 Total # % [/TR]
[TR]
[TD="class: wb-fnote small wb-init wb-fnote-inited, colspan: 13"] Table 1 - Footnote 1 Table 1 includes specimens for which demographic information was reported. These represent a subset of all positive influenza cases reported.
Return to Table 1 - Footnote1referrer
Table 1 - Footnote 2 Percentage of tests positive for sub-types of influenza A are a percentage of all influenza A detections.
Return to Table 1 - Footnote2referrer
Table 1 - Footnote 3 Unsubtyped: The specimen was typed as influenza A, but no result for subtyping was available.
Return to Table 1 - Footnote3referrer
Table 1 - Footnote x Suppressed to prevent residual disclosure.
Return to Table 1 - Footnotexreferrer
[/TD]
[/TR]
[TR="bgcolor: #F5F5F5"]
<5 [TD="class: text-right"]24[/TD]
[TD="class: text-right"]<5[/TD]
[TD="class: text-right"]Table 1 - Footnotex[/TD]
[TD="class: text-right"]20[/TD]
[TD="class: text-right"]252[/TD]
[TD="class: text-right"]4036[/TD]
[TD="class: text-right"]1225[/TD]
[TD="class: text-right"]75[/TD]
[TD="class: text-right"]2736[/TD]
[TD="class: text-right"]1701[/TD]
[TD="class: text-right"]6229[/TD]
[TD="class: text-right"]19%[/TD]
[/TR]
[TR]
5-19 [TD="class: text-right"]11[/TD]
[TD="class: text-right"]<5[/TD]
[TD="class: text-right"]Table 1 - Footnotex[/TD]
[TD="class: text-right"]10[/TD]
[TD="class: text-right"]261[/TD]
[TD="class: text-right"]2081[/TD]
[TD="class: text-right"]700[/TD]
[TD="class: text-right"]101[/TD]
[TD="class: text-right"]1280[/TD]
[TD="class: text-right"]2649[/TD]
[TD="class: text-right"]5058[/TD]
[TD="class: text-right"]15%[/TD]
[/TR]
[TR="bgcolor: #F5F5F5"]
20-44 [TD="class: text-right"]26[/TD]
[TD="class: text-right"]<5[/TD]
[TD="class: text-right"]<5[/TD]
[TD="class: text-right"]21[/TD]
[TD="class: text-right"]154[/TD]
[TD="class: text-right"]4764[/TD]
[TD="class: text-right"]1713[/TD]
[TD="class: text-right"]163[/TD]
[TD="class: text-right"]2888[/TD]
[TD="class: text-right"]2168[/TD]
[TD="class: text-right"]7981[/TD]
[TD="class: text-right"]24%[/TD]
[/TR]
[TR]
45-64 [TD="class: text-right"]52[/TD]
[TD="class: text-right"]9[/TD]
[TD="class: text-right"]6[/TD]
[TD="class: text-right"]37[/TD]
[TD="class: text-right"]95[/TD]
[TD="class: text-right"]5382[/TD]
[TD="class: text-right"]1792[/TD]
[TD="class: text-right"]199[/TD]
[TD="class: text-right"]3391[/TD]
[TD="class: text-right"]1088[/TD]
[TD="class: text-right"]7476[/TD]
[TD="class: text-right"]23%[/TD]
[/TR]
[TR="bgcolor: #F5F5F5"]
65+ [TD="class: text-right"]57[/TD]
[TD="class: text-right"]7[/TD]
[TD="class: text-right"]15[/TD]
[TD="class: text-right"]35[/TD]
[TD="class: text-right"]178[/TD]
[TD="class: text-right"]4453[/TD]
[TD="class: text-right"]1225[/TD]
[TD="class: text-right"]440[/TD]
[TD="class: text-right"]2788[/TD]
[TD="class: text-right"]1563[/TD]
[TD="class: text-right"]6421[/TD]
[TD="class: text-right"]19%[/TD]
[/TR]
[TR]
Total [TD="class: text-right"]170[/TD]
[TD="class: text-right"]23[/TD]
[TD="class: text-right"]24[/TD]
[TD="class: text-right"]123[/TD]
[TD="class: text-right"]940[/TD]
[TD="class: text-right"]20716[/TD]
[TD="class: text-right"]6655[/TD]
[TD="class: text-right"]978[/TD]
[TD="class: text-right"]13083[/TD]
[TD="class: text-right"]9169[/TD]
[TD="class: text-right"]33165[/TD]
[TD="class: text-right"]100%[/TD]
[/TR]
[TR="bgcolor: #F5F5F5"]
PercentageTable 1 - Footnote2 [TD="class: text-right"]15%[/TD]
[TD="class: text-right"]14%[/TD]
[TD="class: text-right"]14%[/TD]
[TD="class: text-right"]72%[/TD]
[TD="class: text-right"]85%[/TD]
[TD="class: text-right"]62%[/TD]
[TD="class: text-right"]32%[/TD]
[TD="class: text-right"]5%[/TD]
[TD="class: text-right"]63%[/TD]
[TD="class: text-right"]28%[/TD]
[TD="class: text-right"] [/TD]
[TD="class: text-right"] [/TD]
[/TR]
[/TABLE]
For data on other respiratory virus detections see the Respiratory Virus Detections in Canada Report on the Public Health Agency of Canada website.
[h=2]Influenza-like Illness Consultation Rate[/h] The national ILI consultation rate remained constant from previous weeks from 31.1 per 1,000 patient visits in week 17, to 31.1 per 1,000 patient visits in week 20. The highest ILI consultation rate was found in the 0-4 years age group (65.0 per 1,000) and the lowest was found in the 20-64 years age group (23.4 per 1,000) (Figure 4).
[h=3]Figure 4. Influenza-like-illness (ILI) consultation rates by age group and week, Canada, 2015-16[/h]
Figure 4 - Text Description [h=2]Pharmacy Surveillance[/h] In the period of weeks 18-20, the proportion of prescriptions for antivirals decreased by 73% compared to week 17. The antiviral prescriptions per 100,000 total prescriptions in week 20 was 6.0; this rate is lower than the five year historical average for week 20. The proportion of prescriptions for antivirals remains highest among children. In week 20, the proportion reported among children was 11.3 per 100,000 total prescriptions.
[h=3]Figure 5. Proportion of prescription sales for influenza antivirals by age group and week, Canada, 2015-16[/h]
* The average weekly proportion includes data from April 2011 to March 2015.
Figure 5 - Text Description [h=2]Influenza Outbreak Surveillance[/h] In weeks 18-20, fourteen new laboratory confirmed influenza outbreaks were reported: twelve in long-term care facilities (LTCF), one in a hospital and and one in an institution or community setting. Of the outbreaks with known strains or subtypes, six outbreaks were due to influenza B, one was due to A(H3N2) and three were due to influenza A(unsubtyped).
To date this season, 423 outbreaks have been reported. At week 20 in the 2014-15 season, 1,724 outbreaks were reported and in the 2013-14 season, 260 outbreaks were reported.
[h=3]Figure 6. Overall number of new laboratory-confirmed influenza outbreaksFigure 5 - Footnote1 by report week, Canada, 2015-2016[/h]
Return to Figure 5 - Footnote1referrer
Figure 6 - Text Description [h=2]Sentinel Pediatric Hospital Influenza Surveillance[/h] [h=3]Paediatric Influenza Hospitalizations and Deaths[/h] In weeks 18-20, 66 laboratory-confirmed influenza-associated pediatric (≤16 years of age) hospitalizations were reported by the Immunization Monitoring Program Active (IMPACT) network (Figure 7). An equal proportion of hospitalizations were reported in children 6-23 months, 2-4 years and 5-9 years, accounting for 26%, 23% and 26% of the hospitalizations respectively. Similar to the trend of increased laboratory detections of influenza B, 88% of pediatric hospitalizations reported in weeks 18-20 were due to influenza B.
To date this season, 1,337 hospitalizations have been reported by the IMPACT network: 893 hospitalized cases (67%) were due to influenza A and 444 cases (33%) were due to influenza B. This season?s count of pediatric hospitalizations is nearly double that reported up to week 20 in the 2014-15 season (n=697). The current year total number of cases also exceeds the total number of cases reported in the past five seasons.
A total of 205 intensive care unit (ICU) admissions have been reported. Children aged 2 to 4 and 5 to 9 years accounted for 29% and 26% of ICU admissions respectively . A total of 131 ICU cases (64%) reported at least one underlying condition or comorbidity. Eight influenza-associated deaths have been reported.
[TABLE="class: table table-condensed table-striped table-hover table-bordered, width: 1140"]
Table 2 - Cumulative numbers of peadiatric hospitalizations (≤16 years of age) with influenza reported by the IMPACT network, Canada, 2015-16 [TR="class: bg-primary, bgcolor: #2572B4"]
Age Groups Cumulative (30 Aug. 2015 to 21 May 2016) [/TR]
[TR="class: bg-primary, bgcolor: #2572B4"]
Influenza A Influenza B Influenza A and B (#(%)) [/TR]
[TR="class: bg-primary, bgcolor: #2572B4"]
A Total A(H1) pdm09 A(H3) A (UnS) B Total [/TR]
[TR]
[TD="class: wb-fnote small wb-init wb-fnote-inited, colspan: 7"] Table 2 - Footnote x Suppressed to prevent residual disclosure.
Return to Table 2 - Footnotexreferrer
[/TD]
[/TR]
[TR="bgcolor: #F5F5F5"]
0-5m [TD="class: text-right"]122[/TD]
[TD="class: text-right"]32[/TD]
[TD="class: text-right"]<5[/TD]
[TD="class: text-right"]Table 2 - Footnotex[/TD]
[TD="class: text-right"]40[/TD]
[TD="class: text-right"]162 (12%)[/TD]
[/TR]
[TR]
6-23m [TD="class: text-right"]275[/TD]
[TD="class: text-right"]76[/TD]
[TD="class: text-right"]7[/TD]
[TD="class: text-right"]192[/TD]
[TD="class: text-right"]92[/TD]
[TD="class: text-right"]367 (27%)[/TD]
[/TR]
[TR="bgcolor: #F5F5F5"]
2-4y [TD="class: text-right"]257[/TD]
[TD="class: text-right"]82[/TD]
[TD="class: text-right"]<5[/TD]
[TD="class: text-right"]Table 2 - Footnotex[/TD]
[TD="class: text-right"]114[/TD]
[TD="class: text-right"]371 (28%)[/TD]
[/TR]
[TR]
5-9y [TD="class: text-right"]181[/TD]
[TD="class: text-right"]46[/TD]
[TD="class: text-right"]<5[/TD]
[TD="class: text-right"]Table 2 - Footnotex[/TD]
[TD="class: text-right"]142[/TD]
[TD="class: text-right"]323 (24%)[/TD]
[/TR]
[TR="bgcolor: #F5F5F5"]
10-16y [TD="class: text-right"]58[/TD]
[TD="class: text-right"]18[/TD]
[TD="class: text-right"]<5[/TD]
[TD="class: text-right"]Table 2 - Footnotex[/TD]
[TD="class: text-right"]56[/TD]
[TD="class: text-right"]114 (9%)[/TD]
[/TR]
[TR]
Total [TD="class: text-right"]893[/TD]
[TD="class: text-right"]254[/TD]
[TD="class: text-right"]21[/TD]
[TD="class: text-right"]618[/TD]
[TD="class: text-right"]444[/TD]
[TD="class: text-right"]1337 (100%)[/TD]
[/TR]
[/TABLE]
[h=4]Figure 7. Number of cases of influenza reported by sentinel hospital networks, by week, Canada, 2015-16, paediatric and adult hospitalizations (≤16 years of age, IMPACT; ≥16 years of age, CIRN-SOS)[/h]
Figure 7 - Text Description [h=3]Adult Influenza Hospitalizations and Deaths[/h] Surveillance for the 2015-2016 influenza season ended on April 30th, 2016.
To date this season, 1,153 hospitalizations have been reported by CIRN-SOS (Table 3). The majority of hospitalized cases were due to influenza A (81%) and the largest reported proportion was among adults ≥65 years of age (50%). One hundred and ninety-one intensive care unit (ICU) admissions have been reported of which 132 cases reported at least one underlying condition or comorbidity. A total of 55 deaths have been reported this season with the majority of deaths reported in adults ≥65 years of age (62%).
[TABLE="class: table table-condensed table-striped table-hover table-bordered, width: 1140"]
Table 3 - Cumulative numbers of adult hospitalizations (≥16 years of age) with influenza reported by the CIRN-SOS network, Canada, 2015-16 [TR="class: bg-primary, bgcolor: #2572B4"]
Age groups (years) Cumulative (1 Nov. 2015 to 21 May 2016) [/TR]
[TR="class: bg-primary, bgcolor: #2572B4"]
Influenza A B Influenza A and B [/TR]
[TR="class: bg-primary, bgcolor: #2572B4"]
A Total A(H1) pdm09 A(H3) A(UnS) Total # (%) [/TR]
[TR]
[TD="class: wb-fnote small wb-init wb-fnote-inited, colspan: 7"] Table 3 - Footnote x Suppressed to prevent residual disclosure.
Return to Table 3 - Footnotexreferrer
[/TD]
[/TR]
[TR="bgcolor: #F5F5F5"]
16-20 [TD="class: text-right"]Table 3 - Footnotex[/TD]
[TD="class: text-right"]<5[/TD]
[TD="class: text-right"]0[/TD]
[TD="class: text-right"]<5[/TD]
[TD="class: text-right"]<5[/TD]
[TD="class: text-right"]Table 3 - Footnotex[/TD]
[/TR]
[TR]
20-44 [TD="class: text-right"]144[/TD]
[TD="class: text-right"]50[/TD]
[TD="class: text-right"]<5[/TD]
[TD="class: text-right"]Table 3 - Footnotex[/TD]
[TD="class: text-right"]46[/TD]
[TD="class: text-right"]190(16%)[/TD]
[/TR]
[TR="bgcolor: #F5F5F5"]
45-64 [TD="class: text-right"]331[/TD]
[TD="class: text-right"]105[/TD]
[TD="class: text-right"]<5[/TD]
[TD="class: text-right"]Table 3 - Footnotex[/TD]
[TD="class: text-right"]46[/TD]
[TD="class: text-right"]377(33%)[/TD]
[/TR]
[TR]
65+ [TD="class: text-right"]452[/TD]
[TD="class: text-right"]125[/TD]
[TD="class: text-right"]24[/TD]
[TD="class: text-right"]303[/TD]
[TD="class: text-right"]123[/TD]
[TD="class: text-right"]575 (50%)[/TD]
[/TR]
[TR="bgcolor: #F5F5F5"]
Unknown [TD="class: text-right"]<5[/TD]
[TD="class: text-right"]Table 3 - Footnotex[/TD]
[TD="class: text-right"]0[/TD]
[TD="class: text-right"]<5[/TD]
[TD="class: text-right"]<5[/TD]
[TD="class: text-right"]<5 (x%)[/TD]
[/TR]
[TR]
Total [TD="class: text-right"]934[/TD]
[TD="class: text-right"]285[/TD]
[TD="class: text-right"]28[/TD]
[TD="class: text-right"]621[/TD]
[TD="class: text-right"]219[/TD]
[TD="class: text-right"]1153[/TD]
[/TR]
[TR="bgcolor: #F5F5F5"]
% [TD="class: text-right"]81%[/TD]
[TD="class: text-right"]31%[/TD]
[TD="class: text-right"]3%[/TD]
[TD="class: text-right"]66%[/TD]
[TD="class: text-right"]19%[/TD]
[TD="class: text-right"]100%[/TD]
[/TR]
[/TABLE]
[h=4]Figure 8. Percentage of hospitalizations, ICU admissions and deaths with influenza reported by age-group (≥16 year of age), Canada 2015-16[/h]
x - Suppressed to prevent residual disclosure.
Figure 8 - Text Description [h=2]Provincial/Territorial Influenza Hospitalizations and Deaths[/h]
Provincial/Territorial Influenza Hospitalizations and Deaths
In week 20, 37 hospitalizations were reported by participating provinces and territoriesootnote*. Influenza B accounted for the greatest proportion of hospitalizations, accounting for 65% of hospitalizations reported in week 20. The largest proportion of cases reported was in adults 65+ years of age (49%). Among hospitalizations for influenza B, children (0-19 years) represented 41% of cases.
Since the start of the 2015-16 season, 5,169 laboratory-confirmed influenza-associated hospitalizations have been reported. A total of 4,054 hospitalizations (78%) were due to influenza A and 1115 (22%) were due to influenza B. Of the 529 ICU admissions reported, 271 (51%) were due to influenza A(H1N1). A total of 255 deaths have been reported; all but 36 were associated with influenza A.
Overall this season, hospitalizations have been reported more frequently among adults ≥65 years of age. The largest proportion of ICU admissions was reported in adults 45-64years of age and the highest proportion of fatal cases was reported in adults ≥65 years of age (figure 9). Pediatric (0-19 years) and young to middle-aged adults (20-44 years) accounted for 29% of all hospitalizations and 5% of all deaths reported to date this season. Similar to findings from the IMPACT network, there have been more pediatric hospitalizations reported to date compared to the year-end totals in each of the previous four influenza seasons.
[h=3]Figure 9. Percentage of hospitalizations, ICU admissions and deaths with influenza reported by age-group, Canada 2015-16[/h]
Return to footnote*referrer
Footnote * Includes three hospitalizations for which age is unknown.
Return to footnote1referrer
See additional data on Reported Influenza Hospitalizations and Deaths in Canada: 2011-12 to 2015-16 on the Public Health Agency of Canada website.
[h=2]Influenza Strain Characterizations[/h] During the 2015-16 influenza season, the National Microbiology Laboratory (NML) has characterized 2,678 influenza viruses [217 A(H3N2), 1,367 A(H1N1) and 1094 influenza B].
Influenza A (H3N2):When tested by hemagglutination inhibition (HI) assays, 64 A(H3N2) viruses were antigenically characterized as A/Switzerland/9715293/2013-like using antiserum raised against cell-propagated A/Switzerland/9715293/2013.
Sequence analysis was done on 153 A(H3N2) viruses. All viruses belonged to a genetic group for which most viruses were antigenically related to A/Switzerland/9715293/2013. A/Switzerland/9715293/2013 is the A(H3N2) component of the 2015-16 Northern Hemisphere's vaccine.
Influenza A (H1N1): All of the 1,367 A(H1N1) viruses characterized were antigenically similar to A/California/7/2009, the A(H1N1) component of the 2015-16 influenza vaccine.
Influenza B: A total of 232 influenza B viruses characterized were antigenically similar to the vaccine strain B/Phuket/3073/2013. A total of 862 influenza B viruses were characterized as B/Brisbane/60/2008-like, one of the influenza B components of the 2015-16 Northern Hemisphere quadrivalent influenza vaccine.
The recommended components for the 2015-2016 Northern Hemisphere trivalent influenza vaccine included: an A/California/7/2009(H1N1)pdm09-like virus, an A/Switzerland/9715293/2013(H3N2)-like virus, and a B/Phuket/3073/2013 -like virus (Yamagata lineage). For quadrivalent vaccines, the addition of a B/Brisbane/60/2008-like virus (Victoria lineage) is recommended.
The NML receives a proportion of the influenza positive specimens from provincial laboratories for strain characterization and antiviral resistance testing. Characterization data reflect the results of haemagglutination inhibition testing compared to the reference influenza strains recommended by WHO.
.../
http://healthycanadians.gc.ca/publi...16-18-20-surveillance-influenza/index-eng.php