Ronan Kelly
Retired 2020
Updated information marked with a *
*New South Wales
Week 37: 12 September to 18 September 2016
Summary:
Seasonal influenza activity continues to fall overall but remains high in some areas,
particularly the Hunter New England Local Health District.
Influenza A(H3N2) remains the dominant circulating influenza strain.
In this reporting week:
Hospital Surveillance ? influenza like illness (ILI) presentations to selected emergency
departments decreased and were below peak levels. The index of increase indicates that
activity peaked on 28 August 2016.
Laboratory surveillance ? the total number of influenza isolations decreased further this week
with the proportion of respiratory samples positive for influenza at 21.0%.
Community surveillance ? influenza notifications continued to be high across most local health
districts (LHD), but decreasing. General Practice and community-based surveillance systems
showed decreasing ILI activity. Influenza activity continues to impact heavily on the aged care
sector with 22 new respiratory outbreaks reported this week in residential aged care facilities.
National and international influenza surveillance ? the most recent national reports suggest
influenza activity at the national level continued to increase, with most regions of Australia
reporting widespread and increasing activity. Current influenza strains are well matched to the
2016 influenza vaccines.
For more information: NSW Health - Infectious Diseases
*Queensland
Statewide Weekly Influenza
Surveillance Report
Reporting Period: 1 January to 18 September 2016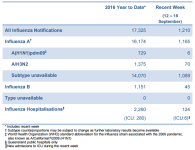
For more information: Queensland Health
*South Australia
4 September to 10 September 2016
The influenza season has started. Influenza vaccine is still available and we advise people (≥6 months of age) to get vaccinated as soon as possible.
Four hundred and twenty-six cases of influenza were reported this week with 405 cases being
characterised as influenza A and 21 as influenza B. Cases comprised of 200 males and 226 females,
with a median age of 35 years. Eighty-nine (21%) notifications were for children aged less than 10
years and 74 (17%) notifications for persons aged 65 years or greater. There have been 3,059 cases
of influenza notified year-to-date, compared with 11,800 cases reported for the same period last year
The influenza chart shows recent influenza activity in South Australia.
For more information: SA Health
Tasmania
Issue 3 | 18 August 2016
The modest increase in influenza activity at the end of July is similar to pre-season activity observed in
recent years.
The 2016 winter flu season appeared to be beginning toward the end of July.
Influenza A virus is the most common cause of laboratory confirmed Influenza. The most common
circulating strains included A(H1N1)pdm09, followed by A(H3N2). The 2016 annual vaccine covers these
strains.
There was a small increase in laboratory tests of nose and throat swabs during July. Respiratory Syncytial
Virus (RSV) was the most commonly detected respiratory pathogen followed by Rhinovirus and Influenza A
virus.
Surveillance of influenza-like illness by General Practice and FluTracking continued to indicate low activity
during this period.
There were a further 37 notifications of influenza during July, resulting in a total of 159 influenza notifications
since the start of 2016. The July total of 37 notifications is the largest monthly total since the start of 2016 (see
Table 1). Weekly notification counts increased during July, with 18 of the 37 influenza notifications in the final
week (see Figure 1).
During July 2016, Influenza A virus was the most common cause of influenza in Tasmania: isolated in 34 out of 37
notifications. Since the start of 2016, additional laboratory typing has been performed on 25 samples of influenza
A virus. Sixteen samples were the A(H1N1)pdm09 strain while the remaining nine were A(H3N2). The 2016
annual influenza vaccine covers both of these strains. See Annual Influenza Vaccine (page 6).
For more information: DHHS Tasmania
Victoria
Report No. 19: Week ending 11 September 2016
Overview: The 2016 influenza season so far Measures of influenza-like illness (ILI) from VicSPIN and the National Home Doctor Service indicate the season is currently at average levels. The number of notified laboratory confirmed influenza cases for the year to 11 September is 50% lower than at the same time in 2015. Of the notified influenza cases, 92% have been type A. Forty-eight percent of VicSPIN swabs were positive for influenza, most of which were influenza A(H3N2). Although cases of notified laboratory confirmed influenza are still increasing, data from other influenza and ILI surveillance systems indicate that the 2016 season probably peaked over the last several weeks.
For more information: Victorian Infectious Diseases Reference Laboratory
*Western Australia
WEEK ENDING 18TH SEPTEMBER 2016
KEY POINTS
INFLUENZA AND INFLUENZA-LIKE ILLNESSES (ILI)
Summary: Indicators of ILI and influenza activity suggest the influenza season reached its peak in late
August, but activity remains high, with influenza A/H3N2 virus as the dominant circulating strain.
? ILI presentations to sentinel general practitioners (GPs) remain higher than expected, possibly due to
increased training and recruitment of sentinel GPs.
? ILI presentations to sentinel emergency departments (EDs) have plateaued over the past few weeks,
but remain relatively high.
? The percent of tests positive for influenza virus and notifications of laboratory-confirmed influenza
decreased this week but remain in the higher range of values observed during this time period in
recent years.
? Hospital admissions with notified influenza have plateaued over recent weeks but remain above the
average level experienced in recent years.
? Influenza A/H3N2 (74% of detections) remains the dominant circulating virus with continuing influenza
B (24%) activity.
? One new influenza outbreak was reported in a residential aged care facility in the past week, with over
30 outbreaks reported so far this season.
? Non-influenza respiratory virus activity remains below levels for the corresponding period in 2015.
For more information: WA Dept.of Health
*Nationally
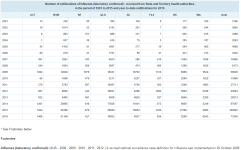
For the period to Jan 1- Sep 25th, 2016.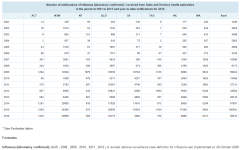
For national data: National Notifiable Diseases Surveillance System
Australian Sentinel Practices Research Network (ASPREN)
No. 16, 2016
1st August-14th August, 2016
SYNDROMIC SURVEILLANCE
REPORTING
Reports were received from 293 GPs from 8
states and territories during the reporting
period. During weeks 31 and 32 a total of
21,960 and 21,025 consultations were made
respectively.
INFLUENZA-LIKE-ILLNESS (ILI)
Nationally, ILI notifications increased over the period with 255
and 265 notifications in weeks 31 and 32 respectively. ILI
rates reported in this period were higher with 13 cases
weighted / 12 and 13 cases unweighted per 1000
consultations in weeks 31 and 32 respectively, compared to
11 and 10 cases weighted / 8 and 9 unweighted per 1000
consultations in weeks 29 and 30 respectively. For the same
reporting period in 2015, ILI rates were the higher at 14 and
15 cases weighted / 14 unweighted per 1000 consultations
(see Figure 5). On a state-by-state basis, it is important to
note the increased ILI rate in Urban ACT (see Figure 2).
For more information: ASPREN
*Flu Tracking
Flutracking Weekly Interim Report
Week ending 18 September 2016
Low levels of influenza-like illness activity
This survey was sent on Monday, 19 September 2016 at 01:13 AM and by 09:00 AM, Thursday 22 September we had received 22289 responses (22648 last week) from 13496 people responding for themselves and 8793 household members across Australia.
Across Australia, fever and cough was reported by 2.1% of vaccinated participants and 2.5% of unvaccinated participants. Fever, cough and absence from normal duties was reported by 1.6% of vaccinated participants and 1.8% of unvaccinated participants.
For participants this week, 13565/22289 (60.9 %) have received the seasonal vaccine so far. Of the 4364 participants who identified as working face-to-face with patients, 3523 (80.7%) have received the vaccine.
For more information: Flu Tracking
*Australian influenza report 2016 - Current report:
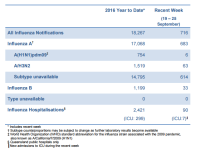
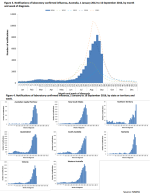
Australian Influenza Surveillance Report No 08 - 03 September to 16 September 2016
Summary
In the fortnight ending 16 September 2016, influenza activity declined nationally; however, widespread activity continued to be reported in a number of regions.
National indicators of influenza-like illness (ILI) declined in the last fortnight, further supporting that the season has peaked nationally. The proportion of patients presenting to sentinel general practitioners with ILI and testing positive for influenza declined this fortnight.
Influenza A(H3N2) continued to be the dominant circulating influenza virus nationally.
Notification rates this year to date have been highest in adults aged 75 years or older, with a secondary peak in the very young, aged less than 5 years. This is consistent with influenza A(H3N2) being typically more prevalent in older age groups.
Clinical severity for the season to date, as measured through the proportion of patients admitted directly to ICU and deaths attributable to pneumonia or influenza, is low to moderate.
To date, the seasonal influenza vaccines appear to be a good match for circulating virus strains.
For more information: Department of Health
*New South Wales
Week 37: 12 September to 18 September 2016
Summary:
Seasonal influenza activity continues to fall overall but remains high in some areas,
particularly the Hunter New England Local Health District.
Influenza A(H3N2) remains the dominant circulating influenza strain.
In this reporting week:
Hospital Surveillance ? influenza like illness (ILI) presentations to selected emergency
departments decreased and were below peak levels. The index of increase indicates that
activity peaked on 28 August 2016.
Laboratory surveillance ? the total number of influenza isolations decreased further this week
with the proportion of respiratory samples positive for influenza at 21.0%.
Community surveillance ? influenza notifications continued to be high across most local health
districts (LHD), but decreasing. General Practice and community-based surveillance systems
showed decreasing ILI activity. Influenza activity continues to impact heavily on the aged care
sector with 22 new respiratory outbreaks reported this week in residential aged care facilities.
National and international influenza surveillance ? the most recent national reports suggest
influenza activity at the national level continued to increase, with most regions of Australia
reporting widespread and increasing activity. Current influenza strains are well matched to the
2016 influenza vaccines.
For more information: NSW Health - Infectious Diseases
*Queensland
Statewide Weekly Influenza
Surveillance Report
Reporting Period: 1 January to 18 September 2016
For more information: Queensland Health
*South Australia
4 September to 10 September 2016
The influenza season has started. Influenza vaccine is still available and we advise people (≥6 months of age) to get vaccinated as soon as possible.
Four hundred and twenty-six cases of influenza were reported this week with 405 cases being
characterised as influenza A and 21 as influenza B. Cases comprised of 200 males and 226 females,
with a median age of 35 years. Eighty-nine (21%) notifications were for children aged less than 10
years and 74 (17%) notifications for persons aged 65 years or greater. There have been 3,059 cases
of influenza notified year-to-date, compared with 11,800 cases reported for the same period last year
The influenza chart shows recent influenza activity in South Australia.
For more information: SA Health
Tasmania
Issue 3 | 18 August 2016
The modest increase in influenza activity at the end of July is similar to pre-season activity observed in
recent years.
The 2016 winter flu season appeared to be beginning toward the end of July.
Influenza A virus is the most common cause of laboratory confirmed Influenza. The most common
circulating strains included A(H1N1)pdm09, followed by A(H3N2). The 2016 annual vaccine covers these
strains.
There was a small increase in laboratory tests of nose and throat swabs during July. Respiratory Syncytial
Virus (RSV) was the most commonly detected respiratory pathogen followed by Rhinovirus and Influenza A
virus.
Surveillance of influenza-like illness by General Practice and FluTracking continued to indicate low activity
during this period.
There were a further 37 notifications of influenza during July, resulting in a total of 159 influenza notifications
since the start of 2016. The July total of 37 notifications is the largest monthly total since the start of 2016 (see
Table 1). Weekly notification counts increased during July, with 18 of the 37 influenza notifications in the final
week (see Figure 1).
During July 2016, Influenza A virus was the most common cause of influenza in Tasmania: isolated in 34 out of 37
notifications. Since the start of 2016, additional laboratory typing has been performed on 25 samples of influenza
A virus. Sixteen samples were the A(H1N1)pdm09 strain while the remaining nine were A(H3N2). The 2016
annual influenza vaccine covers both of these strains. See Annual Influenza Vaccine (page 6).
For more information: DHHS Tasmania
Victoria
Report No. 19: Week ending 11 September 2016
Overview: The 2016 influenza season so far Measures of influenza-like illness (ILI) from VicSPIN and the National Home Doctor Service indicate the season is currently at average levels. The number of notified laboratory confirmed influenza cases for the year to 11 September is 50% lower than at the same time in 2015. Of the notified influenza cases, 92% have been type A. Forty-eight percent of VicSPIN swabs were positive for influenza, most of which were influenza A(H3N2). Although cases of notified laboratory confirmed influenza are still increasing, data from other influenza and ILI surveillance systems indicate that the 2016 season probably peaked over the last several weeks.
For more information: Victorian Infectious Diseases Reference Laboratory
*Western Australia
WEEK ENDING 18TH SEPTEMBER 2016
KEY POINTS
INFLUENZA AND INFLUENZA-LIKE ILLNESSES (ILI)
Summary: Indicators of ILI and influenza activity suggest the influenza season reached its peak in late
August, but activity remains high, with influenza A/H3N2 virus as the dominant circulating strain.
? ILI presentations to sentinel general practitioners (GPs) remain higher than expected, possibly due to
increased training and recruitment of sentinel GPs.
? ILI presentations to sentinel emergency departments (EDs) have plateaued over the past few weeks,
but remain relatively high.
? The percent of tests positive for influenza virus and notifications of laboratory-confirmed influenza
decreased this week but remain in the higher range of values observed during this time period in
recent years.
? Hospital admissions with notified influenza have plateaued over recent weeks but remain above the
average level experienced in recent years.
? Influenza A/H3N2 (74% of detections) remains the dominant circulating virus with continuing influenza
B (24%) activity.
? One new influenza outbreak was reported in a residential aged care facility in the past week, with over
30 outbreaks reported so far this season.
? Non-influenza respiratory virus activity remains below levels for the corresponding period in 2015.
For more information: WA Dept.of Health
*Nationally
For the period to Jan 1- Sep 25th, 2016.
For national data: National Notifiable Diseases Surveillance System
Australian Sentinel Practices Research Network (ASPREN)
No. 16, 2016
1st August-14th August, 2016
SYNDROMIC SURVEILLANCE
REPORTING
Reports were received from 293 GPs from 8
states and territories during the reporting
period. During weeks 31 and 32 a total of
21,960 and 21,025 consultations were made
respectively.
INFLUENZA-LIKE-ILLNESS (ILI)
Nationally, ILI notifications increased over the period with 255
and 265 notifications in weeks 31 and 32 respectively. ILI
rates reported in this period were higher with 13 cases
weighted / 12 and 13 cases unweighted per 1000
consultations in weeks 31 and 32 respectively, compared to
11 and 10 cases weighted / 8 and 9 unweighted per 1000
consultations in weeks 29 and 30 respectively. For the same
reporting period in 2015, ILI rates were the higher at 14 and
15 cases weighted / 14 unweighted per 1000 consultations
(see Figure 5). On a state-by-state basis, it is important to
note the increased ILI rate in Urban ACT (see Figure 2).
For more information: ASPREN
*Flu Tracking
Flutracking Weekly Interim Report
Week ending 18 September 2016
Low levels of influenza-like illness activity
This survey was sent on Monday, 19 September 2016 at 01:13 AM and by 09:00 AM, Thursday 22 September we had received 22289 responses (22648 last week) from 13496 people responding for themselves and 8793 household members across Australia.
Across Australia, fever and cough was reported by 2.1% of vaccinated participants and 2.5% of unvaccinated participants. Fever, cough and absence from normal duties was reported by 1.6% of vaccinated participants and 1.8% of unvaccinated participants.
For participants this week, 13565/22289 (60.9 %) have received the seasonal vaccine so far. Of the 4364 participants who identified as working face-to-face with patients, 3523 (80.7%) have received the vaccine.
For more information: Flu Tracking
*Australian influenza report 2016 - Current report:
Australian Influenza Surveillance Report No 08 - 03 September to 16 September 2016
Summary
In the fortnight ending 16 September 2016, influenza activity declined nationally; however, widespread activity continued to be reported in a number of regions.
National indicators of influenza-like illness (ILI) declined in the last fortnight, further supporting that the season has peaked nationally. The proportion of patients presenting to sentinel general practitioners with ILI and testing positive for influenza declined this fortnight.
Influenza A(H3N2) continued to be the dominant circulating influenza virus nationally.
Notification rates this year to date have been highest in adults aged 75 years or older, with a secondary peak in the very young, aged less than 5 years. This is consistent with influenza A(H3N2) being typically more prevalent in older age groups.
Clinical severity for the season to date, as measured through the proportion of patients admitted directly to ICU and deaths attributable to pneumonia or influenza, is low to moderate.
To date, the seasonal influenza vaccines appear to be a good match for circulating virus strains.
For more information: Department of Health