

sharon sanders
Editor-in-Chief & President
FluView Week 48
# 4148
The CDC has posted FluView for week 48, ending December 5th , 2009. The amount of flu activity we are seeing has decreased again for the sixth straight week after four consecutive weeks of sharp gains, but is still higher than normally seen this time of year.
We?ll just have to wait to see. In the meantime, we?ll take any respite we can get.
I?ve excerpted some of the data and graphs below, but follow the link to read it in its entirety.
2009-2010 Influenza Season Week 48 ending December 5, 2009
All data are preliminary and may change as more reports are received.
Synopsis:
During week 48 (November 29-December 5, 2009), influenza activity continued to decrease in the U.S
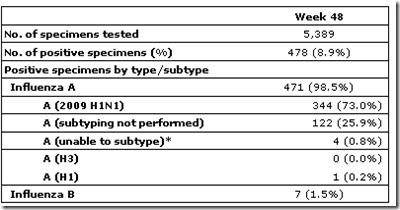
WHO and NREVSS collaborating laboratories located in all 50 states and Washington D.C., report to CDC the number of respiratory specimens tested for influenza and the number positive by influenza type and subtype. The results of tests performed during the current week are summarized in the table below.
Pneumonia and Influenza (P&I) Mortality Surveillance
During week 48, 7.8% of all deaths reported through the 122-Cities Mortality Reporting System were due to P&I. This percentage was above the epidemic threshold of 7.1% for week 48. Including week 48, P&I mortality has been above threshold for 10 consecutive weeks.

Influenza-Associated Pediatric Mortality
Sixteen influenza-associated pediatric deaths were reported to CDC during week 48 (Alabama, Arizona [2], California [3], Colorado, Minnesota [4], Missouri [2], New Mexico, North Carolina, and Virginia). Thirteen of these deaths were associated with 2009 influenza A (H1N1) virus infection, two were associated with an influenza A virus for which the subtype is undetermined, and one was associated with an influenza B virus infection. The deaths reported during week 48 occurred between August 9 and December 5, 2009.
One death associated with 2009 influenza A (H1N1) virus infection reported during week 48 occurred in August during the 2008-09 season, bringing the total number of reported pediatric deaths occurring during that season to 129.

Posted by FLA_MEDIC at <a class="timestamp-link" href="http://afludiary.blogspot.com/2009/12/fluview-week-48.html" rel="bookmark" title="permanent link"><abbr class="published" title="2009-12-11T17:53:00-05:00">5:53 PM</abbr> 0 comments 
Labels: CDC, FluView, Weekly
The Numbers Disconnect
# 4147
If you accept the CDC estimate that roughly 10,000 Americans have died as a result of the H1N1 related illness (as of mid-November), then you have to seriously question some of the other numbers that are being bandied about globally.
Is the US death rate really 14 times that of the UK? Or 42 times that of Japan. Or 144 times greater than China?
Not likely.
Today, the UK papers are pushing the idea that the Swine flu pandemic is `far less lethal than originally feared?.
And that is true.
This has not been a particularly lethal strain of influenza. But the numbers being used in today?s reportage would appear less than realistic.
This excerpt from The Nursing Times.
Backing these numbers up is yesterdays HPA (Health Protection Agency) update which stated:
This update, and the subsequent news reports, all seem to be hanging their collective hats on the notion that only 1% of the UK population has had `swine flu symptoms? . . . a remarkable number, given that roughly 15% of the US is estimated to have been infected.
Something obviously is askew here.
The World Health Organization is counting fewer global deaths than the US is estimating to have occurred within our own borders. But at least they acknowledge a serious undercount.
Good counts, or even reasonable estimates, are hard to come by. Particularly while the pandemic is ongoing.
Officials around the world proffer pandemic numbers that are ? at the very least ? deceptively incomplete and then wonder why the uptake of vaccine in their nations are so low.
I suspect the CDC?s estimates are closer to the truth than the UK, or Japan, or China?s numbers . . . but we probably won?t have a decent handle on the impact of this pandemic for some time.
Until then, all reports (regardless of the source) purporting to gauge the impact of this pandemic need to be taken with a large (boulder sized) grain of salt.
# 4148
The CDC has posted FluView for week 48, ending December 5th , 2009. The amount of flu activity we are seeing has decreased again for the sixth straight week after four consecutive weeks of sharp gains, but is still higher than normally seen this time of year.
P&I (pneumonia & Influenza) deaths increased over last week and remain above the epidemic level for this time of year, and 16 pediatric influenza-related deaths were added last week.
While the numbers here in the US, and also in Canada, reflect a winding down of the fall pandemic wave, what lies ahead is less clear. There are almost 5 more months remaining in flu season, and there are a number of possible scenarios (see Waiting For The Other Flu To Drop).
We?ll just have to wait to see. In the meantime, we?ll take any respite we can get.
I?ve excerpted some of the data and graphs below, but follow the link to read it in its entirety.
2009-2010 Influenza Season Week 48 ending December 5, 2009
All data are preliminary and may change as more reports are received.
Synopsis:
During week 48 (November 29-December 5, 2009), influenza activity continued to decrease in the U.S
- 478 (8.9%) specimens tested by U.S. World Health Organization (WHO) and National Respiratory and Enteric Virus Surveillance System (NREVSS) collaborating laboratories and reported to CDC/Influenza Division were positive for influenza.
- Over 99% of all subtyped influenza A viruses being reported to CDC were 2009 influenza A (H1N1) viruses.
- The proportion of deaths attributed to pneumonia and influenza (P&I) was above the epidemic threshold for the tenth consecutive week.
- Sixteen influenza-associated pediatric deaths were reported. Thirteen of these deaths were associated with 2009 influenza A (H1N1) virus infection, two were associated with an influenza A virus for which the subtype was undetermined, and one was associated with an influenza B virus infection.
- The proportion of outpatient visits for influenza-like illness (ILI) was 2.7% which is above the national baseline of 2.3%. Six of the 10 regions reported ILI at or above region-specific baseline levels. Regions 3, 6, 8 and 10 reported ILI below their region specific baselines.
- Fourteen states reported geographically widespread influenza activity, Puerto Rico and 25 states reported regional influenza activity, the District of Columbia and seven states reported local influenza activity, and the U.S. Virgin Islands, Guam and four states reported sporadic influenza activity.
WHO and NREVSS collaborating laboratories located in all 50 states and Washington D.C., report to CDC the number of respiratory specimens tested for influenza and the number positive by influenza type and subtype. The results of tests performed during the current week are summarized in the table below.
Pneumonia and Influenza (P&I) Mortality Surveillance
During week 48, 7.8% of all deaths reported through the 122-Cities Mortality Reporting System were due to P&I. This percentage was above the epidemic threshold of 7.1% for week 48. Including week 48, P&I mortality has been above threshold for 10 consecutive weeks.
Influenza-Associated Pediatric Mortality
Sixteen influenza-associated pediatric deaths were reported to CDC during week 48 (Alabama, Arizona [2], California [3], Colorado, Minnesota [4], Missouri [2], New Mexico, North Carolina, and Virginia). Thirteen of these deaths were associated with 2009 influenza A (H1N1) virus infection, two were associated with an influenza A virus for which the subtype is undetermined, and one was associated with an influenza B virus infection. The deaths reported during week 48 occurred between August 9 and December 5, 2009.
One death associated with 2009 influenza A (H1N1) virus infection reported during week 48 occurred in August during the 2008-09 season, bringing the total number of reported pediatric deaths occurring during that season to 129.
Labels: CDC, FluView, Weekly
The Numbers Disconnect
# 4147
If you accept the CDC estimate that roughly 10,000 Americans have died as a result of the H1N1 related illness (as of mid-November), then you have to seriously question some of the other numbers that are being bandied about globally.
The US estimate of 10,000 deaths is about 1 death for every 30,000 people in the country.
- The UK, on the other hand, is reporting only 138 deaths (population 60 million). That?s 1 death in every 435,000 people.
- Japan, with twice the population of the UK, is reporting just 100 deaths.
- And China, with 1.3 Billion people, is reporting only 300 deaths.
Is the US death rate really 14 times that of the UK? Or 42 times that of Japan. Or 144 times greater than China?
Not likely.
Today, the UK papers are pushing the idea that the Swine flu pandemic is `far less lethal than originally feared?.
And that is true.
This has not been a particularly lethal strain of influenza. But the numbers being used in today?s reportage would appear less than realistic.
This excerpt from The Nursing Times.
Swine flu 'less lethal than feared'
11 December, 2009
Chief Medical Officer Sir Liam Donaldson claims the swine flu pandemic is ?considerably less lethal? than feared, but has warned this should not be an excuse for ?inaction?.
Figures show that the death rate from the disease is lower than 0.1%, with 26 fatalities for every 100,000 cases in England.
The research, published online in the journal British Medical Journal analysed data for up to November 8.
It noted that swine flu symptoms were experienced by about 1% of the population in England, of which 0.026% died.
Death rate was estimated to be lowest among children aged five to 14 (11 deaths per 100,000 population) and highest among those aged over 65 (980 per 100,000).
(Continue . . . )
11 December, 2009
Chief Medical Officer Sir Liam Donaldson claims the swine flu pandemic is ?considerably less lethal? than feared, but has warned this should not be an excuse for ?inaction?.
Figures show that the death rate from the disease is lower than 0.1%, with 26 fatalities for every 100,000 cases in England.
The research, published online in the journal British Medical Journal analysed data for up to November 8.
It noted that swine flu symptoms were experienced by about 1% of the population in England, of which 0.026% died.
Death rate was estimated to be lowest among children aged five to 14 (11 deaths per 100,000 population) and highest among those aged over 65 (980 per 100,000).
(Continue . . . )
Backing these numbers up is yesterdays HPA (Health Protection Agency) update which stated:
Weekly pandemic flu media update
10 December 2009
The HPA estimates a cumulative total number of cases of 795,000 (with a range 380,000 to 1,665,000) since the pandemic began.
10 December 2009
The HPA estimates a cumulative total number of cases of 795,000 (with a range 380,000 to 1,665,000) since the pandemic began.
This update, and the subsequent news reports, all seem to be hanging their collective hats on the notion that only 1% of the UK population has had `swine flu symptoms? . . . a remarkable number, given that roughly 15% of the US is estimated to have been infected.
While I suppose you could make the case for a horrific over estimation of cases by the CDC, it was just a few weeks ago that the HPA announced that up to 1/3rd of school children in some districts may have been infected by the H1N1 virus.
This from Fergus Walsh?s Blog, Fergus on Flu dated November 24th.
The Health Protection Agency (HPA) has done blood tests of hundreds of children and parents connected to early school outbreaks.
With one school in south west England they tested around 500 people. They found that although around one in 10 children fell ill, three to five times as many got infected and developed antibodies.
After analysing this and other data relating to the number of children being seen by GPs, the HPA has now come up with these interesting estimates:
It is a bit difficult to reconcile a 1% attack rate (and 138 deaths) in the UK when just last month, the attack rate was being listed at somewhere between 10% and 30% of school children. With one school in south west England they tested around 500 people. They found that although around one in 10 children fell ill, three to five times as many got infected and developed antibodies.
After analysing this and other data relating to the number of children being seen by GPs, the HPA has now come up with these interesting estimates:
- Up to one third of children in swine flu hotspots (such as England and the West Midlands) have already been infected with the H1N1 virus.
- Across the UK up to one in five children has had had swine flu.
- About half of those who get infected show no symptoms.
Something obviously is askew here.
The World Health Organization is counting fewer global deaths than the US is estimating to have occurred within our own borders. But at least they acknowledge a serious undercount.
Good counts, or even reasonable estimates, are hard to come by. Particularly while the pandemic is ongoing.
And I?ve no quibble with the notion that this is ? as pandemics go ? a fairly mild one. We obviously haven?t seen anything near the impact of the 1918 pandemic ? and this may not even rise to the level of 1968.
While I accept that the UK, Japan, China, and the rest of the world may not have good numbers, or have made reasonable estimates, their willingness to blithely use incomplete data as if it represents reality is a disservice to their people, and those working in the public health arena.
Officials around the world proffer pandemic numbers that are ? at the very least ? deceptively incomplete and then wonder why the uptake of vaccine in their nations are so low.
I?m continually amazed that the media so often prints these numbers without comment or bothers to press public health officials about these seeming inconsistencies.
As far as what the `right? number is, I?ve no way to know.
I suspect the CDC?s estimates are closer to the truth than the UK, or Japan, or China?s numbers . . . but we probably won?t have a decent handle on the impact of this pandemic for some time.
Until then, all reports (regardless of the source) purporting to gauge the impact of this pandemic need to be taken with a large (boulder sized) grain of salt.