• FluTrackers.com Inc. does not provide medical advice. Information on this web site is collected from various internet resources, and the FluTrackers board of directors makes no warranty to the safety, efficacy, correctness or completeness of the information posted on this site by any author or poster. The information collated here is for instructional and/or discussion purposes only and is NOT intended to diagnose or treat any disease, illness, or other medical condition. Every individual reader or poster should seek advice from their personal physician/healthcare practitioner before considering or using any interventions that are discussed on this website. By continuing to access this website you agree to consult your personal physican before using any interventions posted on this website, and you agree to hold harmless FluTrackers.com Inc., the board of directors, the members, and all authors and posters for any effects from use of any medication, supplement, vitamin or other substance, device, intervention, etc. mentioned in posts on this website, or other internet venues referenced in posts on this website.
  • We are not asking for any donations. Do not donate to any entity who says they are raising funds for us.

USA - Actual ISDS flu trends

Re: USA - Actual ISDS flu trends

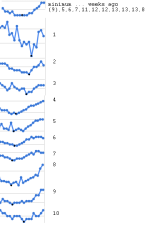
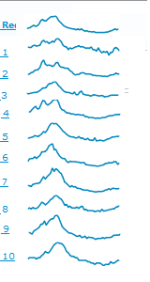
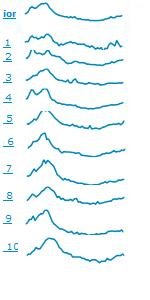
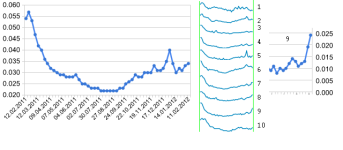
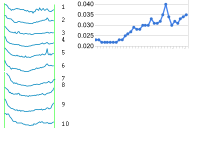
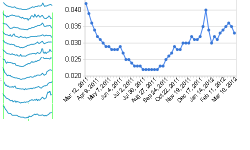
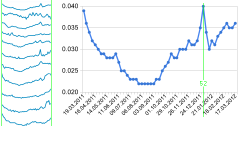
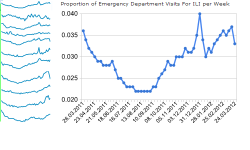
the last data-point in the ISDS charts is often unrelyable

see e.g. region 3 : the big down in the last week is hard to believe
and likely to be corrected soon

region 5,8 had an up especally in the last week, while region 6
is continuously up since 4 weeks.

Of course, these are only small changes, but interesting to watch
how the new wave starts.
Is it already now that it is being determined what strain will dominate in Jan.,Feb. ?
 
Re: USA - Actual ISDS flu trends

NE is not yet going up

usz1.PNG
 
Re: USA - Actual ISDS flu trends

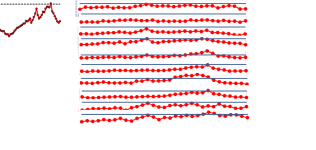
ILI is up in all regions now, except region 1, NE-USA

this could be due to the still high temperature in this region
and high humidity

comparing Chicago,IL with Augusta,ME

5vs1.PNG
 
Re: USA - Actual ISDS flu trends

v..............................
 

Attachments

  • isdse41.png
    isdse41.png
    18.1 KB · Views: 0
  • isdse42.png
    isdse42.png
    10.5 KB · Views: 0
Re: USA - Actual ISDS flu trends

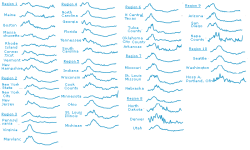
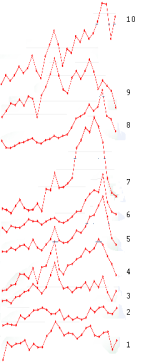
week 46
Mass,Ver,Minn,Ark,NH,NY,NJ,Napa,

attachment.php
 

Attachments

  • isds12a.png
    isds12a.png
    54.2 KB · Views: 0
Re: USA - Actual ISDS flu trends

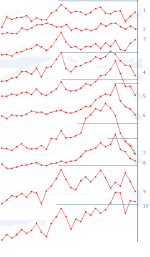
week 47 , future weeks to the right of this
attachment.php
attachment.php
 

Attachments

  • isds47.jpg
    isds47.jpg
    8.4 KB · Views: 0
Re: USA - Actual ISDS flu trends

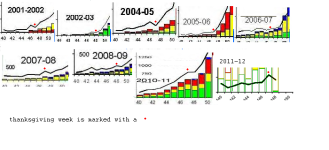
rechecking the thanksgiving theory from post 20 ..

doesn't fit so well with the exact thanksgiving week.
Until 2006 the dent was in the thanksgiving week,
since 2007 it is in the week after thanksgiving

maybe school holidays ? or whether ?
can be used to explain the almost yearly small dents at the
beginning of the US-flu-season


thanksgiving dent

http://www.flutrackers.com/forum/showpost.php?p=388671


> Thanksgiving Day, celebrated on the fourth Thursday in November,


Thursday, November 22, 2001 , week 47
Thursday, November 28, 2002 , week 48
Thursday, November 27, 2003 , week 48
Thursday, November 25, 2004 , week 47
Thursday, November 24, 2005 , week 47
Thursday, November 23, 2006 , week 47
Thursday, November 22, 2007 , week 47
Thursday, November 27, 2008 , week 48
Thursday, November 26, 2009 , week 47
Thursday, November 25, 2010 , week 47
Thursday, November 24, 2011 , week 47


attachment.php


2003/04 and 2009/10 were excluded, because flu started extraordinarily early in those years
 

Attachments

  • tgdent2.png
    tgdent2.png
    138.7 KB · Views: 0
Re: USA - Actual ISDS flu trends

I don't see any talk about a Thanksgiving theory in post #20.

What was the theory?
 
Re: USA - Actual ISDS flu trends

http://www.flutrackers.com/forum/showthread.php?t=158252
posts 20-36

We also discussed the effect of Christmas or New Year holidays.

the charts are % positives, it's not so clear in the mere ILI-charts,
I may try that too later.

These are ratios, so less reporting or less testing over the holidays
would be cancelled out.


I would have expected that these events did increase flu because
of family gatherings --> spreading, but the reverse seems to take place.
Maybe it's mainly the children that contribute and mainly at school ?
Or normal business provides more contacts and virus spread
than family meetings.

------edit--------
USA:
Fall Break - about 2 to 3 days to one week in the fall, generally around Mid to late October (depending on region)
Thanksgiving Holiday - End of November (Thanksgiving Day & Day after - Wednesday is half day)

so, that doesn't fit
 
Re: USA - Actual ISDS flu trends

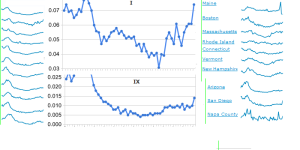
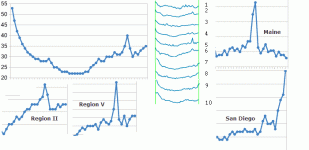
Maine looks very much like a data-error, we had that before.
Also San Diego in region 9

attachment.php
 

Attachments

  • isds12b.png
    isds12b.png
    42 KB · Views: 0
Re: USA - Actual ISDS flu trends

Week 50: Maine Center for Disease Control and Prevention reports:
ED ILI: 1%
P&I: 21.7%
No positives for influenza

Hospital admissions have been below last year while P&I deaths have been above
http://www.maine.gov/dhhs/mecdc/inf...a/influenza-surveillance-weekly-updates.shtml

Week 50: County of San Diego reporting
ED ILI: 3%
P&I: 6% (last week 11%)
Influenza A detected; last week 12 samples tested positive for A and B varieties
http://www.sdcounty.ca.gov/hhsa/programs/phs/community_epidemiology/disease_surveillance.html

Nebraska? Reporting no flu related deaths for season (in week 49 report) http://dhhs.ne.gov/publichealth/pages/flu_report.aspx
ED ILI: last report week 49 was 5.83%
Omaha P&I week 50: 10.8% (week 49: 10%)
Lincoln P&I week 50: 0 (week 49: 5.4%)
http://www.cdc.gov/mmwr/preview/mmwrhtml/mm6050md.htm?s_cid=mm6050md_w
http://www.cdc.gov/mmwr/preview/mmwrhtml/mm6049md.htm?s_cid=mm6049md_w
 
Re: USA - Actual ISDS flu trends

ffffffffffffffffffff
 

Attachments

  • us0211.png
    us0211.png
    68.4 KB · Views: 0
Re: USA - Actual ISDS flu trends

attachment.php


attachment.php
 

Attachments

  • isds5z.png
    isds5z.png
    27.4 KB · Views: 0
  • isdsz7.png
    isdsz7.png
    15.8 KB · Views: 0
  • isdsz8.gif
    isdsz8.gif
    12.7 KB · Views: 0
  • isdsz9.png
    isdsz9.png
    22 KB · Views: 0
  • isdsz10.png
    isdsz10.png
    24 KB · Views: 0
  • isdsz11.png
    isdsz11.png
    24.7 KB · Views: 0
  • isdsz12.png
    isdsz12.png
    25.5 KB · Views: 0
Re: USA - Actual ISDS flu trends

this is being updated (almost) weekly
see picture-links in the post above

Attached Images
isds5z.png (27.4 KB, 26 views)
isdsz7.png (15.8 KB, 11 views)
isdsz8.gif (12.7 KB, 2 views)

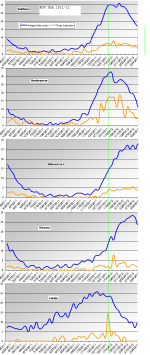
week 10 - does that even count as "flu-season" this year in USA ?
or Russia,or England


Attached Images isds5z.png (27.4 KB, 34 views)
isdsz7.png (15.8 KB, 20 views)
isdsz8.gif (12.7 KB, 4 views)
isdsz9.png (22.0 KB, 3 views)
isdsz10.png (24.0 KB, 1 views)
isdsz11.png (24.7 KB, 5 views)
isdsz12.png (25.5 KB, 0 views)
 
Re: USA - Actual ISDS flu trends

> The evolving nature of syndromic surveillance practice in the US has
> led ISDS to make the difficult decision to end its management of
> the Distribute system.
> As of April 4, 2012, ISDS will no longer be displaying visualizations of
> the Proportion of Emergency Department Visits For Influenza-like
> Illness (ILI) per Week on this site.


---------------------------

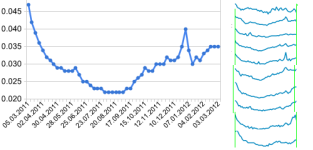
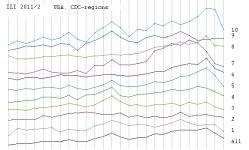
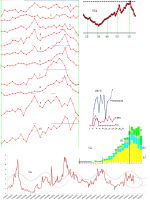
so I took the CDC-data , this is ~ 1 week behind the ISDS-data and
the regions have different sizes, so I normalized

region 9 is still going up , B up, H3N2 slowly declining

----------------------------------------------------

week 14: up in regions 1,2,3,10 down in 4,5,6,7,8,9
week 15: up in 1,3
 

Attachments

  • cdc1113.png
    cdc1113.png
    11.6 KB · Views: 0
  • rsvz2.png
    rsvz2.png
    93.8 KB · Views: 0
  • fluzus14.png
    fluzus14.png
    30.4 KB · Views: 0
  • usfluz15.png
    usfluz15.png
    55.3 KB · Views: 0
  • usfluz16.png
    usfluz16.png
    127.6 KB · Views: 0
  • flusz18.png
    flusz18.png
    24.5 KB · Views: 0
Back
Top