• FluTrackers.com Inc. does not provide medical advice. Information on this web site is collected from various internet resources, and the FluTrackers board of directors makes no warranty to the safety, efficacy, correctness or completeness of the information posted on this site by any author or poster. The information collated here is for instructional and/or discussion purposes only and is NOT intended to diagnose or treat any disease, illness, or other medical condition. Every individual reader or poster should seek advice from their personal physician/healthcare practitioner before considering or using any interventions that are discussed on this website. By continuing to access this website you agree to consult your personal physican before using any interventions posted on this website, and you agree to hold harmless FluTrackers.com Inc., the board of directors, the members, and all authors and posters for any effects from use of any medication, supplement, vitamin or other substance, device, intervention, etc. mentioned in posts on this website, or other internet venues referenced in posts on this website.
  • We are not asking for any donations. Do not donate to any entity who says they are raising funds for us.

Weekly MMWR: Week 30 (2009) - Week 39 (2010)

Re: Weekly MMWR - Week 30 2009 - Updated through Week 14, 2010

Re: Weekly MMWR - Week 30 2009 - Updated through Week 14, 2010

no update this week (14) on Thursday US-holiday ?
 
Re: Weekly MMWR - Week 30 2009 - Updated through Week 14, 2010

Re: Weekly MMWR - Week 30 2009 - Updated through Week 14, 2010

Week 15

828 P&I deaths
10897 total deaths

P&I mortality 7,6%
 
Re: Weekly MMWR - Week 30 2009 - Updated through Week 15, 2010

Re: Weekly MMWR - Week 30 2009 - Updated through Week 15, 2010

so much P+I mortality but no flu.
And no idea, why ?
And no comment/explanation from CDC etc.

and that since ~10 weeks
 
Re: Weekly MMWR - Week 30 2009 - Updated through Week 15, 2010

Re: Weekly MMWR - Week 30 2009 - Updated through Week 15, 2010

probably they have no idea...
 
Re: Weekly MMWR - Week 30 2009 - Updated through Week 15, 2010

Re: Weekly MMWR - Week 30 2009 - Updated through Week 15, 2010

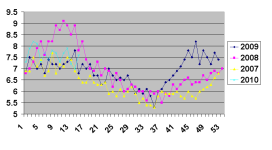
For comparison % P&I in the past few years;

P&I 2007-2010.PNG
 
Re: Weekly MMWR - Week 30 2009 - Updated through Week 15, 2010

Re: Weekly MMWR - Week 30 2009 - Updated through Week 15, 2010

There are many pneumonia deaths even if the elderly group has the lowest mortality compared to previous years
Usually, high P&I mortality means high elderly mortality, as it happened in the previous years
 
Re: Weekly MMWR - Week 30 2009 - Updated through Week 15, 2010

Re: Weekly MMWR - Week 30 2009 - Updated through Week 15, 2010

Look at Distribute age-groupings. "...plots of counts of Influenza like illness (ILI) over time, for each site, stratified by age group. The color represents the magnitude of the counts, allowing each year's outbreak to be compared with similar outbreaks for prior years, and for other sites." Beginning around Feb 2010 the magnitude was greater than during Oct 2009 (for most areas).
http://isds.cirg.washington.edu/distribute/ili.php
 
Re: Weekly MMWR - Week 30 2009 - Updated through Week 15, 2010

Re: Weekly MMWR - Week 30 2009 - Updated through Week 15, 2010

Check out the recent spike in Federal Region IV. Maybe I don't understand the data set very well, but this doesn't seem to agree with the Region IV ILI trend in the latest FluView report. Am I missing something?

Gsgs or Missouriwatcher - any thoughts?

Federal Region IV.png
 
Re: Weekly MMWR - Week 30 2009 - Updated through Week 15, 2010

Re: Weekly MMWR - Week 30 2009 - Updated through Week 15, 2010

Fluview seems to be a week behind Distribute's data. Region 1 and 3 are also up. So if trend continues, expect to see rises in Regions 1, 3 and 4 it next week's Fluview. Also, Distribute will update their main page tomorrow. This should reflect the upward trends of the Regions, whatever up means any more.
 
Re: Weekly MMWR - Week 30 2009 - Updated through Week 15, 2010

Re: Weekly MMWR - Week 30 2009 - Updated through Week 15, 2010

Week 16


779 deaths for P&I
11112 total deaths

P&I rate 7%
 
Re: Weekly MMWR - Week 30 2009 - Updated through Week 16, 2010

Re: Weekly MMWR - Week 30 2009 - Updated through Week 16, 2010

Week 17:

758 P&I deaths
10718 total deaths

P&I mortality rate : 7,1
 
Re: Weekly MMWR - Week 30 2009 - Updated through Week 19, 2010

Re: Weekly MMWR - Week 30 2009 - Updated through Week 19, 2010

In the attached file, the tables with the data of the 122 cities total and P&I mortality in the last 12 months and in the last 31 weeks, compared with previous years.

Elderly' s mortality is the lowest with 6000 to 29000 less deaths in 12 months.
Since 122 cities are about 1/4 of the population of USA, these numbers must be multiplied by 4.

On the contrary, P&I mortality is high if compared to previous years, similar to 2007/08 ( a year with 13000 more deaths in the elderly) and with 2000 P&I less deaths compared to 2003/04 and 2004/05 ( but with 23000-29000 more deaths in the elderly).

Certainly it was a good year for the elderly, becouse seasonal influenza disappeared and they were spared by pandemic influenza.
But the void they left was filled by other age groups.
 

Attachments

Back
Top