
Install the app
How to install the app on iOS
Follow along with the video below to see how to install our site as a web app on your home screen.
Note: This feature may not be available in some browsers.
-
FluTrackers.com Inc. does not provide medical advice. Information on this web site is collected from various internet resources, and the FluTrackers board of directors makes no warranty to the safety, efficacy, correctness or completeness of the information posted on this site by any author or poster. The information collated here is for instructional and/or discussion purposes only and is NOT intended to diagnose or treat any disease, illness, or other medical condition. Every individual reader or poster should seek advice from their personal physician/healthcare practitioner before considering or using any interventions that are discussed on this website. By continuing to access this website you agree to consult your personal physican before using any interventions posted on this website, and you agree to hold harmless FluTrackers.com Inc., the board of directors, the members, and all authors and posters for any effects from use of any medication, supplement, vitamin or other substance, device, intervention, etc. mentioned in posts on this website, or other internet venues referenced in posts on this website. -
We are not asking for any donations. Do not donate to any entity who says they are raising funds for us.
You are using an out of date browser. It may not display this or other websites correctly.
You should upgrade or use an alternative browser.
You should upgrade or use an alternative browser.
Belgian charts
- Thread starter gsgs
- Start date

gsgs
Registered User
Re: Belgian charts
http://www.iph.fgov.be/flu/EN/Y2009-Influenza.pdf
update week 42
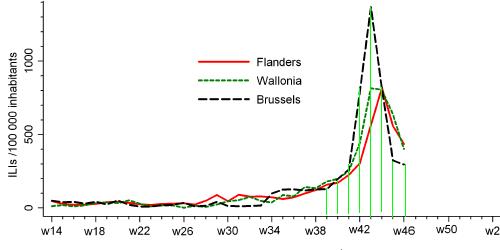
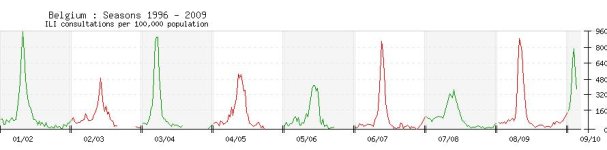
ILI in Belgium continues to go up. Even gains in speed.
Especially in Brussels.
Especially the 5-17 years olds.
But on the French -Belgian border in France it is going down.
But on the German-Belgium border there is almost nothing
In France it peaked 4 weeks ago, going down since then.
In Germany it increases slighly, but no more than
in other seasons.
In Netherlands it seems to stay on stable, slightly increased level.
Belgium to lead the (Central+West) European wave ?
http://www.iph.fgov.be/flu/EN/Y2009-Influenza.pdf
update week 42
ILI in Belgium continues to go up. Even gains in speed.
Especially in Brussels.
Especially the 5-17 years olds.
But on the French -Belgian border in France it is going down.
But on the German-Belgium border there is almost nothing
In France it peaked 4 weeks ago, going down since then.
In Germany it increases slighly, but no more than
in other seasons.
In Netherlands it seems to stay on stable, slightly increased level.
Belgium to lead the (Central+West) European wave ?
gsgs
Registered User
Re: Belgian charts
week 42 for whole Europe will be presumably available later today
(or tomorrow ?) here:
http://www.euroflu.org/index.php
keep watching ... and report here, as soon as week 2009/42 is available
in the box.
week 42 for whole Europe will be presumably available later today
(or tomorrow ?) here:
http://www.euroflu.org/index.php
keep watching ... and report here, as soon as week 2009/42 is available
in the box.
gsgs
Registered User
Re: Belgian charts
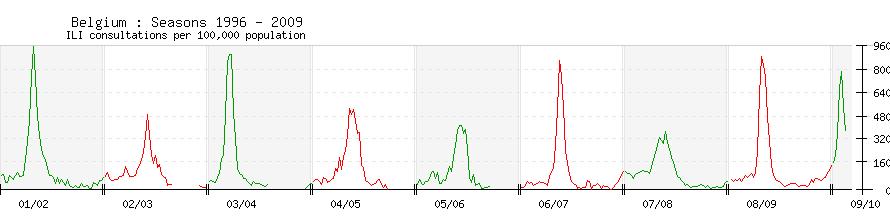
going down
that wasn't much ?!?!?
http://www.iph.fgov.be/flu/EN/Y2009-Influenza.pdf
going down
that wasn't much ?!?!?
http://www.iph.fgov.be/flu/EN/Y2009-Influenza.pdf
Attachments

gsgs
Registered User
Re: Belgian charts
these are the most extensive weekly flu reports that I have found so far.
But I can't find an archive, only one week is available.
Someone should archive these weekly reports
I was looking for Belgian deaths from all causes, they have it 2-4 weeks
delayed as compared with USA,122 cities but only back to week 49
<65:371,382,378,386,384,385,388,
65-84:896,913,961,1107,1072,1107,1069
>84:701,678,721,797,829,760,856
these are the most extensive weekly flu reports that I have found so far.
But I can't find an archive, only one week is available.
Someone should archive these weekly reports
I was looking for Belgian deaths from all causes, they have it 2-4 weeks
delayed as compared with USA,122 cities but only back to week 49
<65:371,382,378,386,384,385,388,
65-84:896,913,961,1107,1072,1107,1069
>84:701,678,721,797,829,760,856
gsgs
Registered User
Re: Belgian charts
did someone download one of these Belgian .pdf ?
unfortunately I can't find any on my HD and
they are not archived and
the actual ones are only 3 pages
they were at:
http://www.iph.fgov.be/flu/EN/Y2009-Influenza.pdf
weekly updates, ~50 pages
did someone download one of these Belgian .pdf ?
unfortunately I can't find any on my HD and
they are not archived and
the actual ones are only 3 pages
they were at:
http://www.iph.fgov.be/flu/EN/Y2009-Influenza.pdf
weekly updates, ~50 pages