 Tweet
Tweet
Transmissibility of 2009 pandemic influenza A(H1N1) in New Zealand: effective reproduction number and influence of age, ethnicity and importations (Euro Surveill., abstract, edited)
[Source: EuroSurveillance.org, (LINK). Abstract, full document, edited.]
Eurosurveillance, Volume 15, Issue 24, 17 June 2010
Surveillance and outbreak reports
Transmissibility of 2009 pandemic influenza A(H1N1) in New Zealand: effective reproduction number and influence of age, ethnicity and importations
S Paine ( )<sup>1</sup><sup>,2</sup>, G N Mercer<sup>2</sup>, P M Kelly<sup>2</sup>, D Bandaranayake<sup>1</sup>, M G Baker<sup>3</sup>, Q S Huang<sup>1</sup>, G Mackereth<sup>4</sup>, A Bissielo<sup>1</sup>, K Glass<sup>2</sup>, V Hope<sup>1</sup>
<hr>
Citation style for this article: Paine S, Mercer GN, Kelly PM, Bandaranayake D, Baker MG, Huang QS, Mackereth G, Bissielo A, Glass K, Hope V. Transmissibility of 2009 pandemic influenza A(H1N1) in New Zealand: effective reproduction number and influence of age, ethnicity and importations. Euro Surveill. 2010;15(24):pii=19591. Available online: http://www.eurosurveillance.org/View...rticleId=19591
Date of submission: 25 November 2009
<hr>
The first wave of pandemic influenza A(H1N1) has subsided in New Zealand as in other southern hemisphere countries. This study aimed to estimate the effective reproduction number (R) of 2009 pandemic influenza A(H1N1) taking into account imported cases. It also aimed to show the temporal variation of R throughout the New Zealand epidemic, changes in age- and ethnicity-specific cumulative incidence, and the effect of school holidays. Using a new modelling method to account for imported cases, we have calculated the peak R during the containment phase of the pandemic as 1.55 (95% confidence interval: 1.16 to 1.86). This value is less than previously estimated in the country early in the pandemic but in line with more recent estimates in other parts of the world. Results also indicated an increase in the proportion of notifications among school-age children after the school holiday (3?19 July 2009). This finding provides support for the potential effectiveness of timely school closures, although such disruptive interventions need to be balanced against the severity of the pandemic.
<hr>
Introduction
The Federal Government of Mexico activated its national pandemic preparedness and response plan on 24 April 2009 in response to a severe outbreak of influenza-like illness, later identified as 2009 pandemic influenza A(H1N1) [1]. It has been estimated that around 23,000 people in Mexico were already infected with the emerging virus at that time [2].
The first cases of the pandemic influenza were imported into New Zealand on 25 April 2009, with a group of students returning from a school excursion to Mexico. The arrival of the students triggered the activation of New Zealand?s influenza pandemic action plan and associated border containment measures. In the following week, on 30 April 2009, non-seasonal influenza A(H1N1) became a notifiable and quarantinable disease in the country. Evidence of community transmission was detected from the first week of June (week 23), with a rapid increase in notifications lasting until the epidemic peaked five weeks later [3]. New Zealand?s sentinel general practitioner surveillance system and non-sentinel laboratory surveillance systems demonstrated that the pandemic virus had rapidly overtaken seasonal influenza viruses, becoming the predominant circulating strain of the 2009 influenza season within four weeks of the detection of community spread [4,5].
To determine the transmissibility and spread of a disease we need to know the effective reproduction number (R), and how it evolves over the duration of the pandemic. R is the average number of secondary cases generated by a single primary case in the actual population. It is always less than the basic reproduction number, R<sub>0</sub>, which is calculated by assuming a hypothetical population with no prior immunity. If R is less than one, the disease will not persist but will manifest itself in outbreaks of varying size triggered by importations of the disease, whereas if R is greater than one there is a chance of a large outbreak. Over the course of an outbreak, R is influenced by, among other things, actions that slow the spread of the disease, such as behaviour change, social distancing [6,7] and antiviral drug use [8], as a result of interventions.
There was considerable interest in the transmission pattern of the pandemic virus during the 2009 influenza season. The R of the pandemic influenza was estimated in a variety of settings and at different stages of the 2009 pandemic. Previous estimates include: 1.4?1.6 in Mexico [2,9], 1.3?1.7 in the United States [10], 1.8?2.15 in New Zealand [11], 2.0?2.6 in Japan [12], 1.39?1.49 in Peru [13] and 2.1?2.6 (1.5?1.8 after allowing for bias in case ascertainment) in Victoria, Australia [14]. Differences in these estimates may be attributed to sampling strategies, clustering due to heterogeneous mixing amongst teenagers, family and various cultural groups, changes in the diagnostic coverage of infected individuals, using data from only very early in an outbreak or not accounting for imported cases. Different countries also had varying public health interventions for reducing the transmission of the virus including school closures, quarantine and antiviral drug prophylaxis, which may have altered the transmission of the virus in certain settings.
This study aimed to recalculate R for disease transmission throughout the pandemic in New Zealand (June?September 2009), using a new method that takes into account imported cases, and to show how R changed through the course of the 2009 winter. In response to questions posed in an earlier paper by Baker et al. [3], we also aimed to describe the age-specific and ethnicity-specific cumulative incidence during the pandemic in the country and to examine the influence of school holidays.
Methods
Surveillance data
The New Zealand influenza pandemic action plan includes five stages: plan for it, keep it out, stamp it out, manage it and recover [15]. Border management and cluster control were the main interventions after the arrival of the student group from Mexico, as part of the keep it out and stamp it out strategies of the containment phase (25 April?21 June 2009). During this phase, data were collected under an enhanced surveillance regime in which all suspected cases who presented at a general practice or hospital were tested. A suspected case during the containment phase was defined as a person with an acute respiratory illness who had developed symptoms within seven days of travel to an area where there were confirmed cases and confirmed or suspected local transmission of the virus. A change in the case report form on 10 July 2009, focusing on collection of risk factor information, meant that information on recent travel abroad was no longer requested.
Case ascertainment
Confirmed cases of pandemic influenza A(H1N1) were identified by by real-time polymerase chain reaction (PCR), viral culture or a four-fold rise in pandemic virus-specific neutralising antibodies.
To assist with ongoing surveillance and infection control responses during the change in phase from containment to management (on 22 June 2009), the case definition was updated on 19 June 2009. The suspected case category was removed and the probable category was updated from a person who met the suspected case definition and tested positive for influenza A to a person with symptoms of influenza-like illness who had strong epidemiological links to a confirmed case or a defined cluster but who lacked laboratory confirmation [16]. The definition of confirmed case remained the same.
The data for this study were extracted from EpiSurv, New Zealand?s national notifiable disease surveillance system. Where symptom onset date was not available, the earliest date of hospitalisation, death or date reported was used [11]. Onset date was available for 1,644 cases (51%); for the remaining cases with missing onset date (n=1,610), report date was used for 1,289 (80%), while date hospitalised was used for 321 (20%). A short lag period from onset date to reporting date should not affect the overall estimation of R or the trend of the temporal variation. Including the data based on the date reported or hospitalised increased the power of the modelling results, outweighing any potential risk of inaccuracy of R estimates due to the lag.
Data analysis
The winter influenza season in New Zealand usually runs from weeks 18 to 40 (in 2009: 3 May ? 4 October). In this study we analysed 3,254 pandemic influenza A(H1N1) cases reported in EpiSurv from 1 April to 1 November 2009 (weeks 17?44). Calculations of R used earliest date data from June to September 2009, while data for age- and ethnicity-specific incidence used June to August data, which encompass the highest incidence of cases at the peak of the epidemic. The change in response phase from containment to management meant that reported case numbers dropped considerably by September, so these low numbers were not included in the analysis. Data were analysed using Microsoft Excel and the numerical methods were developed using MATLAB (The Mathworks Inc.). Age-specific data from non-sentinel surveillance (EpiSurv) were compared with influenza-like illness data from the national sentinel general practitioner surveillance system [4] for trend comparison. Sentinel surveillance data are less prone to variation caused by changes in testing or response phase due to a consistent testing regime throughout the influenza season.
When calculating proportions of ethnic groups we used the New Zealand convention of prioritised ethnicity: where multiple ethnicities are recorded by individuals, Maori ethnicity takes precedence, followed by Pacific peoples, then Asian, with all remaining people included as Other or European [3]. For this study, because of small numbers, Asian people were combined with people in the Other ethnicity category. In determining the proportions of cases according to ethnicity, 2006 census population data were used as the denominator (all other proportions used mid-2008 population estimates).
Laboratory testing strategies
Laboratory testing strategies changed during the course of the pandemic. During the containment phase all suspected cases were tested to prevent transmission from imported cases to their close contacts and to contain transmission within small traceable clusters. During the management phase (22 June 2009 onwards) public health officials tried to mitigate the impact of sustained community transmission of the virus by limiting sampling to those who had been hospitalised, had severe illness or were vulnerable to severe illness [4]. Swabs collected through sentinel general practitioner surveillance continued to be tested throughout the response.
Calculating the effective reproduction number
In recent years numerous methods have been published for determining the reproduction number of a disease from incidence data [17?20]. In our study, we adapted the method of Bettencourt and Ribeiro [18] and checked our calculations using the Wallinga and Teunis method [17]. The Bettencourt and Ribeiro method uses probabilistic Bayesian inference to determine a range of R values that best suit the data at any given point in time. This method is well suited to very stochastic data such as for emerging infectious diseases [21]. Due to the Bayesian nature of the method, successive case reports improve the estimation of R as time progresses. A probability distribution for R values is obtained and so confidence intervals of the mean R value are easily calculated. None of the methods mentioned above explicitly allows for multiple importations when determining R. Early in the New Zealand outbreak there were multiple imported cases and so the methods for calculating R need to be adjusted to allow for this. A common mechanism for this is to either remove imported cases from the calculations [11,12] or ignore their status as imported cases [14]. Both of these mechanisms overestimate R. This effect has been supported by simulation results in unpublished work by Mercer et al. Here we adapt the Bettencourt and Ribeiro [18] and Wallinga and Teunis [17] methods to include the imported cases in the transmission dynamics, but only use local cases when determining R. Details of the adaption can be found in Kelly et al. [22] on community transmission of pandemic influenza in Victoria, Australia, but are outlined here for completeness. Let L(t) be the number of locally acquired cases and M(t) the number of imported cases at day t. A standard susceptible, infective, recovered (SIR) model then gives the number of locally acquired cases at time t+τ as:

where γ is the mean infectious period. Observed daily case numbers are highly variable so a probabilistic model is needed to determine the probability of the observed cases at time t+τ given the local and imported cases at time t and a given R distribution. Hence,

where P[λ] is a chosen to be a Poisson distribution as this is the most general form if only averages are known, as is the case with an SIR model. We require the distribution of R given the data and so from Bayes? theorem:
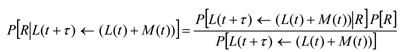
The denominator is simply a scaling factor and need not be calculated. P[R] is the prior probability distribution of R, which reflects earlier calculated values of R. Initially P[R] is chosen to be an uninformative uniform distribution. The last above equation is iterated to obtain progressively better estimates for the probability distribution of R as time progresses and more data become available.
To calculate R values an estimate of the serial interval is needed. In this model, the serial interval is defined as the time between the onset of symptoms in case A to the onset of symptoms in case B, given that case A infects case B. Here we use the early New Zealand data of a mean serial interval of 2.8 days [11]. This is consistent with values used by other models ranging from 1.9 days [2] to 2.8 days [11?14] and 3.2 days [10].
Results
Descriptive epidemiology
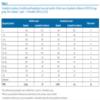
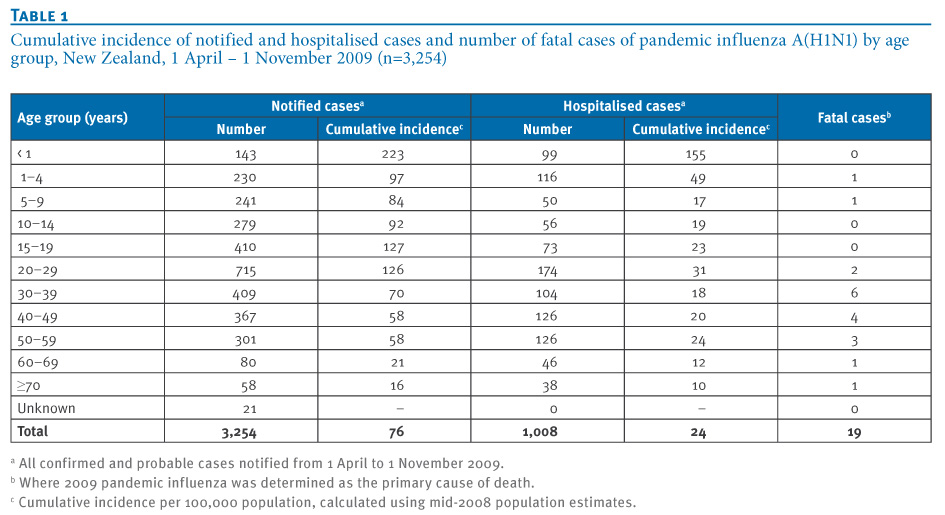
A total of 3,254 cases of pandemic influenza A(H1N1) were notified in New Zealand from 1 April to 1 November 2009. Of these, 97.9% (n=3,186) met the confirmed case definition, with 2.1% (n=68) meeting the probable case definition. Known imported cases accounted for 2% (n=64). The highest notification rates were reported from the under one-year-old age group (223.2 per 100,000 population) followed by young adults 15 to 19 years (127.1 per 100,000 population) and 20 to 29 years (125.5 per 100,000 population) (Table 1). Of the total number of cases notified, 1,008 (31%) were hospitalised, with the highest rates reported in infants and preschool children (under 5 years) followed by young adults. Pandemic influenza A(H1N1) was identified as the primary cause of death in 19 cases; six of these were 30?39-year-olds (Table 1).
Table 1. Cumulative incidence of notified and hospitalised cases and number of fatal cases of pandemic influenza A(H1N1) by age group, New Zealand, 1 April ? 1 November 2009 (n=3,254)
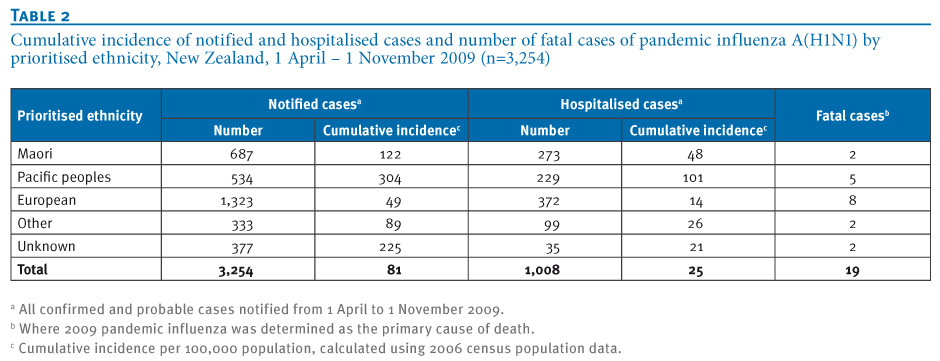
The highest rates of notifications and hospitalisations were reported in Pacific peoples, with rates that were more than double those of other ethnic groups (Table 2).
Table 2. Cumulative incidence of notified and hospitalised cases and number of fatal cases of pandemic influenza A(H1N1) by prioritised ethnicity, New Zealand, 1 April ? 1 November 2009 (n=3,254)
Epidemic curve and transmissibility of the pandemic virus
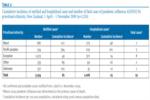
Figure 1 shows the temporal distribution of New Zealand?s known imported cases and notifications of confirmed cases assumed to be autochthonous, by earliest date. The first observed non-imported cases experienced symptoms of illness in the first week in June 2009. Community transmission was detected by surveillance systems in the second week of June; notifications accelerated during June, reaching the peak of the epidemic in the second week of July (week 28).
Figure 1. Confirmed and probable autochthonous and imported cases of pandemic influenza A(H1N1),New Zealand, 1 April ? 1 November 2009 (n=3,254)<sup>ab
</sup>
The calculated R values and 95% confidence interval are shown in Figure 2. Also shown are calculated R values when the imported cases are either removed from the data or their imported status is ignored: both methods give a higher estimate than the true R value. The decline and then rise of R around 22 June 2009 is due to the reduced testing regime as a result of the change in phase from containment to management. Due to the short serial interval of influenza, these types of dramatic changes in ascertainment only impact on the calculated R value for a few days. The drop in R below one coincides with the peak of the epidemic in the week ending 12 July 2009 and remains consistently below one for the remainder of the 2009 winter influenza season.
Figure 2. Effective reproduction number (R) calculated from confirmed and probable pandemic influenza A(H1N1) cases, New Zealand, 6 June ? 1 September 2009 (n=3,197)<sup>a</sup>
Distribution by age group over time and effect of school holidays
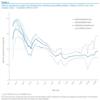
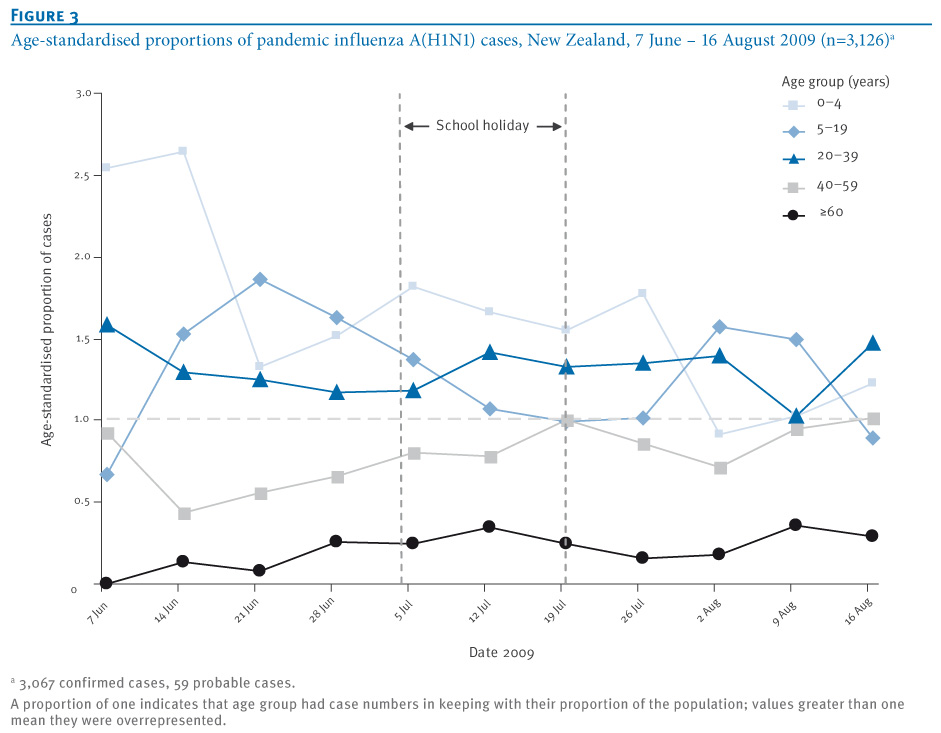
Figure 3 shows the age-standardised proportions of cases as the outbreak progressed through the New Zealand 2009 winter. A proportion of one indicates that age group had case numbers in keeping with their proportion of the population; values greater than one mean they were overrepresented. Changes in these proportions indicate changing transmission dynamics in the population.
The proportion of school-age children (5?19 years) among the cases rose sharply in the early stages of observed community transmission during the school term before declining, probably due to the reduced testing regime as a result of the change to management phase. The decline continued into the school holiday period but was followed by a marked increase a week after most schools resumed. The 2009 winter school holiday lasted from Saturday 4 July to Sunday 19 July (weeks 28 and 29), with the exception of some private schools for which it continued until Sunday 26 July [23]. A similar pattern was seen in children aged under five years, with a slight decline in proportion during the school holiday, followed by an increase starting a week earlier than with the school-age children. The increase then dropped off around 26 July, when the proportion of school-age children increased. People under 40 years old were overrepresented proportionally throughout the epidemic; those aged 40 years and over were underrepresented.
Figure 3. Age-standardised proportions of pandemic influenza A(H1N1) cases, New Zealand, 7 June ? 16 August 2009 (n=3,126)<sup>a</sup>

Distribution by ethnicity over time and transmission dynamics
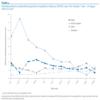
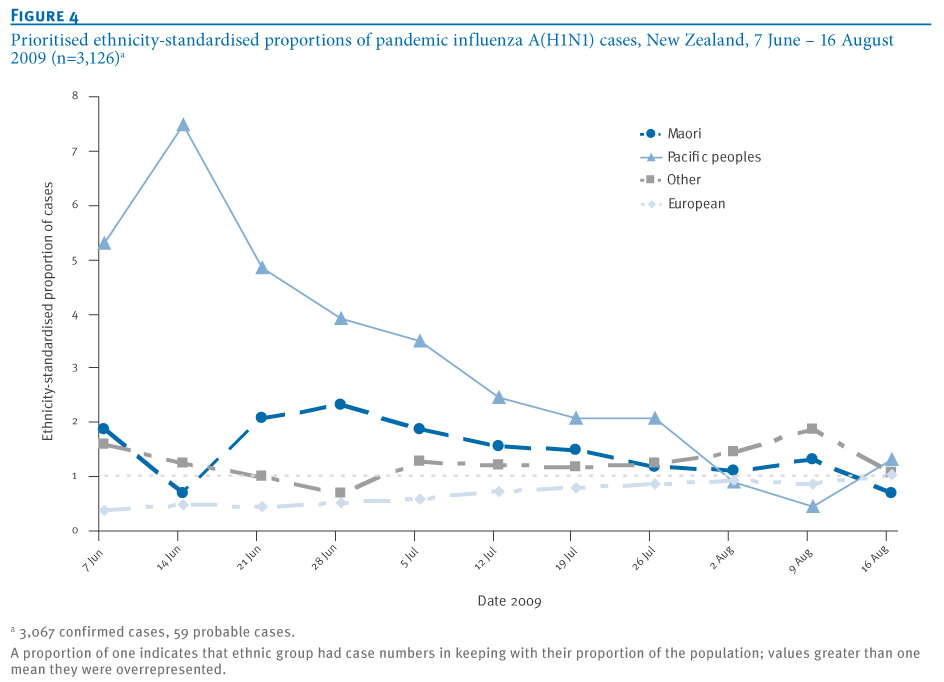
Early clustering of cases occurred in Pacific peoples: the proportion of notifications for this ethnic group was consistently high in the first few weeks of community transmission (Figure 4). The number of Maori cases increased in the last two weeks of June 2009. These increases, together with the early clustering in young children, are likely to have contributed to earlier higher estimates of R in New Zealand. By the later stages of the epidemic, towards the end of July, all ethnic groups were equally represented.
Figure 4. Prioritised ethnicity proportions of pandemic influenza A(H1N1), cases in New Zealand, 7 June ? 16 August 2009 (n=3,126)<sup>a
</sup>
Discussion
In this study, we found that the peak R was lower than previously calculated early in the New Zealand epidemic. There is also evidence of the seeding of pandemic influenza A(H1N1) cases from Australia in the weeks leading up to the detection of community transmission. When a pandemic of an emerging infectious disease arises, it can be considered advantageous to be isolated geographically from the threat. New Zealand, with its natural oceanic borders, has a high level of geographical isolation. The most likely way in which a new influenza virus could be introduced is the arrival of infected air travellers who are not detected by screening at the border [24]. Recent pandemic influenza activity highlights the susceptibility of New Zealand?s population to incursion of a novel transmissible disease.
Short-term travel between Australia and New Zealand is increasingly common, with more than one million visitors arriving from Australia annually. In the month of June 2009, 298,267 people arrived by air from all countries including Australia into New Zealand [25,26], providing multiple opportunities for infectious travellers to arrive in the country undetected. Auckland, Wellington and Christchurch regions all have international airports that service flights between Australia and New Zealand: unsurprisingly these were the first regions to experience an observed escalation in community transmission. Early clustering in Pacific peoples? community was believed to have been seeded by a member of their community returning to Christchurch from Melbourne, Australia, with the virus in early June [27].
Australia?s first observed community-acquired case of the pandemic virus had an onset of symptoms on 16 May 2009 and was reported in Victoria, although there is evidence to suggest that unobserved transmission was occurring in Australia before that time [14]. By 4 June the state of Victoria had reported a total of 977 confirmed cases of pandemic influenza to the Victorian Department of Health [28]. At that time, New Zealand?s confirmed cases had been imported although unobserved transmission had begun; observed cases of community transmission appear to have been established by the second week of June.
Young children and Pacific peoples contributed disproportionately to early propagation of the pandemic in the country. It is possible that the school holidays were associated with a lowering of the age-specific incidence rate in school-age children. All schools had resumed classes by 27 July 2009, which coincided with an increase in notifications lasting around a week before declining in August as the epidemic tailed off. The increase in confirmed cases among young children could suggest an increased risk of exposure to the virus through infected older siblings or that this age group is more likely to be presented at their general practice for consultation. Data from the sentinel general practice surveillance system were consistent with the proportions from the notification data. Proportions of cases seen in the over 60-year-old age group were consistently much lower than expected. The high proportions in the younger age distributions are consistent with a lack of pre-existing antibodies to the pandemic virus in children and young adults. Recent studies suggest older adults (over 60 years) have some degree of preexisting immunity and this may have contributed to lower numbers in this age group [29].
When importations are removed our method is in agreement with the early results from New Zealand of R=1.96 [11]. Early in the outbreak our adjusted R value was 1.55 (95% confidence interval: 1.16 to 1.86). As the epidemic progressed the calculated R value declined to around 1.0 (95% confidence interval: 0.83 to 1.25) until the management phase was implemented on 22 June 2009. This change in phase impacted on the case ascertainment, probably affecting the adjusted value of R. An increase in R in late June to around 1.25 (95% confidence interval: 1.08 to 1.37) is consistent with ongoing work on Australian data (unpublished) but is on the lower end of other estimations [9,13].
The reduction in R below one around 12 July 2009 coincided with reduced testing after implementation of the management phase. Public health measures in place at the time and other factors such as voluntary social distancing may have also contributed to the reduction in transmission of the virus.
Other countries have reported high transmission rates in schools that have contributed to high measures of R [12,14]. In New Zealand the highest numbers and rates were reported in the under one-year-old and 15?29-year-old age groups, indicating that there were high levels of transmission occurring outside school settings. Reasons for this may relate to the communities that were initially affected. Heterogeneous mixing of imported cases into susceptible populations who interact in close proximity ? such as cultural and religious communities and people in childcare centres, work places and schools ? could have contributed to case clustering and rapid transmission of the virus within those groups.
Limitations and need for further research
Complete ascertainment of imported cases was not possible during the pandemic as travel information was only collected during the containment phase during an active surveillance period. A change in the case report form on 10 July 2009 meant the question was no longer asked.
There are difficulties in comparing values of R from this study with those from other countries as differences in generation time and modelling methodologies vary across studies. Methods for modelling pandemic influenza are evolving rapidly. Our analysis suggests it is important to consider imported cases, particularly in the early stages of an epidemic. Consequently, surveillance systems should attempt to record such status on all cases at least until local transmission is dominant.
The data collected before the management phase commenced were influenced by case clustering in Pacific peoples, which could have overestimated the community-wide R value. Calculations towards the end of August 2009 are less reliable as low numbers of cases were reported.
Conclusions
Using a new modelling method to account for imported cases, we have calculated the peak R during the growth phase of the pandemic as 1.55 (95% CI: 1.16 to 1.86). This value was less than previously estimated for New Zealand early in the pandemic but is in line with more recent estimates in other parts of the world.
An increase in the proportion of notifications among school-age children could be associated with the children returning to school after the July holiday. Although this relationship should be analysed further, this preliminary evidence could support the effectiveness of timely school or selected classroom closures as a potential public health intervention for future influenza pandemics. It should be noted that it is likely that it was the importation of the virus through infected travellers from abroad that fuelled the influenza A(H1N1) pandemic early in the 2009 New Zealand winter. Future resources might be better focused on containing the spread of infection caused through exposure to infected travellers returning to or arriving in New Zealand, in particular, through early case and cluster detection, effective contract tracing systems and the timely use of prophylaxis.
The overrepresentation of Pacific peoples and to a lesser extent people of Maori ethnicity was observed during the containment phase and was probably due to case clustering, The high proportions initially observed in these groups decreased towards the end of July 2009 when all ethnic groups were more evenly represented.
Descriptive epidemiology and modelling are useful for understanding how a novel pandemic influenza virus affects a newly exposed population. They can help measure how successful public health interventions have been in mitigating the severity of the pandemic and estimate the potential effectiveness of interventions before they are implemented. Northern hemisphere countries yet to experience the peak of their 2009?10 winter influenza season can benefit from lessons learnt in the south. During a pandemic of moderate severity, where most infected individuals experience self-limiting illness, governments could consider public health actions that target groups most at risk of infection and that cause the least disruption to society. Applying mitigating measures of limited benefit that have a disruptive effect on society, such as reactive school closures in a relatively moderate pandemic, should be carefully scrutinised before being implemented.
Acknowledgements
We wish to acknowledge the surveillance, clinical, laboratory and support staff who contributed to the collection of the data represented here. In particular, the Population and Environmental Health group at the Institute of Environmental Science and Research, New Zealand, and Niels Becker at the National Centre for Epidemiology and Population Health, Australian National University. The model development used for this study was partially funded by an Australian National Health and Medical Research Council Capacity Building Grant. PMK also receives part salary support from National Health and Medical Research Council. The authors also wish to thank the Institute of Environmental Health, the New Zealand Ministry of Health and the Australian Government for funding the Masters of Applied Epidemiology programme.
<hr>
References
-
-------
[Source: EuroSurveillance.org, (LINK). Abstract, full document, edited.]
Eurosurveillance, Volume 15, Issue 24, 17 June 2010
Surveillance and outbreak reports
Transmissibility of 2009 pandemic influenza A(H1N1) in New Zealand: effective reproduction number and influence of age, ethnicity and importations
S Paine (
- Institute of Environmental Science and Research (ESR), National Centre for Biosecurity and Infectious Disease, Wallaceville, New Zealand
- National Centre for Epidemiology and Population Health, College of Medicine, Biology and Environment, The Australian National University, Canberra, Australia
- University of Otago, Wellington, New Zealand
- Investigation and Diagnostic Centre, Biosecurity New Zealand, Wallaceville, New Zealand
<hr>
Citation style for this article: Paine S, Mercer GN, Kelly PM, Bandaranayake D, Baker MG, Huang QS, Mackereth G, Bissielo A, Glass K, Hope V. Transmissibility of 2009 pandemic influenza A(H1N1) in New Zealand: effective reproduction number and influence of age, ethnicity and importations. Euro Surveill. 2010;15(24):pii=19591. Available online: http://www.eurosurveillance.org/View...rticleId=19591
Date of submission: 25 November 2009
<hr>
The first wave of pandemic influenza A(H1N1) has subsided in New Zealand as in other southern hemisphere countries. This study aimed to estimate the effective reproduction number (R) of 2009 pandemic influenza A(H1N1) taking into account imported cases. It also aimed to show the temporal variation of R throughout the New Zealand epidemic, changes in age- and ethnicity-specific cumulative incidence, and the effect of school holidays. Using a new modelling method to account for imported cases, we have calculated the peak R during the containment phase of the pandemic as 1.55 (95% confidence interval: 1.16 to 1.86). This value is less than previously estimated in the country early in the pandemic but in line with more recent estimates in other parts of the world. Results also indicated an increase in the proportion of notifications among school-age children after the school holiday (3?19 July 2009). This finding provides support for the potential effectiveness of timely school closures, although such disruptive interventions need to be balanced against the severity of the pandemic.
<hr>
Introduction
The Federal Government of Mexico activated its national pandemic preparedness and response plan on 24 April 2009 in response to a severe outbreak of influenza-like illness, later identified as 2009 pandemic influenza A(H1N1) [1]. It has been estimated that around 23,000 people in Mexico were already infected with the emerging virus at that time [2].
The first cases of the pandemic influenza were imported into New Zealand on 25 April 2009, with a group of students returning from a school excursion to Mexico. The arrival of the students triggered the activation of New Zealand?s influenza pandemic action plan and associated border containment measures. In the following week, on 30 April 2009, non-seasonal influenza A(H1N1) became a notifiable and quarantinable disease in the country. Evidence of community transmission was detected from the first week of June (week 23), with a rapid increase in notifications lasting until the epidemic peaked five weeks later [3]. New Zealand?s sentinel general practitioner surveillance system and non-sentinel laboratory surveillance systems demonstrated that the pandemic virus had rapidly overtaken seasonal influenza viruses, becoming the predominant circulating strain of the 2009 influenza season within four weeks of the detection of community spread [4,5].
To determine the transmissibility and spread of a disease we need to know the effective reproduction number (R), and how it evolves over the duration of the pandemic. R is the average number of secondary cases generated by a single primary case in the actual population. It is always less than the basic reproduction number, R<sub>0</sub>, which is calculated by assuming a hypothetical population with no prior immunity. If R is less than one, the disease will not persist but will manifest itself in outbreaks of varying size triggered by importations of the disease, whereas if R is greater than one there is a chance of a large outbreak. Over the course of an outbreak, R is influenced by, among other things, actions that slow the spread of the disease, such as behaviour change, social distancing [6,7] and antiviral drug use [8], as a result of interventions.
There was considerable interest in the transmission pattern of the pandemic virus during the 2009 influenza season. The R of the pandemic influenza was estimated in a variety of settings and at different stages of the 2009 pandemic. Previous estimates include: 1.4?1.6 in Mexico [2,9], 1.3?1.7 in the United States [10], 1.8?2.15 in New Zealand [11], 2.0?2.6 in Japan [12], 1.39?1.49 in Peru [13] and 2.1?2.6 (1.5?1.8 after allowing for bias in case ascertainment) in Victoria, Australia [14]. Differences in these estimates may be attributed to sampling strategies, clustering due to heterogeneous mixing amongst teenagers, family and various cultural groups, changes in the diagnostic coverage of infected individuals, using data from only very early in an outbreak or not accounting for imported cases. Different countries also had varying public health interventions for reducing the transmission of the virus including school closures, quarantine and antiviral drug prophylaxis, which may have altered the transmission of the virus in certain settings.
This study aimed to recalculate R for disease transmission throughout the pandemic in New Zealand (June?September 2009), using a new method that takes into account imported cases, and to show how R changed through the course of the 2009 winter. In response to questions posed in an earlier paper by Baker et al. [3], we also aimed to describe the age-specific and ethnicity-specific cumulative incidence during the pandemic in the country and to examine the influence of school holidays.
Methods
Surveillance data
The New Zealand influenza pandemic action plan includes five stages: plan for it, keep it out, stamp it out, manage it and recover [15]. Border management and cluster control were the main interventions after the arrival of the student group from Mexico, as part of the keep it out and stamp it out strategies of the containment phase (25 April?21 June 2009). During this phase, data were collected under an enhanced surveillance regime in which all suspected cases who presented at a general practice or hospital were tested. A suspected case during the containment phase was defined as a person with an acute respiratory illness who had developed symptoms within seven days of travel to an area where there were confirmed cases and confirmed or suspected local transmission of the virus. A change in the case report form on 10 July 2009, focusing on collection of risk factor information, meant that information on recent travel abroad was no longer requested.
Case ascertainment
Confirmed cases of pandemic influenza A(H1N1) were identified by by real-time polymerase chain reaction (PCR), viral culture or a four-fold rise in pandemic virus-specific neutralising antibodies.
To assist with ongoing surveillance and infection control responses during the change in phase from containment to management (on 22 June 2009), the case definition was updated on 19 June 2009. The suspected case category was removed and the probable category was updated from a person who met the suspected case definition and tested positive for influenza A to a person with symptoms of influenza-like illness who had strong epidemiological links to a confirmed case or a defined cluster but who lacked laboratory confirmation [16]. The definition of confirmed case remained the same.
The data for this study were extracted from EpiSurv, New Zealand?s national notifiable disease surveillance system. Where symptom onset date was not available, the earliest date of hospitalisation, death or date reported was used [11]. Onset date was available for 1,644 cases (51%); for the remaining cases with missing onset date (n=1,610), report date was used for 1,289 (80%), while date hospitalised was used for 321 (20%). A short lag period from onset date to reporting date should not affect the overall estimation of R or the trend of the temporal variation. Including the data based on the date reported or hospitalised increased the power of the modelling results, outweighing any potential risk of inaccuracy of R estimates due to the lag.
Data analysis
The winter influenza season in New Zealand usually runs from weeks 18 to 40 (in 2009: 3 May ? 4 October). In this study we analysed 3,254 pandemic influenza A(H1N1) cases reported in EpiSurv from 1 April to 1 November 2009 (weeks 17?44). Calculations of R used earliest date data from June to September 2009, while data for age- and ethnicity-specific incidence used June to August data, which encompass the highest incidence of cases at the peak of the epidemic. The change in response phase from containment to management meant that reported case numbers dropped considerably by September, so these low numbers were not included in the analysis. Data were analysed using Microsoft Excel and the numerical methods were developed using MATLAB (The Mathworks Inc.). Age-specific data from non-sentinel surveillance (EpiSurv) were compared with influenza-like illness data from the national sentinel general practitioner surveillance system [4] for trend comparison. Sentinel surveillance data are less prone to variation caused by changes in testing or response phase due to a consistent testing regime throughout the influenza season.
When calculating proportions of ethnic groups we used the New Zealand convention of prioritised ethnicity: where multiple ethnicities are recorded by individuals, Maori ethnicity takes precedence, followed by Pacific peoples, then Asian, with all remaining people included as Other or European [3]. For this study, because of small numbers, Asian people were combined with people in the Other ethnicity category. In determining the proportions of cases according to ethnicity, 2006 census population data were used as the denominator (all other proportions used mid-2008 population estimates).
Laboratory testing strategies
Laboratory testing strategies changed during the course of the pandemic. During the containment phase all suspected cases were tested to prevent transmission from imported cases to their close contacts and to contain transmission within small traceable clusters. During the management phase (22 June 2009 onwards) public health officials tried to mitigate the impact of sustained community transmission of the virus by limiting sampling to those who had been hospitalised, had severe illness or were vulnerable to severe illness [4]. Swabs collected through sentinel general practitioner surveillance continued to be tested throughout the response.
Calculating the effective reproduction number
In recent years numerous methods have been published for determining the reproduction number of a disease from incidence data [17?20]. In our study, we adapted the method of Bettencourt and Ribeiro [18] and checked our calculations using the Wallinga and Teunis method [17]. The Bettencourt and Ribeiro method uses probabilistic Bayesian inference to determine a range of R values that best suit the data at any given point in time. This method is well suited to very stochastic data such as for emerging infectious diseases [21]. Due to the Bayesian nature of the method, successive case reports improve the estimation of R as time progresses. A probability distribution for R values is obtained and so confidence intervals of the mean R value are easily calculated. None of the methods mentioned above explicitly allows for multiple importations when determining R. Early in the New Zealand outbreak there were multiple imported cases and so the methods for calculating R need to be adjusted to allow for this. A common mechanism for this is to either remove imported cases from the calculations [11,12] or ignore their status as imported cases [14]. Both of these mechanisms overestimate R. This effect has been supported by simulation results in unpublished work by Mercer et al. Here we adapt the Bettencourt and Ribeiro [18] and Wallinga and Teunis [17] methods to include the imported cases in the transmission dynamics, but only use local cases when determining R. Details of the adaption can be found in Kelly et al. [22] on community transmission of pandemic influenza in Victoria, Australia, but are outlined here for completeness. Let L(t) be the number of locally acquired cases and M(t) the number of imported cases at day t. A standard susceptible, infective, recovered (SIR) model then gives the number of locally acquired cases at time t+τ as:
where γ is the mean infectious period. Observed daily case numbers are highly variable so a probabilistic model is needed to determine the probability of the observed cases at time t+τ given the local and imported cases at time t and a given R distribution. Hence,
where P[λ] is a chosen to be a Poisson distribution as this is the most general form if only averages are known, as is the case with an SIR model. We require the distribution of R given the data and so from Bayes? theorem:
The denominator is simply a scaling factor and need not be calculated. P[R] is the prior probability distribution of R, which reflects earlier calculated values of R. Initially P[R] is chosen to be an uninformative uniform distribution. The last above equation is iterated to obtain progressively better estimates for the probability distribution of R as time progresses and more data become available.
To calculate R values an estimate of the serial interval is needed. In this model, the serial interval is defined as the time between the onset of symptoms in case A to the onset of symptoms in case B, given that case A infects case B. Here we use the early New Zealand data of a mean serial interval of 2.8 days [11]. This is consistent with values used by other models ranging from 1.9 days [2] to 2.8 days [11?14] and 3.2 days [10].
Results
Descriptive epidemiology
A total of 3,254 cases of pandemic influenza A(H1N1) were notified in New Zealand from 1 April to 1 November 2009. Of these, 97.9% (n=3,186) met the confirmed case definition, with 2.1% (n=68) meeting the probable case definition. Known imported cases accounted for 2% (n=64). The highest notification rates were reported from the under one-year-old age group (223.2 per 100,000 population) followed by young adults 15 to 19 years (127.1 per 100,000 population) and 20 to 29 years (125.5 per 100,000 population) (Table 1). Of the total number of cases notified, 1,008 (31%) were hospitalised, with the highest rates reported in infants and preschool children (under 5 years) followed by young adults. Pandemic influenza A(H1N1) was identified as the primary cause of death in 19 cases; six of these were 30?39-year-olds (Table 1).
Table 1. Cumulative incidence of notified and hospitalised cases and number of fatal cases of pandemic influenza A(H1N1) by age group, New Zealand, 1 April ? 1 November 2009 (n=3,254)
The highest rates of notifications and hospitalisations were reported in Pacific peoples, with rates that were more than double those of other ethnic groups (Table 2).
Table 2. Cumulative incidence of notified and hospitalised cases and number of fatal cases of pandemic influenza A(H1N1) by prioritised ethnicity, New Zealand, 1 April ? 1 November 2009 (n=3,254)
Epidemic curve and transmissibility of the pandemic virus
Figure 1 shows the temporal distribution of New Zealand?s known imported cases and notifications of confirmed cases assumed to be autochthonous, by earliest date. The first observed non-imported cases experienced symptoms of illness in the first week in June 2009. Community transmission was detected by surveillance systems in the second week of June; notifications accelerated during June, reaching the peak of the epidemic in the second week of July (week 28).
Figure 1. Confirmed and probable autochthonous and imported cases of pandemic influenza A(H1N1),New Zealand, 1 April ? 1 November 2009 (n=3,254)<sup>ab

</sup>
The calculated R values and 95% confidence interval are shown in Figure 2. Also shown are calculated R values when the imported cases are either removed from the data or their imported status is ignored: both methods give a higher estimate than the true R value. The decline and then rise of R around 22 June 2009 is due to the reduced testing regime as a result of the change in phase from containment to management. Due to the short serial interval of influenza, these types of dramatic changes in ascertainment only impact on the calculated R value for a few days. The drop in R below one coincides with the peak of the epidemic in the week ending 12 July 2009 and remains consistently below one for the remainder of the 2009 winter influenza season.
Figure 2. Effective reproduction number (R) calculated from confirmed and probable pandemic influenza A(H1N1) cases, New Zealand, 6 June ? 1 September 2009 (n=3,197)<sup>a</sup>

Distribution by age group over time and effect of school holidays
Figure 3 shows the age-standardised proportions of cases as the outbreak progressed through the New Zealand 2009 winter. A proportion of one indicates that age group had case numbers in keeping with their proportion of the population; values greater than one mean they were overrepresented. Changes in these proportions indicate changing transmission dynamics in the population.
The proportion of school-age children (5?19 years) among the cases rose sharply in the early stages of observed community transmission during the school term before declining, probably due to the reduced testing regime as a result of the change to management phase. The decline continued into the school holiday period but was followed by a marked increase a week after most schools resumed. The 2009 winter school holiday lasted from Saturday 4 July to Sunday 19 July (weeks 28 and 29), with the exception of some private schools for which it continued until Sunday 26 July [23]. A similar pattern was seen in children aged under five years, with a slight decline in proportion during the school holiday, followed by an increase starting a week earlier than with the school-age children. The increase then dropped off around 26 July, when the proportion of school-age children increased. People under 40 years old were overrepresented proportionally throughout the epidemic; those aged 40 years and over were underrepresented.
Figure 3. Age-standardised proportions of pandemic influenza A(H1N1) cases, New Zealand, 7 June ? 16 August 2009 (n=3,126)<sup>a</sup>
Distribution by ethnicity over time and transmission dynamics
Early clustering of cases occurred in Pacific peoples: the proportion of notifications for this ethnic group was consistently high in the first few weeks of community transmission (Figure 4). The number of Maori cases increased in the last two weeks of June 2009. These increases, together with the early clustering in young children, are likely to have contributed to earlier higher estimates of R in New Zealand. By the later stages of the epidemic, towards the end of July, all ethnic groups were equally represented.
Figure 4. Prioritised ethnicity proportions of pandemic influenza A(H1N1), cases in New Zealand, 7 June ? 16 August 2009 (n=3,126)<sup>a
</sup>
Discussion
In this study, we found that the peak R was lower than previously calculated early in the New Zealand epidemic. There is also evidence of the seeding of pandemic influenza A(H1N1) cases from Australia in the weeks leading up to the detection of community transmission. When a pandemic of an emerging infectious disease arises, it can be considered advantageous to be isolated geographically from the threat. New Zealand, with its natural oceanic borders, has a high level of geographical isolation. The most likely way in which a new influenza virus could be introduced is the arrival of infected air travellers who are not detected by screening at the border [24]. Recent pandemic influenza activity highlights the susceptibility of New Zealand?s population to incursion of a novel transmissible disease.
Short-term travel between Australia and New Zealand is increasingly common, with more than one million visitors arriving from Australia annually. In the month of June 2009, 298,267 people arrived by air from all countries including Australia into New Zealand [25,26], providing multiple opportunities for infectious travellers to arrive in the country undetected. Auckland, Wellington and Christchurch regions all have international airports that service flights between Australia and New Zealand: unsurprisingly these were the first regions to experience an observed escalation in community transmission. Early clustering in Pacific peoples? community was believed to have been seeded by a member of their community returning to Christchurch from Melbourne, Australia, with the virus in early June [27].
Australia?s first observed community-acquired case of the pandemic virus had an onset of symptoms on 16 May 2009 and was reported in Victoria, although there is evidence to suggest that unobserved transmission was occurring in Australia before that time [14]. By 4 June the state of Victoria had reported a total of 977 confirmed cases of pandemic influenza to the Victorian Department of Health [28]. At that time, New Zealand?s confirmed cases had been imported although unobserved transmission had begun; observed cases of community transmission appear to have been established by the second week of June.
Young children and Pacific peoples contributed disproportionately to early propagation of the pandemic in the country. It is possible that the school holidays were associated with a lowering of the age-specific incidence rate in school-age children. All schools had resumed classes by 27 July 2009, which coincided with an increase in notifications lasting around a week before declining in August as the epidemic tailed off. The increase in confirmed cases among young children could suggest an increased risk of exposure to the virus through infected older siblings or that this age group is more likely to be presented at their general practice for consultation. Data from the sentinel general practice surveillance system were consistent with the proportions from the notification data. Proportions of cases seen in the over 60-year-old age group were consistently much lower than expected. The high proportions in the younger age distributions are consistent with a lack of pre-existing antibodies to the pandemic virus in children and young adults. Recent studies suggest older adults (over 60 years) have some degree of preexisting immunity and this may have contributed to lower numbers in this age group [29].
When importations are removed our method is in agreement with the early results from New Zealand of R=1.96 [11]. Early in the outbreak our adjusted R value was 1.55 (95% confidence interval: 1.16 to 1.86). As the epidemic progressed the calculated R value declined to around 1.0 (95% confidence interval: 0.83 to 1.25) until the management phase was implemented on 22 June 2009. This change in phase impacted on the case ascertainment, probably affecting the adjusted value of R. An increase in R in late June to around 1.25 (95% confidence interval: 1.08 to 1.37) is consistent with ongoing work on Australian data (unpublished) but is on the lower end of other estimations [9,13].
The reduction in R below one around 12 July 2009 coincided with reduced testing after implementation of the management phase. Public health measures in place at the time and other factors such as voluntary social distancing may have also contributed to the reduction in transmission of the virus.
Other countries have reported high transmission rates in schools that have contributed to high measures of R [12,14]. In New Zealand the highest numbers and rates were reported in the under one-year-old and 15?29-year-old age groups, indicating that there were high levels of transmission occurring outside school settings. Reasons for this may relate to the communities that were initially affected. Heterogeneous mixing of imported cases into susceptible populations who interact in close proximity ? such as cultural and religious communities and people in childcare centres, work places and schools ? could have contributed to case clustering and rapid transmission of the virus within those groups.
Limitations and need for further research
Complete ascertainment of imported cases was not possible during the pandemic as travel information was only collected during the containment phase during an active surveillance period. A change in the case report form on 10 July 2009 meant the question was no longer asked.
There are difficulties in comparing values of R from this study with those from other countries as differences in generation time and modelling methodologies vary across studies. Methods for modelling pandemic influenza are evolving rapidly. Our analysis suggests it is important to consider imported cases, particularly in the early stages of an epidemic. Consequently, surveillance systems should attempt to record such status on all cases at least until local transmission is dominant.
The data collected before the management phase commenced were influenced by case clustering in Pacific peoples, which could have overestimated the community-wide R value. Calculations towards the end of August 2009 are less reliable as low numbers of cases were reported.
Conclusions
Using a new modelling method to account for imported cases, we have calculated the peak R during the growth phase of the pandemic as 1.55 (95% CI: 1.16 to 1.86). This value was less than previously estimated for New Zealand early in the pandemic but is in line with more recent estimates in other parts of the world.
An increase in the proportion of notifications among school-age children could be associated with the children returning to school after the July holiday. Although this relationship should be analysed further, this preliminary evidence could support the effectiveness of timely school or selected classroom closures as a potential public health intervention for future influenza pandemics. It should be noted that it is likely that it was the importation of the virus through infected travellers from abroad that fuelled the influenza A(H1N1) pandemic early in the 2009 New Zealand winter. Future resources might be better focused on containing the spread of infection caused through exposure to infected travellers returning to or arriving in New Zealand, in particular, through early case and cluster detection, effective contract tracing systems and the timely use of prophylaxis.
The overrepresentation of Pacific peoples and to a lesser extent people of Maori ethnicity was observed during the containment phase and was probably due to case clustering, The high proportions initially observed in these groups decreased towards the end of July 2009 when all ethnic groups were more evenly represented.
Descriptive epidemiology and modelling are useful for understanding how a novel pandemic influenza virus affects a newly exposed population. They can help measure how successful public health interventions have been in mitigating the severity of the pandemic and estimate the potential effectiveness of interventions before they are implemented. Northern hemisphere countries yet to experience the peak of their 2009?10 winter influenza season can benefit from lessons learnt in the south. During a pandemic of moderate severity, where most infected individuals experience self-limiting illness, governments could consider public health actions that target groups most at risk of infection and that cause the least disruption to society. Applying mitigating measures of limited benefit that have a disruptive effect on society, such as reactive school closures in a relatively moderate pandemic, should be carefully scrutinised before being implemented.
Acknowledgements
We wish to acknowledge the surveillance, clinical, laboratory and support staff who contributed to the collection of the data represented here. In particular, the Population and Environmental Health group at the Institute of Environmental Science and Research, New Zealand, and Niels Becker at the National Centre for Epidemiology and Population Health, Australian National University. The model development used for this study was partially funded by an Australian National Health and Medical Research Council Capacity Building Grant. PMK also receives part salary support from National Health and Medical Research Council. The authors also wish to thank the Institute of Environmental Health, the New Zealand Ministry of Health and the Australian Government for funding the Masters of Applied Epidemiology programme.
<hr>
References
- Centers for Disease Control and Prevention (CDC). Update: novel influenza A (H1N1) virus infection - Mexico, March-May, 2009. MMWR Morb Mortal Wkly Rep. 2009;58(21):585-9. Available from: http://www.cdc.gov/mmwr/preview/mmwrhtml/mm5821a2.htm
- Fraser C, et al. Pandemic potential of a strain of influenza A (H1N1): early findings. Science. 2009;324(5934):1557-61.
- Baker MG, Wilson N, Huang QS, Paine S, Lopez L, Bandaranayake D, et al. Pandemic influenza A(H1N1)v in New Zealand: the experience from April to August 2009. Euro Surveill. 2009;14(34). pii: 19319. Available from: http://www.eurosurveillance.org/View...rticleId=19319
- Centers for Disease Control and Prevention (CDC). Surveillance for the 2009 pandemic influenza A (H1N1) virus and seasonal influenza viruses - New Zealand, 2009. MMWR Morb Mortal Wkly Rep. 2009;58(33):918-21. Available from: http://www.cdc.gov/mmwr/preview/mmwrhtml/mm5833a2.htm
- Institute of Environmental Science and Research (ESR). Influenza weekly update 2009/46: 9-15 November 2009. Porirua: Institute of Environmental Science and Research, ESR Kenepuru Science Centre; 2009. Available from: http://www.surv.esr.cri.nz/PDF_surve...kRpt200946.pdf
- Caley P, Philp DJ, McCracken K. Quantifying social distancing arising from pandemic influenza. J R Soc Interface. 2008;5(23):631-9.
- Cauchemez, S, Ferguson NM, Wachtel C, Tegnell A, Saour G, Duncan B, et al. Closure of schools during an influenza pandemic. Lancet Infect Dis. 2009;9(8): 473-81.
- McCaw JM, Wood JG, McBryde ES, Nolan TM, Wu JT, Lipsitch M, et al. Understanding Australia's influenza pandemic policy on the strategic use of the antiviral drug stockpile. Med J Aust. 2009;191(3):136-7.
- Pourbohloul B, Ahued A, Davoudi B, Meza R, Meyers LA, Skowronski DM, et al. Initial human transmission dynamics of the pandemic (H1N1) 2009 virus in North America. Influenza Other Respi Viruses. 2009;3(5):215-22.
- Yang Y, Sugimoto JD, Halloran ME, Basta NE, Chao DL, Matrajt L, et al. The transmissibility and control of pandemic influenza A (H1N1) virus. Science. 2009;326(5953):729-33.
- Nishiura H, Wilson N, Baker MG. Estimating the reproduction number of the novel influenza A virus (H1N1) in a southern hemisphere setting: preliminary estimate in New Zealand. N Z Med J. 2009;122(1299):73-7.
- Nishiura H. Castillo-Chavez C, Safan M, Chowell G. Transmission potential of the new influenza A(H1N1) virus and its age-specificity in Japan. Euro Surveill. 2009;14(22). pii: 19227. Available from: http://www.eurosurveillance.org/View...rticleId=19227
- Munayco CV, Gomez J, Laguna-Torres VA, Arrasco J, Kochel TJ, Fiestas V, et al. Epidemiological and transmissibility analysis of influenza A(H1N1)v in a southern hemisphere setting: Peru. Euro Surveill. 2009;14(32). pii: 19299. Available from: http://www.eurosurveillance.org/View...rticleId=19299
- McBryde E, Bergeri I, van Gemert C, Rotty J, Headley E, Simpson K, et al. Early transmission characteristics of influenza A(H1N1)v in Australia: Victorian state, 16 May - 3 June 2009. Euro Surveill. 2009;14(42). pii: 19363. Available from: http://www.eurosurveillance.org/View...rticleId=19363
- New Zealand Ministry of Health. New Zealand influenza pandemic action plan 2006. Wellington: New Zealand Ministry of Health; 2006. p. 17-22.
- New Zealand Ministry of Health. Case definitions for pandemic influenza H1N1 Wellington: New Zealand Ministry of Health; 2009. [Accessed 22 June 2009]. Available from: http://www.moh.govt.nz/moh.nsf/index...lthsector#case
- Wallinga, J, Teunis P. Different epidemic curves for severe acute respiratory syndrome reveal similar impacts of control measures. Am J Epidemiol. 2004;160(6): 509-16.
- Bettencourt LM, Ribeiro RM. Real time bayesian estimation of the epidemic potential of emerging infectious diseases. PLoS One. 2008;3(5):e2185.
- White LF, Pagano M. A likelihood-based method for real-time estimation of the serial interval and reproductive number of an epidemic. Stat Med, 2008;27(16):2999-3016.
- Lipsitch, M, Cohen T, Cooper B, Robins JM, Ma S, James L, et al. Transmission dynamics and control of severe acute respiratory syndrome. Science. 2003;300(5627):1966-70.
- Chowell G, Nishiura H, Bettencourt LM. Comparative estimation of the reproduction number for pandemic influenza from daily case notification data. J R Soc Interface. 2007;4(12):155-66.
- Kelly H, Mercer GN, Fielding JE, Dowse GK, Glass K, Carcione D et al. Pandemic (H1N1) 2009 influenza community transmission was established in one Australian state when the virus was first identified in North America. PLoS One. Forthcoming 2010.
- Ministry of Education. 2009 school terms and holidays. Wellington: Ministry of Education; 2009.
- Roberts MG, Baker M, Jennings LC, Sertsou G, Wilson N. A model for the spread and control of pandemic influenza in an isolated geographical region. J R Soc Interface. 2007;4(13):325-30.
- Bascand G. Visitors from Australia exceed 1 million. Wellington: Statistics New Zealand; 2009. [Accessed 1 October 2009]. Available from: http://www.stats.govt.nz/browse_for_...n_mrmay09.aspx
- Statistics New Zealand. International travel and migration: June 2009. Wellington: Statistics New Zealand; 2009. [Accessed 4 November 2009]. Available from: http://www.stats.govt.nz/browse_for_...hotpjun09.aspx
- Jennings LC. Influenza A(H1N1)09: another public health risk to New Zealand. N Z Med J. 2009;122(1298):11-6.
- Fielding J, Higgins N, Gregory J, Grant K, Catton M, Bergeri I, et al. Pandemic H1N1 influenza surveillance in Victoria, Australia, April - September, 2009. Euro Surveill. 2009;14(42). pii: 19368. Available from: http://www.eurosurveillance.org/View...rticleId=19368
- Hancock K, Veguilla V, Lu X, Zhong W, Butler EN, Sun H, et al. Cross-reactive antibody responses to the 2009 pandemic H1N1 influenza virus. N Engl J Med. 2009;361(20):1945-52.
-
-------